Forex analysis review |
- Fractal analysis of major currency pairs for June 24
- GBP/USD. June 23rd. Results of the week. The Brexit epic is just beginning
- EUR/USD. June 23rd. Results of the week. The euro has grown by 2 cents in tandem with the US dollar for the week.
- EURUSD bulls step in at the right moment
- Weekly analysis on Gold
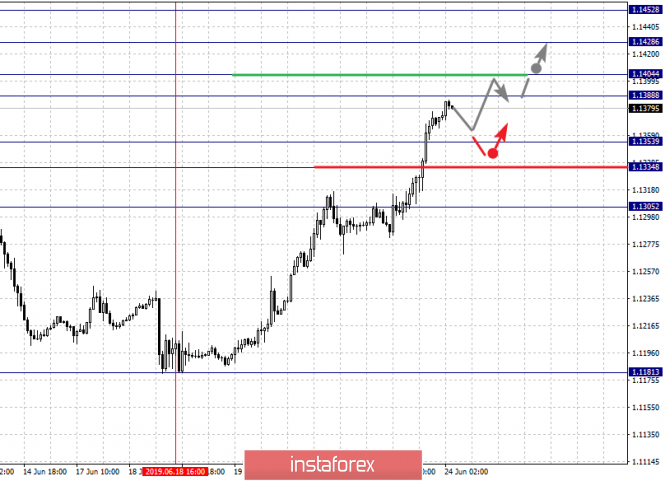
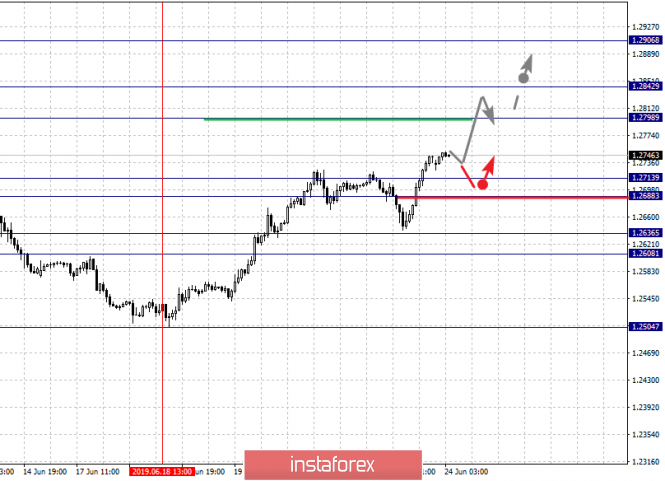
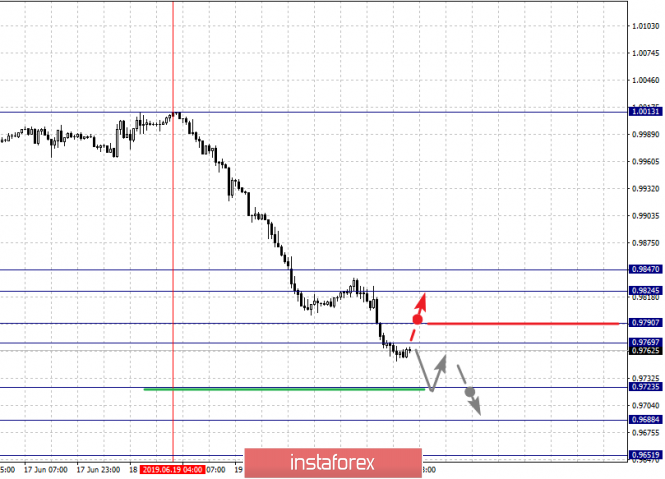
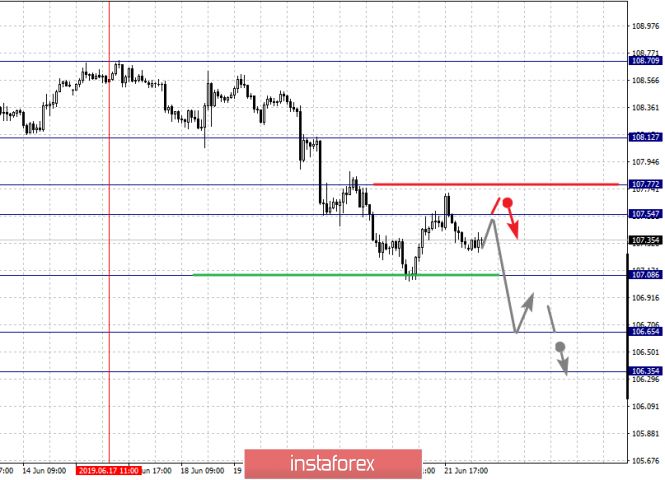
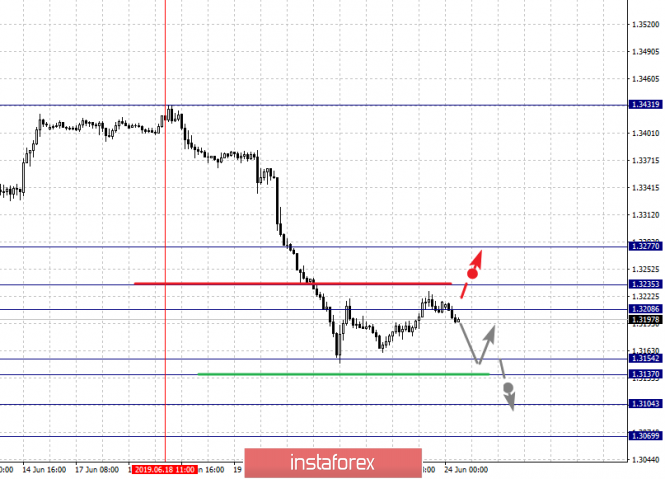
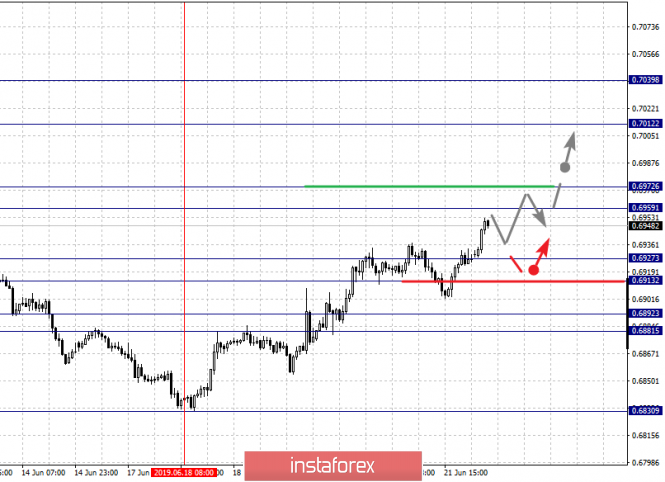
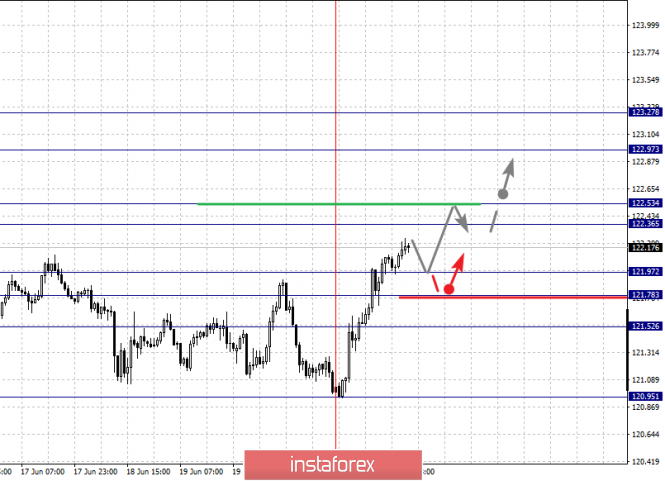
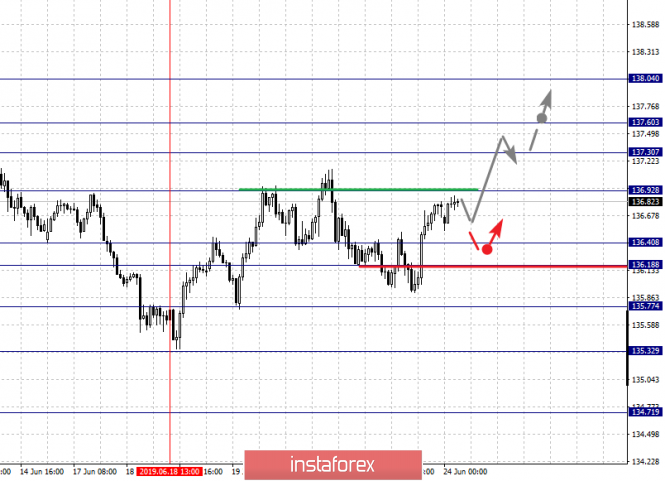
| Fractal analysis of major currency pairs for June 24 Posted: 23 Jun 2019 07:33 PM PDT Forecast for June 24: Analytical review of H1-scale currency pairs: For the euro / dollar pair, the key levels on the H1 scale are: 1.1452, 1.1428, 1.1404, 1.1388, 1.1353, 1.1334 and 1.1305. Here, we continue to follow the development of the ascending structure of June 18. The continuation of the movement to the top is expected after the passage of the price of the noise range 1.1388 - 1.1404. In this case, the target is 1.1428, wherein consolidation is near this level. For the potential value for the top, we consider the level of 1.1452. After reaching which, we expect a departure to the correction. Short-term downward movement is possible in the range of 1.1353 - 1.1334. The breakdown of the latter value will lead to in-depth correction. Here, the goal is 1.1305. This level is a key support for the top. The main trend is the ascending structure of June 18. Trading recommendations: Buy 1.1405 Take profit: 1.1428 Buy 1.1430 Take profit: 1.1452 Sell: 1.1353 Take profit: 1.1335 Sell: 1.1332 Take profit: 1.1305 For the pound / dollar pair, the key levels on the H1 scale are: 1.2906, 1.2842, 1.2798, 1.2713, 1.2688, 1.2636 and 1.2608. Here, we are following the development of the ascending structure of June 18. Short-term upward movement is expected in the range of 1.2798 - 1.2842. The breakdown of the last value will lead to the movement to the potential target - 1.2906. Upon reaching this level, we expect a rollback to the bottom. Short-term downward movement is expected in the range of 1.2713 - 1.2688. The breakdown of the last value will lead to a prolonged correction. Here, the target is 1.2636. The range of 1.2636 - 1.2608 is a key support for the top. The main trend is the ascending structure of June 18. Trading recommendations: Buy: 1.2798 Take profit: 1.2840 Buy: 1.2844 Take profit: 1.2904 Sell: 1.2713 Take profit: 1.2688 Sell: 1.2685 Take profit: 1.2636 For the dollar / franc pair, the key levels on the H1 scale are: 0.9847, 0.9824, 0.9790, 0.9769, 0.9723, 0.9688 and 0.9651. Here, we are following the development of the downward cycle of June 19th. The continuation of the movement to the bottom is expected after the breakdown of the level of 0.9723. In this case, the goal is 0.9688. From this range, there is a high probability of going into the correction zone. For the potential value for the bottom, we consider the level of 0.9651, but the movement to this value is considered as unstable. Short-term upward movement is possible in the range of 0.9769 - 0.9790. The breakdown of the latter value will lead to the development of a protracted correction. Here, the target is the level of 0.9824. The range 0.9824 - 0.9847 is a key support for the downward structure. The main trend is the downward cycle of June 19. Trading recommendations: Buy : 0.9769 Take profit: 0.9790 Buy : 0.9792 Take profit: 0.9824 Sell: 0.9723 Take profit: 0.9690 Sell: 0.9686 Take profit: 0.9653 For the dollar / yen pair, the key levels on the scale are : 108.12, 107.77, 107.54, 107.08, 106.65 and 106.35. Here, the downward structure of June 17 is considered as a medium-term initial conditions. The continuation of the movement to the bottom is expected after the breakdown of the level of 107.08. Here, the goal is 106.65. For the potential value for the bottom, we still consider the level of 106.35. After reaching which, we expect to go into a correction. Short-term upward movement is possible in the range of 107.54 - 107.77. The breakdown of the last value will lead to a prolonged correction. Here, the potential target is 108.12. This level is a key support for the downward structure. The main trend: the downward cycle of June 17. Trading recommendations: Buy: 107.55 Take profit: 107.76 Buy : 107.78 Take profit: 108.10 Sell: 107.05 Take profit: 106.65 Sell: 106.62 Take profit: 106.37 For the Canadian dollar / US dollar pair, the key levels on the H1 scale are: 1.3277, 1.3235, 1.3208, 1.3154, 1.3137, 1.3104 and 1.3069. Here, we are following the development of the downward structure of June 18. The continuation of the movement to the bottom is expected after the price passes the noise range 1.3154 - 1.3137. In this case, the target is 1.3104, wherein consolidation is near this level. For the potential value for the bottom, we consider the level of 1.3069. After reaching which, we expect a rollback to the top. Short-term upward movement is possible in the range of 1.3208 - 1.3235. The breakdown of the latter value will lead to a prolonged correction. Here, the target is 1.3277. This level is a key support for the downward structure. The main trend - the downward structure of June 18. Trading recommendations: Buy: 1.3208 Take profit: 1.3233 Buy : 1.3237 Take profit: 1.3275 Sell: 1.3137 Take profit: 1.3106 Sell: 1.3102 Take profit: 1.3070 For the pair Australian dollar / US dollar, the key levels on the H1 scale are : 0.7039, 0.7012, 0.6972, 0.6959, 0.6927, 0.6913, 0.6892 and 0.6881. Here, we are following the development of the ascending structure of June 18. The continuation of the movement to the top is expected after the price passes the noise range 0.6959 - 0.6972. In this case, the target is 0.7012, wherein consolidation is near this level. For the potential value for the top, we consider the level of 0.7039. After reaching which, we expect consolidation, as well as a rollback to the bottom. Short-term downward movement is possible in the range of 0.6927 - 0.6913. The breakdown of the last value will lead to a prolonged correction. Here, the target is 0.6892. The range of 0.6892 - 0.6881 is a key support for the top. The main trend is the upward structure on June 18. Trading recommendations: Buy: 0.6972 Take profit: 0.7012 Buy: 0.7014 Take profit: 0.7036 Sell : 0.6927 Take profit : 0.6914 Sell: 0.6910 Take profit: 0.6892 For the euro / yen pair, the key levels on the H1 scale are: 123.27, 122.97, 122.53, 122.36, 121.97, 121.78 and 121.52. Here, we are following the formation of the ascending structure of June 21. The continuation of the movement to the top is expected after passing by the price of the noise range 122.36 - 122.53. In this case, the goal is 122.97, wherein consolidation is near this level. For the potential value for the top, we consider the level of 123.27. After reaching which, we expect a rollback to the bottom. Short-term downward movement is expected in the range of 121.97 - 121.78. The breakdown of the last value will lead to a prolonged correction. Here, the goal is 121.52. This level is a key support for the upward structure. The main trend - the formation of potential for the top of June 21. Trading recommendations: Buy: 122.36 Take profit: 122.50 Buy: 122.56 Take profit: 122.95 Sell: 121.97 Take profit: 121.80 Sell: 121.76 Take profit: 121.52 For the pound / yen pair, the key levels on the H1 scale are : 138.04, 137.60, 137.30, 136.92, 136.40, 136.18, 135.77 and 135.32. Here, we continue to monitor the formation of the potential for the top of June 18. The continuation of the movement to the top is expected after the breakdown of the level of 136.92. In this case, the goal is 137.30. Short-term upward movement is in the range of 137.30 – 137.60, as well as consolidation. For the potential value for the top, we consider the level of 138.04. The movement to which, is expected after the breakdown of the level of 137.60. Consolidated movement is possible in the range of 136.40 - 136.18. The breakdown of the latter value will lead to a prolonged correction. Here, the goal is 135.77. This level is a key support for the top. Its price passage will count on movement towards the first goal for the downward movement - 135.32. The main trend - the formation of potential for the top of June 18. Trading recommendations: Buy: 136.92 Take profit: 137.30 Buy: 137.32 Take profit: 137.60 Sell: 136.18 Take profit: 135.85 Sell: 135.75 Take profit: 135.33 The material has been provided by InstaForex Company - www.instaforex.com |
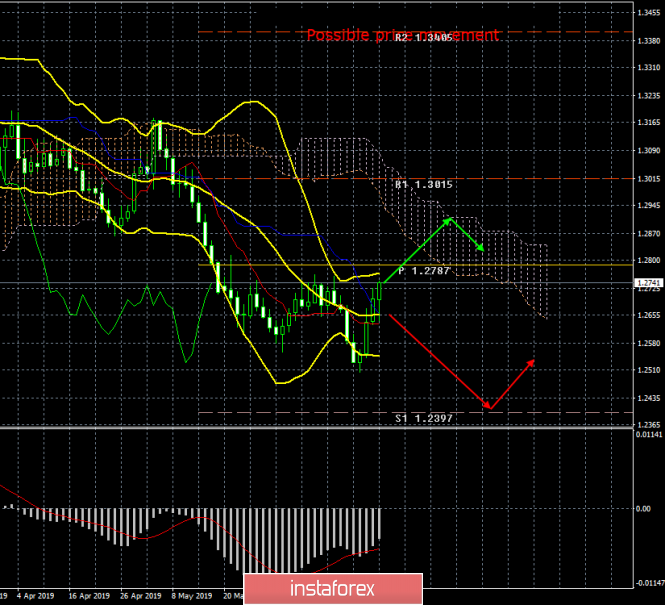
| GBP/USD. June 23rd. Results of the week. The Brexit epic is just beginning Posted: 23 Jun 2019 03:34 PM PDT 24-hour timeframe All the attention of traders last week was focused on the meetings of the central banks of the EU, the UK and the US. As a result of the disappointing macroeconomic data from the US in the last three weeks, Jerome Powell's "moderately dovish" rhetoric and the Bank of England's neutrality, which took a wait-and-see attitude, the pound sterling has then managed to rise by around two cents against the US dollar. But the time of important messages from central bank meetings is already in the past, and the foreign exchange market has a question: what is next? We believe that the British currency can be strengthened for some time and this growth can even be worked out, since there is a "golden cross" from Ichimoku on the 4-hour chart, but in the long-term, there are no chances for strong growth in the pound. At least a month is needed for the UK to elect a new prime minister, who will be either Jeremy Hunt or Boris Johnson. The exit of Great Britain from the EU is scheduled for October 31, 2019. This means that the new prime minister will have an entire three months for new negotiations with Brussels (if they will, of course, take place), for a new agreement to be formed, which then will still have to be approved by Parliament. We know how it all happens slowly. The second option is simpler - a "hard" Brexit, but at the same time having serious economic consequences. The British pound with this option can fall down at a terrible speed. In general, support from the UK pound sterling is unlikely to wait in the next month or two. This means there is only hope if further disappointing data from overseas continue to flow. If this is not the case, the bears can return to the market on the pound/dollar pair. Trading recommendations: On the 24-hour timeframe, the current upward movement can still be considered as a correction. The nearest target for the purchase of the pound sterling may be the upper limit of the Ichimoku cloud. Sales will again become relevant below the critical line with the aim of the first support level of 1,2397. In addition to the technical picture should also take into account the fundamental data and the time of their release. Explanation of the illustration: Ichimoku indicator: Tenkan-sen - the red line. Kijun-sen - the blue line. Senkou Span A - light brown dotted line. Senkou Span B - light purple dotted line. Chikou Span - green line. Bollinger Bands indicator: 3 yellow lines. MACD Indicator: Red line and histogram with white bars in the indicator window. The material has been provided by InstaForex Company - www.instaforex.com |
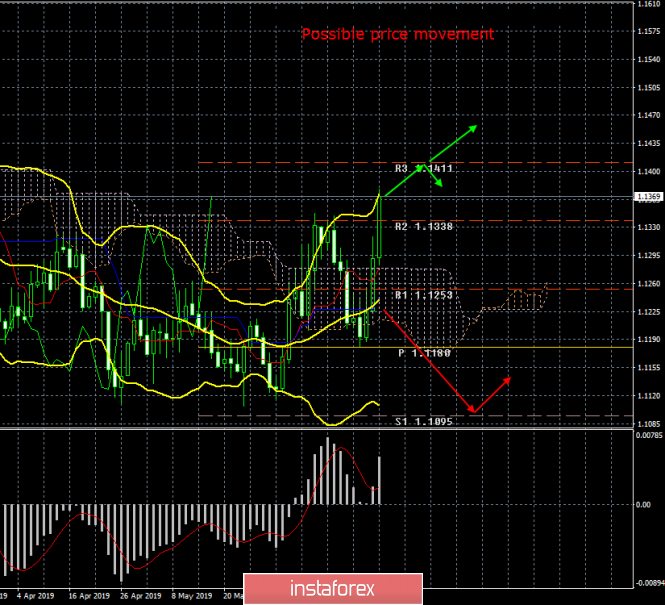
| Posted: 23 Jun 2019 03:34 PM PDT 24-hour timeframe The third trading week of June ended unequivocally in favor of the euro. By and large, this was the most important week of the month for the euro/dollar pair, since it was the time for speeches by Mario Draghi, Jerome Powell, and the ECB and Federal Reserve meeting. Unfortunately, in June, in the confrontation between the Fed and the ECB, the score was 1: 1. Both regulators made it clear to the foreign exchange market that, if necessary, they are ready to lower the key rate and begin to stimulate the economy. However, if the "unit" of the Fed is confident, then the "unit" of the ECB is very weak. Firstly, the current interest rate in America is 2.5% and the Fed has room to reduce it, while in Europe the rate is 0.0% and any reduction means a transition to the negative zone. Secondly, the QE program in the US has been completed for a long time and there is no reason to resume it, in Europe it is the other way around - the stimulus program has been completed relatively recently, and Draghi allows for the beginning of its new phase, as well as the launch of a long-term lending program for commercial banks. Thirdly, inflation rates in the US and the EU do not reach the target, but in the European Union inflation is about 1% y/y, and in America around 2% y/y. So it turns out that the euro is growing, since the last three weeks of data in the United States are absolutely disappointing, both regulators are ready for easing, but the overall economic situation remains much better in the United States, despite the trade war with China. In general, we believe that while the upward trend persists, as evidenced by technical indicators, traders should work it out and not try to guess the pivot point and the resumption of the downward movement. However, the US dollar, from a fundamental point of view, continues to look more convincing and attractive. Trading recommendations: The trend for the euro/dollar pair has changed to an upward one, however, from a fundamental point of view, the dollar can regain its leadership at any time. If reports in the United States will cease to disappoint, then the traders will be missing the reasons for selling the dollar. At the moment, the target for longs is the resistance level of 1.1411. In addition to the technical picture should also take into account the fundamental data and the time of their release. Explanation of the illustration: Ichimoku indicator: Tenkan-sen - the red line. Kijun-sen - the blue line. Senkou Span A - light brown dotted line. Senkou Span B - light purple dotted line. Chikou Span - green line. Bollinger Bands indicator: 3 yellow lines. MACD Indicator: Red line and histogram with white bars in the indicator window. The material has been provided by InstaForex Company - www.instaforex.com |
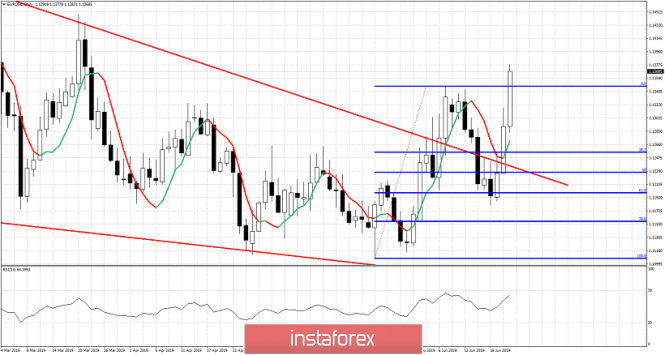
| EURUSD bulls step in at the right moment Posted: 23 Jun 2019 06:13 AM PDT In our last analysis we noted that EURUSD bulls needed to act immediately as price was testing the 61.8% Fibonacci retracement of the rise from 1.1107 to 1.1347. Bulls needed to see price reverse immediately in order to have hopes for more upside. The end of the week found EURUSD at new highs confirming major reversal under way.
EURUSD is once again above the wedge pattern and has reversed its short-term trend right at the important 61.8% Fibonacci support level. Price also made a new higher high confirming our longer-term bullish view since it initially broke above the wedge pattern. EURUSD is expected to move towards 1.17 over the coming weeks and as long as price is above 1.12 bulls will remain in full control of the trend. The material has been provided by InstaForex Company - www.instaforex.com |
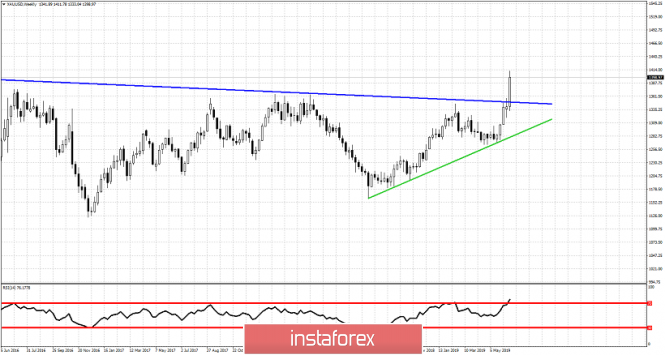
| Posted: 23 Jun 2019 06:09 AM PDT Gold price last week verified the importance of the $1,350-60. As we noted at our previous posts, getting rejected twice at $1,350-60 was a bearish sign, but at the same time this price action confirmed the importance of the resistance at $1,350-60 and a break out above it would be an important bullish sign.
Green line - major support trend line Gold price has broken above the blue trend line resistance at $1,350-60 and has reached within two days at the $1,400 level. This is an important break out event. Gold bulls are in full control of the trend as long as price is above the blue weekly trend line resistance that was broken. This is now support. Even if we see a pull back towards $1,350 it would be considered as a buying opportunity. Bulls do not want to see the green trend line broken. On the other hand bears took a good beating last week. This break out needs a lot of work to be canceled. There are very slim hopes of this happening in my opinion. Gold price has a confirmed that it has started a new multi-week up trend. The material has been provided by InstaForex Company - www.instaforex.com |
| You are subscribed to email updates from Forex analysis review. To stop receiving these emails, you may unsubscribe now. | Email delivery powered by Google |
| Google, 1600 Amphitheatre Parkway, Mountain View, CA 94043, United States | |

No comments:
Post a Comment