
Forex analysis review |
- GBP/USD approaching resistance, potential drop!
- AUD/USD approaching resistance, potential reversal!
- EUR/JPY reversed off key resistance, a drop is possible!
- The Swiss franc has updated its two-year maximum against the Euro
- EUR / USD: The dollar is preparing to reduce the rate of the Fed, the euro in anticipation of inflation data
- Technical analysis of EURUSD for June 4, 2019
- Technical analysis of Gold for June 4, 2019
- June 3, 2019 : EUR/USD Intraday technical analysis and trade recommendations.
- June 3, 2019 : GBP/USD Intraday technical analysis and trade recommendations.
- It looks like a trade war will take a long time, so markets should get ready for a new collapse
- Technical analysis of USD/CHF for June 03, 2019
- Technical analysis of USD/CAD for June 03, 2019
- EUR and GBP: Eurozone and UK manufacturing activity declines
- GBP/USD: plan for the US session on June 3. Buyers of the pound did not have enough strength to hold 1.2620
- EUR/USD: plan for the US session on June 3. Morning support 1.1163 worked, now it's 1.1189
- Yen got dope from the White House
- Weekly review of EUR/USD and GBP/USD pairs from 06/03/2019: Only the Middle Kingdom can stop the dollar
- Analysis of Gold for June 03,.2019
- GBP/USD analysis for June 03,.2019
- Bitcoin analysis for June, 03.2019
- Wave analysis of EUR/USD and GBP/USD for June 3. European currencies show signs of life
- USA and China: Competition on who blinks first (EURUSD pair - trading in the range, high probability of local recovery of
- BITCOIN struggling between $8,400 and $8,500 to lead to more drops? June 3, 2019
- Simplified wave analysis and forecast for EUR/USD, GBP/USD and USD/JPY on June 3
- Trading recommendations for the GBPUSD currency pair - placement of trading orders (June 3)
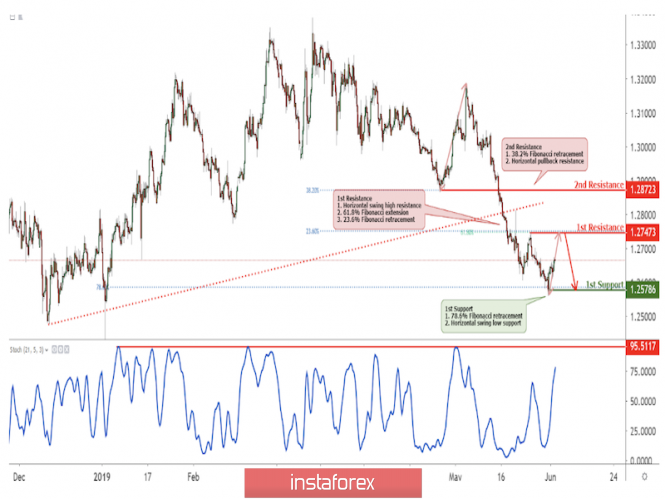
| GBP/USD approaching resistance, potential drop! Posted: 03 Jun 2019 07:11 PM PDT
Price is approaching our first resistance level where we might see a corresponding drop. Entry : 1.2747 Why it's good : Horizontal swing high resistance, 23.6% Fibonacci retracement, 61.8% Fibonacci extension Stop Loss : 1.2872 Why it's good : Horizontal pullback resistance, 38.2% Fibonacci retracement Take Profit : 1.2578 Why it's good : 78.6% Fibonacci retracement, horizontal swing low support
|
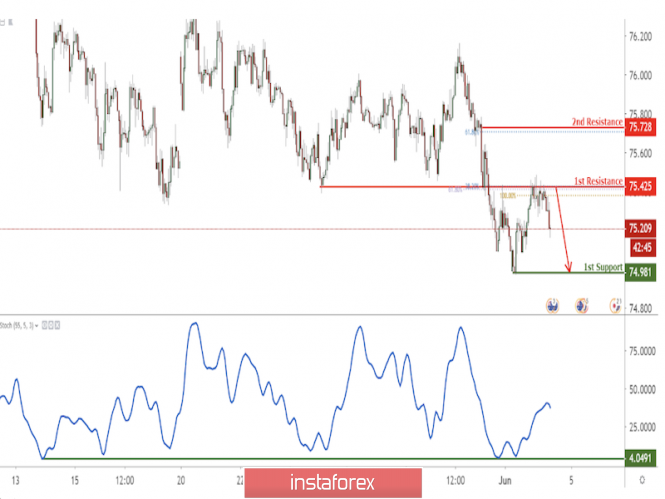
| AUD/USD approaching resistance, potential reversal! Posted: 03 Jun 2019 07:08 PM PDT
Price reversed off from its resistance where it is expected to fall further to its support. We are expected some AUD weakness later today due to a possible RBA rate cut. Entry : 75.42 Why it's good : 38.2% Fibonacci retracement, 100% & 61.8% Fibonacci extension, horizontal pullback resistance Stop Loss : 75.72 Why it's good : 61.8% Fibonacci retracement Take Profit : 74.98 Why it's good : Horizontal swing low support
|
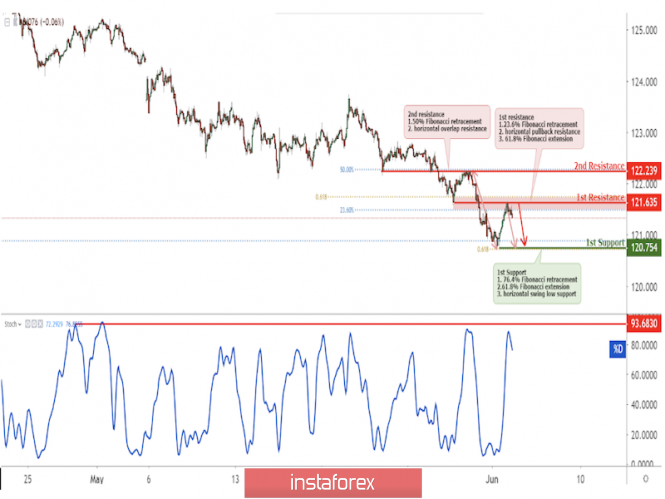
| EUR/JPY reversed off key resistance, a drop is possible! Posted: 03 Jun 2019 07:06 PM PDT
EURJPY reversed off key resistance, a drop to first support is possible Entry: 121.64 Why it's good : 61.8% Fibonacci extension, 23.6% Fibonacci retracement, horizontal pullback resistance Stop Loss : 122.24 Why it's good :50% Fibonacci retracement, horizontal overlap resistance Take Profit : 120.75 Why it's good: 76.4% Fibonacci retracement, 61.8% Fibonacci extension, horizontal swing low support
|
| The Swiss franc has updated its two-year maximum against the Euro Posted: 03 Jun 2019 05:07 PM PDT The Swiss franc rose to its highest level in the last two years against the euro. The position of US President Donald Trump with respect to China prompted investors to switch to safe currencies, while the Swiss Central Bank may not yield to pressure and will not start selling francs for the euro. Trading tensions caught all investors' attention after Trump raised Chinese import tariffs, threatened to raise Mexican tariffs and canceled preferential trade regime for India. These actions force investors to dump risky assets and switch to low-yielding currencies, such as the yen and the franc, which causes them to rise in value. In relation to the euro, the franc rose by more than half a percent - to 1.1120 francs per euro, which is the highest level since July 2017. Taking into account the May jump, when the franc rose by more than 2% against the euro, the franc shows excellent results. The Swiss national bank, which uses negative interest rates and currency intervention, traditionally intervened when the franc rose to about 1.10 francs per euro. However, low inflation and trade tensions indicate that the franc will go much higher than current levels. The franc was not the only low-yielding currency that could rise in price even more, the Japanese yen also rose significantly and, apparently, the exchange rate would rise. The material has been provided by InstaForex Company - www.instaforex.com |
| Posted: 03 Jun 2019 04:53 PM PDT The US currency is under strong pressure from a negative fundamental background. The dollar index tested an annual maximum in the region of 98 points on Friday. But today, it is just as confidently heading towards the base of the 97th figure. To some extent, the weakness of the greenback is reflected in the dynamics of all dollar pairs, including EUR/USD. Buyers "starve out" take the 12th figure, although each item is given to them with great difficulty. Nevertheless, bulls of the pair were able to push the price away from the key support level of 1.1105, protecting themselves from falling into the area of the 10th figure. By and large, the price of the pair returns to the usual "flat" range of 1.1210-1.1340, within which it has fluctuated throughout most of May. On the other hand, the market is now too wound up and subject to strong price fluctuations. Therefore, eur / usd is unlikely to hang in the specified corridor. The events of Tuesday in this context will play an important role: first, we will learn data on the growth of European inflation, and secondly, we will listen to Fed Chairman Jerome Powell, who will speak at the economic conference organized by the Chicago Fed. It is worth noting that at the end of last week, the dollar was falling due to general panic in the market. The protracted trade conflict with China, the new duties on Mexico, and now, the White House's claims on India make American investors nervous. For the first time in a long time, the dollar was not used by the market as a defensive asset: the dynamics of the debt market dragged greenback behind them, reducing the attractiveness of the American currency. Today, the concern of traders has become more "tangible" form. The market has been actively discussed rumors that the Fed will reduce the interest rate in the near future. The probability of a rate cut at the July meeting increased to 55%, whereas a week ago it was no more than 15-18%. Moreover, some analysts are confident that the Fed will not stop at what has been achieved, and will return to this issue again by the end of the year. By some estimates, this scenario is implemented with a probability of 70%. Today's macroeconomic reports, which came from the USA, also added fuel to the fire. In particular, the production ISM fell to a mark of 52.1 points - this is the weakest indicator growth rate since October 2016 (according to forecasts, it should have risen to 53 points). Here, it is worth considering that it does not take into account the fact of the introduction of duties on imports from Mexico. Thus, the figure may show a weaker trend next month, unless Mexico City and Washington come to a compromise. However, the conflict with Mexico in this case plays a secondary role: the focus of attention is the trade war with China, which is heating up with a new force. In particular, the Chinese authorities are now conducting an investigation into the largest US postal company in the world, FedEx. The initiator of the investigation was the notorious Huawei, which accused Americans of violating the rules of the industry. Chinese journalists have learned the essence of the claims: FedEx allegedly sent two parcels of important commercial documents from Japan to Shanghai through the United States. Similar actions by the American postmen were allegedly taken in respect of two more shipments from Vietnam to Huawei offices in Hong Kong and Singapore. If the official Beijing confirms Huawei charges, the largest postal company in the world will get to the People's Republic of China on the "black list" of unreliable organizations. This incident once again confirms the fact that the trade war is still gaining momentum, and the parties are far from constructive dialogue. The situations with Huawei and FedEx only complement the overall fundamental picture, while the strongest steps on the part of China (in particular, in restricting or banning the export of rare earth metals) are still ahead. Thus, the US trade conflicts are now "played with new colors" in the eyes of investors: an increase in geopolitical tensions is associated with an increase in the likelihood of the Fed lowering interest rates. And if Jerome Powell on Tuesday at least indirectly confirms such intentions, the dollar will strengthen its fall. But the single currency on Tuesday may receive support from European inflation. According to the general forecast, the consumer price index in the eurozone in May will weaken to 1.4% (from the previous value of 1.7%). Core inflation should also show a negative trend, returning to the 1% mark after rising in April to 1.3%. But, according to a number of currency strategists, inflation may still be a surprise, being better than pessimistic expectations. At the same time, they refer to the dynamics of the oil market (in April) and consumer activity in the key countries of the eurozone. If inflation data turns out to be in the "green zone" tomorrow, the euro will receive substantial support, especially in contrast to American problems. In terms of technology, bulls of the EUR/USD pair need to overcome at least the mark of 1.1240 (the upper line of the Bollinger Bands indicator on the daily chart, which is in the Kumo cloud) to confirm the strength of the northern movement. When overcoming the mark of 1.1280 (the upper boundary of the Kumo cloud on the same timeframe), the Ichimoku trend indicator will form a bull signal "Parade of lines", opening the way to the area of the 13th figure. It is not yet advisable to speak of further heights, given the impulsive growth pattern of the EUR/USD. The material has been provided by InstaForex Company - www.instaforex.com |
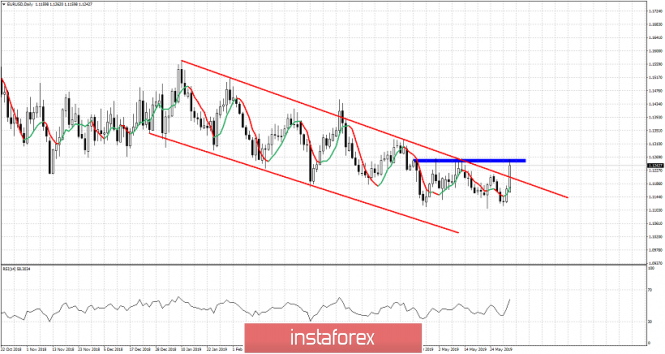
| Technical analysis of EURUSD for June 4, 2019 Posted: 03 Jun 2019 01:39 PM PDT EURUSD is breaking higher after making an important low at 1.1115. EURUSD is breaking out of the medium-term bearish channel its been in since December of 2018. EURUSD is challenging important resistance at 1.1260 and this is the final obstacle before confirming major trend reversal.
Blue rectangle -major horizontal resistance EURUSD is making higher highs and higher lows after a long time. Price is also breaking above the red bearish channel and is challenging the horizontal resistance at 1.1260. In most of our previous posts we noted the importance of the resistance at 1.12-1.1230 and that a break above it could signal a bigger trend reversal. We also noted several times that bullish divergence warning signs were evident in the Daily charts and that EURUSD bears should be very cautious. EURUSD has made an important low at the 61.8% Fibonacci retracement of the entire rise from 1.03 to 1.255. There are many chances a new leg higher starts from these lows. The material has been provided by InstaForex Company - www.instaforex.com |
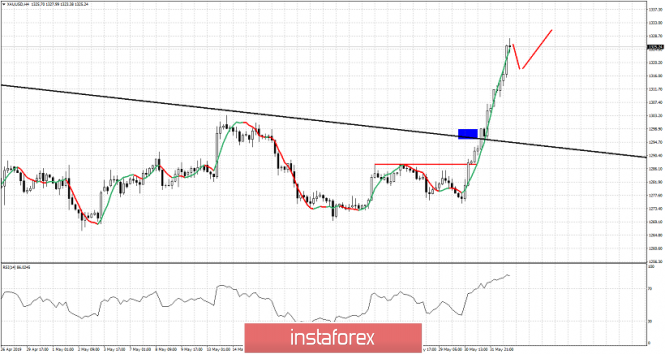
| Technical analysis of Gold for June 4, 2019 Posted: 03 Jun 2019 01:31 PM PDT Gold price has broken above the critical resistance area of $1,290-$1,300 and has not looked back. Anyone standing in its way has been hit hard. Gold price is rising vertically. The signs were there and the confirmation also.
Red rectangle - short-term resistance Blue rectangle - bounce target and resistance area Black line - major resistance trend line Red lines -expected path ahead Gold price is trading above $1,320 while a couple sessions ago it was still below $1,300. Gold price has broken each resistance level found in its way and even the major resistance level at $1,300. Gold since then has not looked back and continues to rise towards February highs. Gold bulls now focus on the major long-term resistance at $1,350-60 area. Breaking above it would be a very important bullish signal. Rejection at $1,350-60 could mean reversal back to $1,300 or lower. For now bulls seem in control of the trend and ready to challenge $1,350. The material has been provided by InstaForex Company - www.instaforex.com |
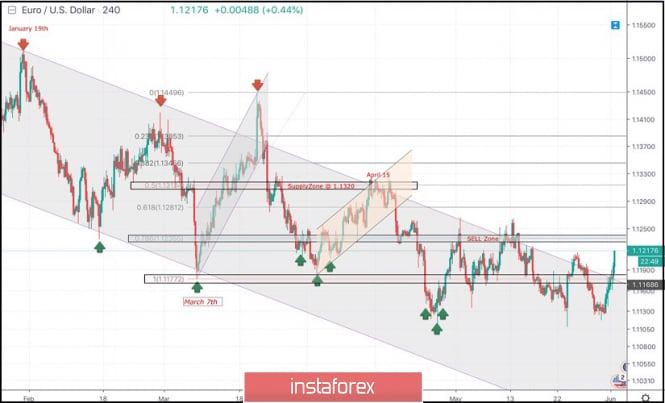
| June 3, 2019 : EUR/USD Intraday technical analysis and trade recommendations. Posted: 03 Jun 2019 09:48 AM PDT
Since January 19th, the EURUSD pair has been moving within the depicted channel with slight bearish tendency. Few weeks ago, a bullish Head and Shoulders reversal pattern was demonstrated around 1.1200 allowing further bullish advancement to occur towards 1.1300-1.1315 (supply zone) where significant bearish rejection was demonstrated on April 15. For Intraday traders, the price zone around 1.1235 (78.6% Fibonacci) stood as a temporary demand area which paused the ongoing bearish momentum for a while before bearish breakdown could be executed on April 23. Short-term outlook turned to become bearish towards 1.1175 (a previous weekly bottom which has been holding prices above for a while) On May 17-20, a bearish breakdown below 1.1175 was temporarily achieved. As expected, further bearish decline was expected towards 1.1115. This is where significant bullish recovery was demonstrated bringing the EURUSD pair back above 1.1175. Recently, The EURUSD pair has been trapped between the highlighted price levels (1.1175-1.1235) until last week on Tuesday when another bearish breakdown was demonstrated below 1.1175. This enhanced the bearish side of the market towards 1.1120 where the current bullish movement was initiated. Further bullish advancement is expected towards 1.1235 where price action should be watched cautiously. Bullish breakout above 1.1234 is mandatory to enhance further bullish advancement towards 1.1290 and 1.1320. Otherwise, the EURUSD pair would remain trapped between the same price levels (1.1175-1.1235). The material has been provided by InstaForex Company - www.instaforex.com |
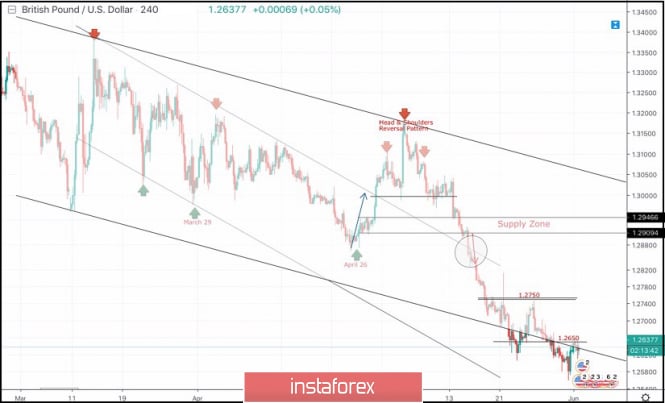
| June 3, 2019 : GBP/USD Intraday technical analysis and trade recommendations. Posted: 03 Jun 2019 07:57 AM PDT
On March 29, a visit towards the price levels of 1.2980 (the lower limit of the newly-established bearish movement channel) could bring the GBPUSD pair again towards the upper limit of the minor bearish channel around (1.3160-1.3180). Since then, Short-term outlook has turned into bearish with intermediate-term bearish targets projected towards 1.2900 and 1.2850. On April 26, another bullish pullback was initiated towards 1.3000 (the same bottom of March 29) which has been breached to the upside until May 13 when a bearish Head and Shoulders pattern was demonstrated on the H4 chart with neckline located around 1.2980-1.3020. Bearish persistence below 1.2980 enhanced further bearish decline. Initial bearish Targets were already reached around 1.2900-1.2870 (the backside of the broken channel) which failed to provide any bullish support for the GBPUSD pair. Further bearish decline was demonstrated towards the lower limit of the long-term channel around (1.2700-1.2650). The GBPUSD pair looks oversold around the current price levels (1.2650-1.2600). That's why, SELL signals shouldn't be considered at such low prices. On the other hand, bullish persistence above 1.2650 and 1.2750 is needed to enhance the bullish side of the market towards 1.2870 (Bottom of April 26). Trade Recommendations: Counter-trend traders can wait for a bullish breakout above 1.2650 as a valid BUY signal. T/P level to be located around 1.2750 and 1.2820. S/L to be located below 1.2600. Conservative traders should wait for another bullish pullback towards 1.2870-1.2905 (newly-established supply zone) to look for valid sell entries. S/L should be placed above 1.2950. The material has been provided by InstaForex Company - www.instaforex.com |
| It looks like a trade war will take a long time, so markets should get ready for a new collapse Posted: 03 Jun 2019 07:19 AM PDT The heightened fear that the aggressive US trade policy will lead to a sharp slowdown in the growth of the global economy has a negative effect on investor sentiment around the world. "The likelihood that the United States will introduce new duties or take regular measures to restrict trade with other countries. The trading practices of which they find unfair increases. Not only China and Mexico but also India and even Japan can become Washington's next targets," said by the chief economist of Japan Oil, Gas and Metals National Corp, Takayuki Nogami. "Optimism about the resumption of global growth led by China in the first months of the year was a mistake," said Morgan Stanley strategist, James Lord. According to some estimates, the capitalization of the world's stock markets collapsed by almost $5 trillion last month. Markets showed the worst result for May since 2010, when the US exchanges experienced a 10 percent crash, which went down in history as a "flash crash". "The conclusion of a Washington and Beijing trade deal seems unlikely in the near future, and in the short term, the risk of a fall in the S & P 500 index is increasing because the market has not really dropped," said by RBC Capital Markets, Lori Kalvasina. "If an agreement is not reached, then only the Fed will be able to save the situation by easing the monetary rate," experts of Merian Global Investors believe. Apparently, the regulator is faced with a rather difficult task: on the one hand, it is necessary to demonstrate independence, and on the other hand, one cannot subordinate his policy to market fluctuations in the stock market. It is possible that the Central Bank will adhere to a patient approach to the last. Meanwhile, the market for futures on the Fed rate is already laying in the quotes three declines in September, December 2019 and March next year. It should be recognized that the tightening of the trade war is caused by objective reasons, such as imbalances accumulated over the decades in global trade and in the global debt market. It is assumed that the situation will continue to deteriorate in general. The agreements that have already been reached will be called into question and as a result, new disputes will arise. As the trade war becomes a reality for the long term, now it makes sense to pay attention to assets with universal demand or weak dependence on US-China duties. In particular, strategists at investment bank JP Morgan Chase recommend increasing long positions in the yen, which acts as a defensive asset and allows you to hedge against the global economic downturn. In addition to the yen, they advise them to choose the Swiss franc as a safe haven currency. According to the bank's experts, the franc demonstrates better dynamics than the yen. The statistical probability of its strengthening at this moment is higher in the face of a weakening of the monetary policy of the Fed. The "defensive" currency portfolio recommended by JP Morgan Chase strategists implies not only selling the dollar against the yen, but also short positions in EUR/JPY, GBP/JPY and EUR/USD pairs. The material has been provided by InstaForex Company - www.instaforex.com |
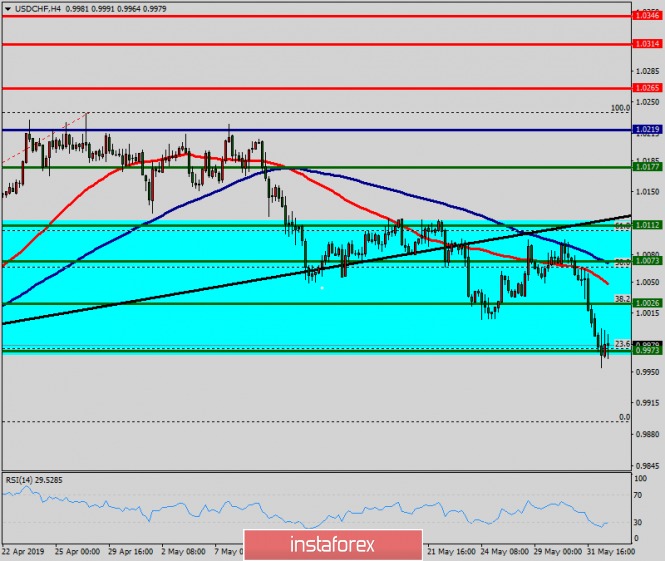
| Technical analysis of USD/CHF for June 03, 2019 Posted: 03 Jun 2019 07:13 AM PDT |
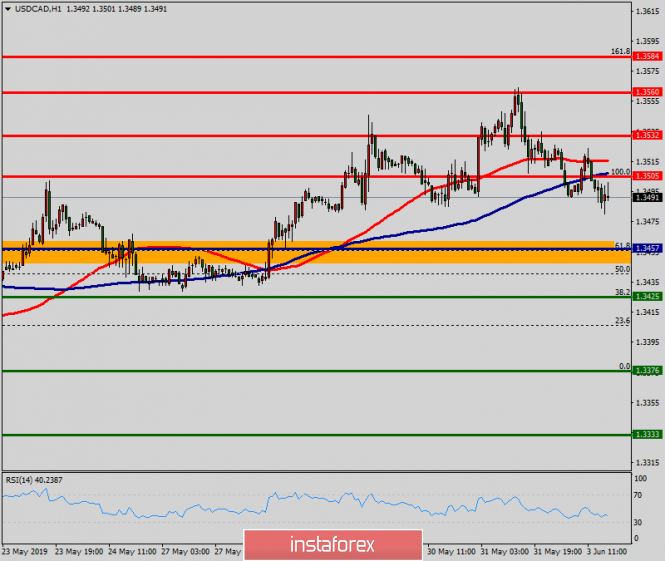
| Technical analysis of USD/CAD for June 03, 2019 Posted: 03 Jun 2019 07:10 AM PDT The USD/CAD pair continues to move upwards from the level of 1.3457. The pair rose from the level of 1.3457 (the level of 1.3457 coincides with a ratio of 61.8% Fibonacci retracement) to a top around 1.3505. But it rebounded from the top pf 1.3505 to 1.3477. Today, the first support level is seen at 1.3457 followed by 1.3425, while daily resistance 1 is seen at 1.3457. According to the previous events, the USD/CAD pair is still moving between the levels of 1.3505 and 1.3457; for that we expect a range of 48 pips (1.3505 - 1.3457). On the one-hour chart, immediate resistance is seen at 1.3505. Currently, the price is moving in a bullish channel. This is confirmed by the RSI indicator signaling that we are still in a bullish trending market. The price is still above the moving average (100), Therefore, if the trend is able to break out through the first resistance level of 1.3505, we should see the pair climbing towards the daily resistance at the levels of 1.3532 and 1.3560. It would also be wise to consider where to place stop loss; this should be set below the second support of 1.3425. The material has been provided by InstaForex Company - www.instaforex.com |
| EUR and GBP: Eurozone and UK manufacturing activity declines Posted: 03 Jun 2019 06:49 AM PDT Weak data on activity in the manufacturing sector, especially in Germany, put pressure on the euro in the morning. However, given the fact that most traders did not expect significant changes in this sector due to the aggravation of trade wars, the pressure on the euro did not last long. After that, new buyers returned to the market, who continued to buy risky assets, betting on their further strengthening due to the weakness of the US dollar and the sharp growth of the gold market. According to Markit, the purchasing managers' index (PMI) for the manufacturing sector in Italy in May of this year rose slightly and amounted to 49.7 points, while in April the index was at the level of 49.1 points. Economists had expected the buyer to drop to 48.5 points. In Germany, the picture became even worse against the background of problems with a sharp drop in exports. According to the report, the purchasing managers' index (PMI) for the German manufacturing sector fell to 44.3 points in May, when it was 44.4 points in April. The data completely coincided with the forecasts of economists. Along with the weak and declining growth rates of the German economy, the situation will only worsen in the 2nd quarter of this year. The only country where the purchasing managers' index (PMI) for the manufacturing sector showed growth was France. According to the Markit report in May, the index rose to 50.6 points, while in April it was on the border of 50 points. The data completely coincided with the forecasts of economists. As a result, as mentioned above, the report on the total figure for the eurozone did not surprise traders. According to the data, the purchasing managers' index (PMI) for the manufacturing sector of the eurozone in May 2019 fell even more and amounted to 47.7 points. Let me remind you that finding the index below 50 points indicates a decrease in activity. In April of this year, the eurozone manufacturing PMI was 47.9 points. As for the technical picture of the EURUSD pair, the market returned to the side of buyers. Now, to maintain bullish growth of risky assets, a breakthrough and consolidation above the resistance of 1.1190 are required, which will lead the trading instrument to new highs in the area of 1.1240 and 1.1295. Today, the growth of the British pound was limited by a weak report on activity in the UK manufacturing sector, which in May this year slowed sharply. The whole problem is the uncertainty of the timing and order of the UK's exit from the European Union. According to IHS Markit, the indicator of activity in the UK manufacturing sector in May this year fell to 49.4 points from 53.1 points in April, which is a very bad sign for the economy. Economists had forecast a much less dramatic decline. Many experts note that the decline in activity will continue, as foreign customers are less willing to place new orders. The material has been provided by InstaForex Company - www.instaforex.com |
| Posted: 03 Jun 2019 06:17 AM PDT To open long positions on GBP/USD, you need: Despite the rebound in the first half of the day from the support level of 1.2623, which I paid attention to in my review, there was no larger upward correction of the pound. At the moment, the bears managed to push the support of 1.2623, and to count on the purchase of GBP/USD is best after the correction to the area of 1.2595, and even better from the low of last week in the area of 1.2559. The main task of the bulls will be to close the day above the level of 1.2623, which will retain the upward potential and allow to expect an update of the maximum of 1.2686. To open short positions on GBP/USD, you need: As in the first half of the day, the bears need to return and consolidate under Friday's level of 1.2623, which will gradually return sellers to the market and will update the minimum of last month in the area of 1.2559, where I recommend fixing the profits. In the scenario of further upward correction, the demand for the pound will gradually slow down when approaching the maximum of 1.2686, where you can open short positions immediately on the rebound. Any negative news related to Brexit will scare off potential buyers and lead to the resumption of the bearish trend. Indicator signals: Moving Averages Trading is conducted in the area of 30 and 50 moving averages, which indicates market uncertainty and the struggle for the trend. Bollinger Bands The pound in the second half of the day will be limited to the upper border of the indicator in the area of 1.2660. Description of indicators
|
| EUR/USD: plan for the US session on June 3. Morning support 1.1163 worked, now it's 1.1189 Posted: 03 Jun 2019 06:16 AM PDT To open long positions on EURUSD, you need: Buyers managed to form a false breakdown in the support area of 1.1163 and continued the growth of the euro, which I drew attention to in my morning review. At the moment, the task for the second half of the day is to consolidate above the resistance of 1.1189, which will keep the upward trend in the area of highs 1.1215 and 1.1243, where I recommend fixing the profit. In the case of a pair decline, after the release of data on production activity in the US, it is best to return to long positions on the rebound from the low of 1.1138, since the level of 1.1163 will probably be broken on the second attempt. To open short positions on EURUSD, you need: Weak reports on production activity in the euro area have become a catalyst for opening long positions in the euro after a small downward correction. At the moment, to return to the market of major players, bears need a breakthrough and consolidation below the support of 1.1163, which will lead to an update of the minimum of 1.1138, where I recommend fixing the profits. In the scenario of further growth of the euro, only a good report on the index of production activity in the US will allow counting on sales from the level of 1.1215, otherwise, it is best to open short positions on the rebound from the maximum of 1.1243. Indicator signals: Moving Averages Trading is conducted above 30 and 50 moving averages, which indicates the formation of a correction in the market. Bollinger Bands In case of a decline in the euro in the second half of the day, the support will be provided by the lower limit of the indicator around 1.1163. Description of indicators
|
| Yen got dope from the White House Posted: 03 Jun 2019 06:07 AM PDT The fall in the US yield curve to its lowest point since 2007, as well as the increased likelihood of a weakening of the Fed's monetary policy in 2019 to 95%, have become catalysts for the demand for safe-haven assets. The rates on 10-year US Treasury bonds were confidently moving down, and investors are almost sure that they will return to the zone of 1.5-2%, where they stayed in 2016. The Japanese yen at the final auction of spring marked a 1.2% rally against the dollar, which is the best daily dynamics over the past couple of years. Unless, of course, do not take into account the January flash accident. The initiator of the next surge of interest in safe-haven assets was Donald Trump, who announced the introduction of tariffs of 5% for all Mexican imports if Mexico City does not stop the flow of illegal migrants to the States. Fees can rise to 25%, which is fraught with disruption of supply chains, deterioration of business activity and recession. The inversion of the yield curve says the same thing and the derivatives market is already laying the expectations for two or three cuts in the federal funds rate in 2019. The dynamics of the estimated value of the Fed rate The yen is responsive to both the fall in the yield of 10-year Treasury bonds to its lowest level since 2017 and the growth in the likelihood of the Fed's monetary expansion. For the first time since 1990, the Bank of Japan did not follow the steps of the Federal Reserve and did not tighten monetary policy, which is a bullish factor for the USD/JPY pair. Nevertheless, it has already been won back and the falling chances of maintaining the federal funds rate at the level of 2.5% to 5% inspire the bears in the analyzed pair to attack. According to research by Morgan Stanley, the US economy will not sustain and plunge into recession if the States impose duties on all Chinese imports, after 9 months. Oxford Economics believes that the same (recession) will turn the duty on the supply of goods from Mexico to US markets. Ultimately, if the White House gives out tariffs to the left and to the right, then why not fortify reliable assets? If business activity in various sectors of the US economy in May falls below the critical level of 50, the USD/JPY pair runs the risk of continuing the downward hike towards 105. Along with the release of purchasing managers' indices in the week to June 7, investors should pay attention to the release of statistics on the US labor market and the ECB meeting. The theoretically generous LTRO (the Governing Board promised to announce the details of the banks' long-term refinancing program in June) and impressive growth in employment outside the agricultural sector in the United States is able to return interest to risky assets. The S&P 500 that sank by 6.6% in May (the worst stock index dynamics since December) can lick some of the wounds, which will have a negative effect on the USD/JPY bears. However, there is another option, which is non-farm payrolls to much worse than expected and the USD/JPY pair continues to swoop down into the abyss. Technically, the quotes of the pair at arm's length approached the convergence zone identified by means of targets by 88.6% and 161.8% in the patterns "Shark" and AB = CD. Rebounding from important support will enhance the risks of a correction in the direction of 23.6%, 38.2% and 50% of the "Shark" wave CD. USD / JPY daily graph |
| Posted: 03 Jun 2019 06:07 AM PDT To some extent, the continuing strengthening of the dollar looks somewhat illogical and strange. After all, the second estimate of United States GDP in the first quarter was slightly worse than the first. Yes, the American economy continues to accelerate to 3.1% instead from 3.0% to 3.2%. The fact is that investors have already laid the acceleration of economic growth just up to 3.2% in the value of the dollar. Hence, they had to revise their plans and for the worse, another bad news was the data on unfinished housing sales. The number of which decreased by 1.5% but what is more important is that this is monthly data. In annual terms, the number of pending transactions is reduced by as much as 2.0%. True, it was not without good news especially with regard to applications for unemployment benefits. The total number of which decreased by 22 thousand. Of course, the number of initial applications increased by 4 thousand but the number of repeat ones decreased by 26 thousand. Also, personal income and expenses increased by 0.5% and 0.3% and outpacing the growth of income did not scare anyone. As in the previous month, income and expenses increased by 0.1% and 1.1%. After such rapid growth in personal spending, it is quite obvious that revenues should grow somewhat stronger. Thus, it turns out that American statistics were generally neutral. But European statistics cannot be called weak either. Moreover, there were very few macroeconomic data in the Old World. Thus, the growth rate of consumer lending in the euro area accelerated from 3.2% to 3.4%. Lending in the UK is also doing well, as net consumer lending increased from 4.7 billion pounds to 5.2 billion pounds. Also, the number of approved mortgage applications increased from 62,559 to 66,261. Thus, if you look at the statistics, the dollar should have lost ground but the picture turned out to be completely different. In many ways, such a strange behavior of the dollar is due to the gradual awareness of the fact that Theresa May's resignation gives nothing and everything moves towards an unregulated Brexit with all the consequences. No one can say right now what the consequences will be for both for Great Britain and for Europe. Obviously, this does not bode well especially if Boris Johnson becomes the new prime minister, who is in favor of an early exit from the European family without a deal. Donald Trump, who openly declared that Boris Johnson is the best candidate for the post of Prime Minister of the United Kingdom, added fuel to the fire and mentioned in passing that the UK should move out of the European dormitory without any compensation and fines. Of course, in no case should one confuse the statements of the President of the United States with interference in the internal affairs of the United Kingdom but the owner of Trump card did not stop there. Once again, they demanded that Europe immediately bring its military spending to the minimum size established by the rules of NATO. At the same time, Donald Trump ultimatum still demanded from Europe to increase purchases of American weapons. That is, we introduce duties on your goods but do not be angry and increase our purchases. However, at the very end of the week, the dollar had to be turned back a little, a little dumbfounded by the impudence of China. The fact is that the Deputy Foreign Minister of China made a fiery speech in which he called the actions of the United States as blatant economic terrorism, chauvinism, and intimidation, after which he announced the introduction of additional customs duties on US goods worth $60 billion. From such arrogance in Washington, they choked so much that they still cannot come to their senses to this day. After all, it is only they who can set the rules and dictate terms and all the others must unquestioningly fulfill the will of the White House. Yet, the most interesting thing about all this is that the deputy foreign minister said about the reciprocal measures of the Middle Kingdom, which means that this is not the worst thing that can be expected from Beijing. Higher comrades will declare much more drastic measures and all the others must unquestioningly fulfill the will of the White House. The first week of summer will be extremely rich in macroeconomic statistics, which will greatly distinguish it from the past week but the main event will be the publication of the report of the United States Department of Labor since the content of this report can seriously disappoint market participants. On the one hand, the average working week should increase from 34.4 hours to 34.5 hours, and the growth rate of the average hourly wage is likely to remain unchanged. That is, Americans work more and get more in the amount but at the same time, the unemployment rate may increase from 3.6% to 3.7%, and 190 thousand new jobs should be created outside agriculture, against 263 thousand in the previous month. In other words, even though Americans are starting to work more for the same money, the number of workers themselves becomes less. This is not the news that all sorts of investors want to hear. In support of this not very joyful thesis, the ADP report should show an increase in employment of 185 thousand versus 275 thousand a month earlier. Also, the final data on business indices should confirm a preliminary assessment, which showed a strong decrease in these indices. Yes, and production orders can be reduced by 1.0%. In general, everything is bad. The only thing that can somehow please the market participants is the construction costs, which should increase by 0.5% but this is not the data that can have any impact on the markets. Therefore, the American statistics will obviously contribute to the weakening of the dollar and only weak statistics from the Old World can save it. Oddly enough but this is exactly what everyone is waiting for. In particular, the final GDP data for Europe will almost certainly show the unchanged economic growth rate at an extremely low level of 1.2%. Retail sales growth is also expected to slow from 1.9% to 1.6% but the worst thing is that preliminary inflation data should show its slowdown from 1.3% to 1.0%. The final data on business activity indices will confirm the fact of their decline. British business activity indexes will also not please investors since the business activity index in the manufacturing sector has already shown a decline from 53.1 to 49.4. Thus, other indexes are more likely to show a decline but the worst thing is that a meeting of the European Central Bank will take place this week, which in itself is not interesting to anyone unlike the subsequent press conference of Mario Draghi. Taking into account the content of the text of the meeting of the Federal Reserve System, in which the possibility of reducing the refinancing rate was almost directly stated, the head of the European Central Bank is expected to confirm plans to gradually tighten monetary policy. But most likely, Mario Draghi will disappoint everyone, and his wording will be extremely vague. Words about the risks caused by the trade conflict between China and the United States will be repeated, although nothing will be said about the actions of Donald Trump in relation to Europe itself compare to the subsequent press conference, Mario Draghi. Taking into account the content of the text of the meeting of the Federal Reserve System, in which the possibility of reducing the refinancing rate was almost directly stated, the head of the European Central Bank is expected to confirm plans to gradually tighten monetary policy. It is in favor of the dollar that the report of the Ministry of Labor will be published only on Friday, while in Europe negative news will come in during all the previous days. Hence, the single European currency will again become cheaper for almost the entire week and a rebound is expected only on Friday. But in the end, the single European currency should stop at the level of 1.1125. Of course, Brexit is pressing hard on the pound, as well as the upcoming change of prime minister but it will not happen soon. Yes, Theresa May herself retires on June 7 from the post of head of the Conservative Party, but will continue to hold the post of prime minister until a new party head is elected. Such an exciting show will begin only on June 10 and should be completed by mid-July. Thus, Teresa May will still delight us with her brilliant ideas on how to reconcile the positions of conservatives and laborists for another six weeks, which is naturally a failure. Thus, the pound will follow the single European currency and only on Friday. It is worth waiting for a certain rebound and it will be at the level of 1.2625 by the end of the week. |
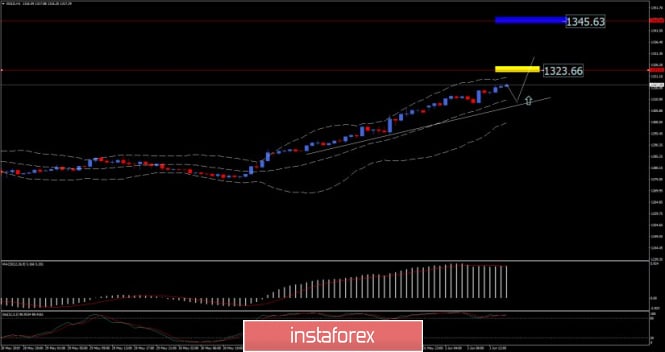
| Analysis of Gold for June 03,.2019 Posted: 03 Jun 2019 05:36 AM PDT Gold has been trading with the strong up momentum. Anyway, we still expect more upside on the Gold with light pullbacks. You should watch for buying opportunities on the downward correction.
Yellow rectangle Daily swing high $1.323 Blue rectangle – Daily swing high 2 $1.345 White line – Upward sloping trendlinge (support) According to the H1 time-frame, we found that there is strong upward momentum. The MACD oscillator is showing real upward power and that light downward corrections are sign of the strong market. Our advice is to watch for potential pullback to the middle of the bolinger bands on M30 or H1 and go for long. Upward targets are set at the price of $1.323 and $1.345. Intraday support is seen at the price of $1.308. The material has been provided by InstaForex Company - www.instaforex.com |
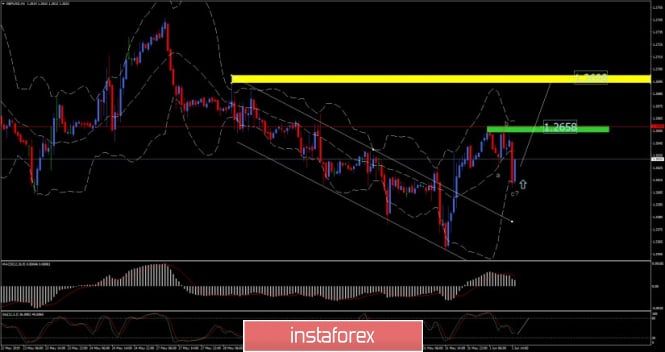
| GBP/USD analysis for June 03,.2019 Posted: 03 Jun 2019 05:29 AM PDT GBP/USD did nice up break on Friday and today we see potential end of the downward correction after the breakout, which is sign that further bullish movement is expected.
Green rectangle – Intraday resistance 1.2658 Yellow rectangle – Swing high resistance 1.2698 White lines – Downward channel (broken) According to the H1 time-frame, we that there is potential end of the downward correction (abc) at 1.2610, which is sign that further upward movement is expected. The stochastic oscillator is turning bull again and MACD indicator is still in positive teritory. Our advice is to watch for buying opportunities. The upward targets are set at 1.2658 and 1.2700. As long as the GBP is trading above the 1.2558, we will watch for buying opportunities. The material has been provided by InstaForex Company - www.instaforex.com |
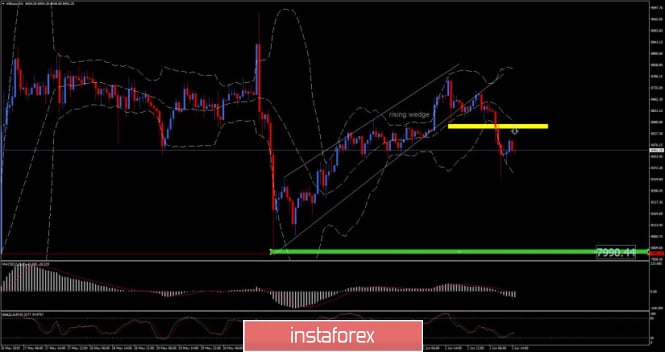
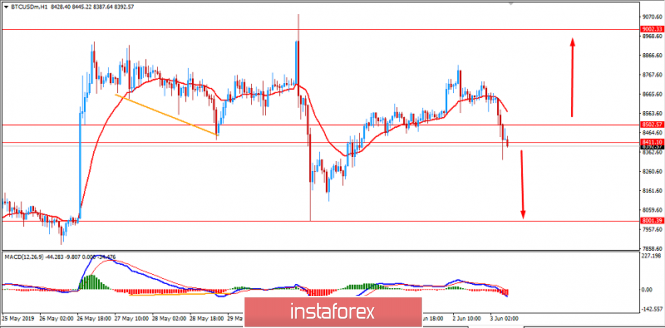
| Bitcoin analysis for June, 03.2019 Posted: 03 Jun 2019 05:21 AM PDT BTC has been trading downwards in past 10 hours as we expected. The price tested the level of $8.332. Anyway, we found that sellers didn't lost down momentum and we still expect more downside to come.
Yellow rectangle – Intraday resistance $8.570 Green rectangle – Short-term support and down target $7.990 White lines – Rising wedge pattern (broken) According to the H1 time-frame, we that there is the breakout of the rising wedge pattern in the background, which is sign for further downside.Our advice is to watch for confirmation of the down trend, which is at least 2 lower highs on the 30M time-frame in order to confirm the bearish trend. The breakout of the swing low at $8.327 wouldbe good confirmation for downside. You can also wait for potential test of resistance at $8.570 and try to sell around that point. The material has been provided by InstaForex Company - www.instaforex.com |
| Wave analysis of EUR/USD and GBP/USD for June 3. European currencies show signs of life Posted: 03 Jun 2019 04:55 AM PDT EUR/USD On Friday, May 31, the EUR/USD currency pair ended with an increase of 35 basis points. Thus, the current wave marking once again threatens to transform into a more complex one. Already, it is possible to build several options for wave marking, and each will assume any of its developments. For example, one of the options involves the construction of a new upward trend segment from the current position, and at least from May 23 considers it as the final wave of the long-term downward trend segment. However, what will happen if tomorrow, for example, the Fed will announce a new rate increase? Or will US GDP begin to slow down seriously? Or the ECB will announce its readiness to reduce its rate even more? That's right, traders will rush to sell the euro/dollar pair again, which will lead to the continuation of the construction of the downward section. Thus, I recommend considering the highs of May 27 and June 3 near the Fibonacci levels of 76.4% and 100.0% as reference. Successful attempts to break these marks will mean the readiness of the pair to build at least an upward wave. Otherwise, we will still see new sales in the instrument market. Sales targets: 1.1097 – 161.8% Fibonacci 1.1045 – 200.0% Fibonacci Purchase goals: 1.1324 – 0.0% Fibonacci General conclusions and trading recommendations: The euro/dollar pair remains at the stage of building a downward trend. The MACD indicator gave a signal up, so I recommend to resume sales of the euro with the targets at 1.1097 and 1.1045, which corresponds to 161.8% and 200.0% of Fibonacci, after a rollback up and receiving a signal "down". I recommend placing a restrictive order above the Fibonacci level of 76.4%. GBP/USD On May 31, the GBP/USD pair gained about 20 base points, and the wave pattern can also be interpreted in different ways. For example, a section of the trend between May 3 and May 31 can be considered as a 5-wave with a very small wave 2. If so, the supposed wave C is complete. If this is so, then we are waiting for the construction of at least a three-wave upward structure. But what will happen if tomorrow it turns out that the UK is waiting for Brexit without agreements, which will almost certainly hit the economy? Or if the new Prime Minister is just as unable to solve the Brexit problem as Theresa May? This will cause new sales of the pound/dollar pair and, in particular, the pound sterling, which will complicate the segment of the trend starting on March 13. Thus, for new sales of the pair, we are waiting for a breakthrough of the Fibonacci level of 200.0%. Sales targets: 1.2554 – 200.0% Fibonacci 1.2360 – 261.8% Fibonacci Purchase goals: 1.3175 – 0.0% Fibonacci General conclusions and trading recommendations: The wave pattern of the pound/dollar implies a further decline of the instrument in the framework of the proposed wave C. Thus, now I recommend to wait for the breakout level to 200.0%, and selling the pound with targets located near the calculated levels of 1.2360 and 1.2176, which corresponds to 261.8% and 323.6% of Fibonacci. An unsuccessful attempt of breaking the level of 200.0% led to the departure of quotes from lows reached. The material has been provided by InstaForex Company - www.instaforex.com |
| Posted: 03 Jun 2019 02:45 AM PDT At the end of last week, the US dollar rose against major currencies but the market is experiencing a clear slowdown in its growth rate, which is due to two reasons. One of which is playing all the factors related to the weakness of the main competing currencies, meaning, there are no prospects for higher interest rates by central banks to which they relate. Another is a decline in the growth of the American economy in the future, which may force the Fed to start lowering interest rates. In our opinion, another important reason for the likely local reversal of the exchange rate of the US currency may be an even greater escalation of the trade crisis between China and America. The last May events showed that Washington is increasing pressure on the "heaven" from different directions in order to achieve trade preferences. But as it becomes clear, Beijing is not going to yield to Washington on issues of principle in trade. Moreover, according to the content of the White Paper published this Sunday, it will fight for its interests to the end. The fact that markets fear an escalation of the conflict is already manifested in the precipitous drop in oil prices, which came under a double blow. They are under pressure from the growth of oil production in the States and the fear of falling demand in the world due to the prospects for slowing down the growth of the world economy. All of these indicate that the trade war between the two world economic leaders will negatively affect the growth of the world economy, which ultimately will have a negative impact not only on China but also on the United States. Ultimately, a recession will begin in the United States in the wake of a sharp rise in inflation as a result of rising domestic import prices due to increased customs duties. In these conditions of economic uncertainty and political tensions, this could lead the Fed to a stupor. The general monetary view on inflation growth stimulates the increase in the cost of borrowing by the Central Bank to reduce inflationary pressure. At the same time, a decline in economic activity in the wake of a slowdown in economic growth will call on the Fed to lower rates to stimulate it, which will clinch with the need to raise rates due to rising inflationary pressure. It is likely that it is this scenario that makes the Fed pause in the certainty of its actions in monetary policy at the moment. So far, the markets believe that the growth of the American economy is acceptable. With inflation below the target level of 2.0%, the regulator will most likely decide to lower interest rates this year, which by and large is the main cause of the slowdown or more precisely, the uncertain growth of the US currency. Important data will be published from the United States this week, including figures on employment and the speech of Fed Chairman Jerome Powell. This can lead to noticeable movements in the markets. Forecast of the day: The EUR/USD pair is trading in the middle of the range in anticipation of the publication of important economic statistics from the United States, as well as the outcome of the ECB monetary policy meeting. The pair can locally recover to 1.1215 if it is kept above the level of 1.1160, or fall to 1.1125 if it drops below this mark. The USDJPY pair found support at 108.10. It can roll to 109. |
| BITCOIN struggling between $8,400 and $8,500 to lead to more drops? June 3, 2019 Posted: 03 Jun 2019 02:28 AM PDT Bitcoin managed to regain certain momentum after the strong drop towards $8,000 area after rejecting off the $9,000 area with a daily close. Currently, BTC is pushing strongly lower again for a probable double bottom formation according to the analysis of the price action. The bearish divergences between Bitcoin's price have been spotted. Besides, there are the Relative Strength Index and the Moving Average Convergence Divergence (MACD). In other words, as BTC has moved higher over the past two weeks, these indicators have trended lower. This is important, as bullish divergences (the opposite of bearish divergences) preceded several crypto market rallies in a similar manner over recent trading sessions. Although Bitcoin faced downward pressure earlier this week, it has since been able to recover. BTC price appears to extend the upward momentum which it has caught over a few recent weeks. It now appears that Bitcoin's next key level of resistance remains in the $8,800 region. So, a break above this level could lead to an influx of buying pressure that sends the price surging to fresh year-to-date highs. Meanwhile, Bitcoin bulls seemed to be still optimistic with the price pushing higher with a target towards $10,000 despite the current increasing bearish momentum. Though there are certain resistance levels ahead like $8,800, $9,000, $9,250, and $9,500 ahead of price reaching towards the milestone price region of $10,000 area, the bulls are expected to rule out the bears again despite the current consolidation and volatility taken into the account. SUPPORT: 8,000, 8,400 RESISTANCE: 8,800, 9,000, 9,250, 9,500 BIAS: BULLISH MOMENTUM: VOLATILE
|
| Simplified wave analysis and forecast for EUR/USD, GBP/USD and USD/JPY on June 3 Posted: 03 Jun 2019 02:08 AM PDT EUR/USD For the major euro pair, the main vector of movement from the end of March is set by a bearish wave. In a larger model, this is a correction that forms a downward pennant on the chart. The last wave of the H1 scale, relevant for intraday trading, has been directed downwards since May 27. Since the end of last week, it has been forming an upward correction. Forecast: A preliminary target zone is located in the area of calculated resistance, where the current price rise is most likely to end. At the next sessions, repeated attempts of lifting, up to full completion are expected. When changing the movement vector, volatility can increase sharply, and a short-term puncture of the upper boundary of the resistance zone is not excluded. Recommendations: In the next sessions, euro purchases will be more promising, given the short-term price increase. In the area of the potential reversal zone, one should focus on the search for signal sales of the instrument. Resistance zone: - 1.1200/1.1230 Support zone: - 1.1140/1.1110 GBP/USD Since May 3, the chart of the British pound is dominated by a bearish trend. Its last unfinished section from May 21 sets the direction of intersessional trends of the pair. In the structure of this wave, the final correction segment (B) started on Friday. Forecast: Today, the expected scenario for the movement of the pair is the continuation of the price rise, with a more flat nature of the movements. The completion of the price growth and the formation of a reversal is most likely within the framework of the calculated resistance. Recommendations: In the next day, it is recommended to focus on the purchase of the tool. At the next trading session, there is a high probability of a "sideways". The expected rise is limited by the calculated resistance zone. Resistance zone: - 1.2690/1.2720 Support zone: - 1.2620/1.2590 USD/JPY Price trends in recent months fit into the algorithm of the bullish wave, leading the countdown from the beginning of the year. The downward motion vector defines the final part of the correction zigzag (B). Having reached the minimum required size by the beginning of May, last week the correction was extended downwards. The price is approaching the level of support on a large scale. The last section counts down from May 21. Forecast: The nearest potential reversal support zone may slow down the strengthening of the Japanese currency for some time. The counter price movement will have a weak upward vector, but the rise is expected to be no further than the calculated resistance zone. Return to the main vector of movement is likely at the end of the day. Recommendations: Buying the Japanese yen is premature. It is recommended to stay out of the market for the time of the price rise, and after reaching the reversal zone, start tracking the reversal signals to find the entry into short positions. Resistance zone: - 108.50/108.80 Support zone: - 107.90/107.60 Explanations to the figures: Waves in the simplified wave analysis consist of 3 parts (A-B-C). The last unfinished wave is analyzed. Zones show areas with the highest probability of reversal. The arrows indicate the wave marking according to the method used by the author, the solid background is the formed structure, the dotted ones are the expected movements. Note: The wave algorithm does not take into account the duration of tool movements over time. The material has been provided by InstaForex Company - www.instaforex.com |
| Trading recommendations for the GBPUSD currency pair - placement of trading orders (June 3) Posted: 03 Jun 2019 01:31 AM PDT By the end of the last trading week, the pound / dollar currency pair showed volatility of 10 points lower than the average daily indicator. The fluctuation was 85 points. From the point of view of technical analysis, we see a very interesting amplitude oscillation, where the quotation for the time flew in the direction of 1.2558, but the day ended nevertheless within the confining point of support 1.2600 / 1.2620. Looking at the chart in general terms, we see that, as a beautiful quote, it did not draw pulsed candles, but as a result we remained at the pivot point 1.2600 / 1.2620. Open the daily chart and everything will fall into place. The general downward background for the British (GBP) did not disappear. We turn to the information and news background and we see that the statistics on the United States were released on Friday: Revenues / Expenditures show an increase of 0.5% and 0.3%, respectively. In the short term, it smoothed out in the form of growth of the American currency, but then the dollar was under pressure from China's comments on the trade war. What was said was that Chinese Deputy Foreign Minister Zhang Hanhui announced the use of economic terrorism and "protectionist bludgeons" by the United States to unleash trade wars against other countries. According to him, Beijing is categorically opposed to sanctions and provoking trade wars, which "are economic terrorism, chauvinism and harassment." The United States is still digesting all of the above, but I think the answer will not take long. Returning to our beloved "divorce" process, we have a statement by US President Donald Trump, in which he said in an interview by Sunday Times that Britain is not worth paying the EU £ 39 billion for Brexit. Adding that the UK should get out of the European Union without a deal, if Brussels does not accept the terms of London, it literally sounded like - "If you don't get the agreement you want, just go away." Let me remind you that Donald Trump has planned a trip to Britain this week, and this kind of "hard way out" propaganda will only grow. Today, in terms of the economic calendar, we have data on business activity in the manufacturing sector (PMI) for May, where they expect a decline from 53.1 to 52.5. In the afternoon, there will be a similar indicator for the United States, where they expect a reduction of 52.6 to 50.6. United Kingdom 11:30 Moscow time - Manufacturing Business Index (PMI) (May): Prev. 53.1 ---> Forecast 52.5 United States 17:00 MSK - Manufacturing PMI from ISM (May): Prev. 52.6 ---> Forecast 50.6. Further development Analyzing the current trading chart, we see that the quote is fixed above the pivot point 1.2600-1.2620, but still retaining the effect of magnetization. What are our next steps? - if the negative background in Britain, the connection with the Brexit confusion continues, then the probability of further reduction is still high, but there is no need to take premature actions. Based on the available information, it is possible to decompose a number of variations, let's consider them: - We consider positions for purchase higher than 1.2670, with the move prospect of 1.2700 (the first point). - We consider positions for sale if we have not opened them before, then the entry point will be considered after a clear price fixing lower than 1.2600 on the daily chart. Indicator Analysis Analyzing the different sectors of timeframes (TF), we see that indicators in the short term have taken a neutral character, due to the bumpiness within the fulcrum. Intraday perspective changed interest to an upward link with a recent jump. The medium-term perspective maintains a downward interest on the general background of the market. The downward plan was changed to an upward plan, due to the current stagnation. Intraday and mid-term perspective preserves downward interest against the general background of the market. Weekly volatility / Measurement of volatility: Month; Quarter; Year Measurement of volatility reflects the average daily fluctuation, based on monthly / quarterly / year. (June 3 was based on the time of publication of the article) The current time volatility is 28 points. In case of stagnation within the pivot point, the volatility will be kept within the framework of the average daily indicator, which aims to decrease. Key levels Zones of resistance: 1.2620; 1.2770 **; 1.2880 (1.2865-1.2880) *; 1.2920 * 1.3000 **; 1.3180 *; 1,3300 **; 1.3440; 1.3580 *; 1.3700 Support areas: 1.2620; 1,2500 *; 1.2350 **. * Periodic level ** Range Level The material has been provided by InstaForex Company - www.instaforex.com |


| You are subscribed to email updates from Forex analysis review. To stop receiving these emails, you may unsubscribe now. | Email delivery powered by Google |
| Google, 1600 Amphitheatre Parkway, Mountain View, CA 94043, United States | |
No comments:
Post a Comment