Forex analysis review |
- Fractal analysis of major currency pairs on July 4
- What to expect from the head of the ECB, Christine Lagarde?
- The pressure of easy politics is too heavy; Swedish krona as an exception
- AUD/USD: commodity market growth and the "hangover" of dollar bulls
- GBP/USD. 3 July. Results of the day. UK after the US may withdraw from the nuclear agreement with Iran
- EUR/USD. 3 July. Results of the day. The indexes of business activity in the EU and the US have confused the foreign exchange
- EUR/USD: Navarro's statement, Lagarde candidacy and weak statistics
- July 3, 2019 : EUR/USD Intraday technical analysis and trade recommendations.
- July 3, 2019 : GBP/USD Intraday technical analysis and trade recommendations.
- Gold 07.03.2019 - New wave of buyers is expected
- GBP/USD 07.03.2019 - Oversold condiiton, possible bullish movement
- BTC 07.03.2019 - Broken bear flag, more downside yet to come
- EURUSD remains in a bearish short-term trend but is close to giving a bullish reversal signal
- Gold price bounces as expected but gets rejected at previous highs
- Technical analysis of AUD/USD for July 03, 2019
- Technical analysis of USD/CHF for July 03, 2019
- EUR/USD: US and EU are on the verge of a trade war that could escalate into a currency war
- Gold sweeps away obstacles
- EUR and GBP: Christine Lagarde will be the new ECB President. The pound collapsed after a weak report on the service sector
- BITCOIN to establish a strong bullish trend again? July 3, 2019
- GBP/USD: plan for the American session on July 3. Pound expectedly fell amid weak PMI in the service sector
- EUR/USD: plan for the American session on July 3. The eurozone services sector showed growth, which helped euro buyers to
- Investment attractive: lightcoin was in the top picks
- Risky assets under attack: the Bank of England is pressing on the pound, the euro is waiting for Lagarde
- The US is increasingly winning the oil market share from OPEC (We expect a decline in the EUR/USD pair with the probability
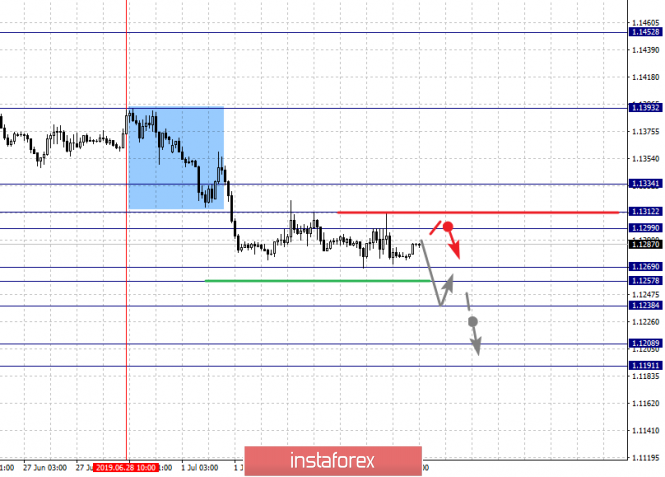
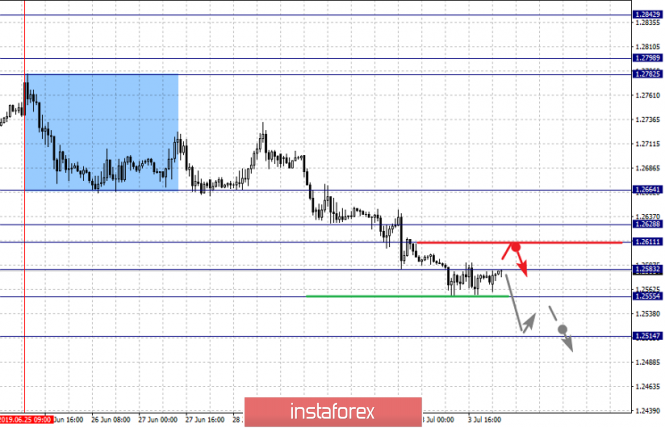
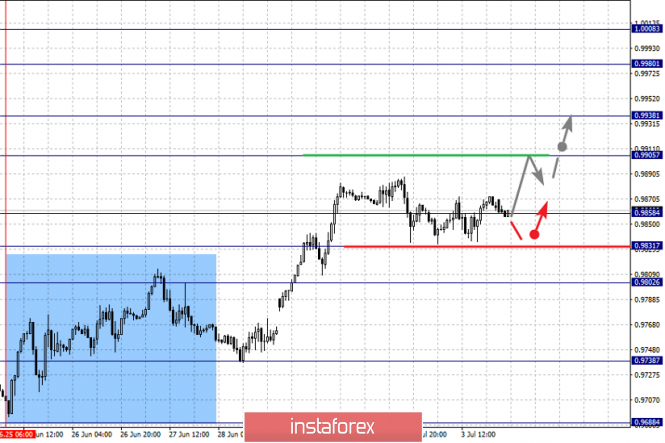
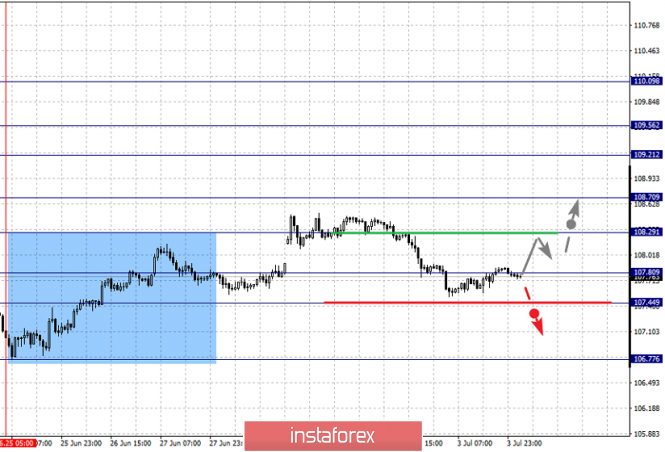
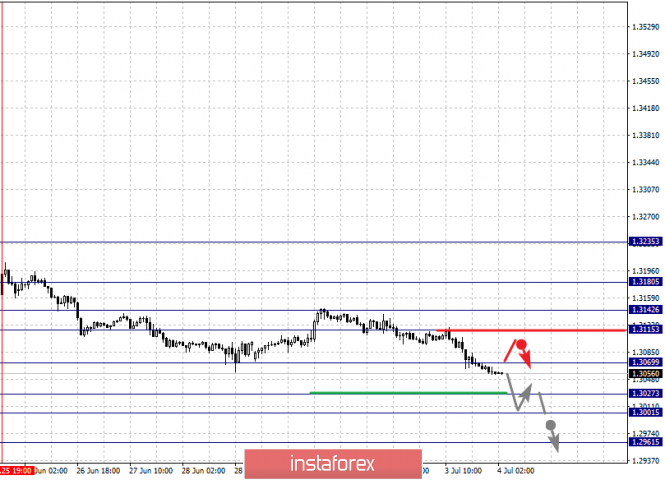
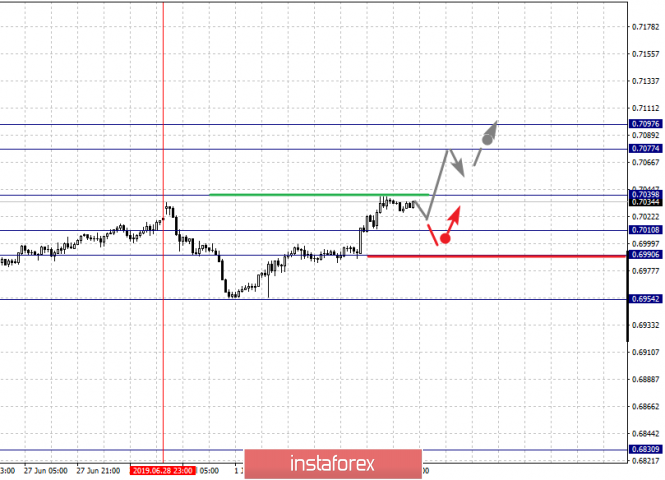
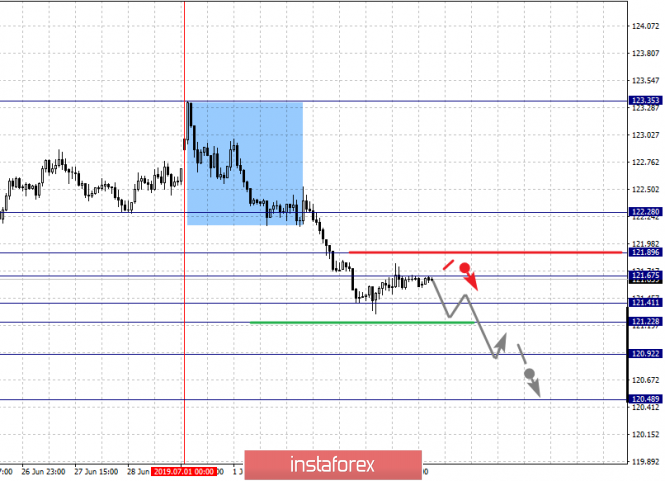
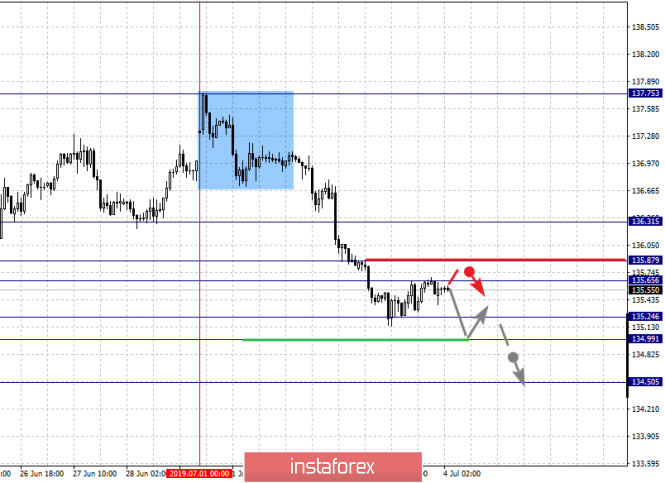
| Fractal analysis of major currency pairs on July 4 Posted: 03 Jul 2019 05:54 PM PDT Forecast for July 4: Analytical review of H1-scale currency pairs: For the euro / dollar pair, the key levels on the H1 scale are: 1.1334, 1.1312, 1.1299, 1.1269, 1.1257, 1.1238, 1.1208 and 1.1191. Here, we continue to monitor the downward structure of June 28. The continuation of the movement to the bottom is expected after the price passes the noise range 1.1269 - 1.1257. In this case, the goal is 1.1238. Price consolidation is near this level. The breakdown of the level of 1.1236 will allow us to count on a pronounced movement to the level of 1.1208. For the potential value for the bottom, we consider the level of 1.1191. After reaching which, we expect a rollback to the top. Short-term upward movement is possible in the range of 1.1299 - 1.1312. The breakdown of the latter value will lead to in-depth correction. Here, the goal is 1.1334. This level is a key support for the downward structure. The main trend - a local downward structure of June 28. Trading recommendations: Buy 1.1300 Take profit: 1.1311 Buy 1.1313 Take profit: 1.1334 Sell: 1.1257 Take profit: 1.1238 Sell: 1.1236 Take profit: 1.1210 For the pound / dollar pair, the key levels on the H1 scale are: 1.2664, 1.2628, 1.2611, 1.2583, 1.2555 and 1.2514. Here, we are following the development of the downward structure of June 25th. Short-term downward movement is expected in the range of 1.2583 - 1.2555. For the potential value for the bottom, we consider the level of 1.2514. After reaching which, we expect to go into a correction. Short-term upward movement is expected in the range of 1.2611 - 1.2628. The breakdown of the last value will lead to a prolonged correction. Here, the target is 1.2664. This level is a key support for the downward structure. The main trend - the downward structure of June 25. Trading recommendations: Buy: 1.2611 Take profit: 1.2626 Buy: 1.2630 Take profit: 1.2664 Sell: 1.2581 Take profit: 1.2557 Sell: 1.2553 Take profit: 1.2516 For the dollar / franc pair, the key levels on the H1 scale are: 1.0008, 0.9980, 0.9938, 0.9905, 0.9858, 0.9831 and 0.9802. Here, we continue to follow the development of the upward cycle from June 25. At the moment, the price is in the correction. The continuation of the movement to the top is expected after the breakdown of the level of 0.9905. In this case, the target is 0.9938, wherein near this level is a price consolidation. The breakdown of the level of 0.9938 should be accompanied by a pronounced upward movement. Here, the target is 0.9980. For the potential value for the top, we consider the level of 1.0008. After reaching which, we expect consolidation, as well as a rollback to the correction. Consolidated movement is possible in the range of 0.9858 - 0.9831. The breakdown of the latter value will lead to a prolonged correction. Here, the goal is 0.9802. This level is a key support for the top. Its price will have to develop the downward structure. Here, the potential goal is 0.9738. The main trend is the ascending cycle of June 25. Trading recommendations: Buy : 0.9905 Take profit: 0.9936 Buy : 0.9939 Take profit: 0.9980 Sell: Take profit: Sell: 0.9829 Take profit: 0.9802 For the dollar / yen pair, the key levels on the scale are : 110.09, 109.56, 109.21, 108.70, 108.29, 107.80, 107.44 and 106.77. Here, we continue to follow the development of the upward structure from June 25. At the moment, the price is in deep correction and is close to canceling this structure, for which a breakdown of the level of 107.44 is necessary. In this case, the potential target is 106.77. The continuation of the movement to the top is expected after the breakdown of the level of 108.29. Here, the first goal is 108.70. The breakdown of which will allow us to expect to move to level 109.21. Short-term upward movement, as well as consolidation is in the range of 109.21 - 109.56. For the potential value for the top, we consider the level of 110.09. The movement to which, is expected after the breakdown of the level of 109.56. The main trend: the ascending structure of June 25, the stage of deep correction. Trading recommendations: Buy: 108.30 Take profit: 108.70 Buy : 108.74 Take profit: 109.20 Sell: Take profit: Sell: 107.41 Take profit: 107.00 For the Canadian dollar / US dollar pair, the key levels on the H1 scale are: 1.3180, 1.3142, 1.3115, 1.3069, 1.3027, 1.3001 and 1.2961. Here, we continue to follow the local downward structure from June 25. At the moment, we expect movement to the level of 1.3027. Price consolidation is in the range of 1.3027 - 1.3001. For the potential value for the bottom, we consider the level of 1.2961. After reaching which, we expect a rollback to the top. Short-term upward movement is possible in the range of 1.3115 - 1.3142. The breakdown of the latter value will lead to a prolonged correction. Here, the target is 1.3180. This level is the key resistance for the development of the upward structure. Its breakdown will allow to count on movement towards the potential target - 1.3235. The main trend is a local downward structure from June 25. Trading recommendations: Buy: 1.3143 Take profit: 1.3180 Buy : 1.3182 Take profit: 1.3230 Sell: 1.3067 Take profit: 1.3027 Sell: 1.3001 Take profit: 1.2961 For the pair Australian dollar / US dollar, the key levels on the H1 scale are : 0.7097, 0.7077, 0.7039, 0.7010, 0.6990 and 0.6954. Here, the price has issued a local structure for the top of July 1. The continuation of the movement to the top is expected after the breakdown of the level of 0.7039. In this case, the target is 0.7077. For the potential value for the top, we consider the level of 0.7097. Upon reaching this level, we expect a consolidated movement in the range of of 0.7077 - 0.7097, as well as a rollback to the bottom. Short-term downward movement is possible in the range of 0.7010 - 0.6990. The breakdown of the latter value will have to the formation of a downward structure. Here, the potential target is 0.6954. The main trend is a local rising structure of July 1. Trading recommendations: Buy: 0.7040 Take profit: 0.7076 Buy: 0.7077 Take profit: 0.7096 Sell : 0.7010 Take profit : 0.6992 Sell: 0.6988 Take profit: 0.6959 For the euro / yen pair, the key levels on the H1 scale are: 122.28, 121.89, 121.67, 121.41, 121.22, 120.92 and 120.48. Here, we continue to follow the downward cycle of July 1. The continuation of the movement to the bottom is expected after passing by the price of the noise range 121.41 - 121.22. In this case, the goal is 120.92, wherein there is a price consolidation near this level. For the potential value for the bottom, we consider the level of 120.48. After reaching which, we expect a rollback to the top. Short-term upward movement is expected in the range of 121.67 - 121.89. The breakdown of the last value will lead to a prolonged correction. Here, the goal is 122.28. This level is a key support for the downward structure. The main trend is the downward cycle of July 1. Trading recommendations: Buy: 121.67 Take profit: 121.87 Buy: 121.94 Take profit: 122.28 Sell: 121.22 Take profit: 120.94 Sell: 120.90 Take profit: 120.50 For the pound / yen pair, the key levels on the H1 scale are : 136.31, 135.87, 135.65, 135.24, 134.99 and 134.50. Here, we are following a downward cycle of July 1st. Short-term downward movement is expected in the range of 135.24 - 134.99. The breakdown of the last value will allow to expect movement towards a potential target - 134.50. After reaching this level, we expect a rollback to the top. Short-term upward movement is possible in the range of 135.65 - 135.87. The breakdown of the latter value will lead to a prolonged correction. Here, the target is 136.31. This level is a key support for the downward structure. The main trend is the downward cycle of July 1. Trading recommendations: Buy: 135.65 Take profit: 135.85 Buy: 135.90 Take profit: 136.30 Sell: 135.24 Take profit: 135.00 Sell: 134.95 Take profit: 134.50 The material has been provided by InstaForex Company - www.instaforex.com |
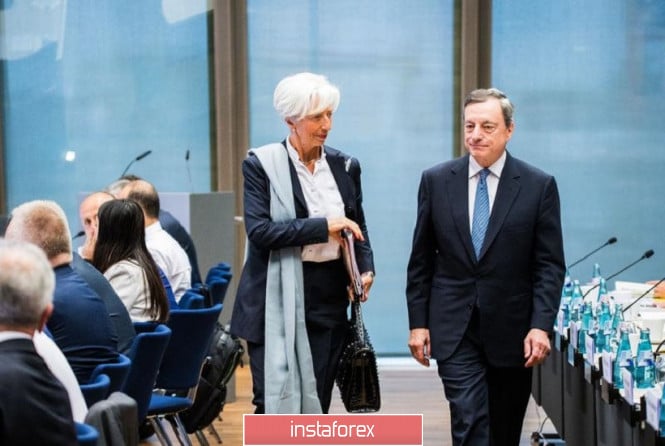
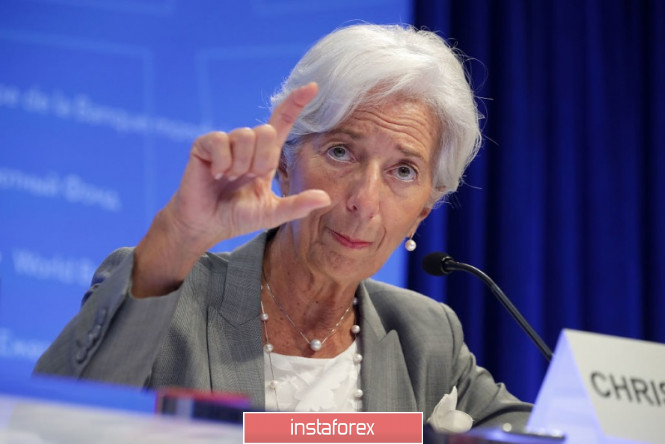
| What to expect from the head of the ECB, Christine Lagarde? Posted: 03 Jul 2019 05:13 PM PDT European leaders have decided on the candidacy for the post of head of the ECB. In October, the current IMF chief Christine Lagarde will take on the baton from Mario Draghi. This news came yesterday near the end of the US session and put pressure on the euro, which was trying to grow on the news of the ECB's refusal to cut rates in July. It is expected that Lagarde will take an aggressive incentive policy from Draghi. She will become not only the first woman to head the ECB, but also the first head of the central bank without experience in this field. This already raises questions about gaining the same level of confidence in the global economy as Draghi. However, this is unlikely to be something surprising or shocking. For example, the Federal Reserve, for the first time in 30 years, was headed by a man without professional economic education. In addition, Jerome Powell can not boast the same rich experience in monetary policy, as Janet Yellen. It should be noted that the initial decline in the euro, although it was small, indicates the desire of markets to see someone more experienced in monetary policy in this position. But the appointment has already happened, and this process does not stop. Christine Lagarde is absolutely not the silent central banker of the old school, so you should get ready for a lot of intrigue and instability. Since Lagarde is primarily a politician, she is more likely to rely on ECB staff. That is, its decisions may depend on the ECB chief economist Philip Lane, his influence on the policy of the regulator will be significant. Lane's recent comments signaled asset purchases. Unexpected turn in the acute period Of course, the choice in favor of Lagarde - a surprise for many. In recent months, speculations have been circulating around the market for potential candidates such as the head of the Bundesbank, Jens Weidmann, representatives of the Bank of France Benoit Coeur and Francois Villeroy. Erkki Liikanen, former head of the Bank of Finland, was also trying on the role of the head of the ECB. In normal times, managing monetary policy is not difficult. Now everything is different. The financial world is full of surprises and uncertainties, and besides there are no starting points, and Lagarde has had mistakes in the past. A French court in 2016 found her guilty of professional negligence, while Lagarde held the post of a finance minister. The punishment was not established, since, according to the court, the decision was made in the context of the role it played in the country's struggle against the global financial crisis. Not so long ago, Draghi spoke about the possibility of softening policies in order to stimulate inflation in the direction of 2%. Given that the deposit rate is already in a rather deep negative, such a move could harm the banks that have to pay the ECB for keeping their funds on its balance sheet. Markets are nervous Lagarde at the beginning of her role as head of the ECB will be without significant support. The three main architects of the regulator's incentive policy for the asset purchase program, lower rates and the provision of cheap long-term loans to banks have either left the central bank or will do so soon. So, Mario Draghi leaves at the end of October, Coeure's term expires at the end of the year, and former chief economist Peter Praet resigned a few weeks ago. This alignment of forces may aggravate financial markets, given that ECB Vice President Luis de Guindos, who came last year, also has no experience in the central bank. If the European regulator is serious about fresh incentives, then it's more likely to happen before Lagarde arrives. This will somewhat relieve the pressure on her at the beginning of the journey. The material has been provided by InstaForex Company - www.instaforex.com |
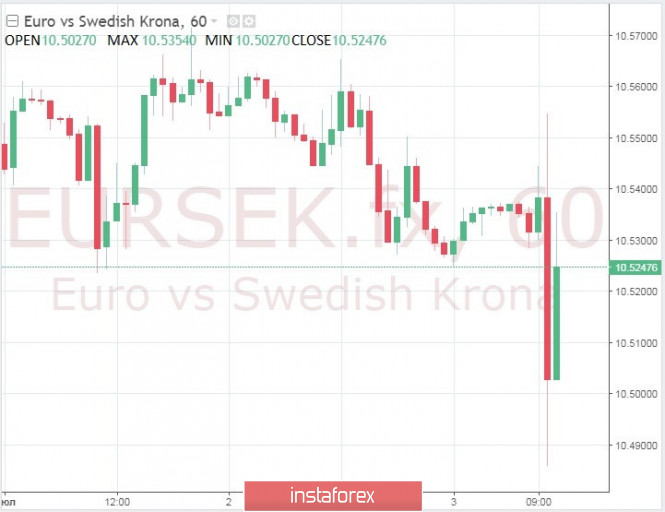
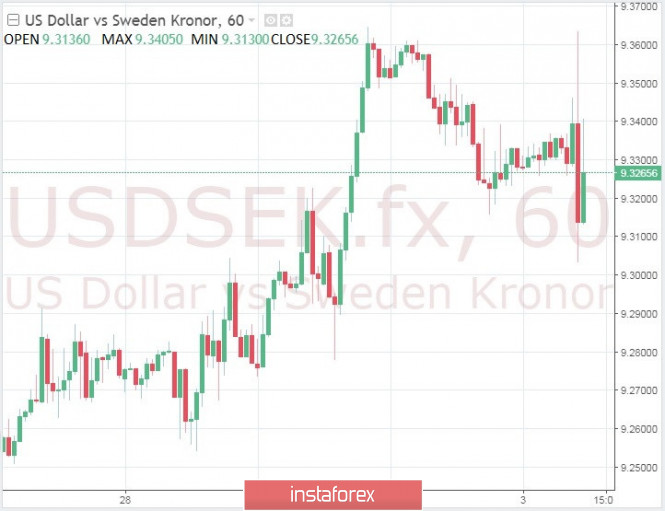
| The pressure of easy politics is too heavy; Swedish krona as an exception Posted: 03 Jul 2019 04:54 PM PDT More and more currencies fall under the pressure of the "dovish" tone of the world central banks, although the Swedish krona stands out against this background, having strengthened to a 2.5 month high against the euro after the local central bank announced that it plans to tighten the policy by early 2020. However, the focus remains on another currency - the pound - which fell on Tuesday along with the yields of British government bonds. The yield on 10-year securities fell below the main discount rate of the Bank of England for the first time since the 2008 crisis, after the markets interpreted the comments of the Bank of England CEO Mark Carney as dovish. The sterling lost 0.2%, updating its two-week low. "The two main driving forces today are the yen, which is considered a safe haven, and it has returned to growth, and the pound, which continues to decline," said Colin Asher, senior economist at Mizuho. The yen rose by 0.23% against the dollar and is trading at 107.6 yen, as investors are more skeptical about the possibility of an early end to the trade war, especially given the comments of US President Donald Trump that any transaction should be in favor of the US. Currencies will continue to contain signs that more and more central banks are adjusting to easing monetary policy in order to combat a slowdown in economic growth. The dovish tone of central banks reduces profitability across the board. The latest figures show that weakness in the manufacturing sector is beginning to spread to the service sector, it is alarming, and it gives the green light to central banks to soften policies. And so far only the Swedish central bank has adhered to a policy of tightening policy by the end of this year or the beginning of next year amid steady inflation and good economic prospects. The Swedish krona has updated a 2.5-month high against the euro and is growing against the dollar. The material has been provided by InstaForex Company - www.instaforex.com |
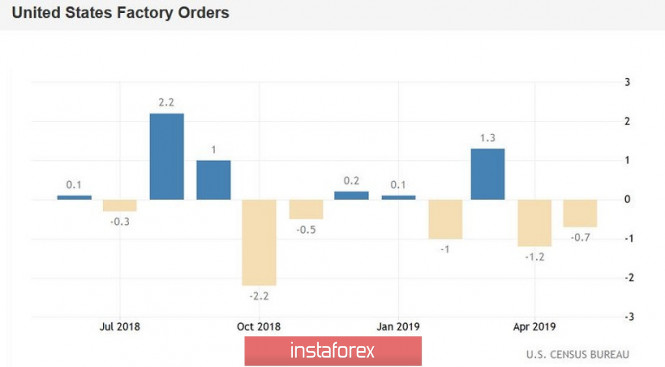
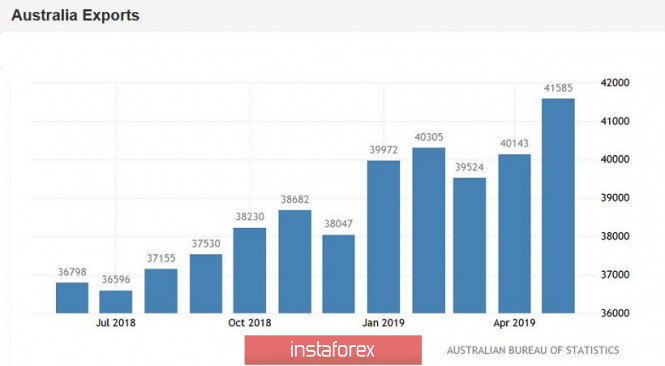
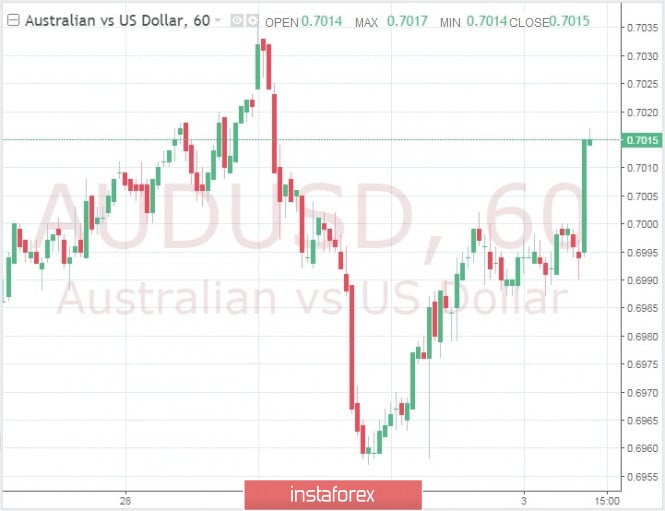
| AUD/USD: commodity market growth and the "hangover" of dollar bulls Posted: 03 Jul 2019 04:39 PM PDT The Australian dollar continues to gain momentum: the AUD/USD pair confidently overcame the key mark of 0.7000 and consolidated in the middle of the 70th figure. For two days, the pair shows a nearly recoilless growth, returning lost positions. It is noteworthy that the aussie turned 180 degrees after the July meeting of the RBA, at which the regulator lowered the interest rate and allowed a further easing of monetary policy. Such an abnormal market reaction is primarily associated with the general weakening of the US currency. In addition, the aussie continues to receive support from domestic data and the commodity market - in particular, the cost of iron ore continues to stay above $100 per ton. And yet the main driving force behind the growth of AUD/USD is a weak greenback. After the unjustified euphoria, which was associated with the outcome of the G20 summit, a regular "hangover" gradually ensues, aggravated by loud statements by top White House officials. The essence of their comments comes down to the fact that, firstly, relief from Washington is more of a formal nature - for example, Chinese technology giant Huawei remains on the United States' blacklist, despite certain concessions processors). Secondly, the very fact of the truce is under a big question mark - after all, a non-aggression pact was concluded rather than an armistice agreement in Osaka. Today, the White House announced a meeting between US Trade Representative Robert Lighthizer and Chinese Deputy Prime Minister Liu He, which will clear the future prospects for the negotiation process. Washington did not say exactly when this meeting will take place, but noted that it will occur "in the near future." In general, the initial optimism of traders was replaced by concern and uncertainty that another attempt to find a compromise will be crowned with success. Similar doubts from investors have background pressure on the US dollar. To one degree or another, this also affects the US currency's postions in dollar pairs. Weak macroeconomic reports in the US only exacerbate the position of the greenback. The slowdown is demonstrated by both key and secondary economic indicators. Take, for example, the latest releases: an indicator of consumer confidence in the US, an indicator of growth in orders for durable goods, a report on the labor market from ADP, regional indicators of production activity — all of these indicators came out in the red zone, not reaching weak forecast levels. Almost every day, US statistics disappoint investors to some extent, and today is no exception. Thus, activity in the service sector slowed to 55.1 points - this is the weakest result since July 2017. The extremely low influx of new orders (this component of the indicator updated a 2.5-year low) caused a decline in employment in this area, having a mediated effect on the overall slowdown in the US labor market. Experts have previously warned that the service sector will begin to slow down after the manufacturing sector, and now, apparently, these predictions are beginning to materialize. By the way, the indicator of production orders published today came out at the lowest values since the summer of 2016. The indicator is actively decreasing for the second consecutive month, and the May indicator was revised downward (-1.2% instead of the previous -0.8%). This fundamental picture does not allow the dollar to develop to feel comfortable, even with continued demand. And together with the Australian dollar, the greenback is losing its position at the expense of the aussie's "independent" growth. The Australian dollar won back a decline in the interest rate by 0.25% and after the announcement of the expected decision, it began to recover throughout the market. Although Philip Lowe did not rule out further easing of monetary policy, the market focused on current events, pulling up the aussie. First, the strategically important raw material for Australia - iron ore - continues to grow. To date, the cost of a ton of this raw material is already $124 (for comparison, in April this figure was in the level of $80). Secondly, due to the growth in the value of exports of iron ore, Australia recorded a growth in the trade surplus by 16.2% to $4 billion in May compared with April. Judging by the price dynamics of iron ore, the June figures will exceed the May results. High demand for this type of raw materials from Chinese steel mills only confirms this assumption. Thus, despite the RBA's dovish position, AUD/USD buyers use the market's current situation to their advantage. Uncertain positions of the US currency against the background of a substantial growth in the commodity market makes it possible for the aussie to open new price horizons. The first resistance level is the mark 0.7060 - this is the upper line of the Bollinger Bands indicator on the daily chart. When it is overcome, the Ichimoku trend indicator will form a bullish "Parade of lines" signal, which will open the way for AUD/USD bulls to the next resistance level of 0.7180 (the top line of the Bollinger Bands indicator is already on the weekly chart). Support is the aussie's key for a 0.7000 mark. The material has been provided by InstaForex Company - www.instaforex.com |
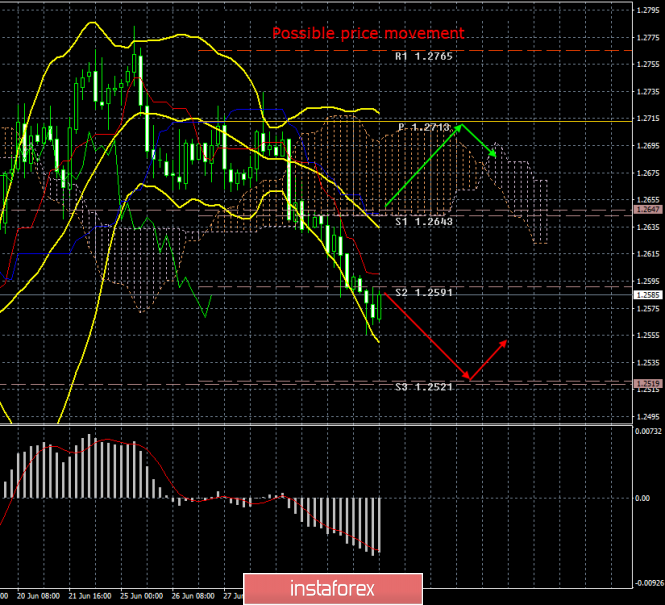
| Posted: 03 Jul 2019 04:22 PM PDT 4-hour timeframe The amplitude of the last 5 days (high-low): 45p - 63p - 72p - 74p - 64p. Average amplitude for the last 5 days: 64p (73p). Jeremy Hunt, the foreign minister and candidate for prime minister of the United Kingdom, announced that the country may withdraw from the nuclear agreement if Iran violates the terms of the treaty. According to Hunt, he fears a sudden war, but even in the event of a break in the arrangements between London and Tehran, Britain will not join the United States to strike at the territories of Iran. Recall that Washington has already left the nuclear deal, and if the US Senators had not blocked the corresponding amendment to the military budget, then Trump would have struck Iran. According to France, the threshold of low-enriched uranium was exceeded by the Iranian state, and a little later this information was confirmed by the IAEA. This threatens Iran with a break in all trade relations with Great Britain, France and other participants in the "nuclear deal." For Britain, as for the whole world, this is a security threat, since Iran is the main sponsor of world terrorism, according to many politicians and political scientists. Meanwhile, the pound sterling continues to calmly decline in tandem with the dollar. If the macroeconomic statistics for the EUR/USD pair was neutral today, for the GBP/USD pair it was again not in favor of the pound, since both the UK business activity index was below forecasts, and the PMI for the services sector went below the critical level of 50.0. However, it seems that traders are not particularly needed and these indices were needed, since the pound did not stop its decline for the third day. As we have mentioned several times before, until the light at the end of the tunnel called "Brexit" is visible, one should not even dream of any serious strengthening of the pound sterling. The United States is the only one that could bail out the pound now and only if their economic performance continues to fall. However, as we can see, "numbers" in the UK also leave much to be desired. Trading recommendations: The pound/dollar currency pair continues its downward movement. Thus, traders are advised to continue to sell the pound sterling with a target of 1,2521 until the MACD indicator reverses to the top, which would indicate a round of correction. It will be possible to buy the British currency no earlier than when the pair consolidates above the Kijun-sen line. In this case, the bulls will get a small chance to implement their trading strategies, but so far they remain extremely weak. In addition to the technical picture should also take into account the fundamental data and the time of their release. Explanation of the illustration: Ichimoku indicator: Tenkan-sen - the red line. Kijun-sen - the blue line. Senkou Span A - light brown dotted line. Senkou Span B - light purple dotted line. Chikou Span - green line. Bollinger Bands indicator: 3 yellow lines. MACD Indicator: Red line and histogram with white bars in the indicator window. The material has been provided by InstaForex Company - www.instaforex.com |
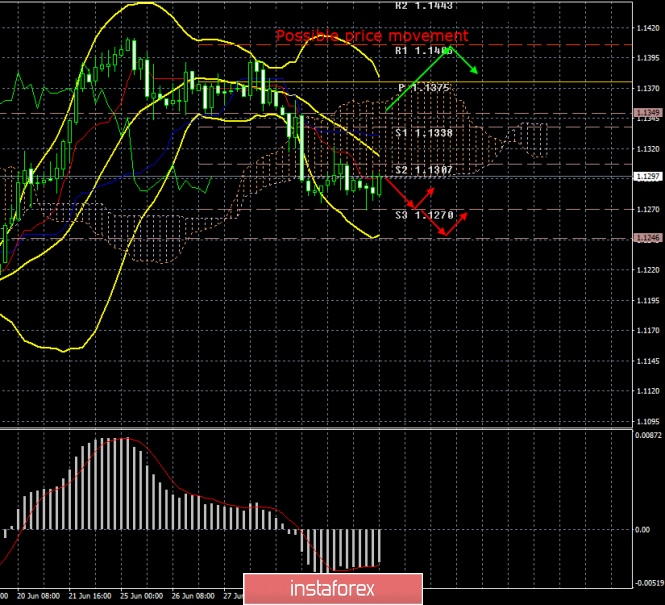
| Posted: 03 Jul 2019 04:10 PM PDT 4-hour timeframe The amplitude of the last 5 days (high-low): 43p - 34p - 42p - 90p - 47p. Average amplitude for the last 5 days: 51p (55p). The technical picture of the environment for July 3 was confusing due to the completely ambiguous macroeconomic statistics from the European Union and the United States. The composite index of business activity and the index for the EU services sector exceeded the expectations of traders and amounted to 53.6 and 52.2, respectively. Thus, the trend of failed business activity in the manufacturing sector has not been preserved. In the United States, Markit indexes came out, which also turned out to be higher than the forecast, but at the same time disappointed the more important index of business activity for the ISM services sector, which was 55.1, while the forecast was at 56.1. The ADP report was also disappointing since there was a change in the number of workers in the US private sector. With a forecast of +140,000, the real figure proclaimed a gain of only +102,000. So it turns out that the news did not support the US dollar, but did not give traders any reason to buy the euro either. Thus, traders were in thought all day today, volatility was low, and the trend within the day was sideways. The main question, of course, is the strength of the bears, the question of their desire to continue selling the euro and buying the dollar. From our point of view, the downward movement in the euro/dollar pair will be an absolutely logical continuation, unless the macroeconomic statistics from the United States fail from time to time. If it is at least neutral, then, based on the apparent bias towards the states of the monetary policies of the countries issuing the analyzed currencies, the US dollar will continue to strengthen, much to the regret of Donald Trump. Trade wars do not particularly affect the US currency, mainly the US stock markets, so even the escalation of the conflict with China will not help return the pair to the upward direction. Trading recommendations: The EUR/USD pair, we can say, continues the correction, as the downward movement was not observed today. Thus, it is recommended to expect it and re-sell the euro with targets of 1,1270 and 1,1246. It is recommended to buy the euro/dollar pair not earlier than when the price consolidates above the Kijun-sen line. However, this will require a strong fundamental basis for the bulls. In addition to the technical picture should also take into account the fundamental data and the time of their release. Explanation of the illustration: Ichimoku indicator: Tenkan-sen - the red line. Kijun-sen - the blue line. Senkou Span A - light brown dotted line. Senkou Span B - light purple dotted line. Chikou Span - green line. Bollinger Bands indicator: 3 yellow lines. MACD Indicator: Red line and histogram with white bars in the indicator window. The material has been provided by InstaForex Company - www.instaforex.com |
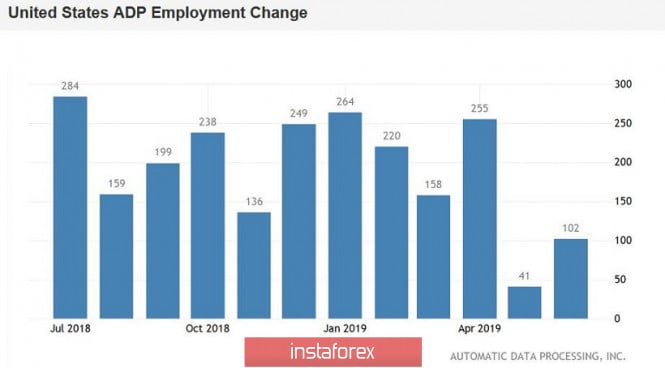
| EUR/USD: Navarro's statement, Lagarde candidacy and weak statistics Posted: 03 Jul 2019 03:42 PM PDT The euro-dollar pair is still trading in the flat, despite the ongoing attacks of EUR/USD bears. But their opponents continue to fight for the 13th figure, despite the rather negative background that has developed for the European currency. However, the US dollar is also weakening throughout the market - the dollar index shows a negative trend, following the yield of 10-year Treasuries, - the figure still fell below the 2-percent mark (currently at the level of 1.958). Both the euro and the dollar are under the yoke of "their" own problems, and this fact forces EUR/USD traders to stagnate in almost the same place on the eve of the weekend in the US and in anticipation of Friday's Nonfarms. Let's start with the problems of the US currency. White House trade adviser Peter Navarro unexpectedly cooled the heat of dollar bulls, saying that it would take "extra time" to close the deal between China and the United States. According to him, the previous months of negotiations have created only the foundation for the current dialogue, and now the parties need to resolve the most difficult issues. In addition, Navarro said that the United States is not going to exclude Chinese telecommunications company Huawei from its "black list". The Chinese will be allowed to sell only "a small number of processors," that is, low-tech products that do not affect national security. Earlier, Trump's economic adviser Larry Kudlow voiced similar information, although he did not specify that Huawei would remain on the White House's black list. In conclusion, Navarro said that the US Federal Reserve should lower the interest rate, despite the agreement reached to continue the negotiation process between the United States and China. All this suggests that the overall situation has not changed much since last week. The market no longer feared aggressive mitigation of the parameters of the Fed's monetary policy, but this issue is not removed from the agenda. And if Friday's Nonfarms will once again disappoint, then the dollar will lose its conquered positions as quickly as it won them. Today's report from the ADP agency was the first "alarming bell" regarding the prospects for Friday's data. According to published data, the number of employees in June increased by only 102 thousand. The indicator did not even reach the relatively low forecast level of 140 thousand. The structure of the report suggests that the weakest dynamics was recorded in the small business sector and in the industrial production sector. Regional reports of the Fed confirm this negative trend. In particular, the business index in the manufacturing sector of the Federal Reserve Bank of Richmond showed the strongest decline this year. After February's peak of 19 points it slowed down to three points in June. The structure of the indicator suggests that the component of average employment during the working week and the component of wages have decreased most strongly. A similar situation exists in other regions of the United States. The ADP report is the main guideline before official statistics (Nonfarms), so the dollar could be under even greater pressure on Friday. It is also worth noting that today the extremely weak ISM composite index for the non-production sphere has been released. The index fell to the level of 55.1 in June, updating multi-year lows. However, by evil irony of fate, the single currency can not take advantage of the dollar's weakness. EUR/USD traders are under the background pressure of rumors about the impending easing of the ECB's monetary policy this fall. Yesterday, information appeared on the market that the European regulator would maintain the status quo at the July meeting, but would prepare traders for the corresponding steps in September. Additional pressure on the euro was also due to the fact that the position of head of the ECB with a probability of 99.9% will be taken by Christine Lagarde, who will replace Mario Draghi in October. For several weeks, EU leaders agreed on the names of the leaders of key EU institutions. The negotiations were long and difficult: Donald Tusk was even forced to suspend the EU summit to hold separate, bilateral meetings of politicians. Lagarde became a compromise figure in a dispute over who will head the ECB. The Germans actively lobbied for the post of the head of the Bundesbank, Jens Weidmann (who is known for his "hawkish" position), but in the end Berlin got the position of the European Commission chairman (they will be German Defense Minister Ursula von der Leyen), so the ECB will be headed by a French person - Lagarde who was nominated by French President Emmanuel Macron. It cannot be said that the former finance minister of France and the already ex-head of the IMF holds a "dovish" position regarding the prospects for the ECB's monetary policy. Traders are more concerned about uncertainty. For several months, experts discussed the most likely candidates for this position, "on the shelves" laying out options for possible actions by the European regulator with a particular leader. By the way, the head of the Bank of Finland Erkki Liikanen was considered to be the favorite of the political race for a long time. And when in the end the "dark horse" won the fight, the traders were clearly discouraged. According to a number of experts, Lagarde as a whole will continue the policy of Mario Draghi and largely rely on the decisions/advice of ECB Chief Economist Philip Lane, who, in turn, is an advocate of soft monetary policy (in particular, additional incentives). That is why the candidacy of Lagarde did not cause a general approval from the EUR/USD bulls: personnel changes in the ECB camp do not promise a single currency anything good. Thus, the controversial fundamental background does not make it possible for bears to continue the EUR/USD's downward trend, and the bulls in developing a more or less large-scale correction. With a high degree of probability, this situation will continue until the release of Friday's Nonfarms. From a technical point of view, the situation has not changed either. Sellers need to gain a foothold under the mark of 1.1280 in order to get to the next support level of 1.1170 (the bottom line of the Bollinger Bands indicator on the daily chart, which coincides with the bottom of the Kumo cloud). The resistance level is the price of 1.1340 - this is the Tenkan-sen line on the daily chart. The material has been provided by InstaForex Company - www.instaforex.com |
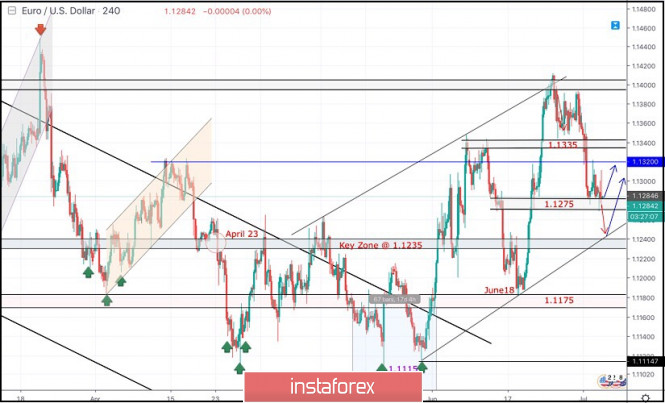
| July 3, 2019 : EUR/USD Intraday technical analysis and trade recommendations. Posted: 03 Jul 2019 10:38 AM PDT
Since February 28, the EURUSD pair has been moving within the depicted channel with slight bearish tendency. Short-term outlook turned to become bearish towards 1.1175 (a previous weekly bottom which has been holding prices above for some time. On the highlighted period between (May 17th and June 5th), temporary bearish breakdown below 1.1175 was demonstrated on the chart. This allowed further bearish decline to occur towards 1.1115 where significant bullish recovery brought the EUR/USD pair back above 1.1175 which stands as a prominent DEMAND level until now. Initially, Temporary Bullish breakout above 1.1335 was initially demonstrated (suggesting a high probability bullish continuation pattern). However, the EURUSD pair has failed to maintain that bullish persistence above 1.1320 and 1.1275 (the depicted price levels/zones). This was followed by a deeper bearish pullback towards 1.1175 where significant bullish price action was demonstrated on June 18. The EURUSD looked overbought around 1.1400 facing a confluence of supply levels. Thus, a bearish pullback was initiated towards 1.1275 as expected in a previous article. Further Bearish decline below 1.1275 calls for a deeper bearish pullback towards 1.1235 where the lower limit of the newly-established bullish channel as well as a prominent demand zone come to meet the EUR/USD pair. Overall, Short-term outlook remains bullish as long as bullish persistence above 1.1235 (Demand-Zone) is maintained on the H4 chart. Trade recommendations : For Intraday traders, a valid BUY entry can be considered anywhere around 1.1235. Initial Target levels to be located around 1.1275 and 1.1320. Bearish breakout below 1.1200 invalidates this mentioned scenario. The material has been provided by InstaForex Company - www.instaforex.com |
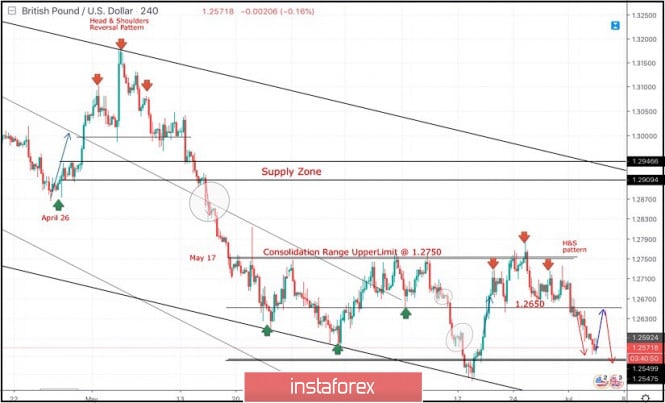
| July 3, 2019 : GBP/USD Intraday technical analysis and trade recommendations. Posted: 03 Jul 2019 10:22 AM PDT
Since May 17, the previous downside movement within the depicted bearish channel came to a pause allowing the recent sideway consolidation range to be established between 1.2750 - 1.2550 with a prominent key-level around 1.2650. On June 4, temporary bullish consolidations above 1.2650 were demonstrated for a few trading sessions. However, the price level of 1.2750 (consolidation range upper limit) has prevented further bullish advancement. That's why, the GBP/USD failed to establish a successful bullish breakout above 1.2750. Instead, early signs of bearish rejection have been manifested (Head & Shoulders reversal pattern with neckline located around 1.2650). A quick bearish pullback towards 1.2650 was expected shortly. Bearish breakdown below 1.2650 (reversal pattern neckline) confirms the reversal pattern with bearish projection target located at 1.2550 and 1.2510. Short-term outlook remains under bearish pressure as long as the market keeps moving below 1.2650 (mid-range key-level and neckline of the reversal pattern). In general, Obvious Bearish breakdown below 1.2570 confirms a trend reversal into bearish on the intermediate term. Immediate bearish decline would be expected towards 1.2505 initially. Any bullish pullback towards 1.2650 should be considered as a valid SELL signal for Intraday traders. On the other hand, a bullish position can ONLY be considered if EARLY Bullish persistence above 1.2650 is re-achieved on the current H4 chart. Trade Recommendations: Intraday traders can have a valid SELL Entry anywhere around the neckline of the depicted reversal pattern near 1.2650. T/P levels to be located around 1.2600, 1.2550 and 1.2505. S/L should be placed above 1.2700. The material has been provided by InstaForex Company - www.instaforex.com |
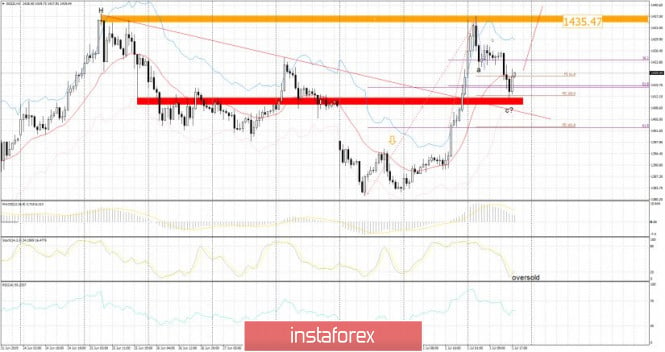
| Gold 07.03.2019 - New wave of buyers is expected Posted: 03 Jul 2019 08:17 AM PDT .Trading recommendation:
Gold has been trading lower in past 20 hours. Anyway, the Gold found support at the price of $1.411, which is our strong support level (Fibonacci expansion 100% and Fibonacci retracement 38%). Further upward is expected. Red rectangle – Strong support ($1.411) Orange rectangle- Resistance ($1.435) Red line – 20 EMA Stochastic oscillator is showing us that there the oversold, which is sign that selling at this area looks risky. I found strong support area from $1.412-$1.415. There is strong upward trend in the background, and loading long positions from this good support zone looks very attractive. As long as the Gold is trading above the $1.410, I would like to buy on the dips. Potential test of $1.435 is very possible. Watch for buying opportuniuties. The material has been provided by InstaForex Company - www.instaforex.com |
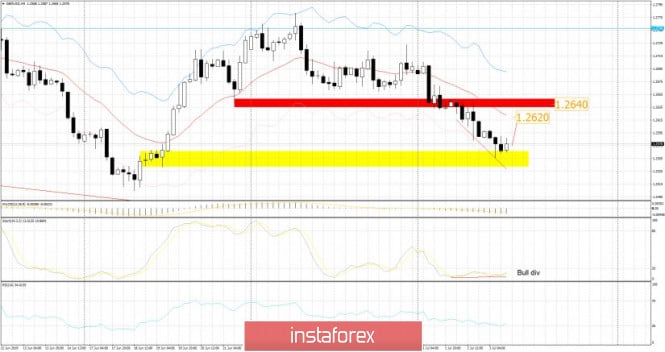
| GBP/USD 07.03.2019 - Oversold condiiton, possible bullish movement Posted: 03 Jul 2019 07:38 AM PDT Industry news:
The Institute for Supply Management on Wednesday announced that the Non-Manufacturing PMI in June fell to 55.1 from 56.9 in May and fell short of the market expectation of 55.9. With the initial reaction, the US Dollar Index edged lower slightly and was last down 0.07% on the day at 96.67. This is the index's lowest reading since July 2017, when it registered 55.1 percent. The Non-Manufacturing Business Activity Index decreased to 58.2 percent, 3 percentage points lower than the May reading of 61.2 percent, reflecting growth for the 119th consecutive month," the ISM said in its press release. Trading recommendation:
GBP has been trading sideways in past 12 hours at the price of 1.2580. Since, the balance came after the downward trend, it can represent the exhaustion from sellers. My advice is to watch for potential buying opportunities. Yellow rectangle – Support zone (1.2566-1.2540) Red rectangle- Resistance (1.2640) Red line – 20 EMA Stochastic oscillator is showing us that there the oversold condition and the bullish divergence, which is sign that selling at this area looks risky. RSI oscillator went also at the level 30 and it is flipping up, which is another sign that bullish wave may come. As long as the GBP is trading above the 1.2540, you should watch for buying opportunities. Upward targets are set at the price of 1.2620 and 1.2640. The material has been provided by InstaForex Company - www.instaforex.com |
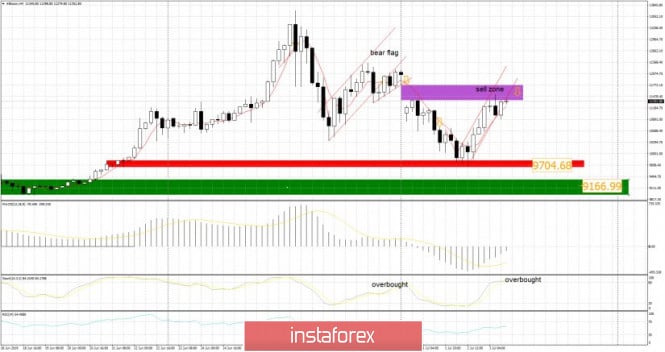
| BTC 07.03.2019 - Broken bear flag, more downside yet to come Posted: 03 Jul 2019 07:13 AM PDT Industry news: CME's bitcoin futures product is continuing to show signs of increased popularity, with June setting a new record for open interest amid a surge of new account sign-ups. More than 2,960 accounts have traded CME Group's bitcoin (BTC) futures across all client types and time zones since launch, according to new data from the derivatives marketplace. In 2019 alone, there has been more than 950 new accounts created, marking a 30 percent increase in total client sign-ups. The more potential liquidity doesn't mean more volatility, I also see it like more stability in the price. Trading recommendation:
BTC did trade higher in past 24 hours and the price tested the level of $11.500 (strong resistance). I see further downside potential on the BTC. Purple rectangle – Gap zone resistance $11.500-$11.800 Red rectangle- Support 1 ($9.705) Green rectangle – Support 2 ($9.166) Red trendlines – Bear flag Very interesting spot on BTC at $11.225, since there is the strong resistance (purple rectangle) and broken bear flag on the h4 time-frame. Additionally, there is the overbought condition on the Stochastic oscillator, which is sign that up cycle is probably finished and that BTC may start new down cycle. MACD is still in negative territory, below the zero line. As long as the BTC is trading below the $11.800, you should watch for selling opportunities on the rallies. First downward target is set at the price of $9.700. The material has been provided by InstaForex Company - www.instaforex.com |
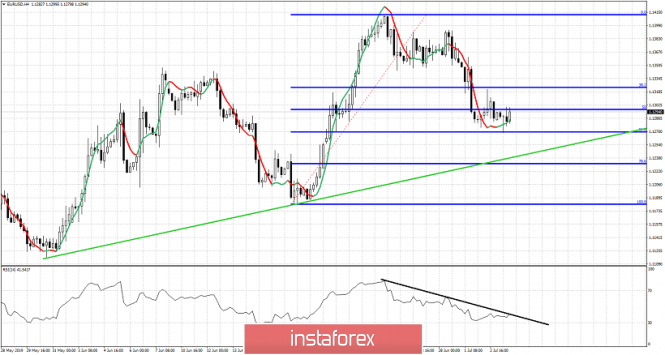
| EURUSD remains in a bearish short-term trend but is close to giving a bullish reversal signal Posted: 03 Jul 2019 07:01 AM PDT EURUSD is trading right below 1.13 making lower lows and lower highs in the short-term. A break above 1.1310 and most importantly above 1.1322 will give us a short-term bullish signal. We keep a close eye on the RSI as a break above the black downward sloping resistance trend line is what we look for an entry on the bullish side of EURUSD.
Green line - support trend line EURUSD has reached as expected the 61.8% Fibonacci retracement and made new lows today providing a small bullish divergence. If bulls manage to break short-term resistance at 1.1310-1.1322 area we could see a tradeable reversal signal if combined with an RSI break of the resistance trend line. This bullish sign could be short-term but could also provide a thrust for a move above 1.14-1.1450. Longer-term bulls do not want to see price break below green trend line and most importantly below 1.1180. Bears do not want to see price break above 1.1390. The material has been provided by InstaForex Company - www.instaforex.com |
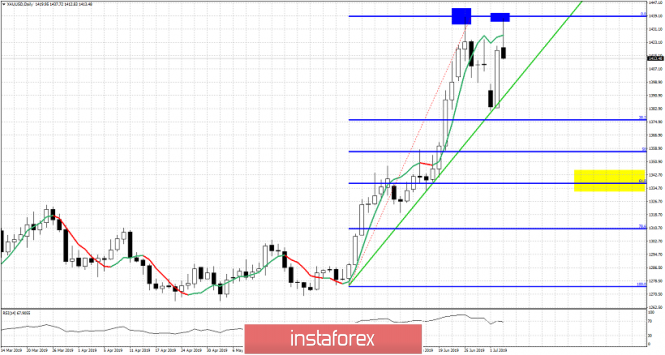
| Gold price bounces as expected but gets rejected at previous highs Posted: 03 Jul 2019 06:53 AM PDT Gold price not only bounced towards $1,400 as initially expected, price reached the 2019 highs but got rejected. Gold price has made a double top and under certain circumstances we could see this decline to continue towards $1,335.
Green line - major support trend line Yellow rectangle - target if support fails to hold Gold price is trading near $1,415 after reaching $1,437. Price made a double top and is showing rejection and reversal signs. Support is at the green trend line at $1,393. Breaking below this level will increase dramatically the chances of moving towards the 61.8% Fibonacci retracement level around $1,335. Breaking below $1,384 will confirm this view. On the other hand as long as price is above $1,400-$1,393 the bullish scenario for an immediate move to $1,500 is still open. The material has been provided by InstaForex Company - www.instaforex.com |
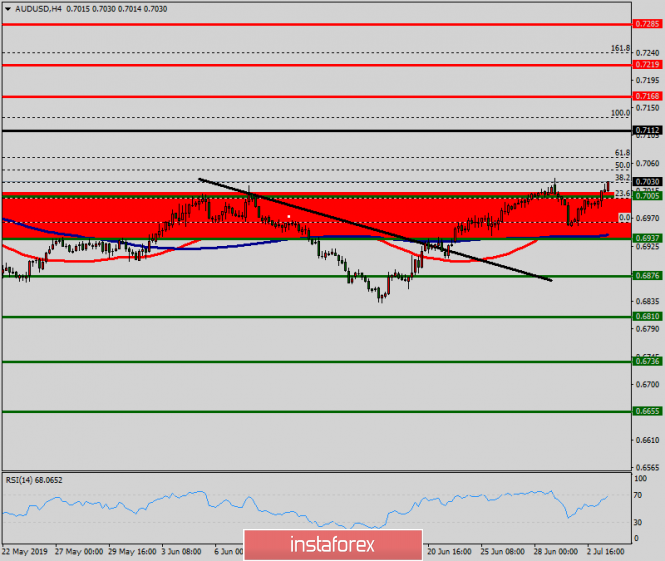
| Technical analysis of AUD/USD for July 03, 2019 Posted: 03 Jul 2019 06:45 AM PDT The AUD/USD pair is set above strong support at the levels of 0.6876 and 0.6810. This support has been rejected four times confirming the uptrend. The major support is seen at the level of 0.6810, because the trend is still showing strength above it. Accordingly, the pair is still in the uptrend in the area of 0.6810 and 0.6876. The AUD/USD pair is trading in the bullish trend from the last support line of 0.6876 towards thae first resistance level of 0.6937 in order to test it. This is confirmed by the RSI indicator signaling that we are still in the bullish trending market. Now, the pair is likely to begin an ascending movement to the point of 0.6937 and further to the level of 0.7005. The level of 0.7005 will act as the major resistance and the double top is already set at the point of 0.7005. At the same time, if there is a breakout at the support level 0.6810, this scenario may be invalidated. The material has been provided by InstaForex Company - www.instaforex.com |
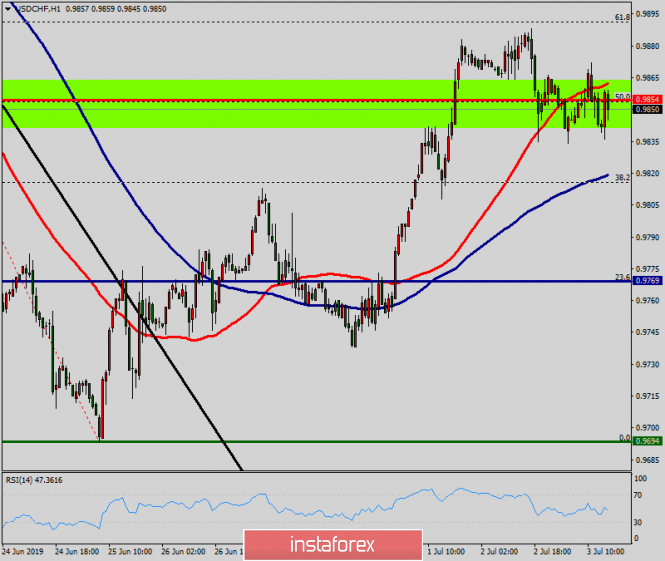
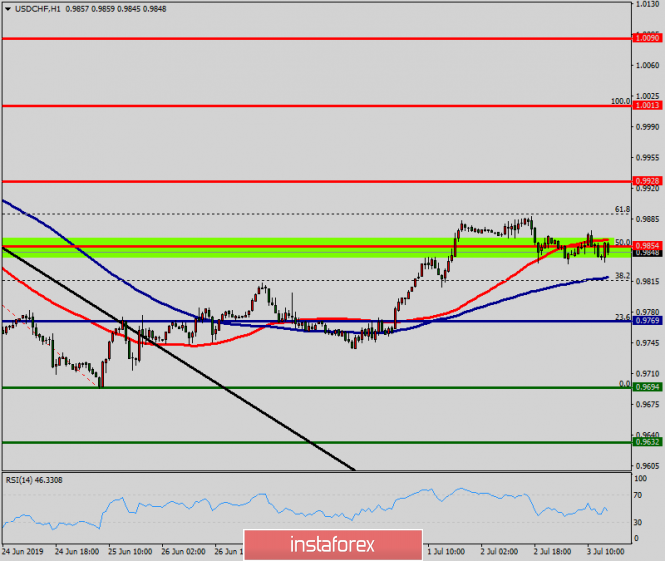
| Technical analysis of USD/CHF for July 03, 2019 Posted: 03 Jul 2019 06:28 AM PDT The USD/CHF pair fell sharply from the level of 0.9854 towards 0.9694. Now, the price is set at 0.9748. The resistance is seen at the level of 0.9854 and 0.9928. Moreover, the price area of 0.9854 and 0.9928 remains a significant resistance zone. Therefore, there is a possibility that the USD/CHF pair will move downside and the structure of a fall does not look corrective. The trend is still below the 100 EMA for that the bearish outlook remains the same as long as the 100 EMA is headed to the downside. Thus, amid the previous events, the price is still moving between the levels of 0.9770 and 0.9694. If the USD/CHF pair fails to break through the resistance level of 0.9770, the market will decline further to 0.9694 as as the first target. This would suggest a bearish market because the RSI indicator is still in a negative spot and does not show any trend-reversal signs. The pair is expected to drop lower towards at least 0.9632 so as to test the daily support 2. On the contrary, if a breakout takes place at the resistance level of 0.9854, then this scenario may become invalidated.
|
| EUR/USD: US and EU are on the verge of a trade war that could escalate into a currency war Posted: 03 Jul 2019 05:46 AM PDT
While the single European currency "digests" the news about the possible expansion of import duties on goods from the EU by the United States, as well as about Italy's readiness to reduce the size of the state budget deficit, distribution of key posts is in full swing in the Old World. As previously expected, the position of head of the ECB will be a kind of consolation prize and can go to the Managing Director of the IMF Christine Lagarde. According to experts of Morgan Stanley, if she will replace Mario Draghi, then there will be another round of quantitative easing (QE) in the EU. According to experts, despite the fact that Lagarde has no experience in the banking system, she can cope with the role of a "firefighter" in difficult economic conditions. It is not clear what the ECB can do in the first place – to revive QE or lower rates, but if Brussels does not want to aggravate relations with Washington, the first option is the most profitable. The reduction of rates by the ECB may serve as a reason for Donald Trump's accusations of the European regulator in currency manipulation. The White House has already announced the expansion of the list of goods (from $17 billion to $21 billion) supplied to the United States from the EU and subject to potential duties in connection with the case of allegedly illegal subsidies to Airbus. Thus, Washington and Brussels are on the verge of a trade war, which could turn into a currency war. Yesterday, it became known that Italy, seeking to avoid EU sanctions, decided to reduce the budget deficit from 2.4% to 2.04% of GDP. Reducing political risks in the Old World is an important factor in supporting the single European currency, but when it comes to divergence in monetary policy, it is relegated to the background. Barclays believes that the Fed has much more room for maneuver than the ECB, whose ability to further stimulate economic growth in the eurozone seems limited. "We believe that the Fed will reduce the interest rate three times – by 75 basis points. The ECB will reduce the rate on deposits also three times, but only by 30 basis points," Barclays strategists said. They expect the EUR/USD pair to drop to 1.11 by the end of this year, fall to 1.08 in the first quarter of 2020, and fall to 1.06 in the second. The bank notes that Brexit, the fiscal sustainability of Italy, as well as the possibility of introducing new duties on European goods by Donald Trump suggest risks that the scale of the fall of the EUR/USD pair will be more significant. The material has been provided by InstaForex Company - www.instaforex.com |
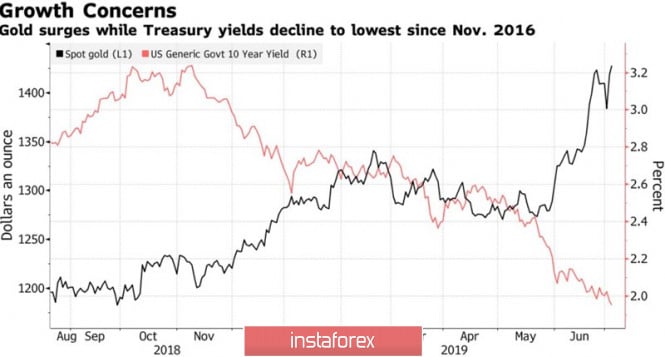
| Posted: 03 Jul 2019 05:45 AM PDT When failures are so quickly redeemed, as in the case of gold in early July, there is no doubt – the market is under the total control of the bulls. They raised the XAU/USD quotes to the maximum level for the last 6 years. It was their activity that allowed ETF reserves to grow for 14 consecutive days and reach their peak in 2013. In this regard, the worst daily dynamics of precious metals for more than a year after the announcement of the results of the G20 summit only pleased buyers. They had an excuse to buy something cheap. The de-escalation of the US-China trade conflict has increased global risk appetite and put pressure on safe-haven assets. The States abandoned their idea to impose duties on all imports of China and made concessions for Huawei, and Beijing promised to buy more American agricultural products. Opponents returned to the negotiating table, and the yield of 10-year Treasury bonds seems to be firmly entrenched above the psychologically important level of 2%. Bad news for gold, which does not bring interest income and is not able to compete with debt obligations in the event of an increase in interest rates on them. As further events have shown, the joy of the "bears" was short-lived. Investors digested the information received from the G20 summit and came to the conclusion that before the end of the US-China trade war, a lot of water will leak. In addition, the States intend to deploy military action in the other direction and attack Europe. In connection with the illegal subsidizing of Airbus, Washington intends to increase the number of duties on European imports from $17 billion to $21 billion, and these are just flowers. Berries will begin later when the issue of tariffs for the import of cars from the Old to the New World will be considered. Protectionism continues to walk through the world, which increases the risk of a recession and contributes to the decline in bond yields. Dynamics of gold and US bond yields
The central banks are also forced to respond to signs of a targeting recession. The RBA has twice reduced the cash rate to a record low of 1% and, according to Black Rock's largest asset manager, could raise the rate to 0.5% in 2020. Mark Carney warns of a serious slowdown in the British economy in the case of disorderly Brexit, and representatives of the ECB talk about the feasibility of resuscitation QE. The possible appointment of Christine Lagarde as head of the European Central Bank added fuel to the fire. The French woman in 2014 urged the Governing Council to buy assets. Low rates of the global debt market are the guiding star of gold. They allow the "bulls" on XAU/USD to turn a blind eye to such negative drivers for them as the stability of the US dollar and the rally of US stock indices. Technically, after the precious metal reached the target by 161.8% on the pattern AB=CD, a natural rollback to 23.6% of the CD wave followed. The inability of the "bears" to gain a foothold below this level indicates their weakness. Updating the June high will allow the bulls to continue the attack. Its target is the level of 200% for the model AB=CD. The material has been provided by InstaForex Company - www.instaforex.com |
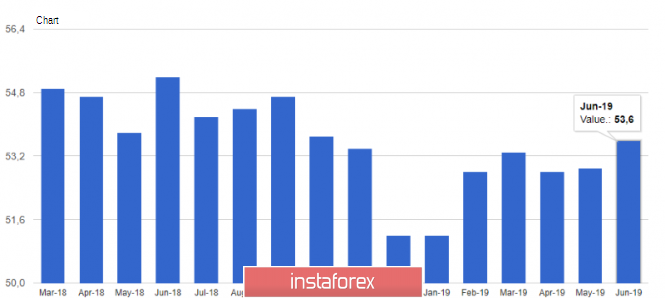
| Posted: 03 Jul 2019 05:40 AM PDT The euro remained to trade in a narrow side channel paired with the US dollar after the release of reports on the PMI index for the sphere of servants of the eurozone, which grew. This allowed the bulls to strengthen the defense level of 1.1275 and prevent a new wave of lower risk assets. According to data, the purchasing managers' index (PMI) for Italy rose to 50.1 points in June, while in May it was 50.0 points exactly. Economists had expected the index to fall to 49.9 points, which would indicate a reduction in activity. In France, the similar purchasing managers' index for the service sector continued to grow in June and amounted to 52.9 points against 51.5 points in May. However, economists were counting on a more powerful fortification in the area of 53.1 points. In Germany, everything is also in order with the sphere of services. There, the purchasing managers' index (PMI) strengthened in June to 55.8 points against 55.4 points in May, while the forecast was 55.6 points. All this had a positive effect on the overall indicator for the euro area, which in June was 53.6 points, whereas in May it was at the level of 52.9 points. The data exceeded the forecasts of economists, who expected the growth of the eurozone service sector to 53.4 points. Despite the good performance in terms of activity, the euro's response to the data was very restrained. Today, there was news that the current CEO of the International Monetary Fund, Christine Lagarde, will definitely be appointed to the new president of the European Central Bank. Let me remind you that the term of Mario Draghi as president of the ECB expires on October 31 and cannot be extended. Lagarde's appointment to this post was unexpected since she has no experience in the field of monetary policy, which cannot be said about other candidates who are more closely connected with the financial sphere. It can be concluded that all key decisions on the planned interest rate reduction in the euro area and the return of the bond redemption program can be made until October of this year, and the new ECB head will not interfere with these decisions at the beginning of his work. As for the technical picture of the EURUSD pair, the bears did not succeed in breaking through the support of 1.1275, and therefore the entire emphasis remains precisely at this level. Only a breakdown of the range of 1.1275 will lead to a larger downward bearish impulse paired with an exit to the lows of 1.1240 and 1.1200. In the upward correction scenario, a large resistance is seen in the maximum area of 1.1340. The British pound is expected to fall against the US dollar after it became known that the UK economy continues to experience difficulties. According to the results of surveys of supply managers, the uncertainty associated with Brexit affects the activity in the UK services sector, which is the mainstream economy. According to the report, purchasing managers' index (PMI) for services fell to 50.2 points in June from 51.0 points in May, which indicates a very high probability of stagnation. Let me remind you that the index value above 50 keeps the growth of activity. In IHS Markit noted that the sharp decline is directly related to the uncertainty around Brexit, which will further contribute to slowing the growth of the country's economy. The material has been provided by InstaForex Company - www.instaforex.com |
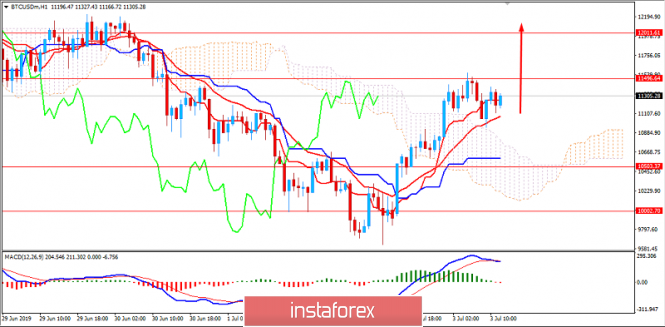
| BITCOIN to establish a strong bullish trend again? July 3, 2019 Posted: 03 Jul 2019 05:33 AM PDT Bitcoin bounced off the $10,000 area. The price struggled to regain momentum earlier after rejecting off the $13800 area. The long-awaited correction target of thirty percent has been hit but yet again, Bitcoin has shown monumental resilience bouncing back by over $1,800 in a matter of hours. A buying frenzy at four figures resulted in a return above $11,000 as the correction seemingly came and went in one quick flash. The correction after the rejection off the $13800 gathered pace over the weekend and into this week with Crypto markets tumbling over $80 billion. The 30 percent figure has been bandied about for some time now as there have been eight corrections of similar magnitude during the last uptrend. Despite certain criticism, Bitcoin is gradually emerging as a reliable store of value regardless of historical price fluctuations. Overall, the sentiment is shifting, and bears may reverse gains. Posting superior gains in the first half of the year, buyers will be back in control if there are upsurges above $14,000. The price of Bitcoin is trapped by the dynamic level of 20 EMA, Tenkan and Kijun line as support which also broke above the Kumo Cloud resistance area. The price rejected off the $11,500 area but the pullback was not quite deep. Though $11,500 and $12,000 area may act as strong resistance, the price is expected to push higher towards $14,000 area. if Bitcoin breaks this level, it is likely to reach $15,000 and $20,000. TRADE RECOMMENDATIONS: Now Bitcoin is under the bulls' control. A break above $11,500 is more preferred. The bullish bias is currently quite strong and expected to sustain but corrections could bring better entries with lower risk and higher reward. SUPPORT: 10000, 10500, 11,000 RESISTANCE: 11500, 12000, 13000, 14000 BIAS: BULLISH MOMENTUM: NON-VOLATILE
|
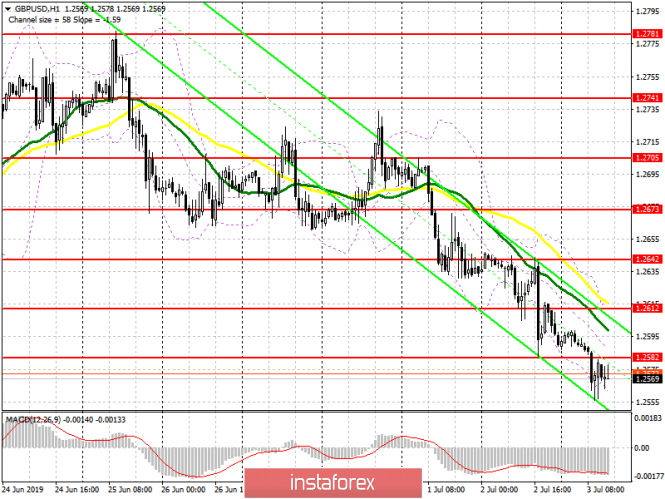
| Posted: 03 Jul 2019 04:55 AM PDT To open long positions on GBP/USD, you need: The bear market continues to dominate, and a weak report on the service sector has helped sellers today. Today, in the afternoon, pound buyers need to return to the level of 1.2582, which was broken at the European session. Only after that, it will be possible to expect a correction upwards and an update of the highs of 1.2612 and 1.2642, where I recommend fixing the profit. In the scenario of further decline of the pound on the trend, it is best to look at long positions only after the test of the minimum of 1.2544 or buy GBP/USD on the rebound from the large support of 1.2513. To open short positions on GBP/USD, you need: Bears will expect a good report on the US labor market, which will lead to the formation of a false breakout in the resistance area of 1.2582 and a further decline in GBP/USD to the lows of 1.2544 and 1.2513, where I recommend taking the profits. If buyers are able to take advantage of the temporary weakness of the US dollar and return to the resistance of 1.2582, it is best to return to short positions on the rebound from the resistance of 1.2612 or even higher – from the maximum of 1.2642. Indicator signals: Moving Averages Trading is below 30 and 50 moving averages, indicating a further decline in the pound. Bollinger Bands The growth of the pair will be limited by the upper limit of the indicator around 1.2612.
Description of indicators
|
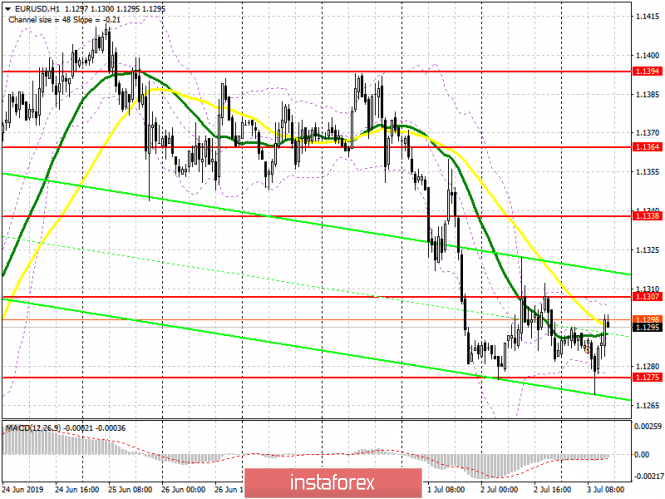
| Posted: 03 Jul 2019 04:55 AM PDT To open long positions on EURUSD, you need: In the morning, I drew attention to the support level of 1.1275, on which the further movement of the euro is directly depended. The formation of a false breakout on it, along with a good report on the eurozone service sector, allowed buyers to return to the market. At the moment, the task of the bulls is to break and consolidate above 1.1307, which will lead to further growth of EUR/USD with the update of the highs of 1.1338 and 1.1364, where I recommend taking the profit. If the bears will return to the market and will be able to break below the support of 1.1275, it is best to consider long positions to rebound in the area of a minimum of 1.1239. To open short positions on EURUSD, you need: Like yesterday, the bears will try to form a false breakout in the resistance area of 1.1307, and a return under it in the afternoon will be a signal for the continuation of the downward trend, which will push EUR/USD to the low area of 1.1275 and will lead to the renewal of a larger support of 1.1239. If the demand for the euro continues after a weak labor market report, the upward potential will be limited by the resistance of 1.1338. In case of a breakthrough, this range can be sold immediately to the rebound from the maximum of 1.1364. Indicator signals: Moving Averages Trading is conducted in the area of 30 and 50 moving averages, which indicates market uncertainty with a small margin of euro sellers. Bollinger Bands The growth of EUR/USD is limited by the upper limit of the indicator in the area of 1.1310. A breakthrough in this area could lead to a larger euro growth in the afternoon.
Description of indicators
|
| Investment attractive: lightcoin was in the top picks Posted: 03 Jul 2019 03:17 AM PDT
According to a number of experts, the investment appeal of lightcoin (LTC) has increased significantly. The reason for this is that the experts believe the upcoming cryptocurrency halving is a decrease in the miner's reward for the coin block by half. Note that halving is recognized as the best prerequisite to the rise in price of a digital asset. In the cryptocurrency sphere, the notion of halving is mainly applied to Bitcoin. However, in the near future, lightcoin will be subjected to this procedure. In a cryptocurrency environment, the concept of "halving" denotes the process of complicating the extraction of virtual currency by reducing the miner rewards by half. At the same time, halving is a stimulant that pushes miners to modernize their own mining equipment. According to analysts, at the moment, LTC has excellent prospects for growth. Earlier, in May of this year, the cryptocurrency demonstrated a fantastic rise. Its price soared to a dizzying 11,000%, although in a few minutes the digital asset was waiting for a decline. At that time, Litecoin course instantly jumped to the level of $10,000, and then returned to the previous figures of $90. Since the beginning of this year, the cost of the fourth cryptocurrency capitalization has increased several times. The LTC rate has updated the annual maximum, an increase of 317% since January 2019. At the beginning of the year, Altcoin was trading at $30, and now it is $120.90. Most professionals assess the overall condition of a digital asset as excellent, attractive from an investment point of view. Weiss Ratings experts raised the cryptocurrency rating to "B". Analysts note the growing interest in Litecoin and the high technical level of this asset, which is supported by effective developer standards. Weiss Ratings experts noted the high investment attractiveness of lightcoin, and the ratio of risk to potential profitability of a digital asset was rated "B-". The key role here was played by the coming halving, which will take place in almost a month. Over the past three months, the price of LTC has increased by 104%. Experts believe that before the halving cryptocurrency will grow, and it may collapse after. Nevertheless, market players are counting on the realization of a positive scenario and are ready to invest in this dynamic altcoin. The material has been provided by InstaForex Company - www.instaforex.com |
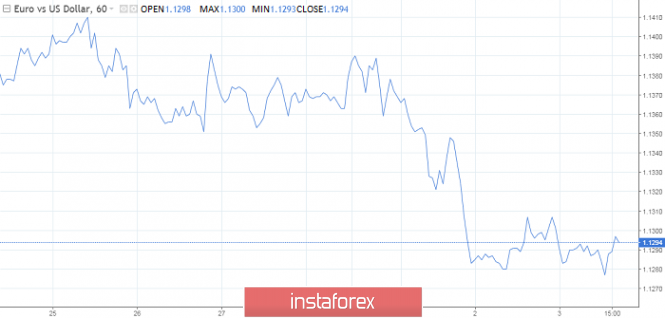
| Posted: 03 Jul 2019 03:00 AM PDT Once again, the dollar was under pressure because of hopes for at least a temporary trade deal between the United States and China faded and restored the demand for safe assets. The yield on US government bonds fell to the lowest levels since the end of 2016, following the British bonds, which are under pressure from the loud comments of the head of the Bank of England Mark Carney. Against a basket of six major currencies, the dollar index fell slightly to 96.697 points. The pound remained stable at $1.2592 after a decline of 0.35% a day earlier, when it reached a two-week low of $.2584. Mark Carney said that the global trade war and the distressed Brexit increases the risks for the British economy, which may need additional help to cope with the crisis. The dollar against the yen fell by 0.3% to 107.580 yen, after reaching a 12-day high of 108.535 yen at the beginning of the week. The euro has stabilized and is trading at $1,1291 after a volatile session on Tuesday when it fluctuated between a minimum of 1.1275 dollars and a maximum of 1.1322 dollars. The single currency has risen after the media reported that the ECB plans to cut interest rates at a meeting in July. However, the mood changed later after IMF Managing Director Christine Lagarde, who adheres to the "dovish" strategy, was nominated for the post of head of the ECB. True, the basic "needs" of the eurozone will remain the same - it needs higher incomes and a weaker currency, therefore, the ECB is unlikely to expect dramatic policy changes even with Lagarde. The Australian dollar remained at the same level of 0.6991 to the US dollar. Recall that the Australian rose after the Reserve Bank of Australia cut interest rates but offered a more balanced outlook. At the G20 summit in Japan, Washington and Beijing agreed to resume trade negotiations after US President Donald Trump offered concessions. Yet, investors are cautious about the chances of resolving a trade dispute between the two largest economies in the world, especially given Trump's recent breakdown of negotiations and comments that any deal not in favor of the US should be rejected. The general background was also overshadowed by Washington's threat of additional duties on goods from the European Union in the amount of $4 billion during a long-standing dispute over aircraft subsidies. |
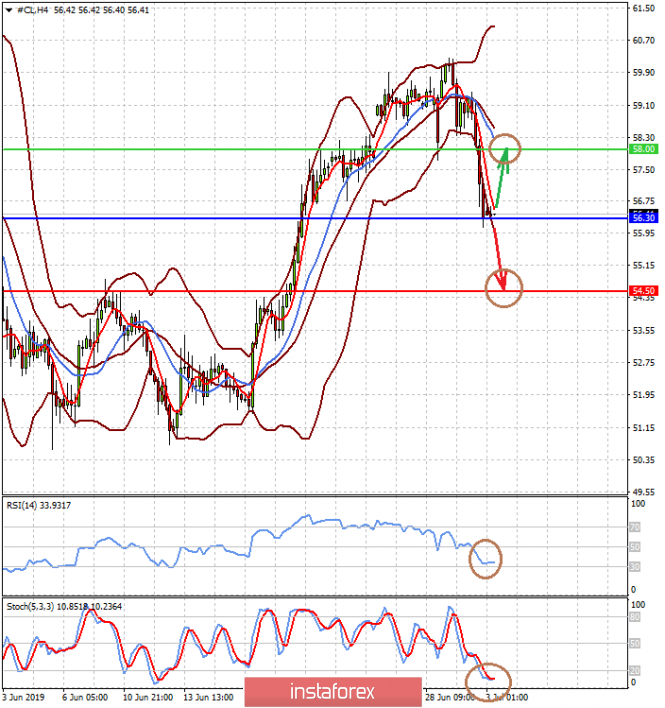
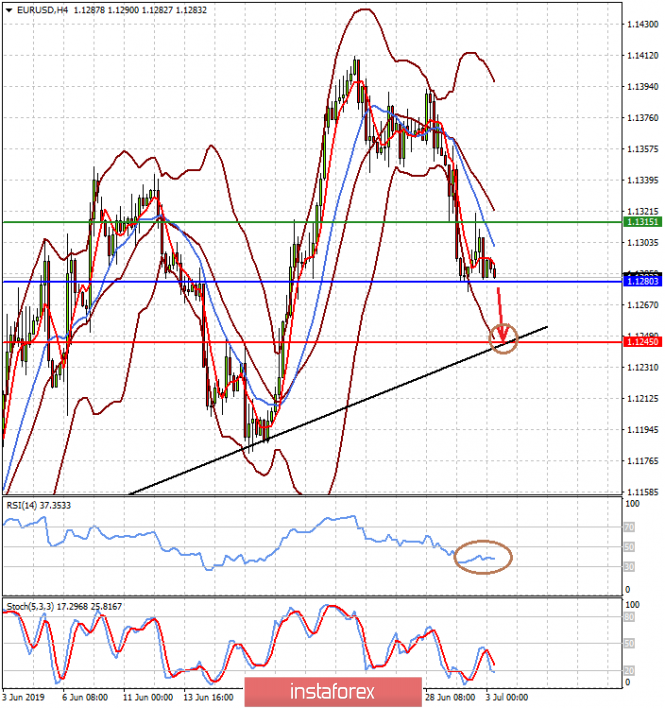
| Posted: 03 Jul 2019 02:26 AM PDT While investors around the world are weighing up the results of the G20 summit and trying to understand what is waiting for them in the near foreseeable future, the quotes of "black gold" have collapsed almost 5.0% in Britain and the US. The meeting of the Chinese and American leaders in the G-20 somewhat reassured investors but did not bring more clarity than expected. In the wake of a slight decrease in tension, stock markets, as well as currency, began to consolidate in anticipation of a new piece of economic data, as well as expectations of meetings of the world Central Bank. Above all, in order to understand the changes in the US monetary policies, negative economic trends in China, Europe and already in the States should be expected. Meanwhile, as it may seem at first glance, the quotes of crude oil on Tuesday ended in Britain and the United States by almost 5.0%. And all this happened against the backdrop of the achievement of a new agreement by OPEC + to reduce the volume of crude oil production, which is aimed at keeping prices at the highest possible levels. Hence, it scared the markets. Is it because the extension of the agreement for the next nine months half a year ago would have been perceived with a bang and prices would have crawled upwards? On the one hand, we believe that the reason for this steady growth in both traditional and shale oil production in the United States, which actually indicates the continuation of the process of conquering a larger and larger share of the oil market in the world by the Americans. In the long run, this can reduce OPEC share to small values. On the other hand, the slowdown in economic growth in China, Europe, and the United States threatens the prospects for a fall in demand for this commodity asset. Oil prices would have fallen long ago to the minimum values of 2016 if they were not artificially restrained by OPEC + policies. Given the emerging market situation, we believe that price increases will continue to be limited. At best, they will consolidate at about current levels, occasionally growing upward nervously and then falling. Forecast of the day: The price of WTI crude oil found support at 56.30 and it can bounce up to 58.00 if the published data on stocks of petroleum and petroleum products in the United States show a decline. But still, the risk of continuing price fall remains if the values show an increase in stocks. In this case, the price will break through support at 56.30 and rush to 54.50. The EUR/USD pair is consolidating above 1.1280. We expect its decline to continue towards 1.1245 after overcoming the level of 1.1280.
|
| You are subscribed to email updates from Forex analysis review. To stop receiving these emails, you may unsubscribe now. | Email delivery powered by Google |
| Google, 1600 Amphitheatre Parkway, Mountain View, CA 94043, United States | |






No comments:
Post a Comment