
Forex analysis review |
- Fractal analysis of major currency pairs on July 10
- USDX: Arguments for further dollar declines
- Everything suggests that oil prices will continue to grow
- In search for a low: Catch the pound at $1.20
- Gold is unlikely to guess what the Fed's intentions are, but in any case it will not lose
- EUR/USD: the dollar froze in anticipation, the euro falls on the dovish intentions of the ECB
- GBP/USD. July 9th. Results of the day. Laborites leader Jeremy Corbyn wants to maintain EU membership
- EUR/USD. July 9th. Results of the day. Traders calmly and leisurely buy dollars on the eve of several Powell speeches this
- EURUSD shows short-term reversal warnings
- Gold price continues to respect short-term support
- EUR/USD analysis for July 09,2019 - Bullish diverrgence on the oscillators
- July 9, 2019 : EUR/USD Intraday technical analysis and trade recommendations.
- July 9, 2019 : GBP/USD demonstrating early bullish rejection around 1.2444.
- Gold 07.09.2019 - Potential retracement before new wave down
- BTC 07.09.2019 - Intraday sell zone at $12.375-$12.440
- GBP/USD: plan for the American session on July 9. The pound continues to fall after the publication of the next poll
- EUR/USD: plan for the American session on July 9. The euro continues to move down before the performance of Powell
- The dollar is waiting for signals from the head of the Fed
- Technical analysis of GBP/USD for July 09, 2019
- Oil is looking for clues to the dollar
- The euro and the pound are waiting for new lows, the dollar jumped amid changes in the Fed rate
- Technical analysis of EUR/USD for July 09, 2019
- BITCOIN to bounce off $12,000 aiming for new highs? July 9, 2019
- Prospects: Good ones! Oil can rise by the end of the year
- Focus of the market will be on Powell's performance in the Senate today (There is a high probability of falling EUR/USD and
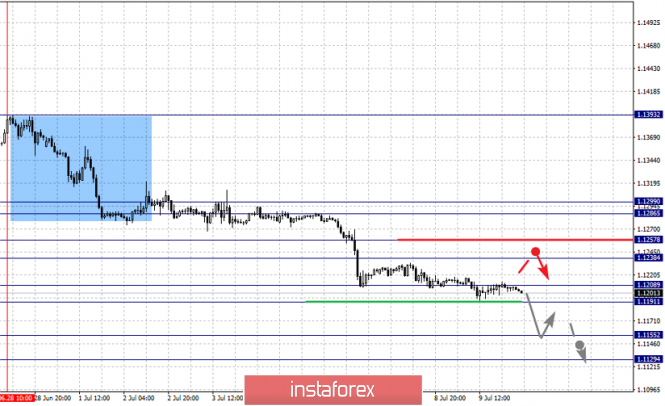
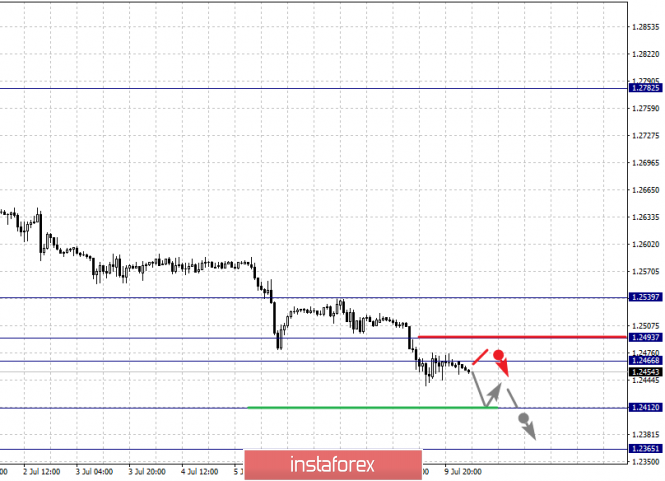
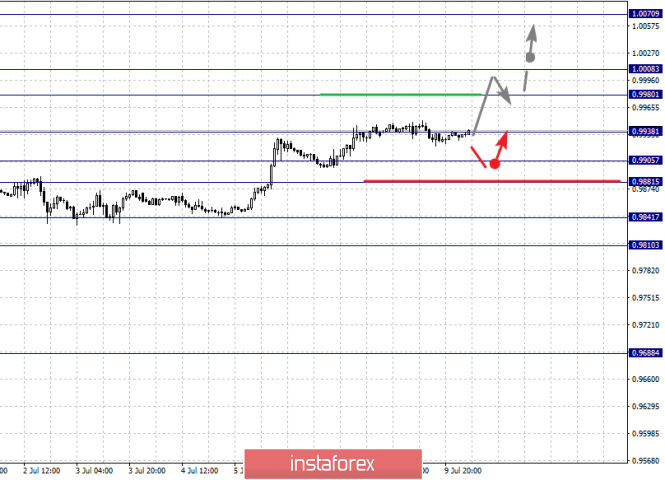
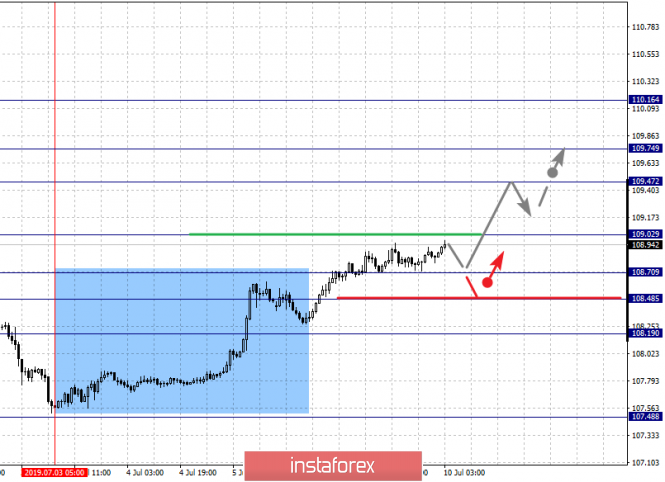
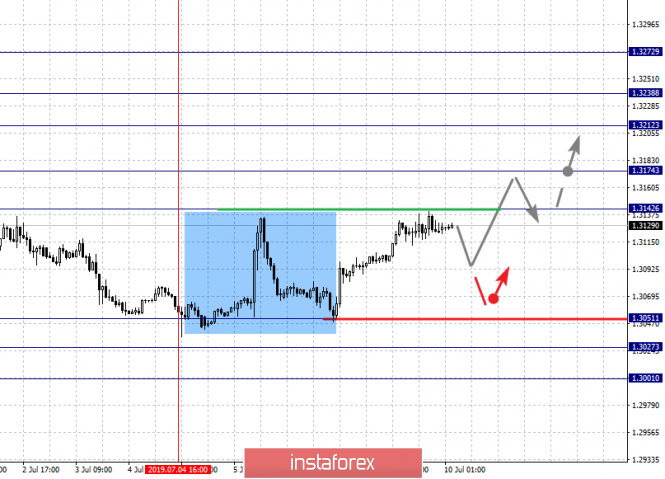
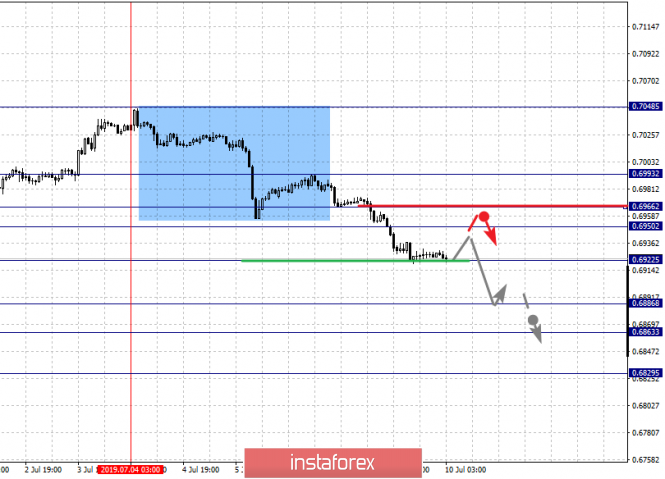
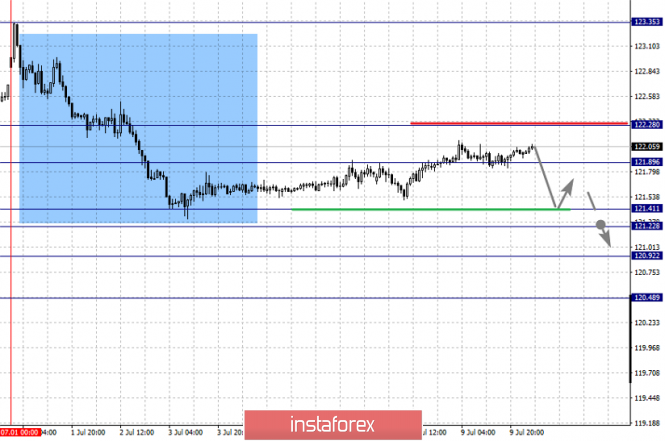
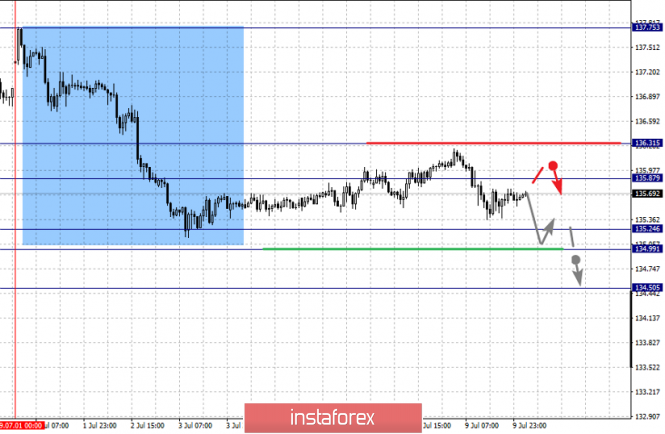
| Fractal analysis of major currency pairs on July 10 Posted: 09 Jul 2019 06:07 PM PDT Forecast for July 10: Analytical review of H1-scale currency pairs: For the euro / dollar pair, the key levels on the H1 scale are: 1.1299, 1.1286, 1.1257, 1.1238, 1.1208, 1.1191, 1.1155 and 1.1129. Here, we continue to monitor the downward structure of June 28. The consolidated movement is expected in the range of 1.1208 - 1.1191. The breakdown of the last value should be accompanied by a pronounced downward movement. Here, the target is 1.1155. We consider the level of 1.1129 to be a potential value for the bottom. After reaching this level, we expect a rollback to the top. Short-term upward movement is possible in the range of 1.1238 - 1.1257. The breakdown of the latter value will lead to in-depth correction. Here, the target is 1.1286. The range of 1.1286 - 1.1299 is a key support for the downward structure. The main trend - a local downward structure of June 28. Trading recommendations: Buy 1.1238 Take profit: 1.1255 Buy 1.1258 Take profit: 1.1285 Sell: 1.1208 Take profit: 1.1192 Sell: 1.1189 Take profit: 1.1155 For the pound / dollar pair, the key levels on the H1 scale are: 1.2539, 1.2493, 1.2466, 1.2412 and 1.2365. Here, we are following the development of the downward structure of June 25th. At the moment, we expect a movement to the level of 1.2412. For the potential value for the bottom, we consider the level of 1.2365. The movement to which is expected after the breakdown of the level of 1.2410. Short-term upward movement is expected in the range of 1.2466 - 1.2493. The breakdown of the last value will lead to a prolonged correction. Here, the target is 1.2539. This level is a key support for the downward structure. The main trend - the downward structure of June 25. Trading recommendations: Buy: 1.2466 Take profit: 1.2490 Buy: 1.2495 Take profit: 1.2538 Sell: 1.2412 Take profit: 1.2467 Sell: 1.2464 Take profit: 1.2367 For the dollar / franc pair, the key levels on the H1 scale are: 1.0070, 1.0008, 0.9980, 0.9938, 0.9905, 0.9881, 0.9841 and 0.9810. Here, we continue to follow the development of the ascending cycle of June 25. The continuation of the movement to the top is expected after the breakdown of the level of 0.9938. In this case, the target is 0.9980. Price consolidation is in the range of 0.9980 - 1.0008 and hence, there is a high probability of going into a correction. For the potential value for the top, we consider the level of 1.0070. Short-term downward movement is possible in the range of 0.9905 - 0.9881. The breakdown of the last value will lead to a prolonged correction. Here, the target is 0.9841. This level is a key support for the top. Its price will have the formation of the initial conditions for the downward cycle 0.9810. The main trend is the ascending cycle of June 25. Trading recommendations: Buy : 0.9939 Take profit: 0.9980 Buy : 0.9982 Take profit: 1.0008 Sell: 0.9905 Take profit: 0.9883 Sell: 0.9878 Take profit: 0.9844 For the dollar / yen pair, the key levels on the scale are : 110.16, 109.74, 109.47, 109.02, 108.70, 108.48 and 108.19. Here, the subsequent targets for the upward trend, we have determined from the local ascending structure on July 3. The continuation of the movement to the top is expected after the breakdown of the level of 109.02. In this case, the target is 109.47. Short-term upward movement, as well as consolidation is in the range of 109.47 - 109.74. For the potential value for the top, we consider the level of 110.16. After reaching which, we expect a rollback to the bottom. Short-term downward movement is possible in the range of 108.70 - 108.48. The breakdown of the latter value will lead to a prolonged correction. Here, the target is 108.19. This level is a key support for the top. The main trend: the ascending structure of June 25. Trading recommendations: Buy: 109.02 Take profit: 109.45 Buy : 109.48 Take profit: 109.72 Sell: 108.70 Take profit: 108.52 Sell: 108.46 Take profit: 108.20 For the Canadian dollar / US dollar pair, the key levels on the H1 scale are: 1.3272, 1.3238, 1.3212, 1.3174, 1.3142, 1.3051, 1.3027 and 1.3001. Here, the price forms the potential for an upward movement of July 4. The continuation of the movement to the top is expected after the breakdown of the level of 1.3142. In this case, the target is 1.3174, wherein consolidation is near this level. The breakdown of the level of 1.3175 will lead to a pronounced movement. Here, the target is 1.3212. A short-term upward movement, as well as consolidation is in the range of 1.3212 - 1.3238. For the potential value for the top, we consider the level of 1.3272. After reaching which, we expect a rollback to the bottom. The level of 1.3051 is a key support for the ascending structure. Its breakdown will lead to movement to level 1.3027. For the potential value for the bottom, we consider the level of 1.3001. The main trend is the formation of potential for the upward trend of July 4. Trading recommendations: Buy: 1.3142 Take profit: 1.3172 Buy : 1.3176 Take profit: 1.3212 Sell: 1.3050 Take profit: 1.3028 Sell: 1.3025 Take profit: 1.3001 For a pair of Australian Dollar / US dollar, the key levels on the H1 scale are : 0.6993, 0.6966, 0.6950, 0.6922, 0.6886, 0.6863 and 0.6829. Here, we are following the development of the downward structure of July 4th. The continuation of the movement to the bottom is expected after the breakdown of the level of 0.6920. In this case, the target is 0.6886. Short-term downward movement, as well as consolidation is in the range of 0.6886 - 0.6863. For the potential value for the downward trend, we consider the level of 0.6829. After reaching which, we expect consolidation, as well as a rollback to the top. Short-term upward movement is possible in the range of 0.6950 - 0.6966. The breakdown of the last value will lead to a deep correction. Here, the target is 0.6993. This level is a key support for the downward structure. The main trend is the downward structure of July 4th. Trading recommendations: Buy: 0.6950 Take profit: 0.6965 Buy: 0.6968 Take profit: 0.6990 Sell : 0.6920 Take profit : 0.6888 Sell: 0.6885 Take profit: 0.6864 For the euro / yen pair, the key levels on the H1 scale are: 122.28, 121.89, 121.67, 121.41, 121.22, 120.92 and 120.48. Here, we continue to follow the downward cycle of July 1. At the moment, the price is in deep correction. The continuation of the movement to the bottom is expected after the price passes by the noise range 121.41 - 121.22. In this case, the target is the level of 120.92, and near this level, there is consolidation. For the potential value for the bottom, we consider the level of 120.48. After reaching which, we expect a rollback to the top. The consolidated movement is possible in the range of 121.89 - 122.28. The level of 122.28 is a key support for the downward structure. Its price passage will have to form the initial conditions for the upward cycle. The main trend is the downward cycle of July 1, the stage of deep correction. Trading recommendations: Buy: Take profit: Buy: 121.94 Take profit: 122.28 Sell: 121.22 Take profit: 120.94 Sell: 120.90 Take profit: 120.50 For the pound / yen pair, the key levels on the H1 scale are : 136.31, 135.87, 135.65, 135.24, 134.99 and 134.50. Here, we continue to monitor the downward cycle from July 1. At the moment, the price is in the correction zone. Short-term downward movement is expected in the range of 135.24 - 134.99. The breakdown of the last value will allow to expect movement towards a potential target - 134.50. After reaching this level, we expect a rollback to the top. Short-term upward movement is possible in the range of 135.87 - 136.31, and up to the level of 136.31, we expect the potential for the upward cycle to be formalized. The main trend is the downward cycle of July 1, the stage of correction. Trading recommendations: Buy: 135.90 Take profit: 136.30 Sell: 135.24 Take profit: 135.00 Sell: 134.95 Take profit: 134.50 The material has been provided by InstaForex Company - www.instaforex.com |
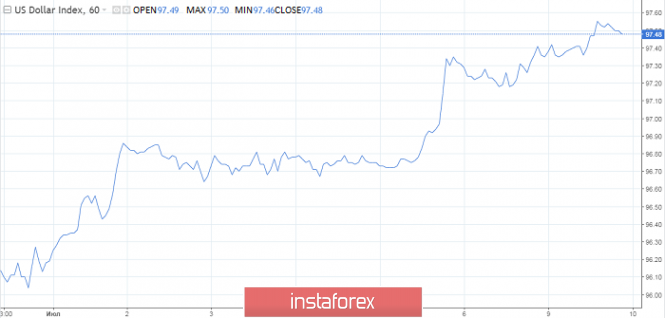
| USDX: Arguments for further dollar declines Posted: 09 Jul 2019 04:50 PM PDT Donald Trump constantly criticizes the Fed policy and strong dollar, in response to this, the US currency only increases in price, and the regulator demonstrates independence. It seems that the owner of the White House still managed to reach the dollar, the rate slipped from recent highs reached due to positive labor market data on Friday. Many analysts are now predicting a "smooth" but steady decline for the greenback. The WSJ dollar index, which measures the US currency against a basket of 16 competitors, retreated from highs by 1.1%. The dollar slowed down against six currencies. According to the CFTC and Scotiabank, net longs on the greenback fell to a year low. The dollar's fall may accelerate if in the coming months the Fed will ease monetary policy. Trimming the cost of lending in the United States, as a rule, reduces the attractiveness of the dollar in the eyes of investors who hunt for high returns. Strong employment figures gave some hope to the market. Traders are waiting for a less aggressive rate cut this year. To make sure of the desired, investors will pay special attention to the FOMC meeting minutes and data on inflation this week. By the way, on Tuesday, White House Economic Adviser Larry Cudlow said that the Fed has the opportunity to cancel the rate cut this summer. When making a decision, the regulator's officials will primarily be guided not by labor statistics, but by price indicators. "We see arguments in favor of a weaker dollar in the longer term, and perhaps the process has already begun. We still predict that the dollar rate will be lower with Trump's departure than after his election victory," Standard Chartered commented on the situation. What will be the second half of the year for the dollar? Since the Fed's signals of intention to pursue an active policy of mitigation are still relevant, the dollar will decline in the second half of this year. If the Fed suddenly resists a reduction in rates, then the market will quickly force it, as it did in December (the market collapsed, and the central bank began to implicitly ask for forgiveness). In the first months of this year, the most significant event in currencies was the stability of the dollar. This happened despite the sharp reversal of the Fed's plans - from being "hawkish" in late December to turning "dovish" with each subsequent meeting. The Fed has obviously gone too far with tightening. After receiving a forecast for the third quarter and beyond, after the June meeting, the market sensed that the regulator is signaling further aggressive easing. If, by the end of the current quarter, we see significant signs of weakening, the Fed will instantly reduce rates or even return to quantitative easing by the end of the year. There are opinions that reducing the rate of the Fed and the repetition of the beaten methods of quantitative easing is nothing but a waste of energy. The most effective medicine here is the fiscal policy proposed by Modern Monetary Theory (MMT). Whether the United States can quickly reorganize depends on whether Trump is able to conclude a truce with the Democratic House of Representatives and stop attempts at impeachment. An acute conflict will slow down the transition to a weaker dollar. The material has been provided by InstaForex Company - www.instaforex.com |
| Everything suggests that oil prices will continue to grow Posted: 09 Jul 2019 04:47 PM PDT The real cut in OPEC supplies and tensions in the Middle East outweighed fears of a possible decrease in oil demand. "Black gold" is actively going up, despite the trade dispute between the United States and China, which holds back the growth of the world economy and, accordingly, the demand for oil. OPEC, in partnership with Russia, agreed to extend the supply reduction agreement until March 2020. Brent crude rose 15 cents to 64.26 dollars per barrel, American WTI 9 cents to 57.75 dollars per barrel. In general, Brent this year has already grown by almost 20%, and, apparently, this is not the limit. Tensions in the Middle East also contribute to price increases, especially concerns about a deal restricting Iran's nuclear program. "OPEC and its allies are doing everything possible to support the market. Oil prices should stay high enough in the coming months, or at least they certainly should not fall," PVM believes. Oil also supports forecasts for US reserves, which, according to analysts, will be reduced by 3.6 million barrels. In addition, in early July, oil production in Russia fell to almost a three-year low due to a reduction in the production of the largest producer, Rosneft. The reason for the decline is the consequences of detecting contaminated oil in the Druzhba pipeline. The material has been provided by InstaForex Company - www.instaforex.com |
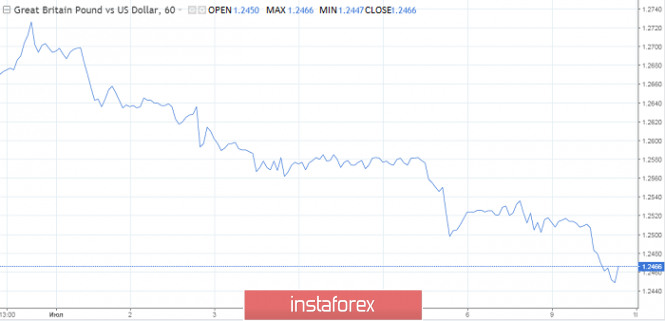
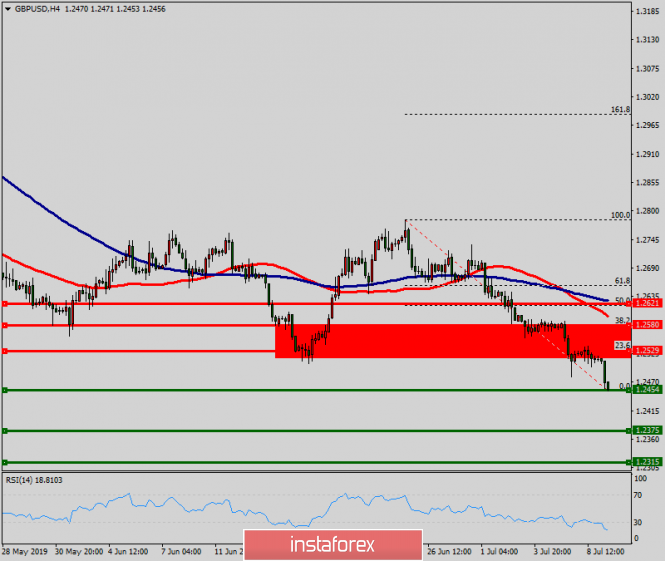
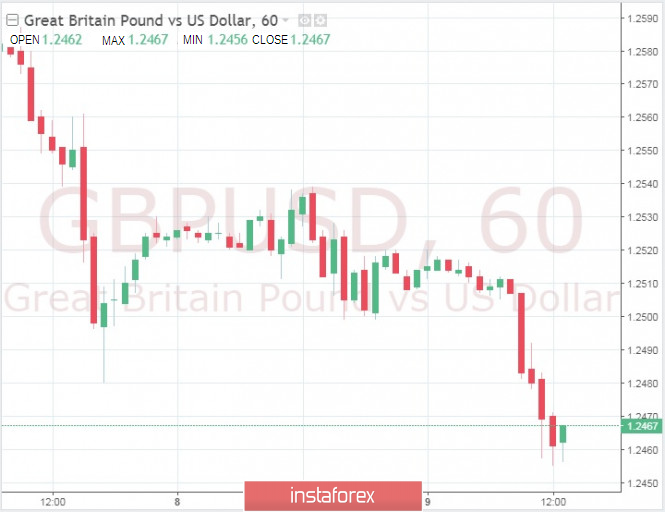
| In search for a low: Catch the pound at $1.20 Posted: 09 Jul 2019 04:47 PM PDT Every day, the forecast for the pound is getting worse. Today, quotes of the GBP/USD pair are below the important mark of 1.2480. The next target sellers of the sterling is a very strong technical support level of 1.2350. On Tuesday afternoon, quotes of the GBP USD pair were at 1.2466. The last time the British currency traded in this area was more than two years ago. Sterling also fell in tandem with the euro. All this happens because, at five minutes past hours, British Prime Minister Boris Johnson intends to part with the European Union by any means on October 31. His hawkish position reinforces concerns about a possible exit without a deal. Another contender for the premiership, Jeremy Hunt, is forced to adopt a similar political line. Now the competition between Johnson and Hunt is based on the competitive moment in the context of Brexit. This is unlikely to improve the mood against the pound. Moody's has previously warned of a possible recession in the UK in the event of a "hard" scenario. A whole series of weak economic data came out, which caused a wave of concern about the decline in British GDP in the second quarter. The first assessment will be published on Wednesday. The next day, the Bank of England will publish its report on financial stability, which should help traders understand whether the central bank will consider the possibility of lowering rates after other global regulators to support the country's economy. Tomorrow's data is expected to confirm the presence of stagnation in Britain. Where is the limit for the pound's decline? Sterling's withdrawal below the $1.25 mark could become a kind of springboard for the lowest levels of the end of 2016 and the beginning of 2017 to be tested. We are talking about the $1.20 mark. Given the prospects for sharpening political rhetoric regarding an exit without a deal and the deterioration of economic realities, this may well happen. "At this stage it is difficult to imagine a potential trigger that could lead to a change in the current "bearish" moods on the pound," the leading currency strategies of the MUFG share their assumptions. Mark Carney said last week that the trade war and Brexit without a deal could drive the economy into depression and it could not cope without additional help. After these comments, investors increased interest rates on monetary policy easing in England. Markets now include a 40% chance of a rate cut by the end of the year. Therefore, sterling lost another potential factor for support. Goldman Sachs estimated that last week, hedge funds increased their bearish position on the pound by $1.2 billion, to $2 billion. The material has been provided by InstaForex Company - www.instaforex.com |
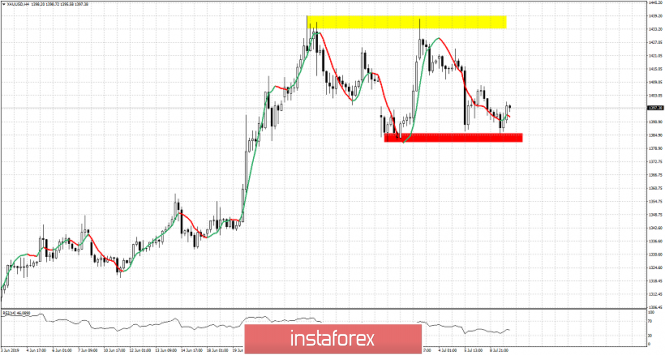
| Gold is unlikely to guess what the Fed's intentions are, but in any case it will not lose Posted: 09 Jul 2019 04:37 PM PDT Gold has stood on the verge of the longest weekly winning streak since 2011. However, after the release of a strong release on the US labor market for June, the precious metal exchange rate slumped by more than 1.6%. The increase in the number of jobs in the US economy by 224 thousand reduced the likelihood of reducing the federal funds rate at the July Fed meeting by 50 basis points, from 40% to 8%. It should be noted that gold is sensitive to the Fed's monetary policy, since the latter has an impact on both the US dollar exchange rate and the securities markets. The dovish rhetoric of the Fed, the weakening of the US currency, the fall in Treasury yields, the worsening global risk appetite, the growth of geopolitical tensions in the world are the main bullish drivers for the XAU/USD pair. The decline in the yield of the world debt market and the weakness of the main currencies against the background of the readiness of the leading central banks to soften monetary policy are strong arguments in favor of buying precious metals. Apparently, the further dynamics of gold will depend on whether the US central bank will lower the federal funds rate at the next meeting or not. Along with strong data on the US labor market in favor of maintaining the rate of 2.5% was the growth of three-year inflation expectations from the New York Federal Reserve Bank in June (from 2.5% to 2.7%), which increases the likelihood of inflation to return to a reference point of 2%. At first glance it may seem that the preservation of the former parameters of the monetary policy of the Fed is a negative point for gold. However, in fact, in this situation, US stock indices may sharply go down, which, by analogy with December last year, could lead to a rise in the XAU/USD pair. Monetary expansion by the Fed is also a "bullish" factor for gold, because in this case the greenback will weaken, and the yield of Treasuries will continue to go down. In addition, given the fact that the central bank has been receiving incessant criticism from the head of the White House, Donald Trump, the latter's desire to weaken the USD for the 2020 presidential election is growing every day. Standard Chartered analysts point out that the dollar weakened after the work of the three previous US administrations had expired due to the effect of depletion of fiscal stimulus. They expect that by the end of D. Trump's presidential term, the USD index will be below the levels at which he was at the time of the 2016 elections. Thus, in order not to be undertaken by the Fed in July, gold can benefit from this, which makes it possible to consider buying on the decline with a target of $1,470- $ 1,490 for 1 ounce on the horizon of 3-6 months. The material has been provided by InstaForex Company - www.instaforex.com |
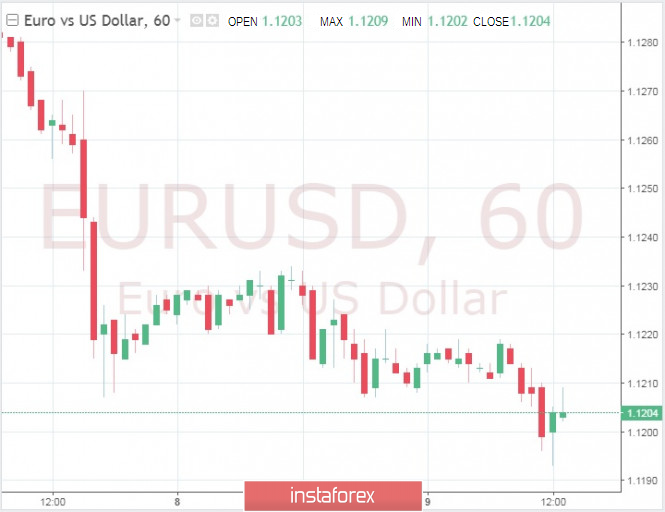
| EUR/USD: the dollar froze in anticipation, the euro falls on the dovish intentions of the ECB Posted: 09 Jul 2019 04:16 PM PDT Today, the euro-dollar pair tested the 11th figure, showing a downward attitude. Traders are still confident that the Fed will take a wait-and-see position at its July meeting against the background of fairly strong June Nonfarms. Two weeks ago, the probability of a rate reduction was almost at 100%, so such a sharp reversal provided strong support to the dollar. But given the upcoming events in the US Congress, EUR/USD bears behave very carefully and without much pressure. Price fluctuations are wavy: after entering the 11th figure, bulls of the pair seized the initiative and returned the pair to the level of today's opening. However, even with the relative indecision of sellers, the pair still remains in the price range of 1.1180-1.12220, waiting for the key events of this week. It is worth noting that the pair is falling not only due to the continuing demand for the dollar. The single currency is under the yoke of its problems, which, in turn, reinforces the downward dynamics of EUR/USD. First of all, we are talking about the ECB's readiness to soften the parameters of monetary policy. If earlier such intentions were voiced in passing, now a rare speech by representatives of the ECB is not without corresponding notes. For example, a member of the ECB's board Benoit Coeure, who four years ago was one of the initiators of the launch of a stimulating program, recently said that the regulator may well resume QE in the near future, if the situation in the eurozone economy demands it. In turn, ECB chief economist Philip Lane negatively assessed the current situation today. According to him, inflation is still below the target level, while downside risks "are growing every day." He again repeated the thesis that the European regulator needs to pursue an accommodation policy in order to return inflation indicators to the targets, and for this the ECB "has enough tools". The chief economist at the central bank also noted the effectiveness of negative rates, stating that it is the most accurate way to bring inflation to the targets. This position only raised the pressure on the euro, especially in the light of IMF head Christine Lagarde's nomination as the head of the ECB. According to some analysts, Lagarde will be guided in her actions through Lane's advice/recommendations. If these forecasts are justified, the dovish attitude of the European regulator will increase significantly, and this fact will put background pressure on the single currency. By the way, today the Council for Economic and Financial Affairs (ECOFIN), which includes the Ministers of Economy and Finance of all EU member states, officially approved the candidacy of Lagarde for the post of head of the ECB. Although the final decision on this issue will be made only in October at the EU summit (and before that Lagarde will be discussed in the Council of the EU and the European Parliament), no one doubts her appointment to this post. Considering recent trends, many currency strategists (for example, market giants such as Goldman Sachs and Morgan Stanley) have increased the likelihood of easing monetary policy parameters already in early autumn. In their opinion, the ECB will refrain from such actions in July, but at the same time it will prepare the markets for the appropriate steps. But at the September meeting, the regulator will restart the anti-crisis mechanism, returning to bond redemption. Analysts of the largest banks in France, Denmark and the Netherlands hold a similar opinion. In technical terms, the euro-dollar pair is currently testing a support level of 1.1200, which corresponds to the lower boundary of the Kumo cloud on the daily chart. If tomorrow, Powell supports the US currency, the bears will easily deal with this support and will go to the next level - 1.1150 (the bottom line of the Bollinger Bands indicator on the same timeframe). The further target of the sellers will be in the area of the 10th figure (1.1090 corresponds to the lower Bollinger Bands line on the weekly chart). It is likely that the pair will impulsively move down to the bottom of the 11th figure, but further price dynamics will be questionable due to Donald Trump's possible reaction. According to some analysts, the US president may resort to currency intervention if the Fed refuses to reduce the interest rate in July. In this case, the downward trend in the EUR/USD "will be discarded", even despite the dovish intentions of the ECB. Thus, the euro-dollar pair is currently under pressure from various fundamental factors. The Fed chief can increase this pressure if the tone of his rhetoric turns out to be more hawkish in relation to general market expectations. In this case, short positions in the EUR/USD pair will be fully justified. However, when the price approaches the bottom of the 11th figure and (especially) the 10th level, caution should be exercised in view of the possible reaction of the White House (Trump). In any case, tomorrow is expected to be quite a volatile day, the results of which will determine the US currency's vector of movement. The material has been provided by InstaForex Company - www.instaforex.com |
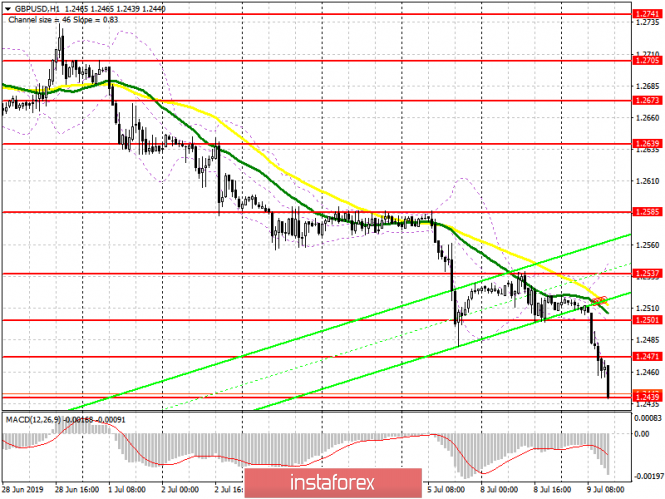
| Posted: 09 Jul 2019 04:02 PM PDT 4-hour timeframe The amplitude of the last 5 days (high-low): 64p - 43p - 25p - 107p - 40p. Average amplitude for the last 5 days: 56p (63p). If the euro declined by 10-15 points and not more during the day then the British currency fell by 60. It is even difficult to say why the pound sterling fell today. Because of Powell's upcoming speeches? Due to the sheer political confusion in the UK, in which Johnson, who has not yet become the prime minister, threatens the EU with a hard Brexit, Jeremy Corbyn calls on the new prime minister to consider the issue of a repeated referendum, speaks out that his party does not support any of the options for Brexit on a future vote, and Jeremy Hunt, another candidate for prime minister, accuses Corbyn of saying that "he never believed in the UK"? Or does the pound become cheaper simply by inertia? Any of these options are possible, and all of them together could give an effect similar to that of today. If we add here the technically important overcoming of the previous local low, it becomes clear that the chances that the pound will grow remain extremely small. In order for these chances to increase, we need positive information for the pound and this can only come from the United States. Either in the form of new failed macroeconomic reports, or from Jerome Powell, who will have important speeches today, tomorrow and the day after tomorrow. So it turns out that any negative information from the US does not offset the problems of the UK, but will only distract the attention of traders from them for a while. That is, if the pound sterling becomes more expensive then it would not be much or stay for too long. Trading recommendations: The pound/dollar currency pair resumed its downward movement. Thus, traders are advised to re-sell the pound sterling with targets at 1.2435 and 1.2415. It will be possible to buy the British currency no earlier than when the pair consolidates above the critical line. In this case, the bulls will get a small chance to form an upward trend. In addition to the technical picture should also take into account the fundamental data and the time of their release. Explanation of the illustration: Ichimoku indicator: Tenkan-sen - the red line. Kijun-sen - the blue line. Senkou Span A - light brown dotted line. Senkou Span B - light purple dotted line. Chikou Span - green line. Bollinger Bands indicator: 3 yellow lines. MACD Indicator: Red line and histogram with white bars in the indicator window. The material has been provided by InstaForex Company - www.instaforex.com |
| Posted: 09 Jul 2019 03:49 PM PDT 4-hour timeframe The amplitude of the last 5 days (high-low): 47p - 44p - 22p - 81p - 28p. Average amplitude for the last 5 days: 44p (57p). So, today is the first day of Powell's speech in Congress. On July 9, the Fed chairman gave a speech in Boston, and at the moment his speech has not touched on the topic of monetary policy. Powell's more significant speeches will take place tomorrow and the day after tomorrow, before the House of Representatives Committee on Financial Services and the Senate Banking Committee. It is expected that, in addition to the US economic outlook, as well as the current state of the country's economy and the Fed's monetary policy plans, the committees will be interested in the relationship between Trump and Powell, as the US president often criticizes the Fed and Powell in particular because of the first too frequent increases rates, and now - for the lack of its reduction. Thus, the Congress will clearly be interested in questions regarding the influence of Trump on the Fed, which, in theory, should not be. And, of course, the topic of monetary policy easing, which, in the opinion of most traders, can happen at the next meeting of the US regulator. In general, we do not expect Powell to openly announce that the Fed is preparing to lower the rate. Most likely, the wording will be low-key and ambiguous, like "we will respond to macroeconomic indicators", but this is not the question, but whether the foreign exchange market will see any hints on the rate increase or, conversely, the Fed's reluctance to reduce it. If yes, then we are waiting for serious movement in all pairs, including the US dollar. From a technical point of view, not too much of the downward movement continues, or rather, it is weak and uncertain. Bears hold the initiative in their hands, but are ready to begin to close dollar positions if Powell's rhetoric is too "dovish". Trading recommendations: The EUR/USD pair continues to move down. Thus, it is still recommended that you buy the dollar for the goal of a support level of 1.1165. Prerequisites for buying the euro is not available. It is recommended to buy the euro/dollar no earlier than when the price consolidates above the Kijun-sen line with the first goal being the Senkou Span B line. However, for this, bulls will need fundamental reasons. In addition to the technical picture should also take into account the fundamental data and the time of their release. Explanation of the illustration: Ichimoku indicator: Tenkan-sen - the red line. Kijun-sen - the blue line. Senkou Span A - light brown dotted line. Senkou Span B - light purple dotted line. Chikou Span - green line. Bollinger Bands indicator: 3 yellow lines. MACD Indicator: Red line and histogram with white bars in the indicator window. The material has been provided by InstaForex Company - www.instaforex.com |
| EURUSD shows short-term reversal warnings Posted: 09 Jul 2019 01:55 PM PDT EURUSD is expected to reverse to the upside at least for a bounce towards 1.13. Short-term trend remains bearish but we have some bullish RSI divergence signs that provide a warning for bears.
Black line -resistance Green lines - bullish divergence With the RSI at oversold levels and turning upwards without making new lower lows as price does, I'm confident that soon we should expect a bounce at least towards 1.1260 if not 1.13. The RSI is also about to break above the resistance trend line and something like this will be combined with a break above 1.1220. A move towards 1.1250 should be seen over the next two sessions. Support is very important at 1.12-1.1180. The material has been provided by InstaForex Company - www.instaforex.com |
| Gold price continues to respect short-term support Posted: 09 Jul 2019 01:51 PM PDT Gold price reached the lower boundary of the trading range its been in since late June. Price reached $1,385 but bounced back towards $1,397. Price remains inside the trading range and so do we remain neutral.
Yellow rectangle- resistance Red rectangle - support Our plan remains the same. Buy near red support area, sell near yellow resistance area. As long as price respects the boundaries so do we. If we see price break below the red rectangle we should then expect price to fall towards $1,350-30 at least. If price breaks above the yellow rectangle I expect to see $1,500-$1,525. Taking into consideration the bigger picture and the fact that Gold has rallied nearly 200$ since the May lows, the bearish scenario for a pull back towards $1,350 and a back test of the break out area is more probable than a continuation of the up trend. The material has been provided by InstaForex Company - www.instaforex.com |
| EUR/USD analysis for July 09,2019 - Bullish diverrgence on the oscillators Posted: 09 Jul 2019 08:26 AM PDT The EUR did test-reject of the median Pitchfork channel and also key support at the price of 1.1190, which is sign that sellers got exhausted and that buyers may come into the play.
The focus now shifts to FOMC meeting minutes tomorrow. Seems like the market is awaiting new information's before the next directional move .On the H4 time-frame I found that there is a bullish divergence on the Stochastic and MACD, which represents potential short-term rally. Upward targets are set at the price of 1.1270 and at the price of 1.1310. Both targets are based on the previous price action. As long as the EUR is trading above the 1.1180, I would watch for buying opportunities. The material has been provided by InstaForex Company - www.instaforex.com |
| July 9, 2019 : EUR/USD Intraday technical analysis and trade recommendations. Posted: 09 Jul 2019 08:15 AM PDT
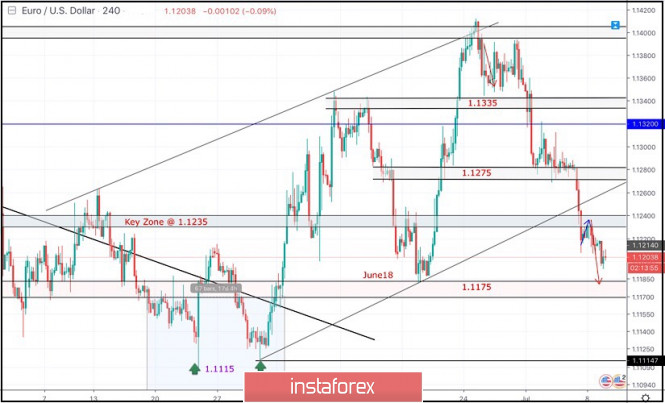
Since February 28, the EURUSD pair has been moving within the prvious downside channel with slight bearish tendency. Short-term outlook turned to become bearish towards 1.1175 (a previous weekly bottom which has been holding prices above for some time. On the highlighted period between (May 17th and June 5th), temporary bearish breakdown below 1.1175 was demonstrated on the chart. This allowed further bearish decline to occur towards 1.1115 where significant bullish recovery brought the EUR/USD pair back above 1.1175 which stands as a prominent DEMAND level until now. Initially, Temporary Bullish breakout above 1.1335 was demonstrated (suggesting a high probability bullish continuation pattern). However, the EURUSD pair has failed to maintain that bullish persistence above 1.1320 and 1.1275 (the depicted price levels/zones). This was followed by a deeper bearish pullback towards 1.1175 where significant bullish price action was demonstrated on June 18. The EURUSD looked overbought around 1.1400 facing a confluence of supply levels. Thus, a bearish pullback was initiated towards 1.1275 as expected in a previous article. Further Bearish decline below 1.1275 enhanced a deeper bearish decline towards 1.1235 (the lower limit of the newly-established bullish channel) which failed to provide enough bullish support for the EUR/USD. The current bearish breakdown below 1.1235 invites further bearish momentum to push towards 1.1175 where recent price action should be considered. Bullish price action should be anticipated near the price zone of 1.1185-1.1175 where a valid Intraday BUY position can be considered. Initial bullish target would be located around 1.1230. Trade recommendations : For Intraday traders, a valid SELL entry was previously suggested at retesting of the broken key-zone around 1.1235. Initial Target levels to be located around 1.1200 and 1.1175. Stop Loss should be lowered to 1.1240 to offset the associated risk. The material has been provided by InstaForex Company - www.instaforex.com |
| July 9, 2019 : GBP/USD demonstrating early bullish rejection around 1.2444. Posted: 09 Jul 2019 07:58 AM PDT
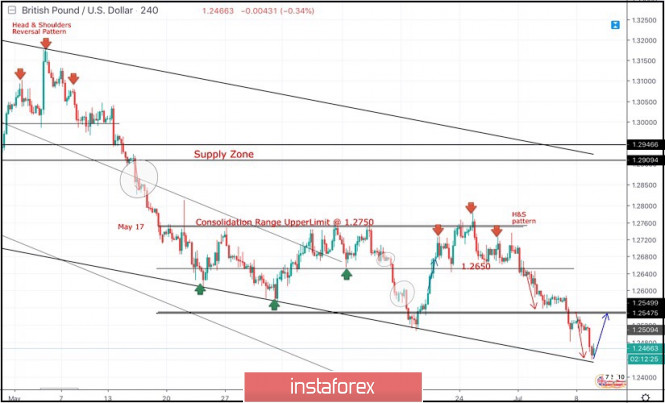
Since May 17, the previous downside movement within the depicted bearish channel came to a pause allowing the recent sideway consolidation range to be established between 1.2750 - 1.2550 with a prominent key-level around 1.2650. On June 4, temporary bullish consolidations above 1.2650 were demonstrated for a few trading sessions. However, the price level of 1.2750 (consolidation range upper limit) has prevented further bullish advancement. Moreover, early signs of bearish rejection have been manifested (Head & Shoulders reversal pattern with neckline located around 1.2650). Bearish breakdown below 1.2650 (reversal pattern neckline) confirmed the reversal pattern with bearish projection target located at 1.2550, 1.2510 and 1.2450. Short-term outlook remains under bearish pressure as long as the market keeps moving below 1.2650 (mid-range key-level and neckline of the reversal pattern). In general, the recent Bearish breakdown below 1.2570 - 1.2550 (the lower limit of the depicted consolidation range) confirms a trend reversal into bearish on the intermediate term. Immediate bearish decline was expected towards 1.2505. Further bearish decline was expected to pursue towards 1.2450 (the lower limit of the current movement channel) where early signs of bullish rejection are being manifested. On the other hand, any bullish pullback towards 1.2550-1.2570 should be considered as a valid SELL signal for Intraday traders. An Intraday bullish position can ONLY be considered if the current bullish rejection persists above the price level of 1.2480. Intraday bullish target would be located around 1.2550-1.2570. Trade Recommendations: Conservative traders can have a valid SELL Entry anywhere around the lower limit of the broken consolidation range near (1.2550-1.2570). T/P levels to be located around 1.2490 and 1.2440. S/L should be placed above 1.2620. The material has been provided by InstaForex Company - www.instaforex.com |
| Gold 07.09.2019 - Potential retracement before new wave down Posted: 09 Jul 2019 07:30 AM PDT The Gold did test and reject of the swing low at $1.386 and major low at $1.381 was missed by few ticks, which is sign for me that got temporally exhausted there. Short-term trend is still bearish and I would watch for selling opportunities on the rallies.
The focus now shifts to FOMC meeting minutes tomorrow. Seems like the market is awaiting new information's before the next directional move .On the daily time-frame I found that there is bear cross on the Stochastic and MACD, which represents short-term downtrend. Fibonacci expansion target is set at the price of $1380 (FE 100%) and then $1.346 (FE 161.8%). The 4H time-frame is showing possibility that Gold may retrace a bit before potential new wave down. The good resistance level is set at the price of $1.405-$1.410 (Fibonacci confluence). As long as the Gold is trading below the $1.410, I would watch for selling opportunities. The material has been provided by InstaForex Company - www.instaforex.com |
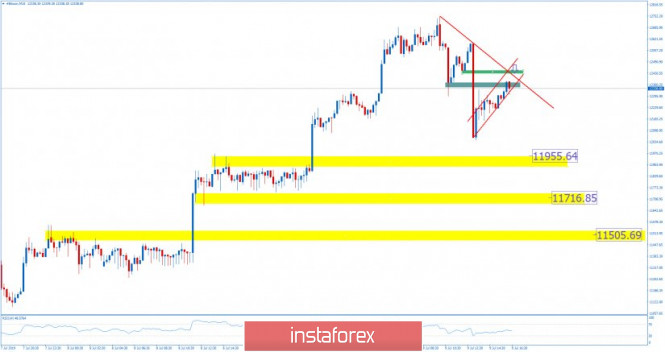
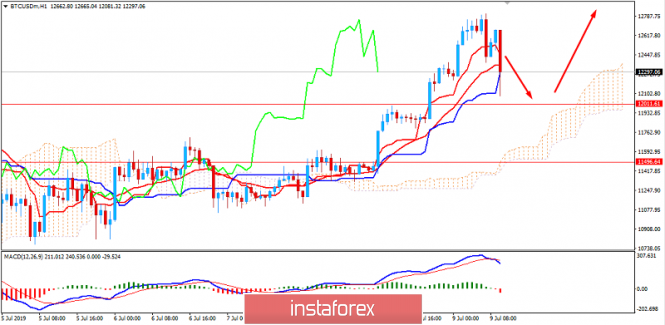
| BTC 07.09.2019 - Intraday sell zone at $12.375-$12.440 Posted: 09 Jul 2019 07:04 AM PDT Industry news: NEO Becomes the Frontrunner In Changing Perceptions For Cryptos Alt Heading NEO may cross $18 by the end of the week to trade beyond and persistently NEO's smart economy conversations resonate with the investors NEO has been gaining worldwide acceptance as the future of the smart economy, and the acceptance level is increasing month on month. The crypto is capable of transforming mindsets and may attract good traction as the second half of the year unfolds. The support community is growing for this token, and the current market performance is also heading towards improvement consequently. NEO token may cross $20 target by the end of this month and head towards a bigger benchmark soon. Trading recommendation:
BTC has been trading upwards in past 24 hours bit it found resistance at the level of $12.750. According to the intraday chart (15M), I found that there is strong down flush and broken bearish flag. My advice on the intraday prospective is to watch for selling opportunities as long as the BTC is trading below the $12.750. Greren rectangle – Resistance 1 ($12.377) Green rectangle- Resistance 2 ($12.425) Yellow rectangles – Supports at $12.000, $11.716 and $11.505 Red lines – Bearish flag (broken) Red line – Downward sloping trend line I would watch for selling opportunities on the rallies, level of $12.377 looks like a solid sell zone. Downward targets are set at the price of $12.000, $11.716 and $11.505. RSI oscillator is showing flip down around 50 level, which is a decent down rotation. Any trading above the level of $12.750 may lead us to the $13.000 mark.The material has been provided by InstaForex Company - www.instaforex.com |
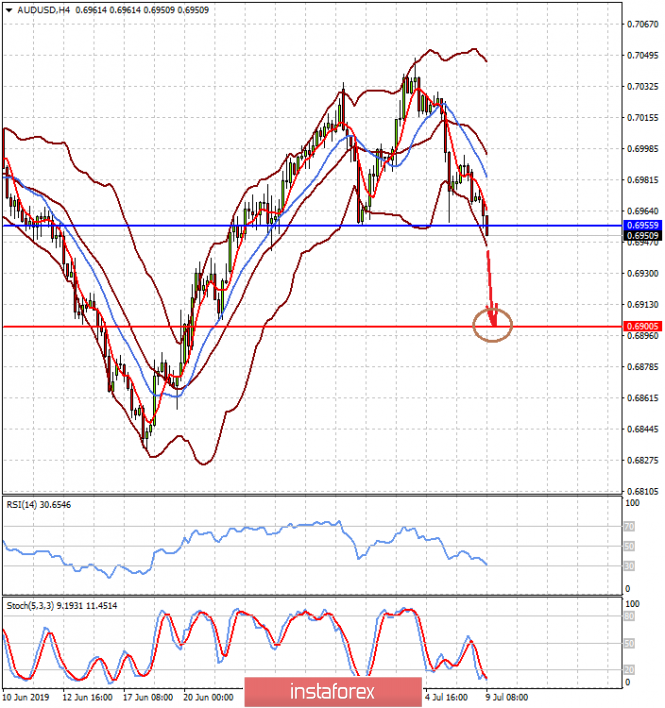
| Posted: 09 Jul 2019 05:25 AM PDT To open long positions on GBP/USD, you need: Buyers retreated from the market after the publication of another poll related to the vote on the future of the British Prime Minister, which, apparently, will be Boris Johnson. Buyers have shown themselves so far in the support area of 1.2439, from which an upward correction can begin. If the pressure on the pound remains, and the level of 1.2439 is broken, it is best to consider new long positions on the rebound from the lows of 1.2405 and 1.2374. To open short positions on GBP/USD, you need: Bears coped with the morning task and broke below the support of 1.2501, which led to the fall of the pound. I paid attention to it in the morning review. At the moment, the sellers' goal is to break through the support of 1.2439, which will maintain the downward momentum and lead to the update of the lows in the area of 1.2405 and 1.2374, where I recommend taking the profits. In the scenario of growth of the pair after the speech of the head of the Fed, short positions can be returned to a false breakout from the resistance of 1.2471 or a rebound from the maximum of 1.2501. Indicator signals: Moving Averages Trading is below 30 and 50 moving averages, indicating a further decline in the pound. Bollinger Bands If the pound rises in the second half of the day, the average border of the indicator in the area of 1.2501 will act as a resistance.
Description of indicators
|
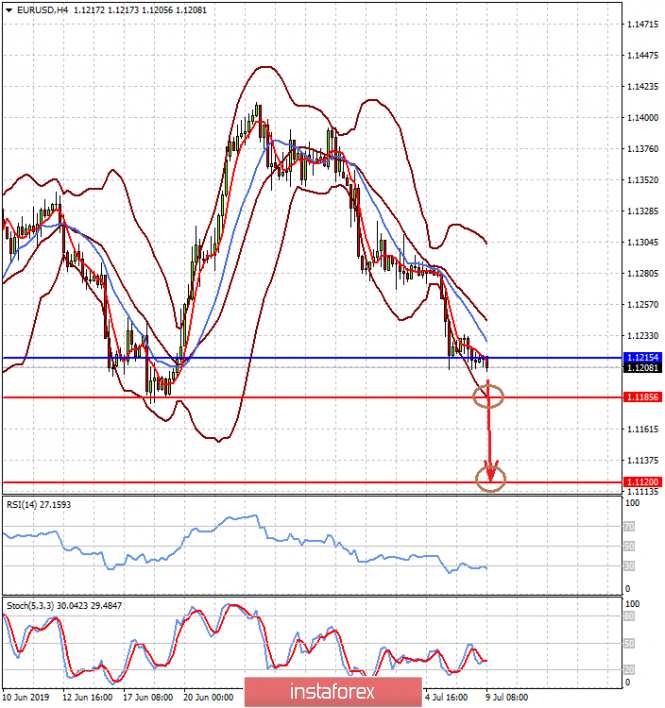
| Posted: 09 Jul 2019 05:25 AM PDT To open long positions on EURUSD, you need: Buyers missed the morning support level of 1.1207, and now all the emphasis will be placed on the speech of the Fed Chairman Jerome Powell and on larger lows in the area of 1.1182 and 1.161, from which it will be possible to count on a return to the market of major players. The main task of the bulls for the second half of the day is to break and consolidate above the resistance of 1.1207, which will lead to an update of the highs in the area of 1.1235 and 1.1268, where I recommend taking the profits. To open short positions on EURUSD, you need: Sellers will count on the speech of the head of the Fed, during which, as expected, can be announced specifics on interest rates. The positive tone of the performance will lead to a further decline in EUR/USD in the area of the lows of 1.1182 and 1.161, where I recommend taking the profit. If the bulls manage to return to the resistance of 1.1207 in the second half of the day, then it is best to look at the short positions after the test of the daily maximum of 1.1235 yesterday or a rebound from the resistance of 1.1268. Indicator signals: Moving Averages Trading is below 30 and 50 moving averages, which indicates a possible continuation of the bearish market. Bollinger Bands In the EUR/USD growth scenario, the upward trend may be limited by the upper limit of the indicator around 1.1225.
Description of indicators
|
| The dollar is waiting for signals from the head of the Fed Posted: 09 Jul 2019 04:53 AM PDT Dollar bulls retain control of the situation, playing a strong report on the US labor market published last Friday. Greenback continues to strengthen relative to its main competitors. The USD index is still trading near three-week highs. Now, traders are waiting for the speech of Federal Reserve Chairman (FED) Jerome Powell in Congress. On Wednesday and Thursday, July 10 and 11, the head of the Fed will submit a semi-annual report on monetary policy in the Senate and the House of Representatives. Undoubtedly, this is one of the key events of the current week, from which, the demand for the American currency will probably depend not only this week but also until the end of the month (when the next meeting of the American Central Bank will be held). The main question that investors will look for in the speeches of Jerome Powell is whether the Fed should lower interest rates in July in light of the latest report on the US labor market. At the end of the June meeting, the FOMC members made it clear that the prospects for easing the monetary rate of the regulator will depend on the incoming data. Last month, the number of jobs in the US economy increased but wage growth slowed, as well as the business activity in the manufacturing sector and the service sector declined. On Thursday, there will be data on consumer prices, which are also of great importance for the Fed. However, they are likely to be on the table even before a speech to Congress. Considering the tone of the regulator's statements from the last meeting and the amount of time that has passed since the previous speech of the Fed chairman in Congress, it is possible that Jerome Powell will devote a significant part of his speech in explaining why the Central Bank believes that over the past few months, the need for rate cuts has increased significantly. If in February, the Fed did not rule out a toughening of the policy, the labor market was strong and the regulator's prospects for the American economy were not in doubt. The Central Bank removed the word "patience" from the text of its statement last month and said that the level of uncertainty had increased. Thus, easing of the Fed's monetary policy in July seems inevitable but the dynamics of the US currency indicates that traders are not ready for negative comments from Jerome Powell. They seem to be hoping that stronger than expected US market data will allow the Fed to postpone the rate cut until September or reinforce the Central Bank in the idea that a cut in July is all that is currently required by the American economy. It is assumed that if the speech of the Chairman of the Federal Reserve in the Congress will be optimistic. Then, the USD/JPY pair will test the strength of 109 and EUR/USD pair will drop below 1.12. Powell focuses on potential risks and spends a significant part of his speech talking about slowing the US economy. Hence, the USD/JPY pair will turn around and fall below 107.50, and the EUR/USD pair will rise above 1.13. The material has been provided by InstaForex Company - www.instaforex.com |
| Technical analysis of GBP/USD for July 09, 2019 Posted: 09 Jul 2019 04:39 AM PDT The GBP/USD pair continues to move downwards from the level of 1.2580. This week, the pair dropped from the level of 1.2580 to the bottom around 1.2454. But the pair couldn't rebounded from the bottom of 1.2454 then closed at 1.2460. Today, the first support level is seen at 1.2454, the price is moving in a bearish channel now. Furthermore, the price has been set below the strong resistance at the level of 1.2529, which coincides with the 23.6% Fibonacci retracement level. This resistance has been rejected several times confirming the veracity of a downtrend. Additionally, the RSI starts signaling a downward trend. As a result, if the NZD/USD pair is able to break out the first support at 1.2454, the market will decline further to 1.2375 in order to test the weekly support 2. Consequently, the market is likely to show signs of a bearish trend. So, it will be good to sell below the level of 1.2454 with the first target at 1.2375 and further to 1.2315. However, stop loss is to be placed above the level of 1.2580. The material has been provided by InstaForex Company - www.instaforex.com |
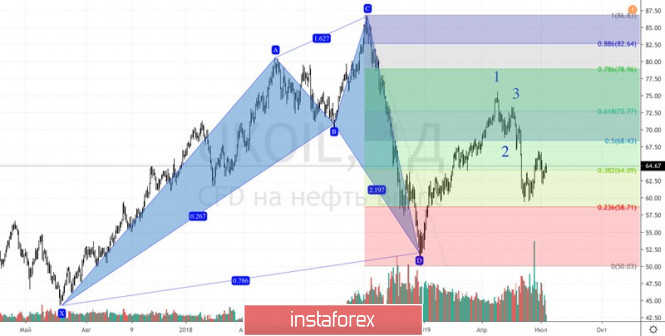
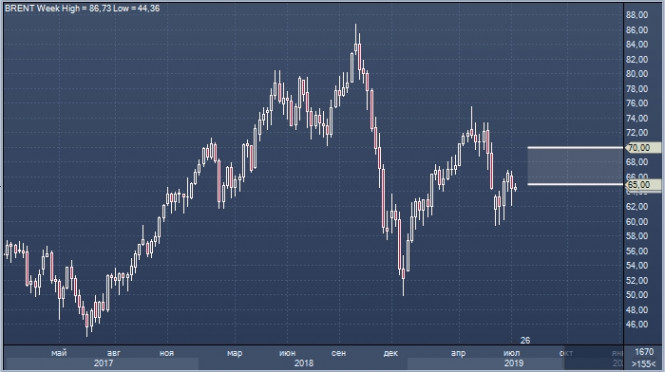
| Oil is looking for clues to the dollar Posted: 09 Jul 2019 04:29 AM PDT While waiting for reports from the US Energy Information Administration, OPEC, and the International Energy Agency, the oil market naturally fell into consolidation. None of the investors want to force things ahead of time. Each of the opponents can draw both "bullish" and "bearish" black gold market conditions at their discretion so that even a minor new driver can provoke serious changes in quotations. The prolongation of the agreement between OPEC and other producing countries to minimize production by 1.2 million b/s until the end of March 2020 play on the side of the "bulls". At the same time, this reduces the number of drilling rigs from Baker Hughes, the growing risks of escalating the conflict between the US and Iran in the Middle East and expectations a reduction in the federal funds rate, which will weaken the US dollar, as well as hopes for ending the trade war between Washington and Beijing. On the contrary, Bears are counting on growth in US production, as well as a reduction in US oil reserves, a slowdown in global demand and a return of investor interest in the US dollar due to the Fed's reluctance to loosen monetary policy. Thus, each of the opposing sides has their own trump cards, which contributes to the consolidation of Brent in the range of $59.5-66.5 per barrel. Dynamics of oil and US dollars The fact that Russia, Saudi Arabia, and other countries agreed to prolong the Vienna agreement not by 6, but for 9 months should have pleasantly surprised the oil market. Thanks to the cartel's cooperation with Moscow, the North Sea variety has gained more than 20% since the beginning of the year. Meanwhile, the Texan variety has gained more than 27%. If the contract was extended by half a year, one could say that this factor is already taken into account in the quotations and we are expected to sell on the facts. However, three quarters is clear bullish news. If we add to the reduction of drilling rigs in the States from 888 in November to 788 in July (which indicates the reluctance of shareholders to increase production costs), as well as the statement by Saudi Arabia to prevent another attack on a tanker in the Persian Gulf, then Brent and WTI buyers could be optimistic about the future. Alas, their opponents have their own reasons for selling. Shale mining in the United States grew from a zero level a decade ago to 8.5 million b/d, which allowed the United States to claim the role of the first producing country in the world. The trade war between Washington and Beijing leads to a slowdown in China's GDP, which imports about 9.5 million b/s. Reducing global oil demand extends a helping hand to bears across Brent and WTI. Bloomberg experts expect another reduction in a row for the fourth time in the US black gold reserves, which is at 3.6 million bps this time. It is possible that oil will swing in one direction or another under the influence of the US dollar. In this regard, Jerome Powell's speech before the Congress and the publication of the minutes of the June FOMC meeting are expected by investors with no less interest than the reports of the Energy Information Administration, OPEC and the IEA. Technically, the option of transforming the "Shark" pattern into 5-0 is still not excluded on the daily chart of Brent. Brent daily chart |
| The euro and the pound are waiting for new lows, the dollar jumped amid changes in the Fed rate Posted: 09 Jul 2019 04:19 AM PDT The euro remains under pressure and is trading at a three-week low against the dollar as investors revised their expectations for a sharp Fed rate cut this month. After a stronger than expected report on non-agricultural employment, traders are questioning confidence in the Fed's interest rate cut. The probability of reducing the rate by 50 basis points decreased from 25% to 5.9%. Moreover, investors also believe that the Fed will not cut rates at the September meeting. Against this background, the dollar grows stronger. The single currency fell to 1.1206 euros per dollar, the lowest level since mid-June. Nevertheless, the markets estimate a 94% reduction in the rate by 25 basis points. It is necessary to carefully study the comments of the head of the Fed Jerome Powell on the results of his speech before Congress to determine whether traders will continue to reduce rates for a deep reduction in interest rates. The lull in the trade dispute between the US and China after the G20 summit in Japan also strengthened the dollar. The situation has not deteriorated, and that is positive. The rising dollar pushed the British pound to a new six-month low of 1.2480 dollars, which is the lowest value after a sudden collapse on January 3, when the pound fell to 1.2409 dollars. The dollar is recovering, which means that there are some risks for the euro and the pound. On Wednesday, data on GDP and industrial production in the UK will be released, and on Thursday, the Bank of England will publish its financial stability report, which will help traders to assess the position of the regulator. Earlier, the head of the Bank of England Mark Carney said that the large-scale trade war and Brexit increase the risks for the British economy. This prompted investors to increase bets on an interest rate reduction. |
| Technical analysis of EUR/USD for July 09, 2019 Posted: 09 Jul 2019 04:01 AM PDT The EUR/USD pair continues to move upwards from the level of 1.1179 (support zone). Last week, the pair rose from the level of 1.1179 to a top around 1.1222 (currently price is set at the 1.1202 price). Today, the first resistance level is seen at 1.1262 followed by 1.1295, while daily support 1 is seen at 1.1179 (23.6% Fibonacci retracement). According to the previous events, the EUR/USD pair is still moving between the levels of 1.1179 and 1.1295; so we expect a range of 116 pips. Furthermore, if the trend is able to break out through the first resistance level at 1.1222, we should see the pair climbing towards the double top (1.1295) to test it. Therefore, buy above the level of 1.1179 with the first target at 1.1262 in order to test the daily resistance 1 and further to 1.1295. Also, it might be noted that the level of 1.1295 is a good place to take profit because it will form a double top. On the other hand, in case a reversal takes place and the EUR/USD pair breaks through the support level of 1.1179, a further decline to 1.1108 can occur which would indicate a bearish market. The material has been provided by InstaForex Company - www.instaforex.com |
| BITCOIN to bounce off $12,000 aiming for new highs? July 9, 2019 Posted: 09 Jul 2019 03:41 AM PDT Bitcoin amazed crypto investors with the recent rapid rally which was followed by a correctional decline towards $12,000. Bitcoin is currently climbing higher after breaking above $12,000. The price is heading for $13,000, but a retracement is expected along the way. As testament to the volatility and nature of crypto markets, Bitcoin defied them all. The move came in three stages over the past 24 hours. First, a lift from the $11,500 level to $11,800 where it stayed for a few hours, then the big break through $12,000. The next resistance level before another new high for the year is just below $13,000. BTC is setting the tone in the crypto market. At the same time, altcoins are barely moving. BTC market share is approaching 67% according to recent estimates. Over $25 billion was added to crypto markets in a few past days and $22 billion of that was injected into Bitcoin alone. Most opponents of crypto investment are currently considering crypto investment to be one of reliable options of capital diversification. This shift in sentiment in favor of BTC helps the most popular cryptocurrency to maintain momentum. From the technical viewpoint, the impulsive bearish momentum is currently being held by the dynamic support levels like 20 EMA, Tenkan, and Kijun line. Bitcoin is trading firmly above $12,000. It means that BTC has enough strength to extend a climb. MACD has shown bearish crossovers in the moving average while also forming Bearish Divergence. The price is currently expected to consolidate and correct at near $12,000 from where it is likely to jump higher towards $14,000 and later towards $15,000 area in the coming days. TECHNICAL LEVELS: SUPPORT – 11,000, 11,500, 12,000 RESISTANCE – 12,500, 13,000, 14,000 BIAS – BULLISH MOMENTUM – NON-VOLATILE
|
| Prospects: Good ones! Oil can rise by the end of the year Posted: 09 Jul 2019 03:10 AM PDT According to a number of experts, the price of black gold may pleasantly surprise with active growth in the second half of 2019. Analysts polled by Bloomberg rated the outlook for oil as positive. On Monday, July 8, the cost of major grades of raw materials showed a positive trend. Brent crude rose by 0.67% to $64.66 per barrel while lightweight WTI rose in price by 0.87% to $58.01 per barrel. Since the beginning of 2019, Brent and WTI have risen in price by 20.11% and 27.68%, respectively. According to the calculations of commodity market analysts from RBC Capital Markets, the average price of Brent will be $ 69.50 per barrel, and the price of WTI will be $63 per barrel in the second half of this year. Such forecasts are due to many geopolitical reasons. Experts are confident that attempts to launch an upward oil rally will collapse until the demand for refined products grows. RBC Capital Markets believe that the current year will be a time to find a balance in the black gold market, while attempts to find a balance indicate weak demand for oil. Analysts at the largest bank at Commonwealth Bank of Australia believe that "oil" pessimism about demand is greatly exaggerated. Experts are confident that in the second half of 2019, Brent crude will be in the acceptable range - between $ 65 and $ 70 per barrel. Currently, the oil bulls are counting on the positive dynamics of oil prices after the disappointing investors restarting trade negotiations between the US and China and growing concerns about the conflict between the United States and Iran. Recall that last week, Brent and WTI oil prices declined due to fears about demand despite OPEC plans to reduce oil production by March 2020. According to the International Energy Agency (IEA) estimates, the black gold market in 2020 will find it difficult to find a balance between supply and demand. The IEA believes that the growth in world oil demand by 1.4 million barrels per day will not be able to overtake supply, which will increase even faster by 2.3 million barrels per day. The agency is confident that OPEC countries produce more oil than what will be needed next year. Most experts consider the growth of shale oil production in the United States to be one of the important factors for the global black gold market but it will be key in 2020. Experts predict a fall in oil prices next year precisely because of the increase in the production of shale oil. As a result, Brent quotes will be under pressure but they will be able to withstand, experts say. |
| Posted: 09 Jul 2019 01:59 AM PDT The US dollar continues to receive widespread support in the wake of lower market expectations that the Fed will actively lower interest rates in the current year. The main reason for this is the unexpectedly positive statistics on the number of new workers that the American economy received last month. And although market expectations that the Fed will cut off the key interest rate at the July meeting on 31 remain extremely high, the dollar continues to demonstrate its strength. So after everything, why do investors buy the dollar and not sell it in such a situation? This would be logical in the conditions of almost one hundred percent investor confidence that this month the rates will be reduced by 0.25%. Lowering the rates usually puts pressure on the exchange rate. This behavior is explained by the fact that investors began to hope that signals about the slowdown of the country's economy, as well as slowing inflationary pressures and a sharp drop in the number of new jobs in May, will force the regulator to lower rates by 0.50% immediately in July. This is against the background of the actual promises made by the Fed in the person of the head J. Powell, as well as some members of the Central Bank that the regulator will lower interest rates. In this situation, there was a noticeable decline in the dollar and the local stock market continued to "swell" in anticipation of lower borrowing costs. However, suddenly last Friday, all published data on the number of new jobs show an unexpected noticeable increase of 224,000 while the predicted value was 160,000. This caused a shockingly strong strengthening of the dollar and hopes that the Central Bank will cut rates on half a percent down. Now, this probability is estimated at only 5.9%, according to the dynamics of futures on federal funds rates. It can be said that the market simply adjusts its expectations after unjustified dollar sales and leads them to match the likely reduction in the key rate by 0.25%. Evaluating the general mood of the Fed regarding the prospects for changes in the monetary policy and it was based on the desire to do nothing until recently and just watch the situation. It can be assumed that the absence in Powell's statement at the Banking Committee of hints on the determination to lower rates would lead to a fall these expectations and the sharp rise in the US currency. Also, the dollar can get support in the wake of its neutral statements on the topic of monetary policy, which will definitely be viewed by markets as a continuation of the pause and striving to continue monitoring developments in the country's economy. Only a direct signal that the regulator cannot stop at a single rate reduction and continue this process. Forecast of the day: The EUR/USD pair is consolidating below 1.1215, awaiting Powell's speech in the Senate. If he does not announce the beginning of the rate reduction cycle, then this will lead to a further fall in the pair. First is to 1.1185 with the prospect of falling to 1.1120. The AUD/USD pair is trading below the level of 0.6955. She has a chance to continue falling to 0.6900. |


| You are subscribed to email updates from Forex analysis review. To stop receiving these emails, you may unsubscribe now. | Email delivery powered by Google |
| Google, 1600 Amphitheatre Parkway, Mountain View, CA 94043, United States | |
No comments:
Post a Comment