
Forex analysis review |
- Weekly bullish hammer candlestick in AUDUSD
- EURUSD forming a bullish pennant pattern
- Is Gold forming a bull flag pattern
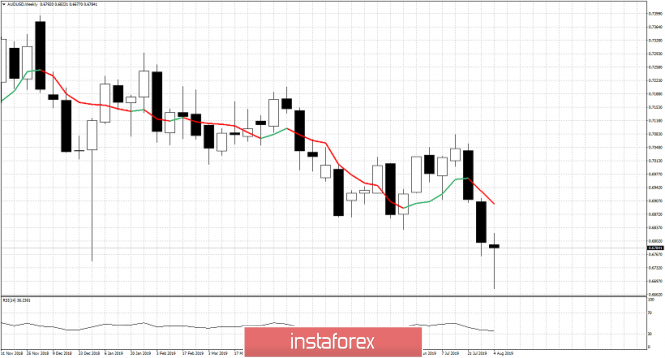
| Weekly bullish hammer candlestick in AUDUSD Posted: 10 Aug 2019 02:25 AM PDT AUDUSD made a new lower low the past week at 0.6677 but managed to close near its weekly highs around 0.6784 forming a bullish hammer candlestick pattern. This bullish pattern in order to be confirmed needs a bullish follow through the coming week.
As pointed out in previous posts, in the 4 hour chart the AUDUSD pair has been showing bullish divergence signs in the RSI. The weekly candle implies that a bounce is coming and we should expect more upside the coming weeks. Price has so far retraced nearly 38% of the decline from 0.7081 and our minimum bounce target is at 0.6930. The weekly hammer gives us hopes for a longer-term and bigger bounce even above 0.7050 but it is too early to tell if this will be the case. The foundation has been placed, we now need to see strength from buyers and a sequence of higher highs and higher lows on a daily and weekly basis. The material has been provided by InstaForex Company - www.instaforex.com |
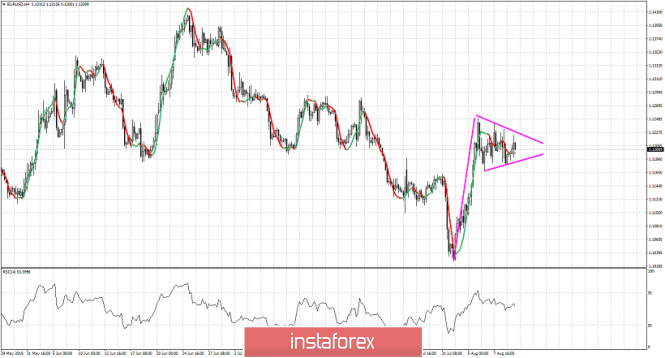
| EURUSD forming a bullish pennant pattern Posted: 10 Aug 2019 02:19 AM PDT EURUSD has made an impressive bounce from 1.10 to 1.12 and is now forming a bullish pennant pattern. A break out above 1.1250 would give us 1.1330-1.1350 as the first target area to watch out for.
EURUSD despite making new lows at the start of August, last week was a large scale bounce as we expected given the warnings from the bullish RSI divergence signs. Now that price is 200 pips higher from its lows we see a bullish pennant formation. Resistance is at 1.1250 and support at 1.1165. Keep a close eye on these two levels as a break of either will point the direction of the move we should expect to see next. The most probable scenario is the bullish break out as the longer-term technical picture of EURUSD favors a longer-term bullish reversal from the current levels. The material has been provided by InstaForex Company - www.instaforex.com |
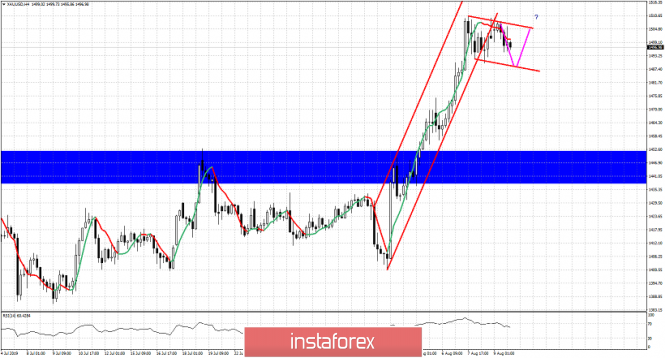
| Is Gold forming a bull flag pattern Posted: 10 Aug 2019 02:14 AM PDT After a strong rally from $1,400 to $1,510, Gold price is consolidating sideways. This could be a bull flag forming. A break above $1,510 would be a bullish sign as long as price holds above $1.490-85.
Purple line - potential price action Blue rectangle - major support area Gold price is most probably forming a bull flag pattern. Price might continue to move sideways for the first couple of sessions next week. A break out above $1,510 would be a bullish sign that would give us $1,530 our first short-term target and next $1,550. Breaking below $1,490-85 would most probably cancel the bull flag pattern possibilities, but it would not cause problems to the medium-term bullish trend. Major support area is found at $1,440-50 and any pull back towards that area is considered a buying opportunity. The material has been provided by InstaForex Company - www.instaforex.com |
| You are subscribed to email updates from Forex analysis review. To stop receiving these emails, you may unsubscribe now. | Email delivery powered by Google |
| Google, 1600 Amphitheatre Parkway, Mountain View, CA 94043, United States | |
No comments:
Post a Comment