Forex analysis review |
- Fractal analysis of the main currency pairs on August 20
- AUD / USD vs USD / CAD vs NZD / USD vs #USDX. Comprehensive analysis of movement options from August 19, 2019 APLs &
- The euro will continue to focus on falling
- EUR/USD: Waiting for the $1.10 mark?
- On the positive: oil starts the week with growth
- EUR/USD: market noise and sluggish struggle for the 11th figure
- August 19, 2019 : GBP/USD Intraday technical analysis and trade recommendations.
- August 19, 2019 : EUR/USD Intraday technical analysis and trade recommendations.
- BTC 08.19.2019 - Double bottom formation confirmed
- Analysis for EUR/USD and GBP/USD on August 19th. The euro miraculously holds its position after the report on inflation in
- GBP/USD 08.19.2019 -Potential test of the 20SMA on daily time-frame
- EUR/USD for August 19,2019 - Down reversal candle on weekly time-frame
- Yen is fortunate
- Control zones for EUR/USD pair on 08/19/19
- Control zones for AUD/USD pair on 08/19/19
- Golden peaks: precious metal could approach $1700
- Investors are waiting for Powell's performance in Jackson Hole (We expect a resumption of the decline in EUR/USD and USD/CAD
- Technical analysis of EUR/USD for August 19, 2019
- Bounce is coming in EURUSD
- Short-term Gold analysis for August 19th, 2019
- Gold tests $1,500 support, threat of deeper correction
- Sterling volatility will increase, cautious base-building in evidence
- Positive surge on Monday morning, while bypassing the NZD and AUD
- Simplified wave analysis and forecast for EUR/USD, AUD/USD, and GBP/JPY on August 19
- Technical analysis for the GBP/USD currency pair for the week from August 19 to 24, 2019
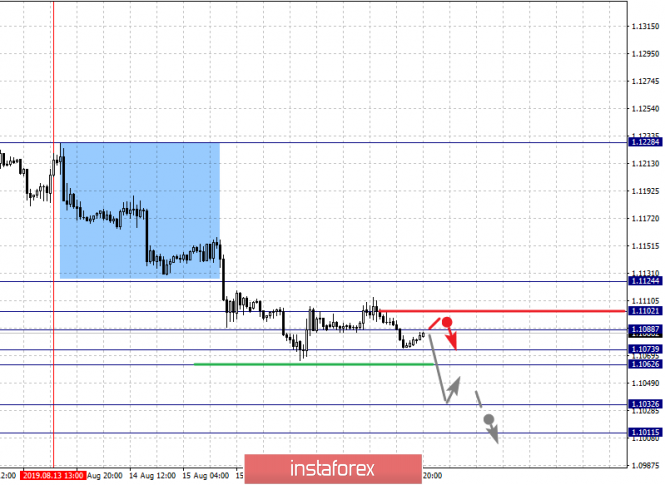
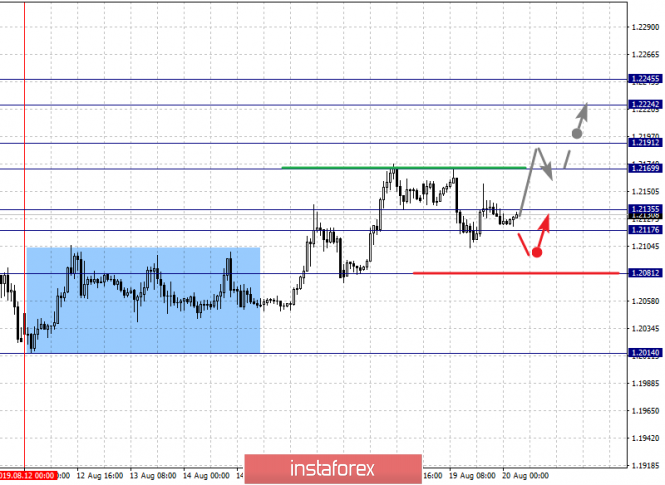
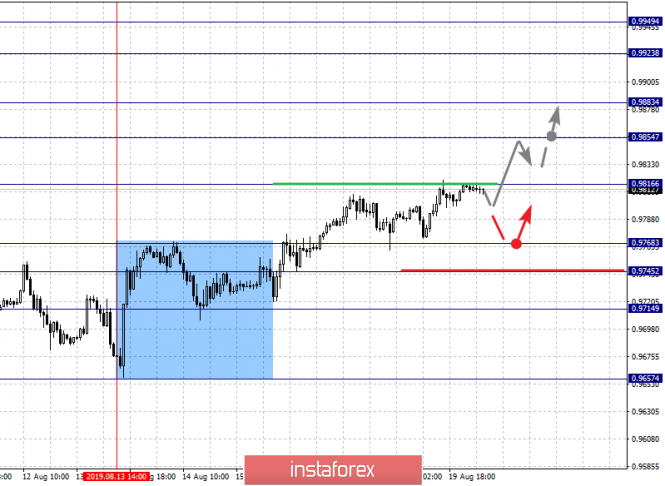
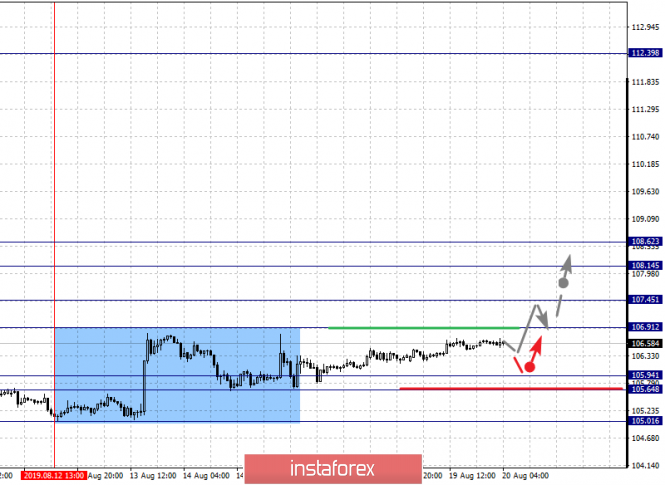
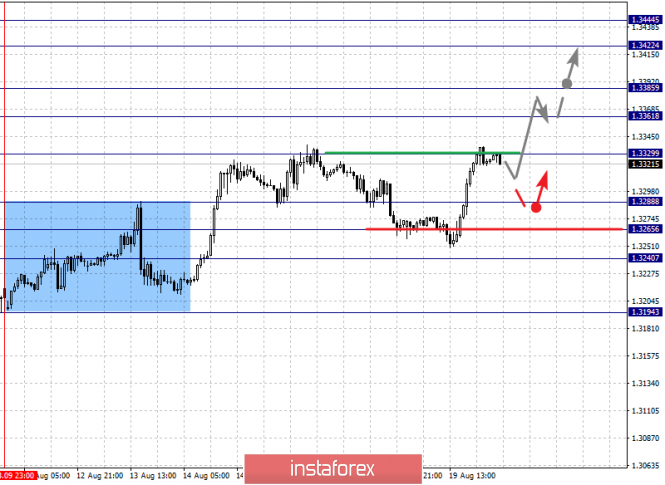
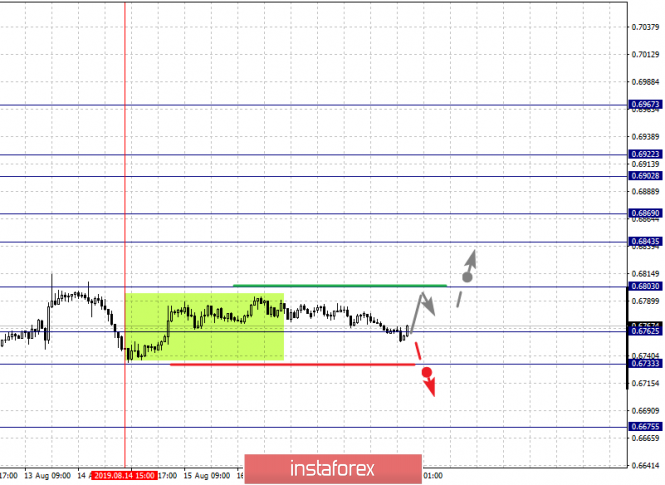
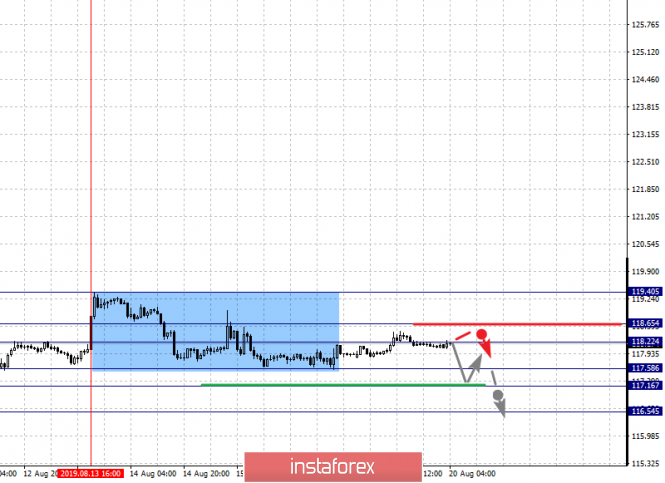
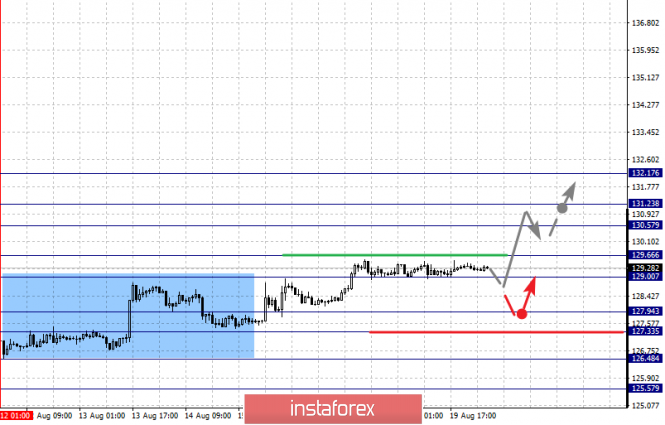
| Fractal analysis of the main currency pairs on August 20 Posted: 19 Aug 2019 07:01 PM PDT Forecast for August 20: Analytical review of currency pairs on the scale of H1: For the euro / dollar pair, the key levels on the H1 scale are: 1.1124, 1.1102, 1.1073, 1.1062, 1.1032 and 1.1011. Here, we are following the development of the downward structure of August 13. Short-term movement to the bottom is expected in the range of 1.1073 - 1.1062. The breakdown of the latter value will lead to a pronounced movement. Here, the goal is 1.1032. Price consolidation is near this level and hence the likelihood of a correction. For the potential value for the downward trend, we consider the level of 1.1032. Short-term upward movement is possibly in the range of 1.1088 - 1.1102. The breakdown of the last value will lead to a long correction. Here, the target is 1.1124. This level is a key support for the downward structure. The main trend is the downward cycle of August 13. Trading recommendations: Buy 1.1088 Take profit: 1.1100 Buy 1.1105 Take profit: 1.1122 Sell: 1.1060 Take profit: 1.1035 Sell: 1.1030 Take profit: 1.1011 For the pound / dollar pair, the key levels on the H1 scale are: 1.2245, 1.2224, 1.2191, 1.2169, 1.2135, 1.2117 and 1.2081. Here, we follow the development of the ascending cycle of August 12. Short-term upward movement is expected in the range of 1.2169 - 1.2191. The breakdown of the last value should be accompanied by a pronounced upward movement. In this case, the target is 1.2224. For the potential value for the top, we consider the level of 1.2245. Upon reaching which, we expect consolidation, as well as a pullback to the bottom. Short-term downward movement is possibly in the range of 1.2135 - 1.2117. The breakdown of the last value will lead to a long correction. Here, the target is 1.2081. This level is a key support for the downward structure. The main trend is the downward cycle of July 31. Trading recommendations: Buy: 1.2170 Take profit: 1.2190 Buy: 1.2195 Take profit: 1.2224 Sell: 1.2135 Take profit: 1.2118 Sell: 1.2115 Take profit: 1.2081 For the dollar / franc pair, the key levels on the H1 scale are: 0.9949, 0.9923, 0.9883, 0.9854, 0.9816, 0.9768, 0.9745 and 0.9714. Here, we follow the ascending structure of August 13. The continuation of the movement to the top is expected after the breakdown of the level of 0.9816. In this case, the target is 0.9854. Short-term upward movement, as well as consolidation is in the range of 0.9854 - 0.9883. The breakdown of the level of 0.9883 should be accompanied by a pronounced upward movement. Here, the target is 0.9923. For the potential value for the top, we consider the level of 0.9949. Upon reaching which, we expect consolidation, as well as a pullback to the bottom. Short-term downward movement is possibly in the range of 0.9768 - 0.9745. The breakdown of the latter value will lead to an in-depth correction. Here, the target is 0.9714. This level is a key support for the top. The main trend is the upward cycle of August 13. Trading recommendations: Buy : 0.9816 Take profit: 0.9854 Buy : 0.9856 Take profit: 0.9881 Sell: 0.9768 Take profit: 0.9747 Sell: 0.9743 Take profit: 0.9715 For the dollar / yen pair, the key levels on the scale are : 108.62, 108.14, 107.45, 106.91, 106.35, 105.94, 105.64 and 105.01. Here, we continue to monitor the ascending structure from August 12. The continuation of the movement to the top is expected after the breakdown of the level of 106.91. In this case, the target is 107.45, wherein consolidation is near this level. The breakdown of the level of 107.45 should be accompanied by a pronounced upward movement. Here, the goal is 108.14. For the potential value for the top, we consider the level of 108.62. Upon reaching which, we expect a pullback to the bottom. The range of 105.94 - 105.64 is a key support for the top. Its passage at the price will lead to the development of a downward movement. In this case, the target is 105.01. The main trend: building potential for the top of August 12. Trading recommendations: Buy: 106.91 Take profit: 107.43 Buy : 107.47 Take profit: 108.14 Sell: Take profit: Sell: 105.62 Take profit: 105.04 For the Canadian dollar / US dollar pair, the key levels on the H1 scale are: 1.3445, 1.3422, 1.3385, 1.3361, 1.3329, 1.3288, 1.3265, 1.3240 and 1.3194. Here, we are following the development of the local ascendant structure of August 9. The continuation of the movement to the top is expected after the breakdown of the level of 1.3330. In this case, the target is 1.3361. Price consolidation is in the range of 1.3361 - 1.3385. The breakdown of the level of 1.3385 will allow us to count on movement towards a potential target - 1.3422. Upon reaching this level, we expect consolidation in the range of 1.3422 - 1.3444, as well as a pullback to the bottom. A short-term downward movement is possibly in the range of 1.3288 - 1.3265. The breakdown of the last value will lead to an in-depth correction. Here, the target is 1.3240. This level is a key support for the top. The main trend is the local ascending structure of August 9. Trading recommendations: Buy: 1.3330 Take profit: 1.3360 Buy : 1.3387 Take profit: 1.3422 Sell: 1.3288 Take profit: 1.3266 Sell: 1.3264 Take profit: 1.3240 For the Australian dollar / US dollar pair, the key levels on the H1 scale are : 0.6967, 0.6922, 0.6902, 0.6869, 0.6843, 0.6803, 0.6762, 0.6733 and 0.6675. Here, we are following the development of the ascending structure of August 7, and the price has formed a small potential for the top of August 14. The continuation of the upward movement is expected after the breakdown of the level of 0.6803. In this case, the first target is 0.6843. Short-term upward movement, as well as consolidation is in the range of 0.6843 - 0.6869. The breakdown of the level of 0.6870 should be accompanied by a pronounced upward movement. Here, the target is 0.6902. Consolidation is in the corridor 0.6902 - 0.6922. For the potential value for the top, we consider the level of 0.6967. Upon reaching which, we expect a pullback to the bottom. We expect a consolidated movement in the range of 0.6762 - 0.6733. The breakdown of the level of 0.6733 will lead to the development of a downward structure. In this case, the potential target is 0.6675. The main trend is the ascending structure of August 7, the correction stage. Trading recommendations: Buy: 0.6805 Take profit: 0.6840 Buy: 0.6844 Take profit: 0.6867 Sell : Take profit : Sell: 0.6730 Take profit: 0.6680 For the euro / yen pair, the key levels on the H1 scale are: 119.40, 118.65, 118.22, 117.58, 117.16 and 116.54. Here, we are following the development of local potential for the bottom of August 13. Short-term downward movement is expected in the range 117.58 - 117.16. The breakdown of the latter value will allow us to expect movement to a potential target - 116.54. Consolidation is near this level. Short-term upward movement is expected in the range of 118.22 - 118.65. The breakdown of the last value will have the formation of an ascending structure for the top. Here, the first goal is 119.40. The main trend is the formation of a local descending structure of August 13. Trading recommendations: Buy: 118.22 Take profit: 118.62 Buy: 118.70 Take profit: 119.40 Sell: 117.56 Take profit: 117.18 Sell: 117.14 Take profit: 116.55 For the pound / yen pair, the key levels on the H1 scale are : 132.17, 131.23, 130.57, 129.66, 127.94, 127.33, 126.48 and 125.57. Here, we follow the development of the ascending structure of August 12. Short-term upward movement is expected in the range 129.00 - 129.66. The breakdown of the last value will lead to a pronounced upward movement. Here, the target is 130.57. Short-term upward movement, as well as consolidation is in the range of 130.57 - 131.23. For the potential value for the top, we consider the level of 132.17. Upon reaching which, we expect consolidation, as well as a pullback to the bottom. Short-term downward movement is possibly in the range of 127.94 - 127.33. The breakdown of the latter value will favor the development of a downward structure. Here, the first goal is 126.48. For the potential value, we consider the level of 125.57. The main trend is building potential for the top of August 12. Trading recommendations: Buy: 129.67 Take profit: 130.55 Buy: 130.60 Take profit: 131.20 Sell: 127.30 Take profit: 126.50 Sell: 126.44 Take profit: 125.60 The material has been provided by InstaForex Company - www.instaforex.com |
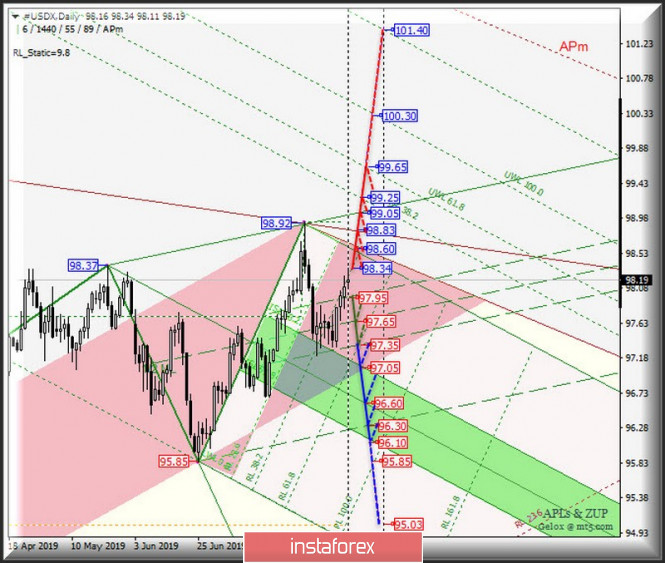
| Posted: 19 Aug 2019 04:46 PM PDT Minor (H4) Let us consider the comprehensive analysis of the development options for the movement of the currency instruments AUD / USD vs USD / CAD vs NZD / USD vs #USDX from August 19, 2019 on the Minor operational scale (daily timeframe) ____________________ US Dollar Index From August 19, 2019, the development of the movement of the dollar index #USDX will be determined by working out and the direction of the breakdown of the range:
The breakdown of the support level of 97.95 is an option for the development of the #USDX movement in 1/2 Median Line Minuette channel (97.95 - 97.65 - 97.35), and when the breakdown of the lower boundary (97.35) of this channel occurs, then the downward movement of the dollar index can continue to the equilibrium zone (97.05 - 96.60 - 96.10) Minuette operational scale fork. Updating the local maximum of 98.34 will make the development of the upward movement #USDX to the goals relevant - the initial SSL line (98.60) of the Minuette operational scale fork - the UTL control line (98.83) of the Minor operational scale fork - control line UTL Minuette (99.05) - warning lines UWL38.2 Minuette (99.25) - warning lines UWL61.8 Minuette (99.65). The markup of #USDX motion options from August 19, 2019 is shown in the animated chart. ____________________ Australian dollar vs US dollar The development of the movement of the Australian dollar/US dollar (AUD / USD) from August 19, 2019 will also be due to the development and direction of the breakdown of the range :
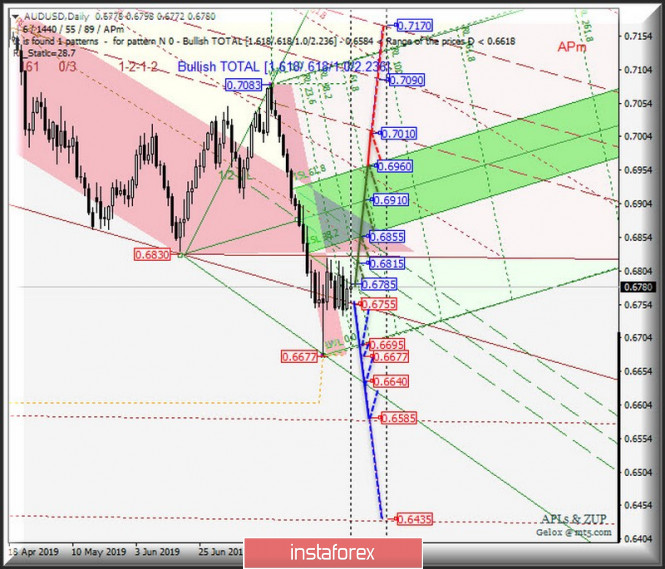
The breakdown of the resistance level of 0.6785 will make it possible to develop the movement of the Australian dollar within the boundaries of the 1/2 Median Line channel (0.6785 - 0.6815 - 0.6855) and the equilibrium zone (0.6855 - 0.6910 - 0.6960) of the Minuette operational scale fork with the prospect of reaching the lower boundary of the 1/2 Median Line channel (0.7010) Minor operating scale fork. In case of the breakdown of the LTL control line (support level of 0.6755) of the Minor operational scale forks, the downward movement of AUD / USD can continue to the targets - the initial SSL line (0.6695) of the Minuette operational scale forks -minimum 0.6677 - control line LTL Minuette (0.6640) - warning line LWL38.2 Minor (0.6585). From August 19, 2019, we look at the layout of the AUD / USD movement options on the animated chart. ____________________ New Zealand dollar vs US dollar Similarly with the previous currency instruments, the movement of the New Zealand dollar/US dollar (NZD / USD) from August 19, 2019 will also be due to the development and direction of the breakdown of the range :
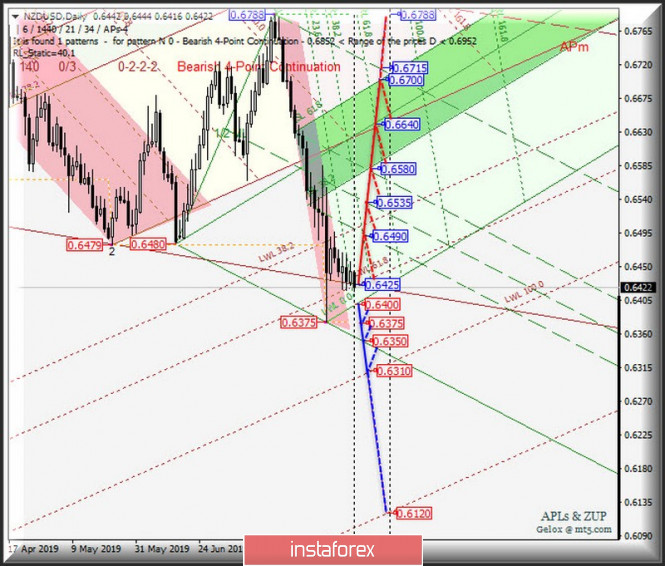
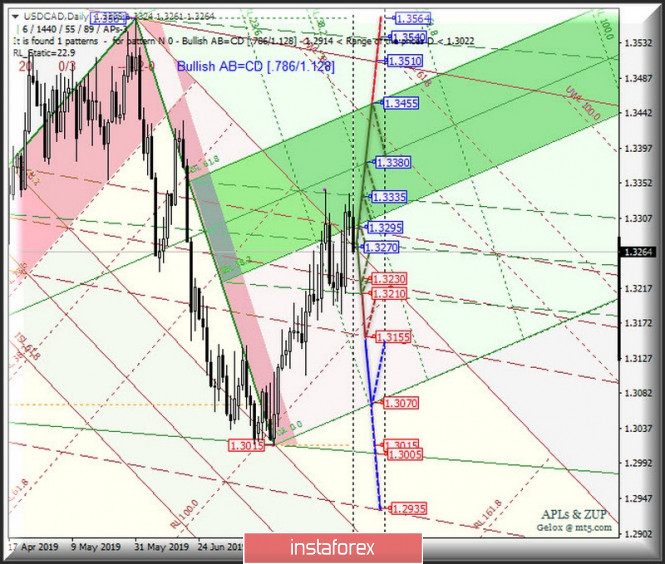
The breakdown of the resistance level of 0.6425 (control line LTL of the Minor operational scale fork); will continue the development of the upward movement of NZD / USD to the boundaries of the 1/2 Median Line channel (0.6490 - 0.6535 - 0.6580) and the equilibrium zone (0.6580 - 0.6640 - 0.6700) of the Minuette operational scale fork. On the other hand, the breakdown of the initial SSL line (support level of 0.6400) of the Minuette operational scale fork will determine the option to continue the downward movement of the New Zealand dollar to the targets - minimum 0.6375 - LTL control line Minute (0.6350) - warning line LWL38.2 (0.6310) Minor operational scale fork. From August 19, 2019, we look at the markup of the NZD / USD movement options in the animated chart. ____________________ US dollar vs Canadian dollar The development of the movement of the US dollar/ Canadian dollar (USD / CAD) from August 19, 2019 will be determined by working out and the direction of the breakdown of the boundaries of the 1/2 Median Line channel (1.3335 - 1.3270 - 1.3210) of the Minuette operational scale fork. The details of the movement inside this channel are shown on the animated chart. . The breakdown of the lower boundary of the 1/2 Median Line channel (support level of 1.3210) of the Minuette operational scale fork will make it possible to continue the downward movement of the Canadian dollar to the targets - the lower boundary of the 1/2 Median Line channel (1.3155) of the Minor operational scale fork - the initial SSL Minuette line (1.3070) with the prospect of updating the local minimum 1.3015. As a result of the breakdown of the resistance level of 1.3335 (the upper boundary of the 1/2 Median Line channel of the Minuette operational scale fork), it will be possible to continue the movement of USD / CAD in the equilibrium zone (1.3295 - 1.3380 - 1.3455) of the Minuette operational scale fork. From August 19, 2019, we look at the markup of the USD / CAD movement options in the animated chart. ____________________ The review was compiled without taking into account the news background. The opening of trading sessions of major financial centers does not serve as a guide to action (placing orders " sell " or " buy ") The formula for calculating the dollar index: USDX = 50.14348112 * USDEUR0.576 * USDJPY0.136 * USDGBP0.119 * USDCAD0.091 * USDSEK0.042 * USDCHF0.036. where the power coefficients correspond to the weights of the currencies in the basket: Euro - 57.6%; Yen - 13.6%; Pound Sterling - 11.9%; Canadian dollar - 9.1%; Swedish Krona - 4.2%; Swiss franc - 3.6%. The first coefficient in the formula leads the index to 100 at the start date of the countdown - March 1973, when the main currencies began to be freely quoted against each other. The material has been provided by InstaForex Company - www.instaforex.com |
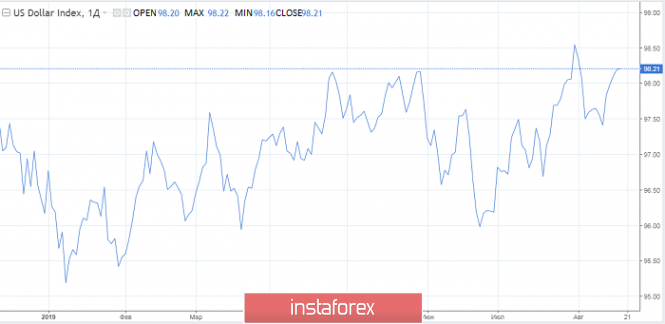
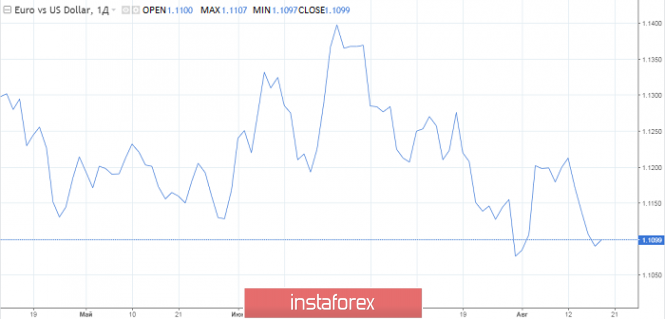
| The euro will continue to focus on falling Posted: 19 Aug 2019 04:30 PM PDT Last week, the EUR/USD pair was a step away from updating its annual low and found a local trough at 1.1065. A decrease in the consumer sentiment index from the University of Michigan to its lowest level over the past seven months somewhat cooled the outburst of the "bears" in EUR/USD. However, this did not force them to abandon their plans. The weakness of the European economy, the focus of the European Central Bank (ECB) on easing monetary policy, as well as increasing political risks in the region make the euro currency vulnerable. You should not be surprised then at the increase in the chances of its decline by the end of this month to $1.1. A week ago, the derivatives market estimated the likelihood of such a scenario to be realized at more than 16%, while now these chances are 49%. Obviously, the policy of American protectionism has a more devastating effect on China and the eurozone than on the United States. This is evidenced by the fact that an industry from the eurozone had plummet into an abyss, and the fall of 0.1% of German GDP in the second quarter. Bloomberg analysts predict a further decline in German purchasing managers' indices in August, which increases the risks of a technical recession in the largest currency bloc economy. The divergence of economic growth between the EU and the US is well traced in the dynamics of such an indicator as the index of economic surprises. This fact does not allow the bulls to sleep peacefully for the euro. If last year investors still had hope that the eurozone would get on its feet and begin to accelerate, then this year it seems that they will be disappointed. The United States still looks like an island of stability in the ocean of world recession. The "bearish" factor for the euro is also the deterioration of the political landscape in the EU. In Italy, a split in the ruling coalition allowed the country's deputy prime minister, Matteo Salvini, to initiate a motion of no confidence in the head of government, Giuseppe Conte. Early Parliamentary elections loomed on the horizon, and the flight of investors from the Italian debt market was reflected in the increase in the differential yield of local and German government bonds. On the contrary, the greenback is doing well. Of course, the USD index rally complicates the life of US exporters and helps reduce corporate profits, but this is an objective process. When rates on government bonds in the United States are higher than in other countries, and the US economy looks better, the dollar, it would seem, is doomed to strengthen. However, there is a fly in the ointment - US President Donald Trump's dissatisfaction with the Fed's actions and, as a result, a possible reduction in the rate of federal funds by the end of this year from 2.25% to 1.75%. However, it is unlikely that the Chairman of the Federal Reserve, Jerome Powell in Jackson Hole, will want to signal a cut in interest rates by 50 basis points at once in September. As for the minutes of the July meeting, it can show the arguments of dissenters who opposed for the FOMC members to ease monetary policy. It is assumed that this will support the EUR/USD bears. In such conditions, the continuation of the fall of the main currency pair seems quite logical. The material has been provided by InstaForex Company - www.instaforex.com |
| EUR/USD: Waiting for the $1.10 mark? Posted: 19 Aug 2019 04:30 PM PDT Last week turned out to be favorable for the US currency. The dollar recovered against key competitors with the exception of the pound. Reports from the United States confirmed the recent statements by the head of the Fed regarding the sustainability of the economy. However, they are not reducing the likelihood of further policy easing in the United States. Markets are estimating a 100% likelihood of a reduction in rates by 25 bps in September. It seems that it will be difficult for dollar fans to keep control over the market. It is worth noting that while the majority of the Federal Reserve officials did not give clear hints of an early softening of the policy. When the signals of the central bank contradict market expectations, financiers, as a rule, begin to become active in terms of appearances. Now this is not noticeable. Perhaps this has something to do with the Jackson Hole symposium, where they will catch up. The symposium can be an ideal platform for adjusting market expectations. The mood of traders and investors will depend on the words of Jerome Powell. In addition to the head of the regulator, other officials will speak at this event. Before the symposium, the market will pay attention to the publication of the minutes of the sensational July meeting. If it turns out that FOMC members advocate lowering rates next month, the US central bank will have to downplay the impact of rising costs and retail sales. It is possible that some FOMC representatives will openly declare the need to soften their policies, although in July the majority was against such a move. There have been some changes since then. In this situation, a full portion of the negative will receive such pairs as USD/JPY and USD/CHF. Bulls on the dollar will be happy if financial officials focus on improving macroeconomic statistics. The US currency will receive support, as this will be a hint that the regulator will postpone rate cuts. The euro, which fell against the dollar during 4 of the last 5 sessions, is doing poorly. Data on the eurozone were mostly weak. If it goes on like this, the main pair risks breaking the 1.10 mark. The expected market data on business activity in the region may disappoint. However, at the end of last week, the single currency was supported by important news from Germany. The German government is preparing to expand public spending in the event of a recession. Monetary stimulation will certainly improve the situation, but before the authorities of Germany announce concrete steps, a month will pass, and maybe more. During this time, the ECB will have time to reduce the rate. The dynamics of the euro will depend on the nature of the incentive measures. The material has been provided by InstaForex Company - www.instaforex.com |
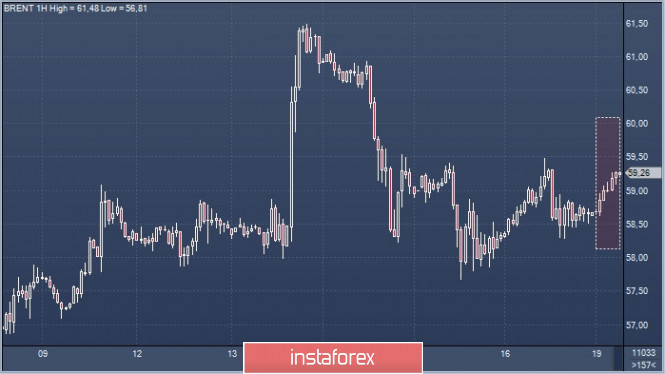
| On the positive: oil starts the week with growth Posted: 19 Aug 2019 04:23 PM PDT Earlier this week, oil quotes showed an upward turn during the Asian session. According to analysts, such growth occurred for the first time in the past seven weeks. On Monday, August 19, quotes for September futures for the WTI light variety rose 0.97% to $55.40 per barrel, while the Brent brand rose 1.06% to $59.26 per barrel. According to analysts, two factors provide significant support for black gold prices: the escalation of geopolitical tensions in the Middle East due to damage to the oil infrastructure in Saudi Arabia and the progress in US-Chinese trade negotiations. Recall that tensions in the Middle East provoked the actions of the Yemeni separatists, who attacked an oil factory in Saudi Arabia with the help of drones. Many analysts are confident that the rise in oil prices in the near future is unlikely due to weak growth in demand. Pressure on the black gold market is also exerted by current OPEC forecasts. The department emphasizes that in 2019, the growth in world oil demand was 40 thousand barrels per day less than previous forecasts. According to experts, it will amount to 1.1 million barrels per day. In 2020, a slight excess of demand over supply is expected, representatives of the cartel said. Analysts consider this observation to be very important, since OPEC very rarely gives "bearish" forecasts for the oil market. |
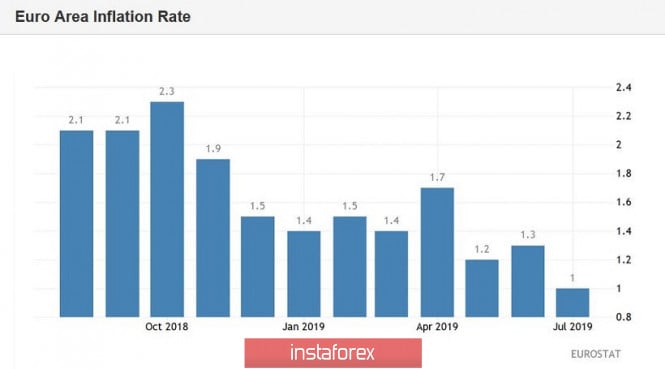
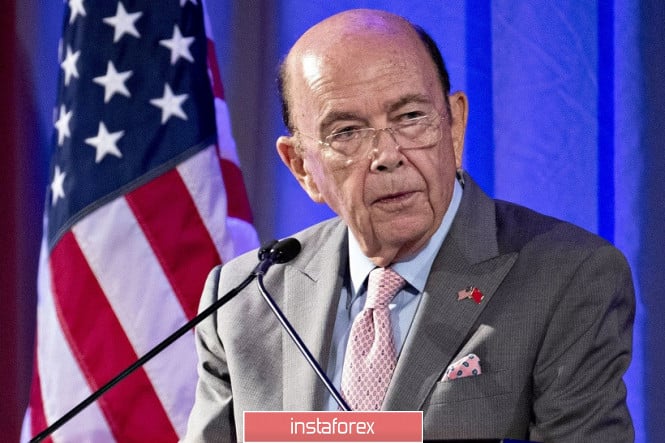
| EUR/USD: market noise and sluggish struggle for the 11th figure Posted: 19 Aug 2019 03:45 PM PDT Against the background of an empty economic calendar, the euro-dollar pair is trading at the boundary of the 11th figure, showing phlegmatic price movements within 30 points. Traders are in no hurry to open major positions in anticipation of the Jackson Hole Symposium, during which representatives of the central bank of leading countries of the world will speak. On the whole, the current trading week is poor enough for events of a fundamental nature. For example, today EUR/USD traders were content only with data on the growth of European inflation (final estimate for July) and the Bundesbank report. These fundamental factors were actually ignored by the market, despite the fact that one of the components of European inflation was revised downward. Thus, according to the final assessment, the general consumer price index in July grew by only 1%, whereas initially this indicator reached 1.1%. And although we are talking about minimal fluctuations, the European currency fell to the level of 1.1088, updating the low of the day. However, it quickly recovered, freezing in tandem with the dollar at the boundary of the 11th figure. The core inflation index has not been revised downward, and this fact seems to have reassured investors. The Bundesbank report, in turn, was not surprising: according to members of the German regulator, the general state of the country's economy may deteriorate in the near future, mainly due to a decline in industry. Also, the central bank of Germany noted a weakening labor market and a decrease in the confidence index in the service sector. Despite such pessimistic forecasts, traders ignored this report. This is partly due to the fact that the market has already won back the data on the growth of the German economy published last week. In addition, traders did not dramatize the situation for another reason. Let me remind you that at the end of last week, representatives of the German government said that Berlin could allow a budget deficit by loosening budget saving rules and abandoning a zero-deficit policy. In other words, Angela Merkel allowed the option of fiscal stimulus and budget deficit. Given this rhetoric, the Bundesbank report is of secondary importance. In general, the euro-dollar pair is behaving quite calmly today, given the conflicting fundamental background and the uncertainty regarding further actions of both the ECB and the Fed. Representatives of the European regulator are increasingly saying that in September the central bank will be forced to decide on additional incentive measures. In particular, today the head of the central bank of Estonia Madis Muller said this. But his colleague from Finland, Olli Rehn, scared the market last week that the European regulator will resort to comprehensive measures to mitigate monetary policy this fall. According to him, the ECB can not only reduce the interest rate to -0.5%, but also announce new purchases of bonds worth about 50 billion euros per month as part of a quantitative easing program. In addition, the head of the central bank of Finland suggested that the European Central Bank at one of its next meetings could change the rules of its bond purchase program, which currently prohibits the regulator from acquiring more than 33% of the debt of any individual eurozone government. Thus, according to Rehn, the ECB is ready to apply very aggressive measures to mitigate monetary policy. But here it is worth noting that this issue is debatable - not all members of the European Central Bank share such dovish positions (in particular, the Germans adhere to more restrained views). Therefore, the single currency after Olli Rehn's comments was able to stay within the 10th figure, although it is under background pressure. The US currency, coupled with the euro, also cannot spread its wings, despite the fact that the dollar index is at its highest annual values (in the region of 98 points). The situation in the debt market, where the inversion of the yield curve was recorded (the yield of two-year US government securities turned out to be higher than the yield of similar ten-year securities), worries investors, and this fact does not allow the dollar to develop a full-scale offensive. Traders are nervous about the possible reaction from the Fed. Although US Secretary of Commerce Wilbur Ross said today that inversion is not a 100 percent sign of an impending recession, this served as little comfort to market participants. Investors are waiting for the speech of the head of the Federal Reserve Jerome Powell, who will speak on Friday to participants in the economic symposium in Jackson Hole. Thus, the dollar and the euro are under pressure from "their" fundamental factors, causing the pair to turn flat in a fairly narrow price range. If we talk about the technical picture, then the downward scenario clearly emerges. On the daily chart, the pair is between the middle and lower lines of the Bollinger Bands indicator, which indicates the priority of the bearish movement. The pair is also located under the Kumo cloud, the Ichimoku indicator itself has formed a bearish "Parade of Lines" signal. Oscillators are also in favor of the downwards direction, which indicate the oversold pair. The first downward target for the pair is 1.1060, this is the bottom line of the Bollinger Bands indicator on the daily chart. The main target of the bears is lower, at the bottom of the 10th figure (annual low of 1.1028), breaking through which will open the way to the ninth figure. But for now, it's premature to talk about this: first, the bears must finally gain a foothold in the 10th figure before considering further downwards prospects. The material has been provided by InstaForex Company - www.instaforex.com |
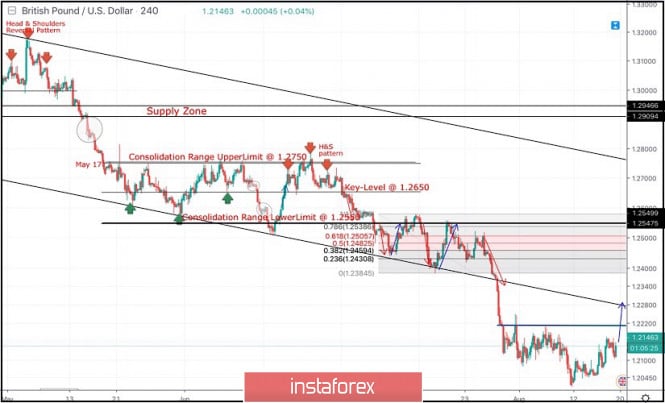
| August 19, 2019 : GBP/USD Intraday technical analysis and trade recommendations. Posted: 19 Aug 2019 08:59 AM PDT
Since May 17, the previous downside movement within the depicted bearish channel came to a pause allowing the recent sideway consolidation range to be established between 1.2750 - 1.2550. On July 5, a bearish range breakout was demonstrated below 1.2550 (the lower limit of the depicted consolidation range). Hence, quick bearish decline was demonstrated towards the price zone of 1.2430-1.2385 (the lower limit of the movement channel) which failed to provide consistent bullish demand for the GBP/USD. Moreover, Bearish breakdown below 1.2350 facilitated further bearish decline towards 1.2320, 1.2270 and 1.2100 which correspond to significant key-levels on the Weekly chart. The current price levels are quite risky/low for having new SELL entries. That's why, Previous SELLERS were advised to have their profits gathered. Two weeks ago, temporary signs of bullish recovery were demonstrated around 1.2100 before Friday when another bearish movement could be demonstrated towards 1.2025. Recent bullish recovery was demonstrated off the recent bottom (1.2025) bringing the GBP/USD pair back towards 1.2100 (recently-established SUPPLY Level). This is supposed to enhance further bullish advancement towards 1.2230 then 1.2320 if the current bullish momentum above 1.2100 is maintained on daily basis. Trade Recommendations: Intraday traders were advised to look for early bullish breakout above 1.2100 then above 1.2230 for counter-trend BUY entries. Conservative traders should wait for bullish pullback to pursue towards 1.2320 - 1.2350 for new valid SELL entries. S/L should be placed above 1.2430. Initial T/P level to be placed around 1.2279 and 1.2130. The material has been provided by InstaForex Company - www.instaforex.com |
| August 19, 2019 : EUR/USD Intraday technical analysis and trade recommendations. Posted: 19 Aug 2019 08:52 AM PDT
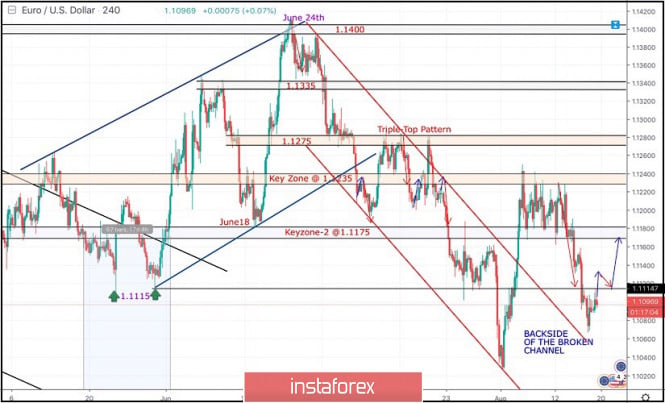
Back in June 24, the EURUSD looked overbought around 1.1400 facing a confluence of supply levels. In the period between 8 - 22 July, sideway consolidation-range was established between 1.1200 - 1.1275 until a triple-top reversal pattern was demonstrated around the upper limit. Shortly after, evident bearish momentum (bearish engulfing H4 candlestick) could bring the EURUSD back below 1.1175. This facilitated further bearish decline towards 1.1115 (Previous Weekly Low) where temporary bullish rejection was demonstrated before bearish breakdown could take place on July 31. On July 31, Temporary Bearish breakdown below 1.1115 allowed further bearish decline towards 1.1025 (lower limit of the depicted recent bearish channel) where significant signs of bullish recovery were demonstrated. Risky traders were advised to look for bullish persistence above 1.1050 as a bullish signal for Intraday BUY entry with bullish target projected towards 1.1115, 1.1175 and 1.1235. Two weeks ago, the depicted Key-Zone around 1.1235 has been standing as a prominent Supply Area where THREE Bearish Engulfing H4 candlesticks were demonstrated. Thus, the EUR/USD was trapped between 1.1235-1.1175 for a few trading sessions until bearish breakout below 1.1175 occurred on August 14. Bearish breakout below 1.1175 promoted further bearish decline towards 1.1075 where the backside of the broken bearish channel was located. Around 1.1075, significant bullish recovery signs were manifested on the chart (Bullish Engulfing H4 candlestick). A quick bullish breakout above 1.1115 is needed to confirm the short-term trend reversal into bullish. This would enhance further bullish advancement towards 1.1175. Trade recommendations : Conservative traders can have a valid BUY entry anywhere around 1.1070 (where the backside of the broken bearish channel is located). S/L should be placed just below 1.1020 while initial T/P levels should be located around 1.1130, 1.1175 and 1.1200. The material has been provided by InstaForex Company - www.instaforex.com |
| BTC 08.19.2019 - Double bottom formation confirmed Posted: 19 Aug 2019 07:29 AM PDT Industry news: The average crypto market sentiment measure, Sentscore, for the top 10 coins dropped further this Monday to 4.37, below last week's 4.76 and even below 4.43 from three weeks ago, according to Omenics, a crypto market sentiment analysis service. However, the sentiment improved sharply in the past 24 hours. Daily view:
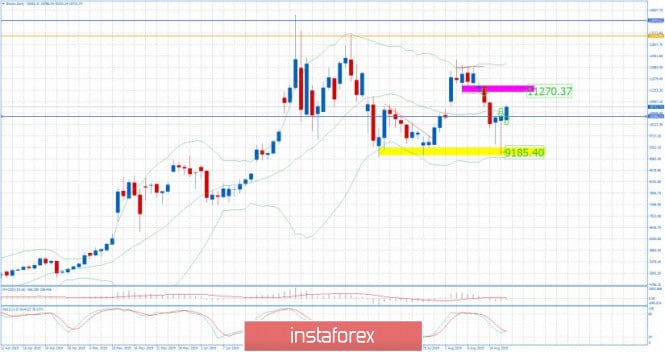
Based on the daily time-frame, I found successful rejection of the key support at the price of $9,185 (my Friday's target), which is good indication for more upside. Stochastic oscillator got fresh bull cross and this is just another confirmation for the further upside and potential test of $11,270. 4H time-frame view:
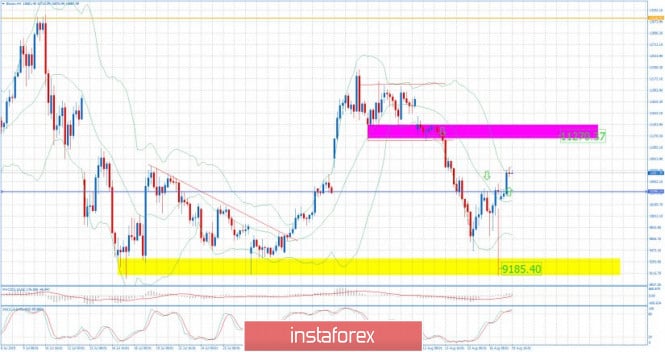
Based on the 4H time-frame, I found double bottom formation and strong reversal bar in the background, which is strong sign that upward momentum is present. MACD entered into positive territory. Trading recommendation: According to current market condition, my advice is to watch for buying opportunities on the pullbacks with the first target at $11,270. The material has been provided by InstaForex Company - www.instaforex.com |
| Posted: 19 Aug 2019 07:24 AM PDT EUR/USD
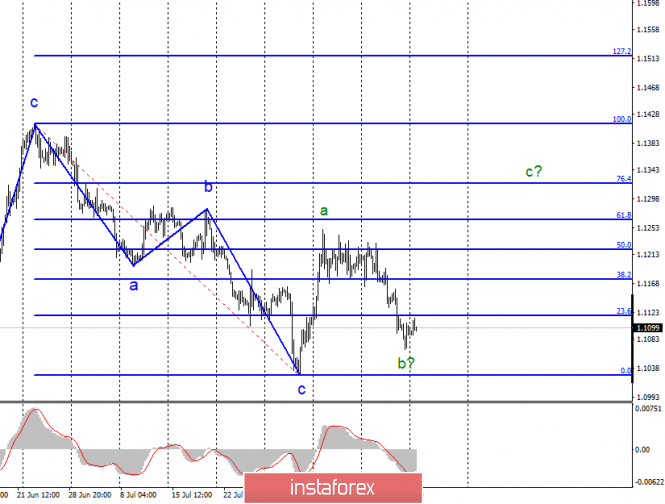
On Friday, August 16, the EUR/USD pair declined by 20 basis points. Thus, the estimated wave b continues its formation and threatens to go beyond the minimum of wave c. If that happens, then the wave pattern will require adjustments, and the downward trend can be very complicated. On Monday, August 19, is held in quiet trading, although they had every chance to be restless and negative for the euro. The only but very important report of the day – inflation in the eurozone – was significantly worse than the expectations of the foreign exchange market. Inflation slowed to 1.0% y/y in the European Union and lost 0.5% monthly. The core consumer price index fell to 0.9% y/y and lost 0.6% monthly. Thus, this would be enough for the bears to start putting pressure on the euro/dollar pair again. However, this did not happen, perhaps because wave b still needs to be completed. In general, as long as the instrument does not go beyond the minimum of the wave c, there are good chances of building a third wave of the upward trend with targets located above the mark of 1.1250. Before the ECB lowers the rate, the pair needs to build a wave up. Purchasing goals: 1.1264 – 61.8% Fibonacci 1.1322 – 76.4% Fibonacci Sales targets: 1.1027 – 0.0% Fibonacci General conclusions and trading recommendations: The euro/dollar pair continues building the upward trend channel. Given the proximity to the minimum of the wave c, now is a good time to buy a tool based on the construction of the wave c with targets located above 1.1250. I recommend placing restrictive orders under the minimum of August 1. GBP/USD
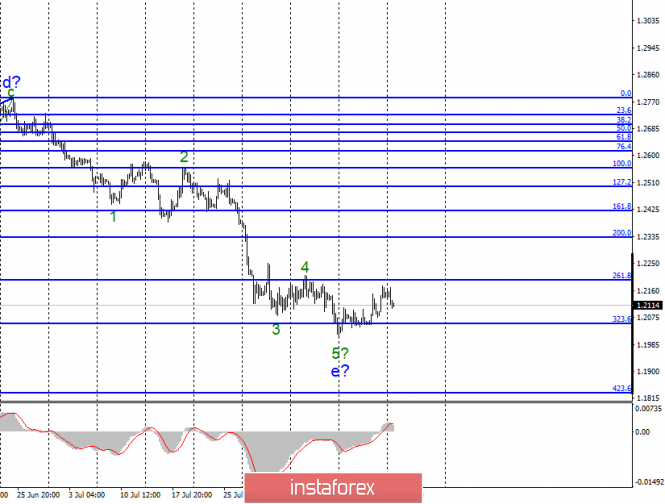
On August 15, the GBP/USD pair gained about 50 base points and continues a sluggish retreat from the previously achieved lows. At the moment, the fifth wave is still considered as completed, but the news background is still not on the side of the pound. However, in early September, when the Parliament will come out of holidays and start working sessions, there may be events that will not only affect the course of the instrument but also change the mood in the market for several months. In recent months, the pound has been falling non-stop, because the market expects disordered Brexit and there was not a single hint that Boris Johnson will find a way to negotiate with the EU and avoid a tough scenario. Now, a vote of no confidence can be announced to Boris Johnson, and he can resign. And in this case, the probability of a hard Brexit will significantly decrease, and the British pound may become enthusiastic and rush up due to this news, as it is greatly oversold, and the bears will begin to close sales. Sales targets: 1.2056 – 323.6% Fibonacci 1.1830 – 423.6% Fibonacci Purchasing goals: 1.2334 – 200.0% Fibonacci General conclusions and trading recommendations: The downward part of the trend may become even more complicated. Although the wave e appears to be complete, it may take a more complicated form. Thus, on the break of the minimum of August 12, I recommend considering the pair's sales with targets near the level of 1.1830, which corresponds to 423.6% of Fibonacci. There are certain chances for the pound to grow now, the main thing is that the news background does not cause new sales until early September. The material has been provided by InstaForex Company - www.instaforex.com |
| GBP/USD 08.19.2019 -Potential test of the 20SMA on daily time-frame Posted: 19 Aug 2019 06:57 AM PDT Daily view:
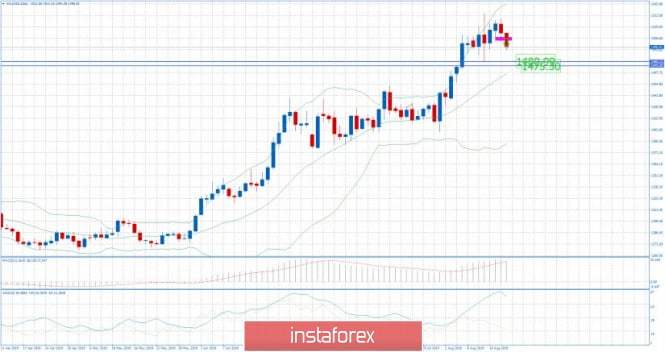
Based on the daily time-frame, I found that Gold is trading in consolidation mode and that there is potential for the testing of 20SMA around $1,475-$1,480. So, more potential downside and then I still expect more upside, probably tomorrow. 4H time-frame view:
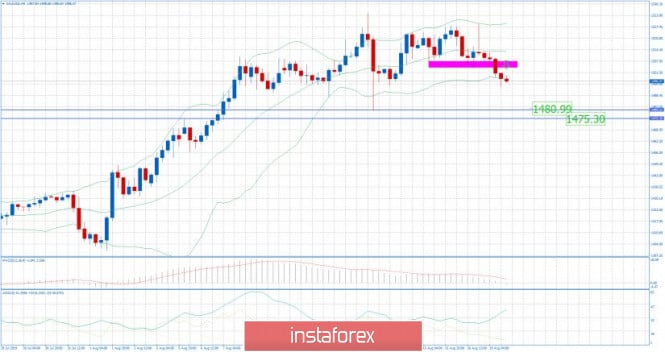
Based on the 4H time-frame, I found breakout of the support at the price of $1,503, which is sign of the intraday selling pressure.ADX reading is above 35, which is clear sign for the potential more downside before potential new wave up. Trading recommendation: According to current market condition, my advice is to watch for selling opportunities due to underlying intraday downward trend. Downward targets are set at the price of $1,475-$1,480. Resistance level is set at the price of $1,405. The material has been provided by InstaForex Company - www.instaforex.com |
| EUR/USD for August 19,2019 - Down reversal candle on weekly time-frame Posted: 19 Aug 2019 06:40 AM PDT Weekly view:
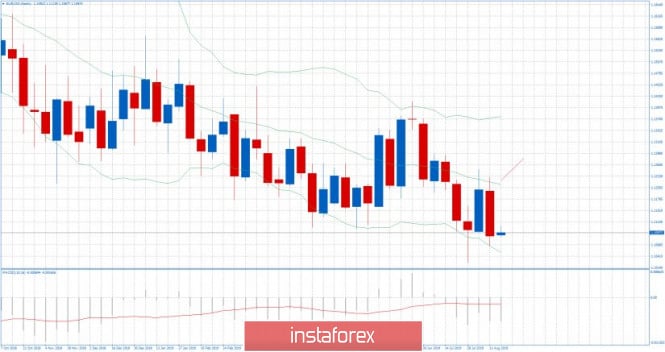
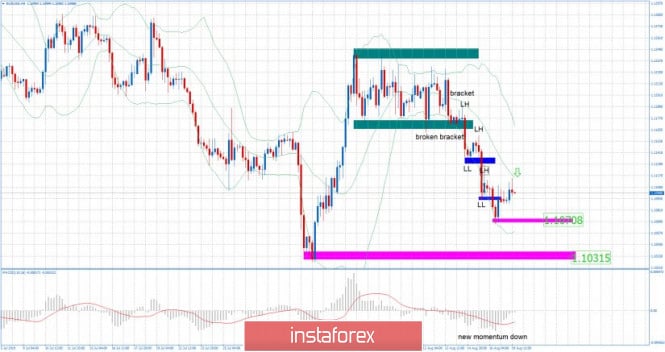
Based on the weekly time-frame, I found that key resistance at the price of 1.1226 held last week and that we got strong rejection of the middle Bollinger band (20SMA), which is good sign for further downside. Additionally, there is reversal bearish engulfing candle, which is another confirmation of the weakness. 4H time-frame view:
Based on the 4H time-frame, I found new momentum down on the MACD oscillator, which is sign of the underlying bearish pressure. I also found rejection of the middle Bollinger band (20SMA) at 1.1115, which provides good sell zone. Watch for more downside. Trading recommendation: According to current market condition, my advice is to watch for selling opportunities due to underlying short-term downward trend. Downward targets are set at the price of 1.1070 and 1.1031. Resistance levels are found at the price of 1.1118 and 1.1128. The material has been provided by InstaForex Company - www.instaforex.com |
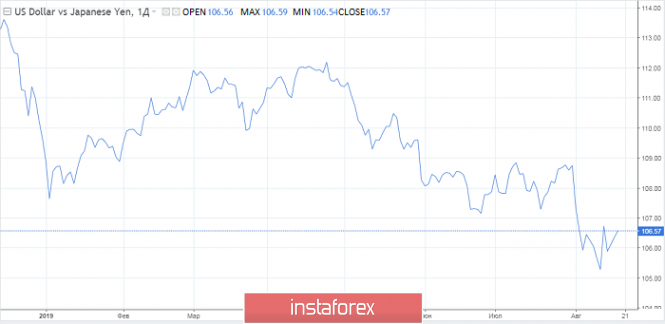
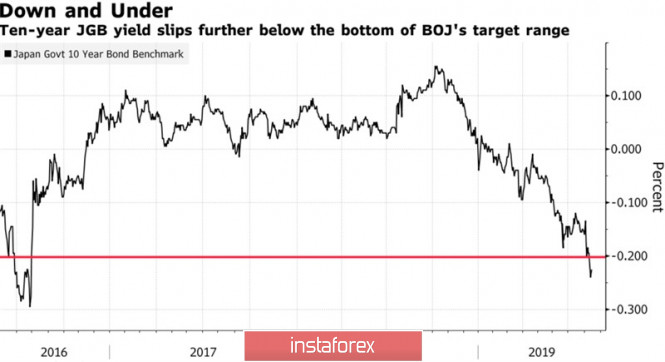
| Posted: 19 Aug 2019 05:51 AM PDT After the rapid strengthening of the safe-haven currencies in the first half of August, investors prefer to close positions, weighing the risks. On the one hand, the slowdown in global GDP, trade wars and increased volatility of financial markets support the demand for the Japanese yen and the Swiss franc. On the other hand, expectations of a large-scale monetary stimulus from the ECB and the Fed extend a helping hand to global stock indices. In this regard, the week to August 23 may become decisive in the fate of USD/JPY. The G7 summit, a possible vote of no confidence in Italian Prime Minister Giuseppe Conte, the publication of the minutes of the July FOMC meetings and the ECB Governing Council, the White House verdict on Huawei, as well as the speech of Jerome Powell in Jackson hole – the five-day period promises to be saturated with important events that will surely make USD/JPY and EUR/JPY move. The yen is sensitive to the slowdown of the world economy and trade wars but begins to lose the status of a safe haven asset, yielding it to the US dollar. This was the case in 2018 when the escalation of the trade conflict between the US and China led to an increase in the USD index. It's just that the American economy looks better than its competitors, and the demand for Treasury bonds is great. However, despite the strong labor market, the acceleration of core inflation to 2.2% and high GDP growth, the difference between the yield of 10 and 2-year US bonds inverted what happened for the first time since 2007. Over the past half-century, the indicator predicted a recession, so investors fear that the States are at the peak of the economic cycle, followed by a recession, and require the Fed to reduce the federal funds rate. The Central Bank is quite able to extend the already record economic expansion, as it was in the 1990s. The Fed's willingness to weaken monetary policy in preventive measures, the ECB – to revive QE and reduce rates – leads to an increase in the global debt market with a negative yield of up to $16.7 trillion. The rates on Japan's 10-year bonds against the background of the global trend also went below the critical level of -0.2%, forcing BoJ to intervene. Also, the market is rumored that the rebound of USD/JPY from the psychologically important level of 105 – the merit of the Central Bank. He used currency interventions to prevent further decline in business activity. Japanese companies expect that the dollar will be £105-108 in the current financial year, and if it falls below, it will begin to reduce investment. Dynamics of Japanese bond yields
Thus, investors are evaluating the ability of central banks with the help of a large-scale monetary stimulus to suspend the process of the global economic slowdown. It will turn out – the stock indices will go up, and the USD/JPY pair will continue to adjust. No – we expect the development of a pullback on the S&P 500 and the recovery of the upward trend on the yen. Technically, USD/JPY continues to implement the pattern 5-0 on the daily chart. The situation is controlled by the "bears", and only the growth of quotations above 109.3 will increase the risks of a reversal of the downward trend. In this scenario, the expanding wedge model will be activated. The material has been provided by InstaForex Company - www.instaforex.com |
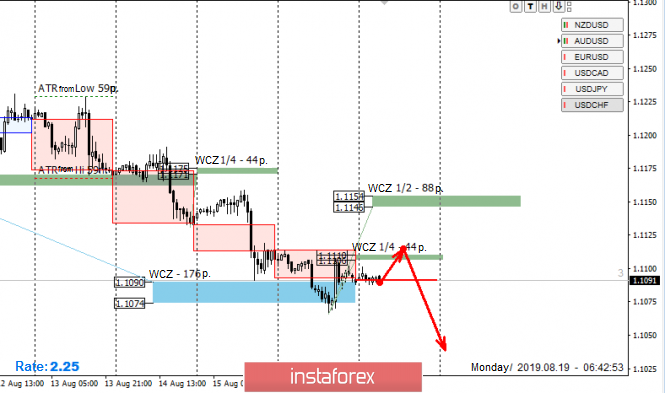
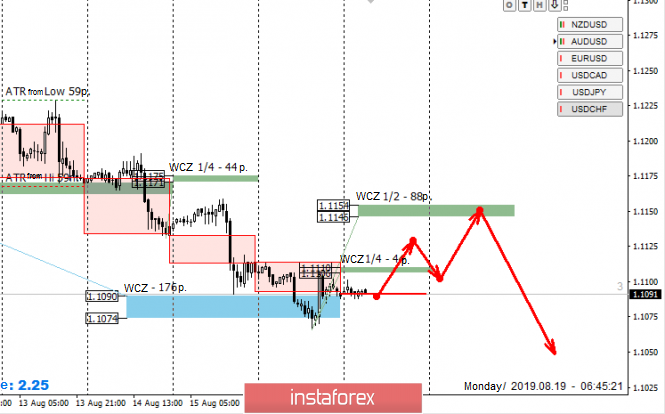
| Control zones for EUR/USD pair on 08/19/19 Posted: 19 Aug 2019 04:44 AM PDT Working in a downward direction is a priority, which indicates the need to find favorable prices for sale. The 1/4 WCZ of 1.1110-1.1106 will be the first resistance. Testing of this zone can be considered for the formation of a "false breakdown" pattern. The best prices for sale are within the limits of 1/2 WCZ of 1.1154-1.1146. The movement to this zone fits into the framework of the average daily course, so this option can be considered today. A more difficult option would be the formation of a local accumulation zone with the closure of today's trading above the level of 1.1110. This will allow you to search for sales at better prices. Daily CZ - daily control zone. The area formed by important data from the futures market, which changes several times a year. Weekly CZ - weekly control zone. The area formed by marks from the important futures market, which changes several times a year. Monthly CZ - monthly control zone. The area is a reflection of the average volatility over the past year. The material has been provided by InstaForex Company - www.instaforex.com |
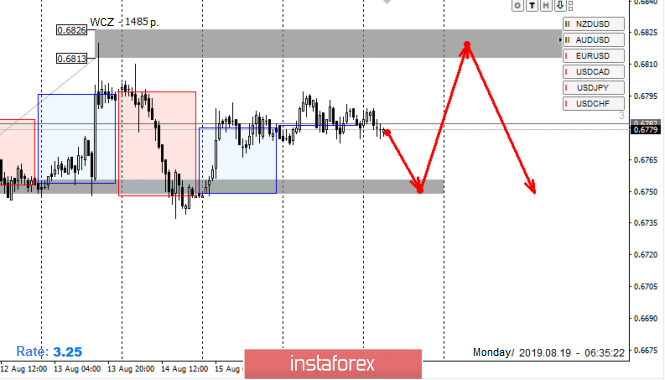
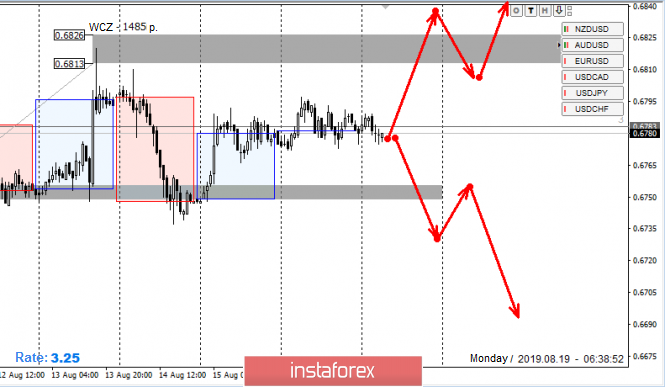
| Control zones for AUD/USD pair on 08/19/19 Posted: 19 Aug 2019 04:32 AM PDT The AUD/USD pair is traded in the accumulation zone formed between the two control zones. Working from the borders of the zone is the main plan for the beginning of the week. The formation of the flat continues, which gives opportunities for purchases from 1/2 CZ of 0.6755-0.6749 and sales from weekly CZ of 0.6826-0.6813. While the pair is trading between these zones, the fixation of transactions should also occur after reaching opposite levels. It doesn't matter which zone will be tested first. The search for the "false breakdown" pattern can be done at any of the borders. The model of going beyond the flat will become relevant if the closing of today's American session occurs either above the level of 0.6826 or below 0.6749. Exiting the flat will indicate the further priority of the second half of the month. Daily CZ - daily control zone. The area formed by important data from the futures market, which changes several times a year. Weekly CZ - weekly control zone. The area formed by marks from the important futures market, which changes several times a year. Monthly CZ - monthly control zone. The area is a reflection of the average volatility over the past year. The material has been provided by InstaForex Company - www.instaforex.com |
| Golden peaks: precious metal could approach $1700 Posted: 19 Aug 2019 04:29 AM PDT According to the calculations of specialists of the Swiss bank UBS, the price of gold can rise by more than 10% to $1,680 per 1 ounce in the next 18 months. The precious metal will be supported by such factors as a recession in the global economy, trade contradictions between countries and a number of geopolitical risks. According to the observations of bank analysts, an important role in the growth of prices for the yellow metal is played by the decline in the yield of other assets. In a situation of instability in the financial markets, when it is difficult to predict further price dynamics, investors are under pressure. This forces market participants to invest heavily in safe assets, primarily in gold. UBS calls this behavior optimal and strategically correct, emphasizing that owning gold in such a situation is very beneficial. Recall that recently the cost of yellow metal reached $1,520 per 1 ounce. According to the forecast of the Swiss bank, it can grow by 10% and amount to $ 1,680 per 1 ounce next year. According to experts of the financial institution, a catalyst for the growth of "gold" prices will be increased uncertainty in the global economy. Active interest among investors is caused by stocks of ETF-funds specializing in gold, as well as futures on precious metals. Recently, the volume of investments in these investment assets is breaking records. According to most analysts, the yellow metal has impressive potential to attract new investors. According to UBS experts, in 2020, the average price of gold will be $1,550 per 1 troy ounce. This is above the previous expectations of experts' forecast of $1,450 per ounce. The UBS is confident in the high potential of the precious metal and its ability to rise to almost $ 1,700 per 1 troy ounce. |
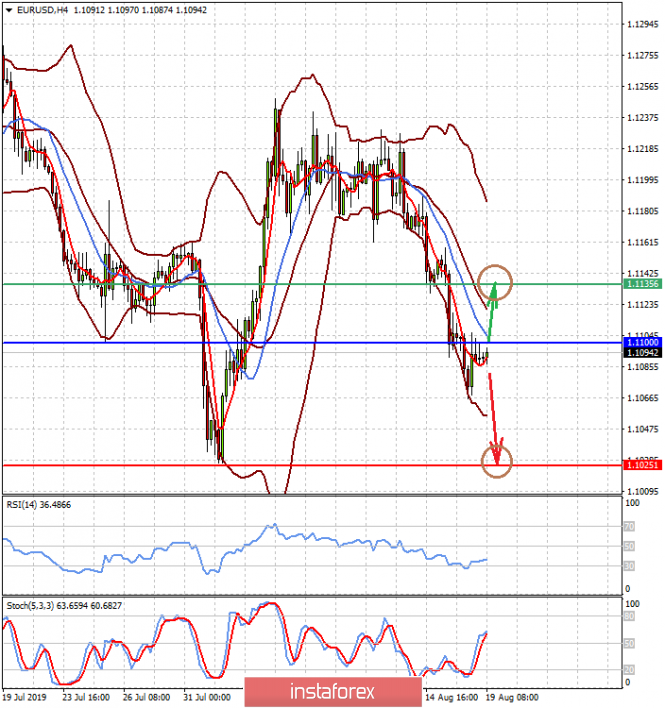
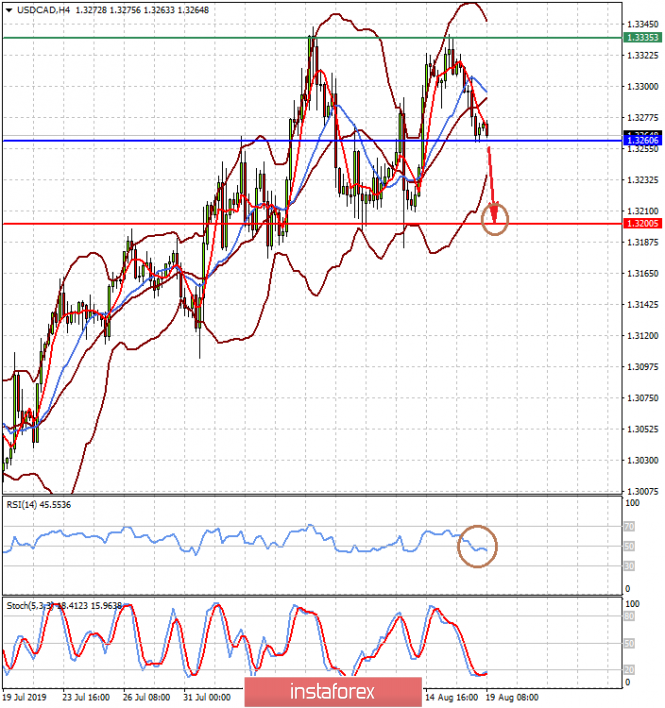
| Posted: 19 Aug 2019 04:19 AM PDT It seems that our thesis on the US dollar will be in demand as an asset, for which it will be possible to purchase protective US government bonds amid the uncertain prospects of a trade war between Washington and Beijing, as well as the Fed's monetary policy. In addition, the dollar also receives support as a world reserve currency amid growing expectations of a recession in the global economy. The focus of the market this week will be the speech of the head of the American regulator Jerome Powell at the traditional economic symposium in Jackson Hole. Investors continue to hope that the Central Bank will continue to lower interest rates amid increased fears of a recession in the United States. The University of Michigan consumer expectations index fell to 82.3 points in August from 90.5 points. The University of Michigan consumer sentiment index fell the same as the previous indicator to the beginning of the current year to the level of 92.1 points from 98.4 points. Perhaps, these extremely weak data were the reason that pushed up the American stock market as it once again inspired the markets with the hope that the Federal Reserve would not remain indifferent and would continue to cut interest rates. In general, the situation in the markets remains extremely nervous and threatens to develop into a real collapse in the continuation of the previous fall in stock prices. Observing this, we can say that the market just insistently demands a decrease in the cost of borrowing, intimidating the Federal Reserve with the impending fall in the value of stocks of companies. In this case, the demand for the dollar will only grow, exacerbating the ability of American goods and services to compete in world markets. We believe that this week may be decisive and force the American regulator to either decide to resume the process of lowering interest rates, or to refuse the pleasure of markets for the near future. Forecast of the day: The EUR/USD pair is balancing just below the level of 1.1100. If it overcomes it in the wake of some demand for risky assets, then the price may rise to 1.1135. But if she still fails to rise above this mark, she will turn around and continue to fall to 1.1025. The USD/CAD pair is testing the level of 1.3260 and overcoming of which on the wave of attempts to restore crude oil prices may lead to a continued fall in the price to 1.3200. |
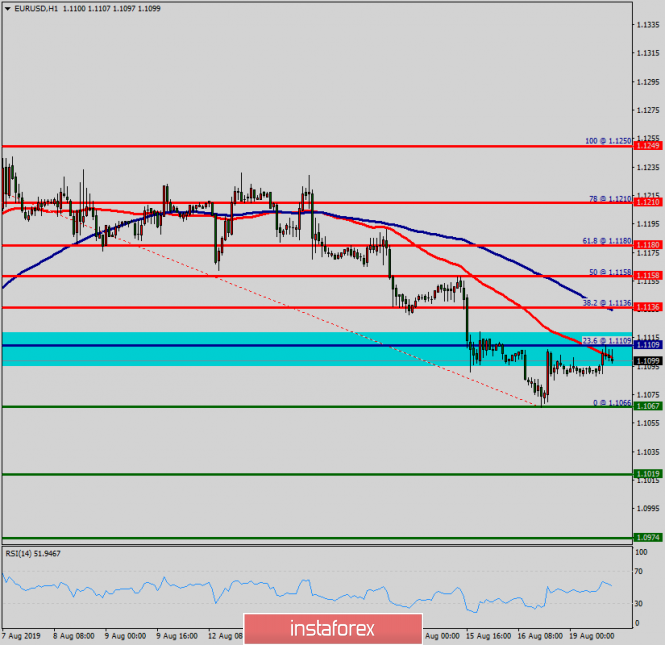
| Technical analysis of EUR/USD for August 19, 2019 Posted: 19 Aug 2019 04:12 AM PDT Overview: The EUR/USD pair opened below the weekly resistance 1 (1.1136). It continued to move downwards from the level of 1.1136 towards the spot of 1.1109 (the pivot point). Today, the first resistance level is currently seen at 1.1136, the price is moving in a bearish channel now. The RSI starts signaling a downward trend. As a result, if the EUR/USD pair is able to break out the first support at 1.1067, the market will decline further to 1.1019 in order to test the weekly support 2. Further close below the low end may cause a rally towards 1.0974. Nevertheless, the weekly support level and zone should be considered. In the H1 time frame, the pair will probably go down because the downtrend is still strong. Consequently, the market is likely to show signs of a bearish trend. So, it will be good to sell below the level of 1.1136 with the first target at 1.1067 and further to 1.1019. At the same time, the breakup of 1.1136 will allow the pair to go further up to the levels of 1.1249 so as to test the doblle top. The material has been provided by InstaForex Company - www.instaforex.com |
| Posted: 19 Aug 2019 02:52 AM PDT EURUSD has stopped its decline at the 78.6% Fibonacci retracement of the rise from 1.1026 to 1.1249. At least for the short-term we expect a bounce from current levels at 1.11 to see a bounce towards 1.12.
We also watch closely the RSI price as it is still inside the bearish channel. Breaking above the channel will increase the chances of a bounce in EURUSD towards 1.12. The RSI is turning upwards from oversold levels. First bounce target is at 1.12. If we break above the recent high at 1.1250, we should at least expect EURUSD to move towards 1.1290 if not higher. Medium and long-term trend remain bearish. The material has been provided by InstaForex Company - www.instaforex.com |
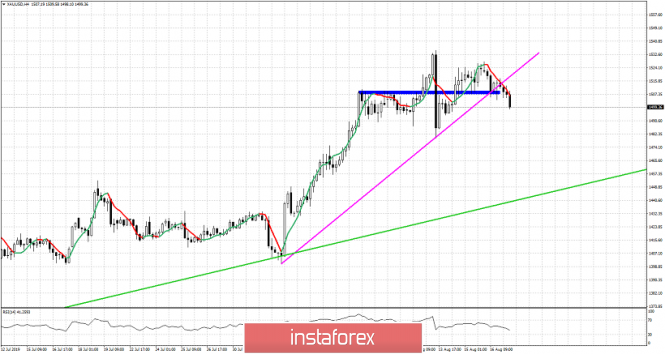
| Short-term Gold analysis for August 19th, 2019 Posted: 19 Aug 2019 02:48 AM PDT Gold price is challenging major short-term support at $1,500-$1,510. As we said in previous posts it is important for the short-term bullish trend to see bulls hold price above $1,500. We also explained the dangers and the vulnerability that was shown by the charts and we established that there were increased risks to the downside.
Green line - important medium-term support Blue rectangle - support Gold price is breaking short-term horizontal support and the upward sloping trend line support. Starting the week on a weakness is a bearish sign and if we see price break below $1,480-90 area we should expect Gold price to continue lower towards $1,450-60 area at least. Gold price showed bearish divergence signs and we are now close to to confirming a bearish reversal in short-term trend. The material has been provided by InstaForex Company - www.instaforex.com |
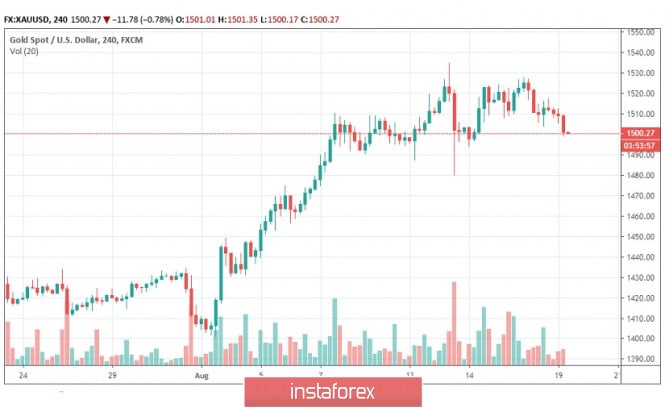
| Gold tests $1,500 support, threat of deeper correction Posted: 19 Aug 2019 02:10 AM PDT Gold was unable to make headway on Friday with support sapped by a net improvement in risk appetite and a firm dollar tone. Net losses continued on Monday with spot gold dipping to test the $1,500 per ounce support level. There is a strong likelihood that the Federal Reserve and ECB will ease monetary policy in September. The ECB is likely to announce a substantial package of interest rate cuts and government bond purchases while the Federal Reserve is likely to announce a further 0.25% rate cut. Interest rate cuts will have a mixed impact on gold as the potential beneficial impact of lower short-term yields would be offset by a decline in demand for safe haven gold amid hopes for an improvement in risk conditions. The net impact on global yield curves will deserve attention as a steeper yield curve would be an important indicator of waning fears about the global outlook and gold would be likely to lose favor with investors. If yield-curve inversion intensifies, however, there will be renewed defensive gold demand. Central bankers and policymakers will be anxious to provide reassurance and the most likely outcome is an easing of net fears, at least in the short term. As usual, President Donald Trump remains a crucial wild card. There is a significant risk that he will see the global downturn as increasing Chinese and EU vulnerability. There is also a risk that Trump will look to intensify trade wars in an attempt to force concessions. In this situation there would be a fresh surge in demand for defensive assets including gold. CFTC data recorded a small decline in non-commercial gold positions, but the total remains close to 35-month highs, maintaining the risk of sharp long liquidation if there is a net improvement in global risk appetite. Longer-term gold fundamentals remain attractive and there is still a strong case for buying on dips.
|
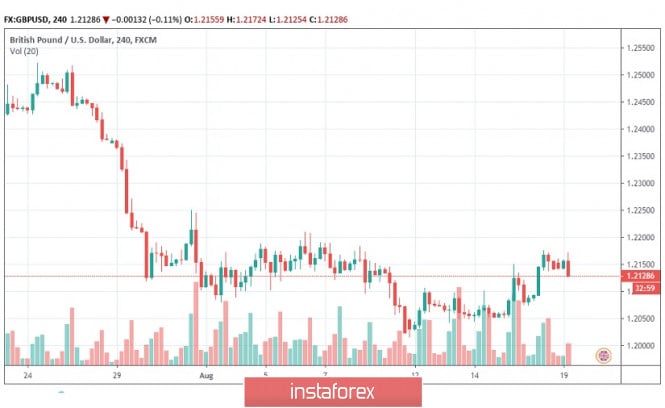
| Sterling volatility will increase, cautious base-building in evidence Posted: 19 Aug 2019 01:29 AM PDT After trading higher in early Europe on Monday, GBP/USD retreated to 1.2130 after failing to break 1.2170 while EUR/GBP strengthened to 0.9155 from 0.9120. There are no major UK data releases during the week with political developments liable to dominate as markets monitor three crucial strands. Prime Minister Johnson is scheduled to meet German Chancellor Merkel on Wednesday and French President Macron on Thursday. These meetings will be held ahead of the G7 Summit which starts on Friday in France. The tone of rhetoric in these bilateral meetings will have an important impact on the sterling sentiment with an antagonistic tone from Johnson likely to be received badly within the EU. Expectations are, however, low and conciliatory rhetoric would provide an element of support to the sterling. Within the UK, markets will focus on attempts by MPs to block the possibility of a disorderly EU exit at the end of October. After media leaks over the government's assessment of the 'no-deal' risks, markets will also try to reckon the likely impact on the UK economy of any EU departure without a deal. CFTC data recorded a small decline in short, non-commercial sterling positions, but the total remained close to 100,000 contracts and the second-highest short positon since April 2017. Immediate selling pressure has eased slightly in derivatives markets and there will be scope for significant short covering on any shift in sentiment. Liquidity levels will remain low during the next two weeks with the peak holiday season in the UK and the EU, increasing the potential for a short squeeze and maintaining the risk of choppy trading. Interestingly, the sterling outlook has improved after solid economic data releases last week. The UK currency will also gain an element of protection from expectations that the Federal Reserve and ECB will both advocate for further monetary easing in September.
|
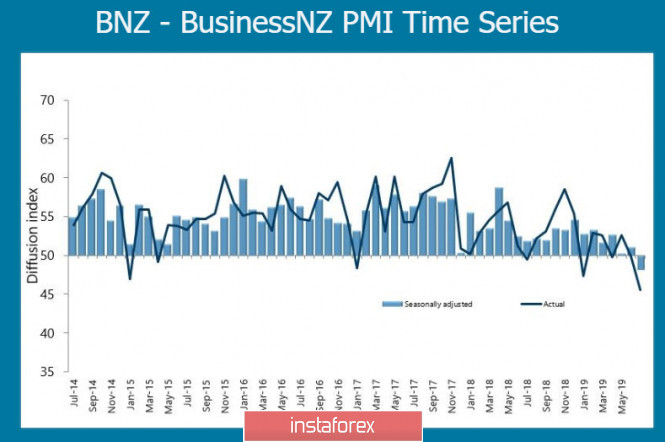
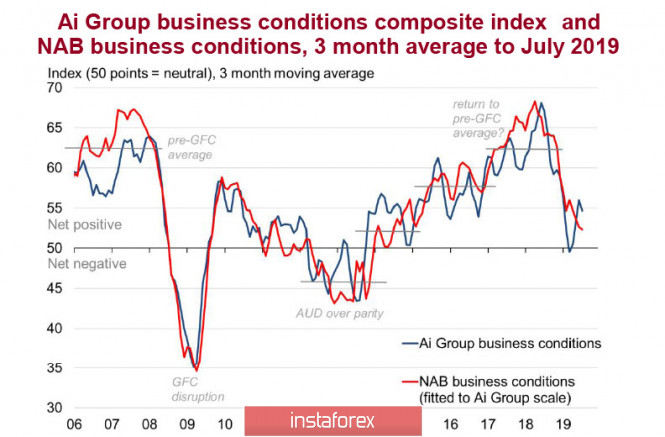
| Positive surge on Monday morning, while bypassing the NZD and AUD Posted: 19 Aug 2019 01:11 AM PDT On Monday, stock indices are growing steadily on the news from China. Last Saturday, the People's Bank of China made a crucial decision to reform the assessment of the key interest rate, which increases expectations for easing monetary policy and is expected to contribute to the increase in risk appetite. As a result, protective assets are sold, gold goes into correction after rapid growth, and rates on government bonds are growing rapidly. Although it is not yet clear how long the positive attitude will last, but in the short term, it is necessary to proceed from the fact that raw materials and risky assets will be in demand. NZDUSD The manufacturing sector of New Zealand fell for the first time since 2012.The PMI index in July amounted to 48.2 p. against 51.1 p a month earlier. On the other hand, the sub index of new orders also fell to a minimum in almost 7 years, and employment reached its lowest level since June 2009. These data could be a cause of serious concern to the RBNZ, however, there is one positive point that has so far offset the deterioration in the manufacturing sector. This factor is the increase in average wages. Despite the obvious problems with economic growth, the average hourly earnings in the sector amounted to 2 sq. 4.5%, and annual inflation rose from 2.1% to 2.2%. These figures allow us to hope that domestic demand is still at a high level, and therefore, the RBNZ will continue to hold a pause in interest rates until the end of the year. At the same time, in the long run, the trend is negative and is based on a change in the demographic composition of the population of New Zealand. According to the ANZ study, the ratio of the working population of New Zealand to the disabled will decrease by 25% in the coming years, so the RBNZ fiscal policy will be directed towards continuing mitigation, even if the economy shows signs of recovery. In the short term, New Zealand will continue to trade in the range with a gradual drift to the support level of 0.6377. Possible growth in the resistance zone 0.6433 / 50 can be used for sales, while stops are above 0.6470. AUDUSD Australian currency continues to trade in the range. Macroeconomic data, which was published last week, did not significantly affect quotes. The consumer confidence index from Westpac rose in August to + 3.6 p from -4.1 p a month earlier. This is a good sign of stable demand, respectively, increased inflation expectations. Meanwhile, monthly calculated by the University of Melbourne, increased, while unemployment remained unchanged at 5.2% in July. Ai Group's composite business conditions index and NAB's business conditions index still look very unconvincing. Thus, the downward trend continues. The conditions for continuing the mitigation policy from the RBA continues. Inflation forecast remains negative. NAB suggests that by the end of 2021, inflation will reach the bottom of the target range. GDP growth over the next two years is projected at a level slightly above 2%, which is not bad against the background of global trends. However, it is considered very little if you look at internal historical data. Analysts are most worried about the weak sustainability of households, the decline in business investment, and the decline in exports. In addition, the threat of further rate cuts remains. So far, the consensus opinion of the market is that another reduction will occur in November. The rate will be lowered to 0.75%, while other measures are not excluded. More and more opinions are increasingly being published that, in addition to the RBA policy, the government should be involved in solving the problem of economic slowdown, for which it must introduce new tax incentives in order to maintain consumer demand and investment in infrastructure, since the state of the balance sheet allows such steps to be taken without any special consequences budget. In conclusion, the Australian currency will remain in the range in the short-term in the near future, but the downward trend will increase. The nearest support at 0.6760 / 70 will not last long, the movement to 0.6734 will continue, and the breakthrough of support may strengthen the downward momentum. The material has been provided by InstaForex Company - www.instaforex.com |
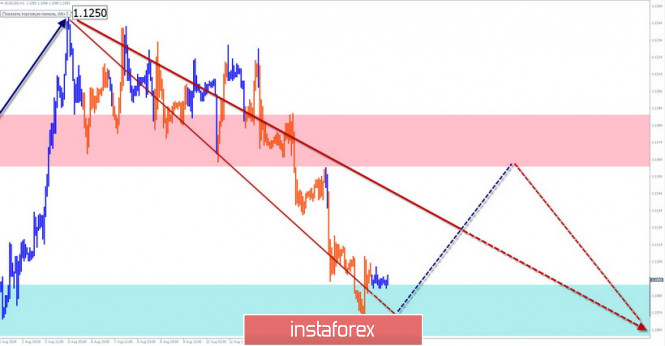
| Simplified wave analysis and forecast for EUR/USD, AUD/USD, and GBP/JPY on August 19 Posted: 19 Aug 2019 01:00 AM PDT EUR/USD On the euro chart, the main rate of movement in the last year and a half is set by a bearish wave. Since August 1, a bullish wave zigzag has been developing towards the main rate, the potential of which allows claiming the place of correction of the last section of the trend. In the last 2 weeks, the correction has been developing. There are no reversal signals on the chart. The price hit a strong support level. Forecast: Today, the most likely scenario of the movement will be the general flat mood. In the first half of the day, an upward vector of oscillations is expected. The maximum level of probable rise is limited by the resistance zone. A change of rate can be expected by the end of the day. Recommendations: Buying the euro today can be risky, therefore it is better to reduce the lot. It's safer to stay out of the market. At the end of the upcoming rollback, it is recommended to monitor the instrument's sell signals. Resistance zone: - 1.1160/1.1190 Support zone: - 1.1090/1.1060
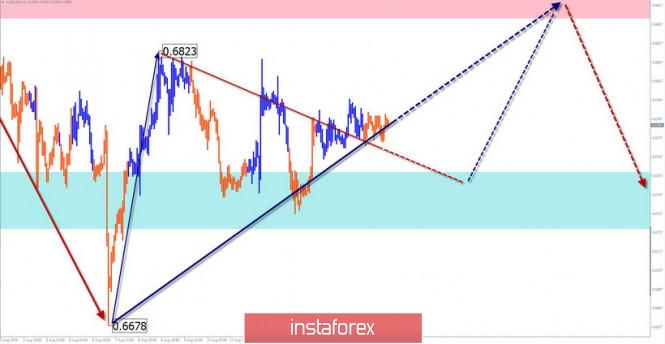
AUD/USD Since the beginning of last year, the Aussie chart has been dominated by a bearish trend. Within its last section, a bullish correction has been formed since August 7. The first 2 parts (A + B) are formed in the structure of motion. Forecast: Today, in the morning, the most likely scenario of the movement will be "sideways", with a gradual increase in the range of volatility. An attempt to put pressure on the support area can be expected before starting the ascent. Recommendations: Today, short-term purchases of the pair within the intraday will be more promising. For supporters of longer trades, it is more reasonable to refrain from trading during the current correction and try to enter into short trades at its end. Resistance zone: - 0.6840/0.6870 Support zone: - 0.6760/0.6730
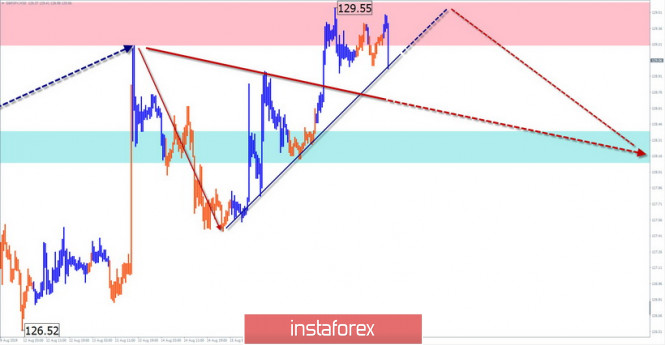
GBP/JPY After the cross bullish correction, which ended on August 13, the price began to form the beginning of a new wave in the main trend direction. The structure of the reversal model is incorrect, with an elongation of the middle part (B). Forecast: During the current day, it is expected to complete the upward phase of the price movement, the formation of a reversal and the beginning of a price decline. A puncture of the upper boundary of the resistance zones when the changing rate is not excluded. Recommendations: Purchase of the pair is risky and unpromising today. In the area of the resistance zone, it is recommended to monitor the signals of the instrument sale. Resistance zone: - 129.30/129.60 Support zone: - 128.40/128.10
Explanations to the figures: Waves in the simplified wave analysis consist of 3 parts (A-B-C). The last unfinished wave is analyzed. Zones show areas with the highest probability of reversal. The arrows indicate the wave marking according to the method used by the author, the solid background is the formed structure, the dotted ones are the expected movements. Attention: The wave algorithm does not take into account the length of time the instrument moves. The material has been provided by InstaForex Company - www.instaforex.com |
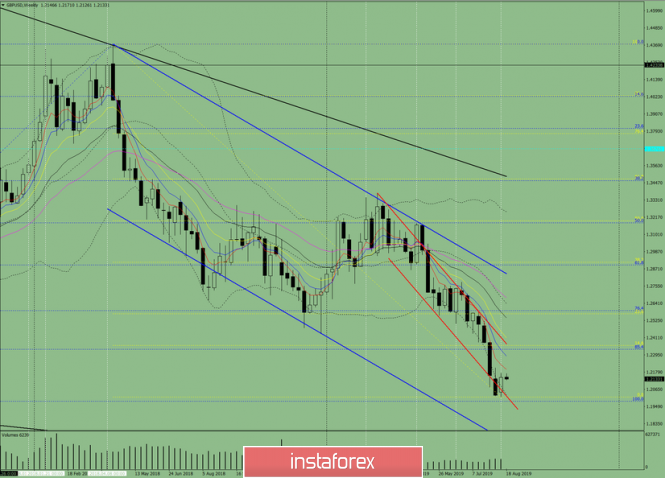
| Technical analysis for the GBP/USD currency pair for the week from August 19 to 24, 2019 Posted: 19 Aug 2019 12:57 AM PDT Trend analysis. This week, the price will move down with the first target of 1.1983 – the lower fractal (blue dotted line) and the final target of 1.1735 – the support line (blue bold line).
Fig. 1 (weekly chart). Complex analysis: - Indicator analysis – down; - Fibonacci levels – down; - Volumes – down; -Candle analysis – up; - Trend analysis – down; - Bollinger bands – down; - Monthly schedule – down. The conclusion from the complex analysis is the downward movement. The overall result of the calculation of the GBP/ USD candle on the weekly chart: the price in the week is likely to have a downward trend with the presence of the first upper shadow of the weekly black candle (Monday – up) and the absence of the second lower shadow (Friday – down). This week, the price will move down from the first target of 1.1983 – the lower fractal (blue dotted line). The material has been provided by InstaForex Company - www.instaforex.com |
| You are subscribed to email updates from Forex analysis review. To stop receiving these emails, you may unsubscribe now. | Email delivery powered by Google |
| Google, 1600 Amphitheatre Parkway, Mountain View, CA 94043, United States | |





No comments:
Post a Comment