
Forex analysis review |
- August 30, 2019 : EUR/USD Intraday technical analysis and trade recommendations.
- August 30, 2019 : GBP/USD demonstrating contradictory signals. However, positivity has a higher probability.
- BTC 08.30.2019 - Sell zone for Bitcoin
- Trading idea on the S&P 500
- Wave analysis of EUR/USD and GBP/USD. Monthly review
- EURUSD: Data on a sharp drop in retail sales in Germany and inflation in the eurozone finished off the euro, but no one canceled
- Finding the bottom: Argentine peso is losing ground
- Gold 08.30.2019 - Gold in the buy zone
- EUR/USD for August 30,2019 - Weekly downside in play
- GBP/USD. The first attempt by opposition deputies failed
- GBP/USD: plan for the American session on August 30th. The pound has stabilized in the side channel amid a pause in the political
- EUR/USD: plan for the American session on August 30th. Weak inflation in the eurozone helps the bears to continue to push
- EUR/USD: the dollar comes with trump cards, but the euro is not so simple
- The euro revealed a secret of the Bundesbank
- EUR/USD. Inflation in the European Union brings the ECB closer to easing monetary policy
- Australian dollar falls into despondency
- USDJPY – 70p left before the profit
- Trading plan for EURUSD on 08/30/2019
- Bullish rally to kick off soon in EUR/USD
- New high coming soon in USD/CAD
- Technical analysis of AUD/CAD for August 30, 2019
- Daily analysis of EUR/NZD for 30.08.2019
- Daily analysis of EUR/AUD for 30.08.2019
- Precious metals at risk of near-term top
- Sterling downside limited, fade EUR/GBP gains
| August 30, 2019 : EUR/USD Intraday technical analysis and trade recommendations. Posted: 30 Aug 2019 08:05 AM PDT
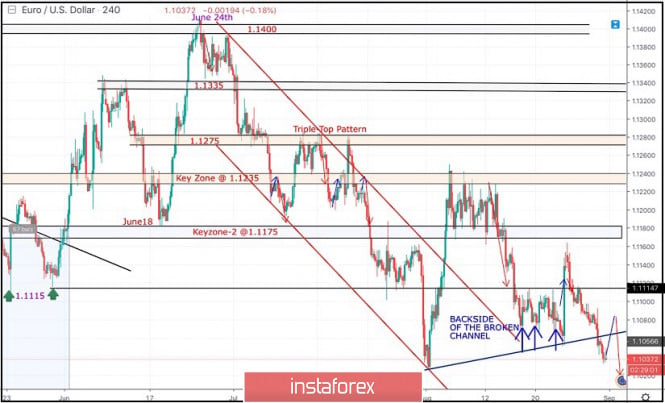
Back in June 24, the EURUSD looked overbought around 1.1400 facing a confluence of supply levels which generated significant bearish pressure over the pair. Shortly after, In the period between 8 - 22 July, a sideway consolidation-range was established between 1.1200 - 1.1275 until a triple-top reversal pattern was demonstrated around the upper limit. Then, Evident bearish momentum (bearish engulfing H4 candlestick) could bring the EURUSD below 1.1175. This facilitated further bearish decline towards 1.1115 (Previous Weekly Low) then 1.1025 (the lower limit of the depicted recent bearish channel) where significant signs of bullish recovery were demonstrated. Risky traders were advised to look for bullish breakout above 1.1050 as a bullish signal for an Intraday BUY entry with bullish targets around (1.1115, 1.1175 and 1.1235). All of which were successfully reached. Shortly-After in Mid-August, the EUR/USD has been trapped between 1.1235-1.1175 for a few trading sessions until bearish breakout below 1.1175 occurred on August 14. Bearish breakout below 1.1175 promoted further bearish decline towards 1.1075 where the backside of the broken bearish channel has provided temporary bullish demand for sometime. The Bullish Triple-Bottom pattern was invalidated especially after the EURUSD pair bulls have failed to establish Bullish persistence above 1.1115. Moreover, the recently established short-term uptrend line has been invalidated as well. This turns the short-term outlook as bearish. Intraday traders can wait for a quick bullish pullback towards 1.1070 for having a valid SELL entry. On the other hand, any bullish breakout above 1.1115 renders the current situation as a bearish trap bringing back positivity into the market at least towards 1.1175. The material has been provided by InstaForex Company - www.instaforex.com |
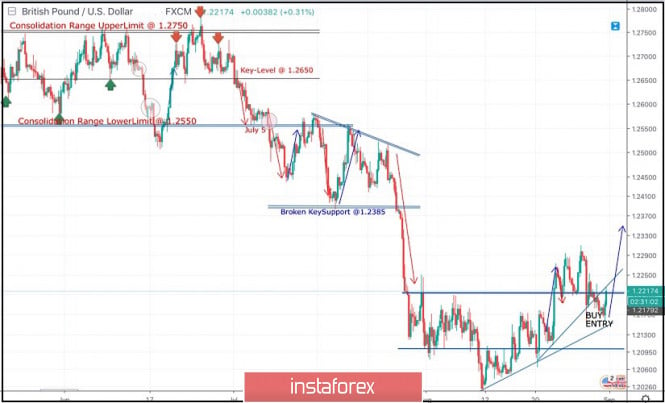
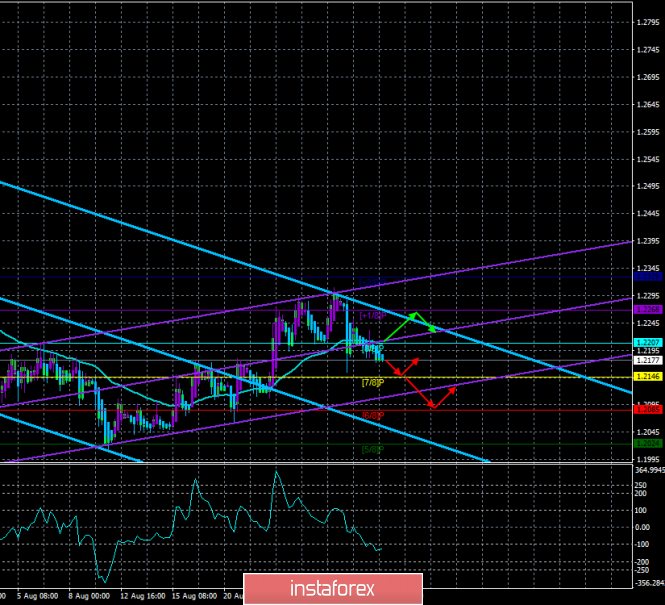
| Posted: 30 Aug 2019 07:41 AM PDT That's On July 5, a consolidation range bearish breakout was demonstrated below 1.2550 corresponding to the lower limit of the depicted consolidation range. Moreover, Bearish breakdown below 1.2385 (Prominent Bottom) facilitated further bearish decline towards 1.2320, 1.2210 and 1.2100 which corresponded to significant key-levels on the Weekly chart. The previously-mentioned price levels were risky for having new SELL entries. That's why, Long-term SELLERS were advised to have their profits gathered few weeks ago. In Early August, a temporary consolidation-range was established above 1.2100 before August 9 when temporary bearish movement was executed towards 1.2025. Recent bullish recovery was demonstrated off the recent bottom (1.2025). This brought the GBP/USD pair back above 1.2100 (Lower limit of the recently established consolidation-zone). As expected, further bullish advancement was demonstrated towards 1.2230 then 1.2280 where recent bearish rejection was manifested towards 1.2215-1.2200. For the intermediate-term, Further bullish advancement is expected to pursue towards 1.2320 then 1.2380 as long as the current bullish momentum above 1.2215 and 1.2160 (the recent consolidation range pivot-point) is maintained on a daily basis. Otherwise, If bearish rejection is demonstrated around 1.2215 (backside of the depicted broken uptrend line), another quick bearish decline would be anticipated towards 1.2100. On the other hand, If the current bullish movement pursued further bullish momentum, price action should be watched cautiously around 1.2380 (being a correspondent to a broken Key-Support dating back to July 17) where bearish rejection may originate Trade Recommendations: Intraday traders were advised to look for a valid BULLISH entry anywhere around 1.2200-1.2170. Next T/P level to be placed around 1.2280, 1.2340 and 1.2385 while S/L should be placed below 1.2100. The material has been provided by InstaForex Company - www.instaforex.com |
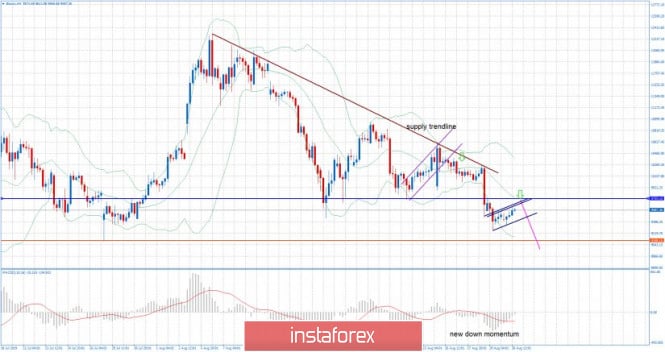
| BTC 08.30.2019 - Sell zone for Bitcoin Posted: 30 Aug 2019 07:24 AM PDT Bitcoin 4H time-frame:
Bitcoin is correcting upward in past few hours but there is good resistance around $9,760, which may be the good level to re-sell BTC. The 4-hour chart completed bear flag in the background and the BTC price is very close to Bollinger middle line, which is another good entry sell zone. I still think that demand for BTC is very low and that most investors are focusing on the metal market. Forecast and recommendations for traders: MACD oscillator is showed us the new momentum down on the most recent down swing, which is good confirmation for our short bias .I recommend selling cryptocurrency with a target of $9,108 with a Stop Loss level of $10,300The material has been provided by InstaForex Company - www.instaforex.com |
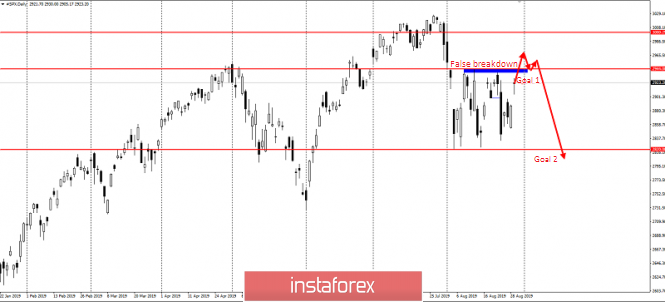
| Trading idea on the S&P 500 Posted: 30 Aug 2019 07:13 AM PDT Good evening, dear traders! I present to your attention a technical trading idea on the S&P 500 index. All summer, I recommended that my clients shorten this index at the level of 3000, and this brought excellent profit. To date, a formation is being formed that is regularly repeated in currencies and gold. This is a fairly clear horizontal channel, limited by quotes of 2820 and 2944. The range, of course, is huge, but the main thing is that its walls are not yet pierced by false breakdowns either from above or from below. This means that we can count on the very good potential in short positions. Yesterday, the index came close to the upper limit of the trading – the level of 2944. I suggest that in the event of a false breakdown at the opening, play in the fall with two goals. Goal 1 – for scalpers – work out a return to the broken resistance level of 2944 and take profit. Goal 2 – for medium-term ones – in the case of a false breakdown, hold short positions to the lower limit of the trading to break the quotation of 2820. All levels and both ideas are marked on the chart above. Congratulations to everyone at the end of the trading week. In my opinion, it was quite successful if you followed my trading recommendations. Good luck with trading and have a good weekend! The material has been provided by InstaForex Company - www.instaforex.com |
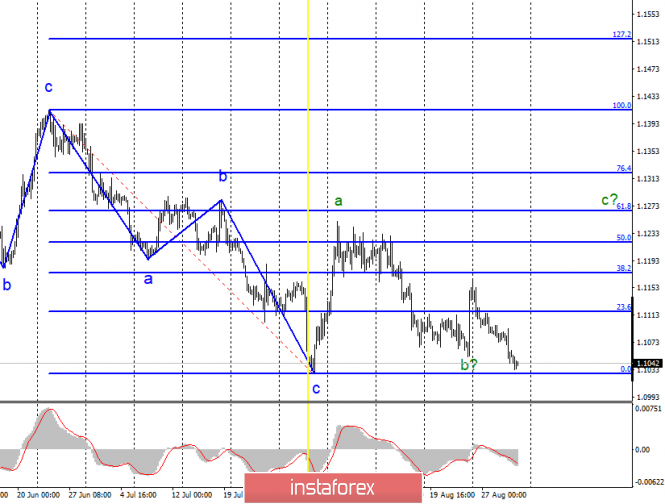
| Wave analysis of EUR/USD and GBP/USD. Monthly review Posted: 30 Aug 2019 07:13 AM PDT EUR/USD
August started just fine for EUR/USD pair. For the first 5 trading days, the euro added about 200 base points, and that's when there were serious expectations for the construction of an upward trend segment, so strong and sharp was the growth of the instrument. However, after August 5, the euro wasn't something that could not grow, the flat started first, then a slow descent, after which it collapsed to the lows of the month, year and two-year period. Now, on August 30, the pair is near the lows of the expected wave C and threatens to disrupt the current wave layout, which still involves the construction of an upward wave that will be the final one in the three-wave correction structure. However, the news background harms the euro, which does not allow this currency to build an upward wave. If the ECB lowers the rate in September and announces a restart of the stimulus program, it could further hit the positions of the euro. The current wave marking is more suited to the new Fed rate cut. In conclusion, I recommend that you still count on building a wave from as long as the instrument is not out of the minimum of August 1. Purchase targets: 1.1264 – 61.8% according to Fibonacci 1.1322 – 76.4% according to Fibonacci Sale targets: 1.1027 – 0.0% according to Fibonacci General conclusions and recommendations: The euro/dollar pair continues to be in the framework of building a downward wave, presumably b. I recommend buying a pair with targets located above the mark of 1.1250 with a stop-loss order under the low of August 1 on the MACD signal "up". I recommend selling the instrument not earlier than a successful attempt to break the minimum of wave C, but even in this case, I recommend to act very carefully. GBP/USD
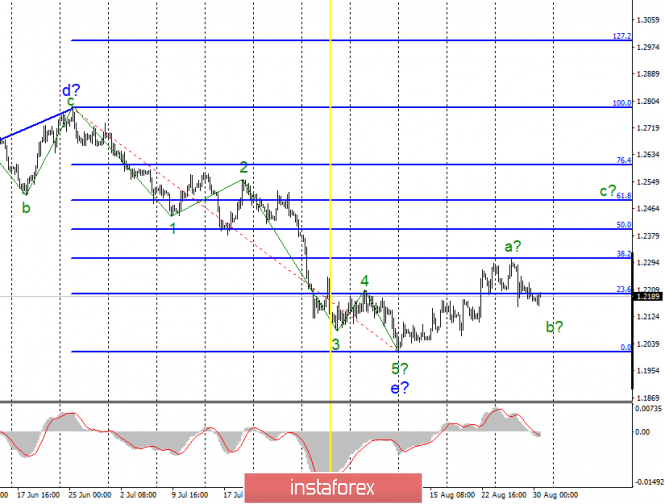
The GBP/USD pair for August even managed to add a few dozen points, despite the negative news background. The news background, which is unfavorable for the pound, remains, but the current wave marking suggests the construction of an upward trend section, therefore there are serious contradictions between the news and the waves. Until September 3, trading in the pair will be paused, as markets will look forward to concrete action from the parliament, which will have to decide in one week how to block the decision of Boris Johnson to suspend parliament for 5 weeks. Until this issue is resolved, the probability of a hard Brexit remains very high, and this could play a cruel trick on the pound in the form of a fall to the 20th figure and below, despite the current wave marking. At a later period, there is no sense to predict anything now, because everything will be decided, most likely, between September 3 and 9. On September 9, the Parliament will leave by the decision of the Prime Minister for compulsory leave for another 5 weeks. Sale targets: 1.2016 – 0.0% according to Fibonacci Purchase targets: 1.2306 – 38.2% according to Fibonacci 1.2401 – 50.0% according to Fibonacci General conclusions and recommendations: The downward section of the trend is previously considered completed. Thus, the anticipated creation of the upward correctional channel with the first order placed near the settlement marks of 1.2306 and 1.2401, which corresponds to 38.2% and 50.0% of Fibonacci. You can buy the pound in the current conditions, but I do not recommend doing it in large volumes, firstly, and secondly, it should be done after the completion of the current corrective wave down, on the MACD signal "up". In the period between September 3 and 9, traders need special care and caution. The material has been provided by InstaForex Company - www.instaforex.com |
| Posted: 30 Aug 2019 07:13 AM PDT The euro continues to experience problems with growth against the dollar, and inflation data, which many expected this morning, did not come as a surprise. The scenario with profit-taking on short positions in risky assets will still be played at the end of the month at the North American session. The data on the sharp drop in retail sales in Germany is unlikely to please economists and traders, which once again confirms the need for intervention by the European Central Bank. The preliminary consumer price index (CPI) in France in August this year was slightly better than economists' forecasts and grew by 0.5% compared to July and 1.1% year-on-year. Analysts had expected growth of only 0.4%. The harmonized consumer price index in France in August grew by only 1.2% compared with August 2018, after rising by 1.3% in July. Inflation data in Italy also pleased the traders. The report indicated that consumer prices rose in August by 0.5% after zero in July. Compared to August 2018, growth also amounted to 0.5%. Economists had expected less active growth of 0.2% and 0.2%, respectively. The European Central Bank pays special attention to inflation, as it makes decisions on monetary policy based on it. Thus, the report of the statistics agency indicated that the preliminary consumer price index (CPI) of the eurozone in August rose by only 1.0%, which fully coincided with the forecasts of economists. Growth was also just 1.0% in July, well below the ECB's target of 2.0%. This is further evidence that the European regulator can easily return to the stimulus program of the economy, which will not lead to a sharp inflationary jump. As for the base index, which does not take into account volatile categories, the eurozone consumer price inflation in August rose by 0.9% compared to August 2018. Unemployment data in the eurozone were ignored by traders, as they did not lead to serious changes in the market. The unemployment rate coincided with economists' forecasts and remains unchanged at 7.5% in July, as in June. As noted above, the fall in German retail sales in July was more significant than expected, which was another negative signal for the economy. According to the Federal Bureau of Statistics, retail sales in Germany in July fell by 2.2% compared to the previous month, while economists had predicted a decline in sales by 1.0%. Compared to the same period of the previous year, retail sales increased by 4.4%. The fall in retail sales and problems in foreign trade due to the decline in exports is direct evidence that Germany is unlikely to avoid a technical recession in the 3rd quarter of this year. Let me remind you that according to the latest report, GDP in the 2nd quarter of this year decreased by 0.1% compared to the previous quarter. As for the technical picture of the EURUSD pair, the pressure on the euro will gradually slow down by the end of the week, and traders will hurry to fix profits. The maximum that sellers of risky assets can expect today is a support update of 1.1020, which may occur after the release of a weak report on the eurozone consumer price index. If buyers can regain the level of 1.1060, which was missed yesterday, a larger growth of the trading instrument in the area of 1.1090 is not excluded. The material has been provided by InstaForex Company - www.instaforex.com |
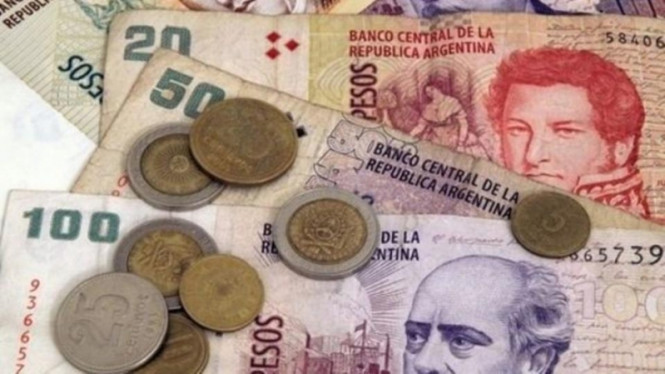
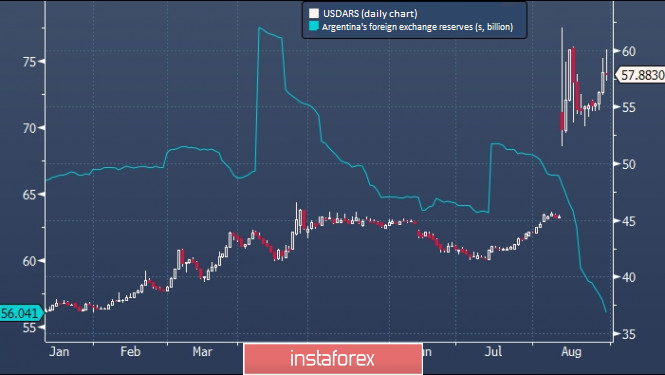
| Finding the bottom: Argentine peso is losing ground Posted: 30 Aug 2019 07:13 AM PDT This week ends for the Argentine currency with a grand collapse. Experts call the peso, which lost 4.7%, the leader in the scale of the fall against the US currency. Currently, the USD/ARS pair is above 57 pesos per 1 US dollar. Several analysts believe that the rise of the peso above 60 is inevitable. Experts believe that the current equilibrium of the Argentine peso is a consequence of the intervention of the Central Bank of the country in the situation on the foreign exchange market. Recall, on Tuesday, August 27, the regulator sold $302 million to support the national currency, and on Wednesday, the scale of intervention reached $367 million. According to experts, such cash injections can provoke a large-scale depletion of Argentina's foreign exchange reserves, which in August decreased by more than $10 billion. The current situation is alarming market participants. Analysts had hoped that further restructuring would correct the situation, but the plan failed to materialize. Many experts believe that these measures are not enough. They admit that with the growth of the crisis, the situation in the country can get out of control. In this case, the Argentine economy faces shocks comparable to the events of 2001. Recall, 18 years ago, the citizens of Argentina began to withdraw money from bank deposits and the government "froze" deposits. This led to large-scale protests that claimed the lives of 24 people and then to the resignation of the country's president and minister of economy. In December 2001, the new president, Rodriguez Saa, came to power. He declared a default on the obligations of $132 billion. However, the next head of state did not last long: on the eve of the new year, 2002, namely December 31, 2001, he left his post. |
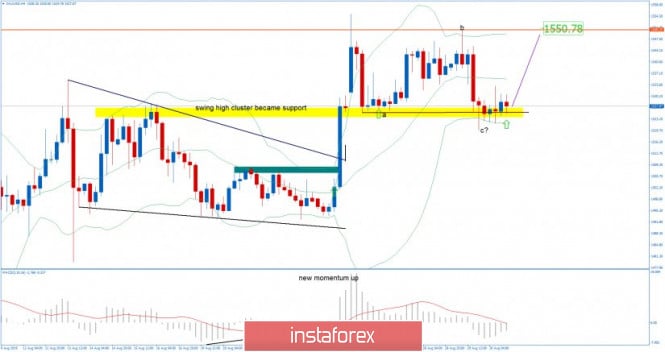
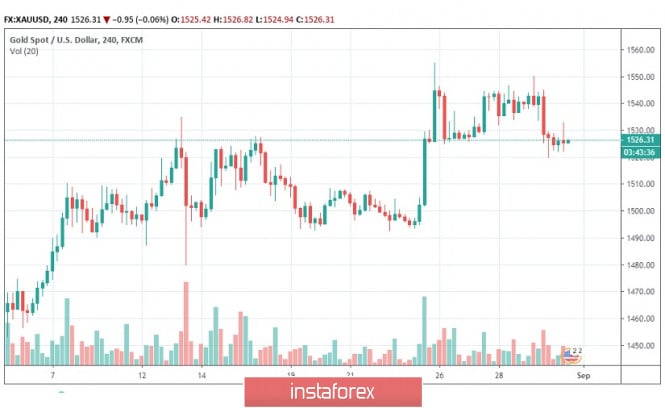
| Gold 08.30.2019 - Gold in the buy zone Posted: 30 Aug 2019 06:45 AM PDT Gold price is still holding well support at the price of $1,525, which is good sign for further upside. I still expect more upside and at least another upward swing.
Red horizontal line – Important resistance and upward objective Yellow rectangle - major support area Purple rising line – Expected path MACD oscillator is showing decreasing on the last downward swing and there is chance for potential recovery on the Gold. Key support is at $1,525 and resistance at $1,554. Bears need to be very cautious as there is a major support on the test and potential end of the downward correction ABC. As long as the Gold is holding above $1,525 there is a chance for potential test of $1,554. Additionally, I found test of the lower Bollinger band (support). Don't forget that Gold is in short-midterm upward trend and that any selling maybe shaken out.The material has been provided by InstaForex Company - www.instaforex.com |
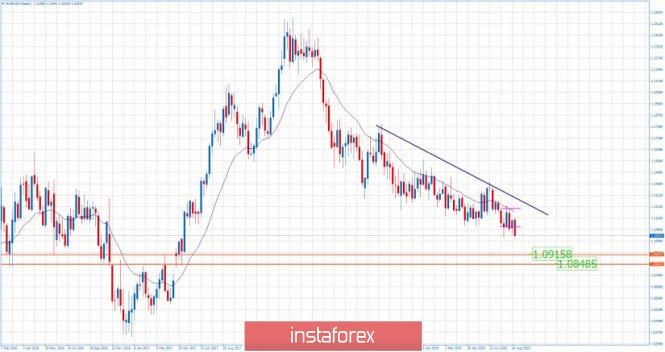
| EUR/USD for August 30,2019 - Weekly downside in play Posted: 30 Aug 2019 06:28 AM PDT EUR/USD is in short-term downtrend and most recently I found the breakout of the 4-week trading range. Further downside is in play...
Red horizontal line – Important resistance and upward objective Black down slopping line – Resistance line Purple horizontal lines – Trading range boundaries Red horizontal lines – Weekly support levels Strong downward trend is present and I would watch for selling opportunities. The weekly support levels at 1.0915 and 1.0850 are in play. There is nothing bullish on the market and no signs of any reversal, which is indication of the weakness. Watch for selling opportunities on the rallies with the targets at 1.0915-1.0850. Important resistance is set at 1.1160. The material has been provided by InstaForex Company - www.instaforex.com |
| GBP/USD. The first attempt by opposition deputies failed Posted: 30 Aug 2019 05:57 AM PDT
The British pound continues to decline against the US currency, but in general, traders are in standby mode. Waiting for the resumption of the UK Parliament, as everyone is interested in what steps the opposition will take to Boris Johnson. By and large, it's the opposition's move now, and Johnson is just waiting on September 9th when Parliament leaves for a second vacation. The first attempt by opposition deputies failed. A group of 75 deputies appealed to the Scottish court to overturn Johnson's decision to temporarily halt the work of Parliament. However, the Court rejected even a request for a temporary suspension of Johnson's decision, until the case was fully considered in Court. However, there is still hope, as a full hearing will be held on Tuesday. Then the judge will be familiar with all aspects of the case and can make another decision, although of course there is little hope for this. A group of politicians from different parties insists that the Prime Minister's decision was "unconstitutional" and "illegal," not to mention "undemocratic." Well, the fate of the pound will now depend not on Brexit and its date, but on whether the part of the deputies who rebelled against Johnson can prevent him from stopping the work of Parliament or not. If so, there will be real opportunities to block the country's disordered exit from the EU on October 31. If Johnson's decision (approved by the Queen of Great Britain) cannot be reversed, the probability of cancellation or postponement of Brexit on October 31 is reduced to almost zero. And with it the hopes of traders to strengthen the British currency. By the way, consumer confidence in the UK, published last night, fell from a negative value of -11 to -14 in August, which perfectly reflects the mood of consumers regarding the current economic situation in the country. The material has been provided by InstaForex Company - www.instaforex.com |
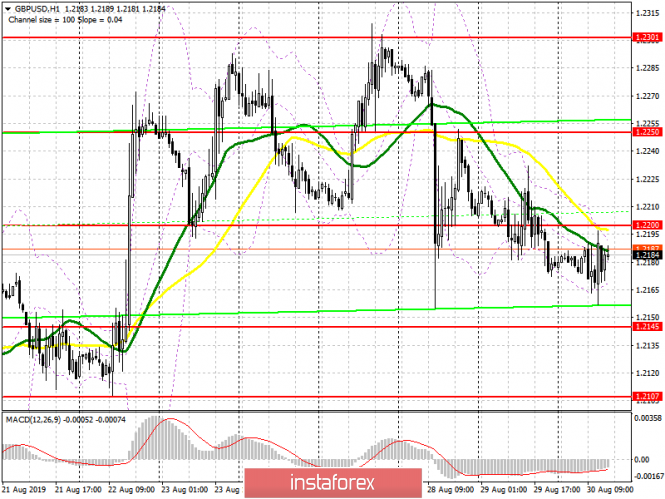
| Posted: 30 Aug 2019 05:57 AM PDT To open long positions on GBP/USD, you need: The tense situation around Brexit and the opposition's attempt to pass through parliament a law that does not allow the UK to leave the EU without an agreement paused major actions by major players who prefer to wait for the results of the confrontation between Boris Johnson and his opponents. From a technical point of view, nothing has changed compared to the morning forecast. To return to the market, buyers need a breakthrough of the level of 1.2200, which will lead to a larger upward correction to the important resistance area of 1.2250, where I recommend taking the profits. If the bears continue to push the pound down, I recommend opening long positions immediately after the formation of a false breakdown in the support area of 1.2145 or a rebound from the low of 1.2107. However, the update of 1.2107 will indicate a complete reversal of the upward trend, so strong growth from this range can hardly be expected. To open short positions on GBP/USD, you need: The main task of the pound sellers is to maintain the level of 1.2200, and the formation of a false breakdown on it in the afternoon will be a direct signal to open short positions in the hope of updating weekly lows in the areas of 1.2145 and 1.2107, where I recommend taking the profits. In the scenario of a return and consolidation above the resistance of 1.200, it is best to consider new short positions on the rebound from the larger high of 1.2250, which is a serious problem for buyers of the pound. Signals of indicators: Moving Averages Trading is below 30 and 50 moving averages, indicating a return to the seller's market. Bollinger Bands Volatility is reduced, which does not give signals to enter the market.
Description of indicators
|
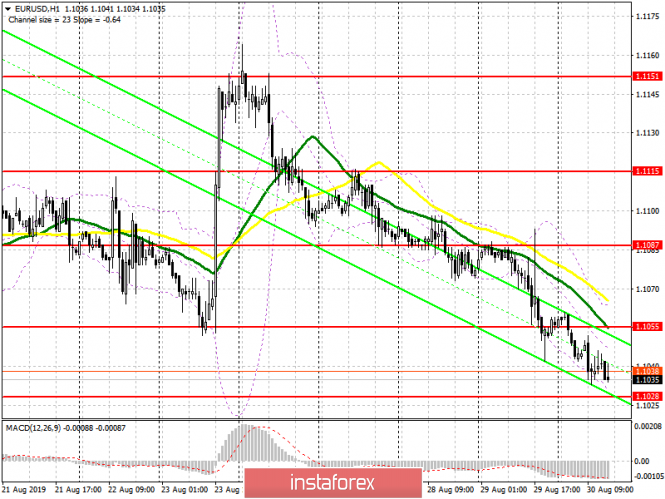
| Posted: 30 Aug 2019 05:57 AM PDT To open long positions on EURUSD, you need: Inflation data in the eurozone coincided with economists' forecasts, which led to the continuation of the downward trend in EUR/USD. As in the morning, buyers have a few tasks that they have to deal with by the end of the week. If the pressure on the euro continues, it is best to return to long positions on a false breakdown from the large support level of 1.1028, which I spoke about in the morning. However, the more important task of buyers will be to return and consolidate above the resistance of 1.1055, which will lead to a major upward correction near the maximum of 1.1087, where I recommend fixing the profit. To open short positions on EURUSD, you need: The data on the US economy can help the bears, whose key task at the end of the week remains to update the low of 1.1028, where, most likely, there will be profit taking on short positions and a small rebound of the euro up. However, in the second half of the day, it is best to open new short positions after an upward correction from the level of 1.1055, on a false breakdown, or a rebound from the larger resistance of 1.1987. Signals of indicators: Moving Averages Trading is below 30 and 50 moving averages, indicating a bearish market. Bollinger Bands In the case of euro growth, the upper limit of the indicator in the area of 1.1065 will limit the upward potential.
Description of indicators
|
| EUR/USD: the dollar comes with trump cards, but the euro is not so simple Posted: 30 Aug 2019 05:57 AM PDT The USD index continues to move confidently to the north. The US dollar strengthened against all major currencies, except for the Canadian dollar. This dynamic was driven by conciliatory rhetoric from Washington and Beijing, positive statistics from the United States, and rising US stock indexes. The revised US GDP data for the second quarter seemed to disappoint the dollar "bulls", as the figure was below the initial estimate (+2% vs. +2.1), but spending on personal consumption rose at the highest rate since the fourth quarter of 2014 – 4.7% against the expected 4.3%. Apparently, in April-June, American households were not afraid of the trade war. It allows to speak about the strength of the economy, and the divergence in the economic growth of the United States and the rest of the world, as you know, acts as a loyal assistant to the greenback. The slowdown in German inflation and the statement of the future President of the ECB Christine Lagarde that the regulator has at its disposal the tools that can save the eurozone from a recession, allowed the "bears" of the euro to go on the attack and sent EUR/USD to four-week lows. Investors have been selling the euro throughout the week, and now the EUR/USD pair is on the threshold of testing the mark of 1.10. The trade war unleashed by the White House has already hit the main competitors of the United States, while America itself is only beginning to sense their consequences. Therefore, the pacifying statements of Washington and Beijing about their readiness to resume negotiations are positively perceived both by the S&P 500 index and the greenback. At the same time, the trade conflict between the US and China is tearing the eurozone apart. According to the latest data, business confidence in the region has declined, inflation in the region has slowed, and the economy is losing jobs for the fourth month in a row. The most affected countries are those in Europe where exports account for a high share of GDP. In this regard, France looks much better than Italy, Germany and the currency bloc as a whole. This fact may contribute to an increase in the number of "hawks" in the ECB Governing Council, as well as implement the next program of quantitative easing for the regulator a much more difficult task than financial markets believe. Even despite the high chances of a technical recession in Germany, the head of the Bundesbank Jens Weidmann opposes the expansion of monetary stimulus. Bank of the Netherlands President Claes Knot, in turn, believes that the eurozone economy is not so weak to resume buying bonds. If France takes the same position, then ECB Chairman Mario Draghi will not be easy to promote the idea of additional large-scale stimulus in September, which may disappoint the "bears" on EUR/USD. The first month of autumn is a seasonally strong month for the euro. In 1975-2018, it went up against the US dollar in 27 cases out of 44. Wake-up calls for the greenback may sound at the very beginning of September when the American labor market report for August is released. Weak data could lead the Fed to believe that the economy is indeed slowing, with the result that the regulator will lower interest rates in September and will signal a further easing of monetary policy. Washington's currency intervention to weaken the dollar can also come true. Also, if the September negotiations between the United States and China on a trade deal fail, this will lead to a decrease in US stock indices, which will lead to the greenback. However, this will all be later, but for now, the EUR/USD "bears" revel in fame, preparing to rewrite the August lows and move quotes to 1.089. The material has been provided by InstaForex Company - www.instaforex.com |
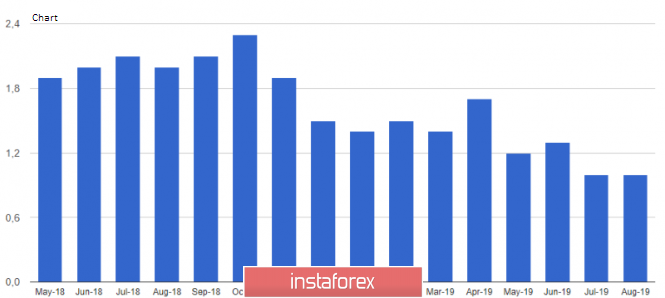
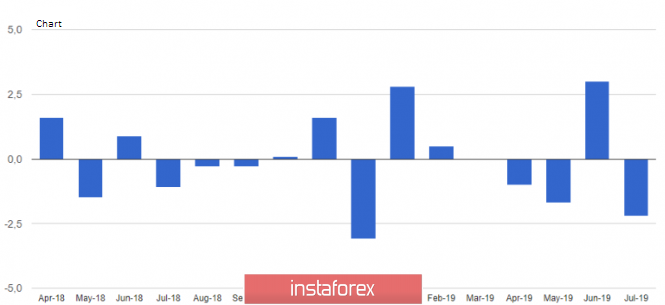
| The euro revealed a secret of the Bundesbank Posted: 30 Aug 2019 05:29 AM PDT The single European currency says goodbye to the summer in a depressed mood. In the last week of August, it lost about 1% of its value against the US dollar and closed all five out of five trading days in the red zone. Donald Trump managed to stop the fall of US stock indices with words about the resumption of trade negotiations with Beijing, although after an exchange of blows in the form of higher import duties, the situation looked hopeless. The dollar grew not only because of the S&P 500 but also because of the weakness of the main competitors. The second estimate of Germany's GDP for April-June confirmed the presence of a 0.1% reduction in the indicator, the German business climate from the IFO continues to deteriorate, and inflation has slowed to its lowest level in the last 6 years. Yesterday's locomotive of the eurozone economy becomes its main brake, however, this does not force the Germans to flee to the "dovish" camp from the "hawkish" of the Governing Council. Germany and the Netherlands are the main opponents of the resumption of the quantitative easing program, which could play into the hands of the "bulls" on EUR/USD after the September 12 meeting. However, their opponents have time to develop attacks. The situation when the chances of the American recession are growing by leaps and bounds and the dollar is strengthening is extremely rare in the market. Something similar took place in 1990-1991 and 2007-2009, after which the USD index went down sharply. However, in the early 2000s, under similar conditions, on the contrary, it strengthened. The dynamics of the dollar and the probability of a recession in the US economy
The reasons should be sought in the weakness of the main competitors of the US currency, while the fact that the Fed continues to follow the White House's lead restrains the offensive fervor of the "bears" on EUR/USD. According to the former President of the Federal Reserve of New York William Dudley, it indulges the aggressive policy of protectionism of Donald Trump, and in order not to harm the US economy, she should prevent him from becoming the owner of the White House for a second term by raising the rate on federal funds. The opinion of the former FOMC official, very similar to the truth, was quickly hushed up, saying that the Federal Reserve was not politic. However, the situation is unlikely to change in the near future: criticism of the US President will keep the central bank under pressure and contribute to rumors of a weakening of monetary policy. If we add to them the growing risks of currency interventions to weaken the US dollar, the potential for a decline in EUR/USD begins to look limited. The reluctance of the Bundesbank to face the truth about the technical recession of Germany in the face suggests that the regulator knows something that everyone else does not know. It is possible that the German economy has already hit bottom, and its subsequent improvement will contribute to the recovery of the euro. Moreover, September is a good month for the single European currency: as a result, it strengthened against the US dollar in 27 cases out of 44. Technically, the targets of 161.8% and 200% for the parent and child patterns AB=CD suggest a convergence zone from which the EUR/USD pair may well turn around. We are talking about the area of 1.089-1.093. The material has been provided by InstaForex Company - www.instaforex.com |
| EUR/USD. Inflation in the European Union brings the ECB closer to easing monetary policy Posted: 30 Aug 2019 05:09 AM PDT
The fall of the European currency continues. The preliminary value of EU inflation for August has already been published today. It turned out that the basic consumer price index remained unchanged - +0.9% y/y, although traders expected to see +1.0%, and the main inflation was 1.0% y/y, as predicted by expert agencies. We expected to see a slowdown in core inflation, as inflation in Germany declined significantly compared to the previous period. This did not happen, but we would like to note that the value for August is not final. And even if the final value is 1.0% y/y, it is still an extremely low figure. The ECB, led by Mario Draghi, will not be able not to react to this. The whole situation with rates and monetary policy of the European Central Bank resembles a snow globe that is rolling down the mountain. It is already rolling and will slide to the very bottom – at this point, the ECB will lower the key rate and turn on the printing press to buy various bonds from the market and begin to pump cash into the EU economy. The only question is how fast the snowball will reach the bottom. If quickly, then there will not be any obstacles (inflation in August unexpectedly accelerated, Donald Trump won't suddenly declare that he loves the EU and not going to start a trade war, and GDP will jump up), then in September we are waiting for monetary policy easing and, as a consequence, the new fall of the euro. If the obstacles arise in the form of encouraging macroeconomic statistics, it is possible that the ECB will reduce the rate in October, but given the speed that the snowball has already gained, it is unlikely that the regulator will postpone the decision to ease monetary policy to a later date. Moreover, on October 31, Mario Draghi will resign and is unlikely to want to leave behind the sad state of the EU economy. He is unlikely to want Christine Lagarde to remember him with "kindly quiet word." We don't even mention, in terms of the prospects for the European currency, the Fed and its course to reduce the key rate, provoked by Donald Trump and his trade wars, which precisely force the Fed to go on easing monetary policy. This is because a possible systematic further reduction of the Fed key rate does not have any effect on the euro/dollar pair. The US dollar has risen and continues to rise despite the fact that one easing of monetary policy has already taken place. Before updating the 2-year low, 10 points remain. The material has been provided by InstaForex Company - www.instaforex.com |
| Australian dollar falls into despondency Posted: 30 Aug 2019 05:09 AM PDT
The currency of the green continent is not going through the best of times, and this situation will worsen. They predict a further decline in the " Aussie." The downward trend of the AUD/USD pair is fixed over the past few days. The Australian currency is showing a negative trend. It is currently trading in the range of $0.6721 to $0.6724. The experts believe that the reasons for the fall of the "Australian" are global trends such as a slowdown in the global economy and a slowdown in economic growth, as well as a global strengthening of the American currency. According to analysts, the general strengthening of the US dollar significantly affects the AUD/USD currency pair. As a result, the Australian currency begins to become cheaper. The global strengthening of the US currency stopped the formation of a strong pair of AUD/USD. At the same time, interest spreads in the US have changed dramatically in favor of the "Australian", but the pair continues to form new lows. They predict a further fall in AUD/USD. Experts do not rule out that the pair can demonstrate the sixth week of decline in a row. The material has been provided by InstaForex Company - www.instaforex.com |
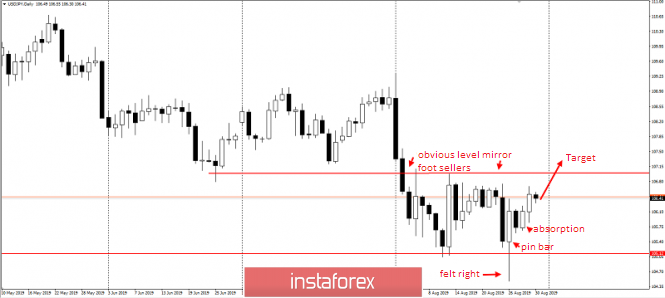
| USDJPY – 70p left before the profit Posted: 30 Aug 2019 05:09 AM PDT USDJPY – 70p left before the profit Good afternoon, dear traders. So, the wave of strengthening of the US dollar began. For me, gold is certainly considered the main indicator of dollar sentiment, which yesterday worked wonderfully on the trading plan. The next target should be the yen. Yesterday's expectations of weak statistics on America were not met, and the dollar strengthened against all currencies. On a heavily oversold yen, it's a good sign to "buy cheap." The trading idea is to hold long positions on USDJPY until the breakdown of the obvious resistance level – the breakdown of the round level of 107. As you know, my trading method – "hunting for stops", and it is in this tool that all sellers of August were trapped and unable to hide their risks for 107. According to statistics, most traders regularly knock out stop losses. This is because they tend to hide their risks for obvious, and sometimes the only possible in most cases levels and extremes, which are then updated with enviable regularity. What you see on the screen for the yen – a classic trap for sellers, before which only 70p remains. And they can be yours. The material has been provided by InstaForex Company - www.instaforex.com |
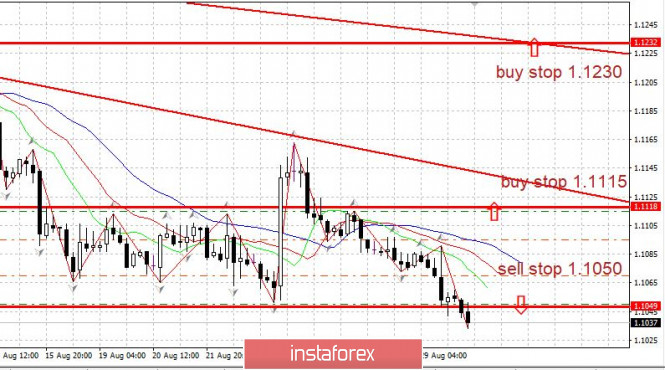
| Trading plan for EURUSD on 08/30/2019 Posted: 30 Aug 2019 05:08 AM PDT
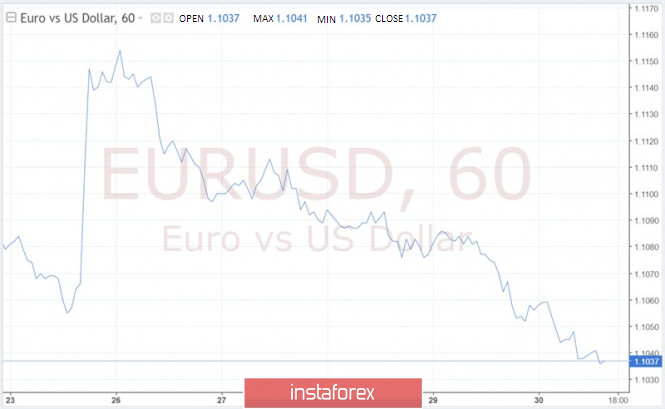
There's a lull in the market. EURUSD: the euro broke below the important level of 1.1050 – a signal to fall. However, there is an even longer level of 1.1025 below. In the case of a break below 1.1025 and consolidation, a downward trend is likely. We keep sales from 1.1050. In the case of a full turn up, purchase from 1.1115. The material has been provided by InstaForex Company - www.instaforex.com |
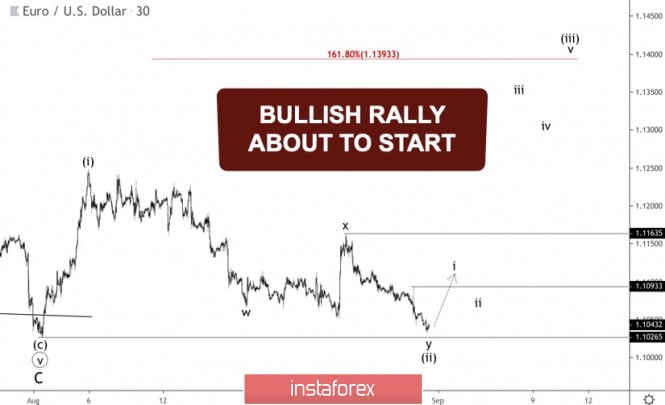
| Bullish rally to kick off soon in EUR/USD Posted: 30 Aug 2019 03:29 AM PDT
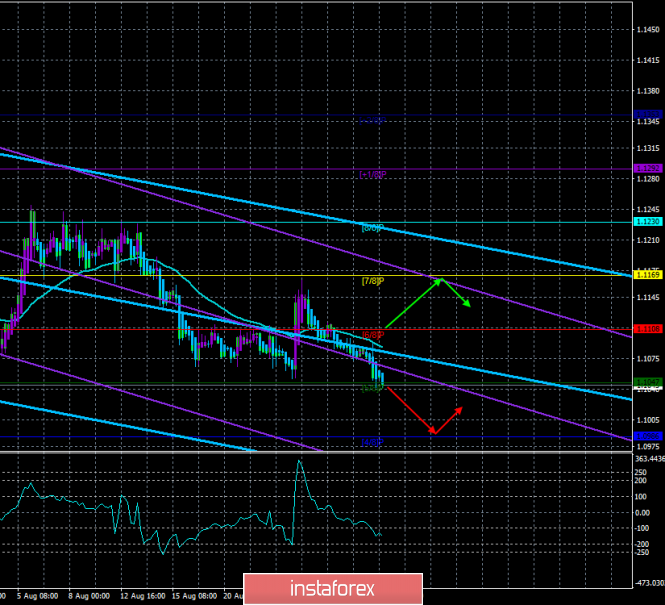
There's a crucial moment in EURUSD. The market broke a local low yesterday, so wave (ii) turned out to be longer with wave x in the form of a flat pattern. The price is near the main critical level at 1.1025 (the low of wave C). As long as this level remains untouched, the bullish outlook will remain in force. However, it's better to see the price above 1.1093 to be sure that wave (iii) is underway. If the pair goes through 1.1165, there'll be more evidence for the bullish outlook. Also, if we have a five-wave structure for wave i of (iii), this scenario will be confirmed. That's why it's less risky to wait for waves i and ii, and after that plan to do any trade actions for wave iii of (iii). The main target for wave (iii) is the 1.618 multiple of wave (i) at 1.1393. Meanwhile, if the price touches 1.1026, the bullish outlook will be no longer valid. If this happens, there'll be a green light for wave C to continue. The bottom line is that EUR/USD remains bullish, but this scenario becomes riskier. In this case, we should wait for confirmation, such as a break of 1.1093 and a five-wave advance for wave i of (iii). The material has been provided by InstaForex Company - www.instaforex.com |
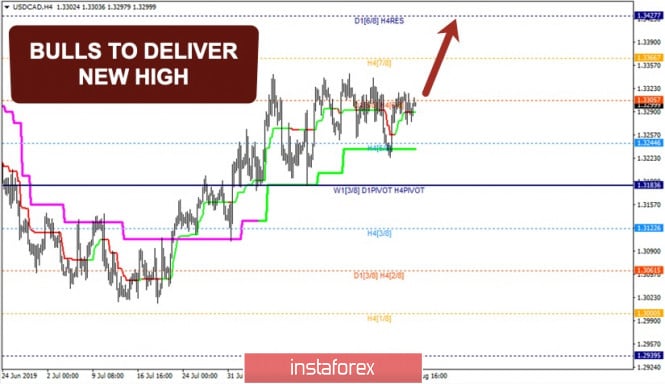
| New high coming soon in USD/CAD Posted: 30 Aug 2019 02:39 AM PDT
The market is consolidating along 6/8 MM Level above the Super Trend Lines, which formed a 'Bullish Cross' at the end of July. 4/8 MM Level has acted as support, which pushed the price higher. Also, there's a pullback from 5/8 MM Level and the Daily Super Trend Line, which brings more evidence for the bullish outlook. Also, the price has fixated above the H4 Super Trend Line, so there's a green light for the market to climb even higher. The next target is 7/8 MM Level, which could act as resistance. If the price goes through this level, we should watch 8/8 MM Level as the next target, which could be a starting point for a significant downward correction. However, if the price breaks the H4 Super Trend and fixates below this line, this scenario will be at risk. If this happens, we should wait for the market's return above 6/8 MM Level as confirmation that bulls are coming back. The Daily ST-Line is the key support for the outlook. The bottom line is that USD/CAD is still bullish. The pair is likely going to reach 7/8 or even 8/8 MM Level, which could act as resistance and lead to a bearish correction towards 4/8 MM Level. The material has been provided by InstaForex Company - www.instaforex.com |
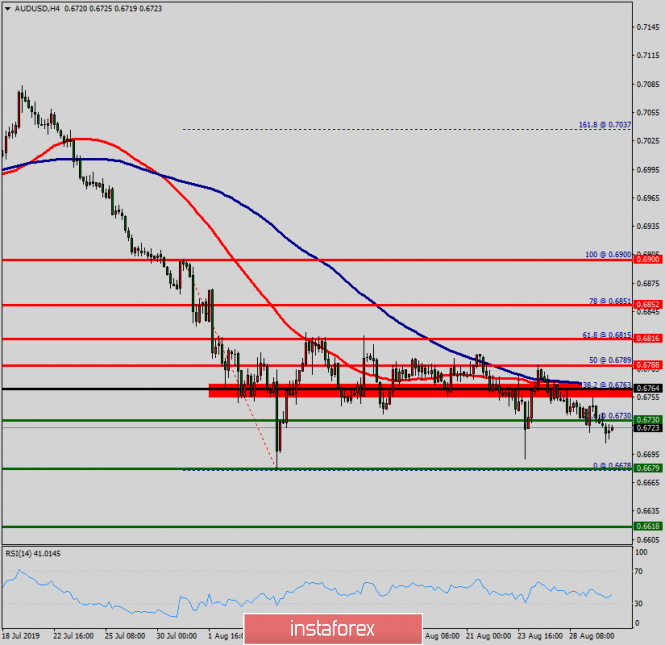
| Technical analysis of AUD/CAD for August 30, 2019 Posted: 30 Aug 2019 02:37 AM PDT Overview: Pivot: 0.6764. The AUD/USD pair is still trading below the major resistance (0.6764) which coincides with the golden ratio in the H1 chart. It continued to move downwards from the level of 0.6764 to the bottom around 0.6764. Today, the first resistance level is seen at 0.6764 followed by 0.6852, while daily support 1 is seen at 0.6730. Furthermore, the moving average (100) starts signaling a downward trend; therefore, the market is indicating a bearish opportunity below 0.6764. So it will be good to sell at 0.6764 with the first target of 0.6730. It will also call for a downtrend in order to continue towards 0.6679 with a view to test the double bottom. In the H1 time frame, the pair will probably go down because the downtrend is still strong. Consequently, the market is likely to show signs of a bearish trend. Additionally, the RSI starts signaling a downward trend. As a result, if the AUD/USD pair is able to break out the first support at 0.6764, the market will decline further to objectives of 0.6730 and 0.6679. The material has been provided by InstaForex Company - www.instaforex.com |
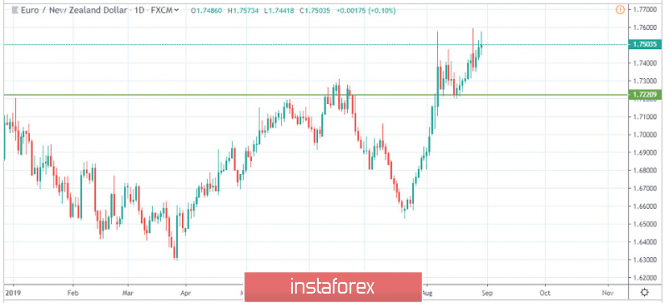
| Daily analysis of EUR/NZD for 30.08.2019 Posted: 30 Aug 2019 02:36 AM PDT
The picture shown above is the daily chart of EUR/NZD. Green line represents the resistance point, which has turned into support. The pair has been following the uptrend for many weeks, thus proving the strength of the trend. The price is currently approaching a minor resistance point, from where there has been a couple of reactions before. All those traders who are willing to follow the trend should drop the plan right away. There are no more long trades on this particular chart. Two sets of trades might set up in the next few days. The first trade is a long trade. You can go long here when the price pulls back to the green line and gives confirmation with your technical indicators. Divergence would give you the right entry time. In this long trade, your stop loss can be placed at 1.71000, with a target of 1.75000. Your risk to reward ratio will be 1:2. The long trade is only for those who have a higher risk appetite. The second trade is a trade on the short side. Since it can take longer than expected, a lot of patience is required. In order to take a short trade, a bearish candle formation below the green line would be prominent. From the point of technical analysis, an exhaustion candlestick pattern would be nice. Then you could take the sell safely. Your stop loss will be above the green line, and the target will be around 1.66000. The recommendation is to take the sell as it offers minimum risk with a nice risk to reward ratio. The material has been provided by InstaForex Company - www.instaforex.com |
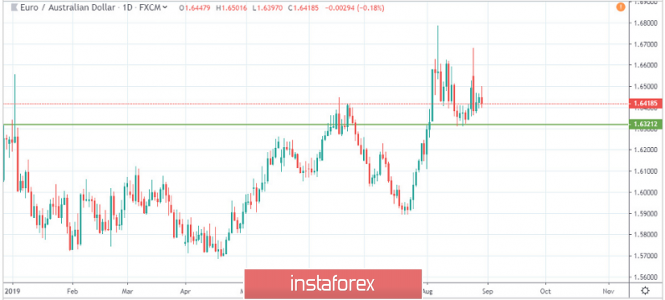
| Daily analysis of EUR/AUD for 30.08.2019 Posted: 30 Aug 2019 02:26 AM PDT
The picture shown above is the daily chart of EUR/AUD. Green line represents the resistance point on the chart. The price broke the green line in August and has been trading sideways for a month. The chart is clearly bullish even now. We see some bearish candle formation after reacting from the price of 1.67000. So traders have been taking the range trades and profiting in this manner. But things might be changing. We are no longer seeing bullish candles that makes us cautious when trying to buy EUR/AUD. The course of action for the next few days would be to wait patiently for appropriate price patterns formation and then take suitable actions. If we see a bearish candle which is able to make it to the price 1.62000, you have some potential sell trades setting up. The important point to make note of is that you require a close of the candle below our green line. Currently, there is no trade possible. If you have large risk appetite, you can also sell at the current market price (CMP). In this case, your stop loss will be above 1.66000 and target could be 1.6000. But this is a very aggressive trade. A safer approach is to sell after a bearish candle formation, which will make your stop loss to be at our green line. The target will be 1.58000. This will result in a risk to reward ratio of 1:2. For all those traders who are thinking to buy this pair, they shouldn't be buying any more. The material has been provided by InstaForex Company - www.instaforex.com |
| Precious metals at risk of near-term top Posted: 30 Aug 2019 02:21 AM PDT Spot gold weakened to near $1,520 per ounce in early New York on Thursday on a combination of dollar strength and slightly increased optimism over US-China trade developments. There was solid support at lower levels at near $1,525 on Friday. The underlying tone remains impressive, especially as the EUR/USD decline to near 2-year lows is a significant negative gold factor. Silver secured support close to $18.00 per ounce and advanced to near $18.40 on Friday. Position adjustment will be an important element on Friday, especially given month-end pressures with currency-market volatility transferring across into choppy precious metals trading. Trade rhetoric will continue to be watched closely after a slightly more positive stance seen from US and China officials on Thursday. Conciliatory rhetoric from President Trump would tend to underpin risk appetite and curb defensive gold demand, especially if bilateral talks take place next week as scheduled. Precious metals are likely to remain resilient amid an underlying lack of confidence across major currencies. Markets will be monitoring closely the political situation in Hong Kong amid an increase in tensions over the past 24 hours. Two prominent pro-democracy protesters have been arrested in Hong Kong and there here have also been reports that the proposal to withdraw the controversial extradition Bill was rejected at high levels within the Chinese government. Any increase in tensions over the weekend would trigger a spike higher in gold. CFTC data needs to be monitored closely late on Friday, especially as long, non-commercial positions are close to record highs. A further increase in long positions would reinforce concerns over the threat of a sharp retracement in gold. Net short-term risks indicate slightly better value in fading precious metals gains and look for better levels to buy for longer-term moves higher.
|
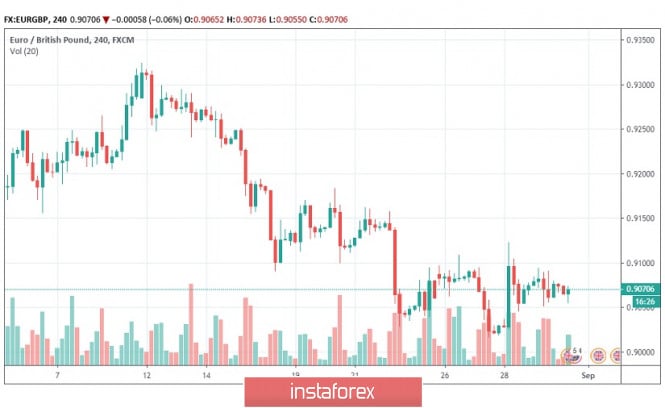
| Sterling downside limited, fade EUR/GBP gains Posted: 30 Aug 2019 01:46 AM PDT There will be choppy sterling trading on Friday given the impact of month-end positioning with higher volatility into the afternoon London fix. EUR/GBP is trading at around 0.9070 with GBP/USD at 1.2170. Political factors will remain extremely important with the UK parliament returning from recess on Tuesday. Tensions will remain extremely high given the government move to suspend parliament from around September 10th until October 14th. This suspension will put very strong pressure on MPs opposed to any 'no-deal' Brexit to take action very quickly next week. When the House of Commons returns next week there will be a rapid move from opposition lawmakers to avoid the scenario of any EU exit without a deal. The UK government has announced that negotiations with the EU will be stepped up during September with twice-weekly meetings between the two sides. Any hint of a compromise would trigger sharp sterling's gains. CFTC data will need to be watched very closely late in the US trading on Friday. Short positions remain close to 29-month highs at over 90,000 contracts, maintaining the potential for aggressive short-term covering. This potential will intensify if there is no significant decline in shorts for the latest reporting week. The sterling has proved relatively resilient since the suspension announcement with GBP/USD losses back below 1.2200 triggered primarily by the dollar's strength as EUR/GBP has declined slightly. The latest economic data recorded a sharp decline in the Lloyds business confidence index with a retreat to 1 for the August reading from 13 the previous month and the lowest reading since December 2011. Consumer confidence also worsened last month and political uncertainty will inevitably sap sentiment in the short term, but with a rapid turnaround if political uncertainty eases. The Bank of England is unwilling to cut interest rates as long as a disruptive Brexit is avoided while the ECB will announce a comprehensive monetary-easing package in September.
|

| You are subscribed to email updates from Forex analysis review. To stop receiving these emails, you may unsubscribe now. | Email delivery powered by Google |
| Google, 1600 Amphitheatre Parkway, Mountain View, CA 94043, United States | |
No comments:
Post a Comment