
Forex analysis review |
- Control zones AUDUSD 08/09/19
- Control zones EURUSD 08/09/19
- Fractal analysis of major currency pairs on August 9
- What currencies will the United States buy in case of intervention
- Analysts expect British pound rally
- Deciding to sell the euro is not easy right now, but it is worth trying on growth attempts
- #USDX vs EUR / USD vs GBP / USD vs USD / JPY. Comprehensive analysis of movement options from August 08, 2019 APLs &
- USD / JPY vs EUR / JPY vs GBP / JPY. Comprehensive analysis of movement options from August 08, 2019 APLs & ZUP analysis
- EUR/USD is waiting for the mark of $1.15
- Oil went to the bottom: quotes at a low of 7 months
- Central banks lose their nerves, the threat of competitive currency devaluation is growing
- EUR/USD. 8 August. Results of the day. What can turn Donald trump's trade war with China turn out to be?
- August 8, 2019 : The GBP/USD Pair remains trapped until Bullish Breakout is achieved above 1.2230.
- August 8, 2019 : EUR/USD Pair is demonstrating a Long-term BULLISH Reversal Pattern.
- Fractal analysis of the main currency pairs on August 8
- BTC 08.08.2019 - Sideywas movement with potential new wave up
- EUR/USD for August 08,2019 - ABC down completed, upward movement is expexted
- Gold 08.08.2019 - Consolidation before the new wave up
- Labour market data set to boost Canadian dollar
- Bears to push GBP/USD even lower
- EUR/USD to climb higher
- The risks of continued Fed rate cuts are growing (we expect the consolidation of EURUSD and GBPUSD pairs before a possible
- Technical analysis of GBP/USD for August 08, 2019
- AUD / USD Forecast August 8, 2019
- Trading recommendations for the GBPUSD currency pair - placement of trade orders (August 8)
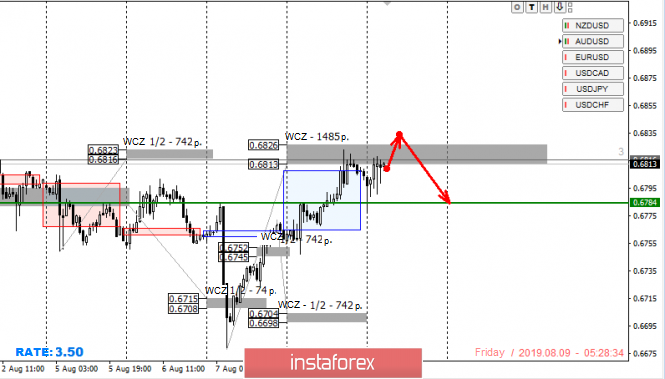
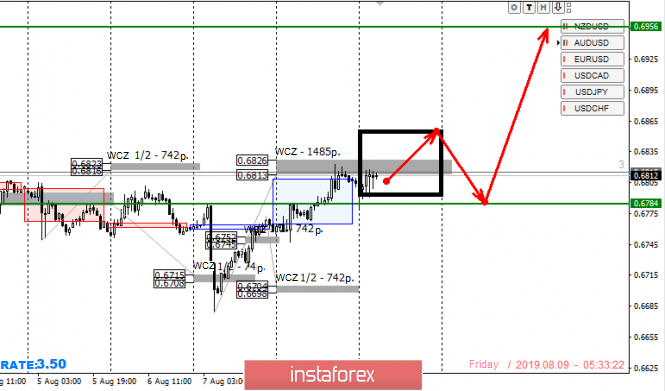
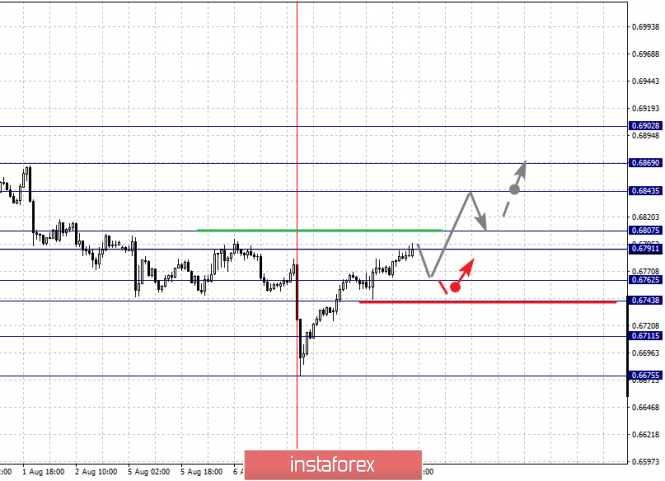
| Posted: 08 Aug 2019 07:46 PM PDT Yesterday, the pair went beyond the weekly average. Fixation rate of purchases during the test of the weekly control zone 0.6826-0.6813 is required. The rest should be transferred to breakeven, and in the case of the formation of a reversal pattern, "false breakdown" of yesterday's maximum completely close the purchase. The upward movement is now an impulse, since the growth rate exceeds the similar decline of the previous days. An alternative model will be developed if the closure of today's US session occurs above the level of 0.6826. This will allow us to consider the pair's purchases for the next week after returning to the level of 0.6784. It is important to note that part of the purchases can be kept with the target at 0.6956, since this level is significant in the medium term. Daily CZ - daily control zone. The zone formed by important data from the futures market that changes several times a year. Weekly CZ - weekly control zone. The zone formed by the important marks of the futures market, which change several times a year. Monthly CZ - monthly control zone. The zone that reflects the average volatility over the past year. The material has been provided by InstaForex Company - www.instaforex.com |
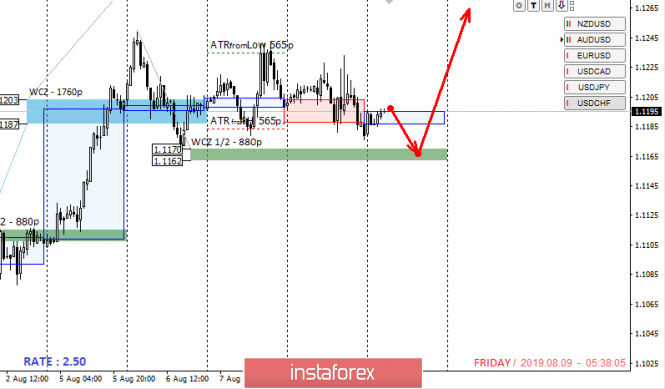
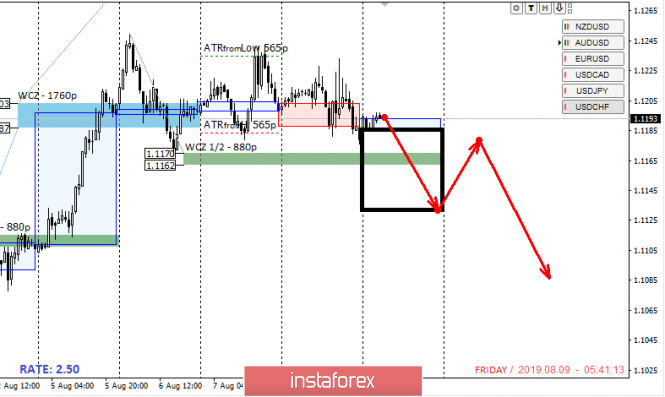
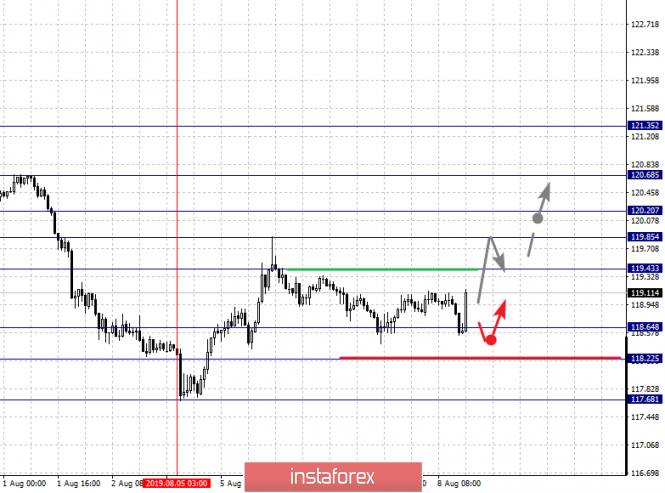
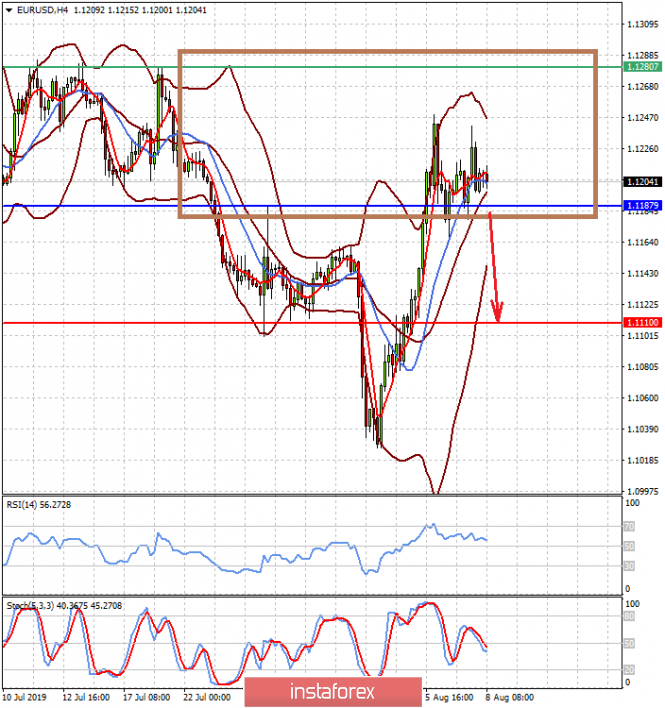
| Posted: 08 Aug 2019 07:45 PM PDT Today's movement takes place within the local accumulation zone, so purchases from the bottom of the flat are the most profitable deals. The WCZ 1/2 1.1170-1.1162 is in the lower range, which is the defining support for the entire upward movement. A test in this zone will indicate a further priority. Purchasing from the zone is the most profitable model, since the probability of updating the monthly high is 70%, and the violation of the upward impulse has not yet occurred. An alternative model that will completely change the balance of power will become relevant if the closure of today's US session occurs below the level of 1.1162. This will indicate the need to close all balances of a long position and search for selling prices on Monday. Daily CZ - daily control zone. The area formed by important data from the futures market, which change several times a year. Weekly CZ - weekly control zone. The zone formed by important marks of the futures market, which change several times a year. Monthly CZ - monthly control zone. The zone, which is a reflection of the average volatility over the past year. The material has been provided by InstaForex Company - www.instaforex.com |
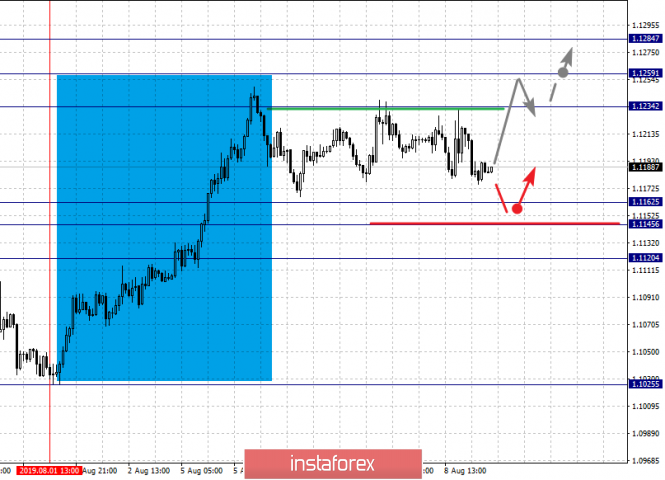
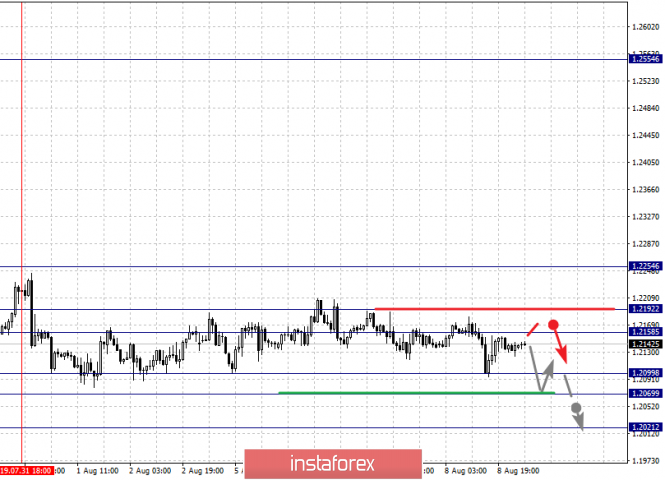
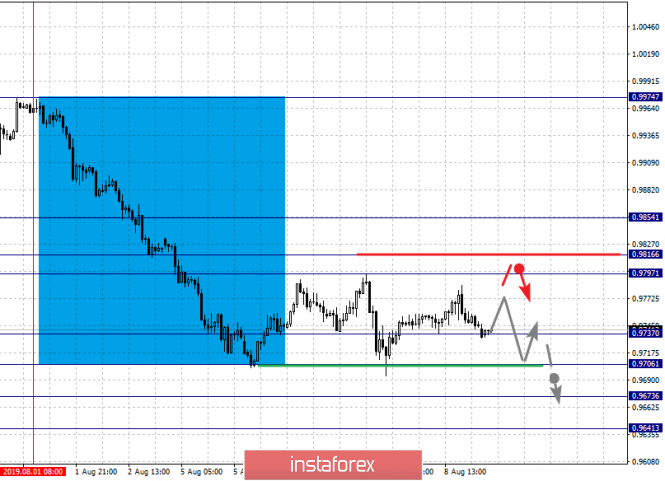
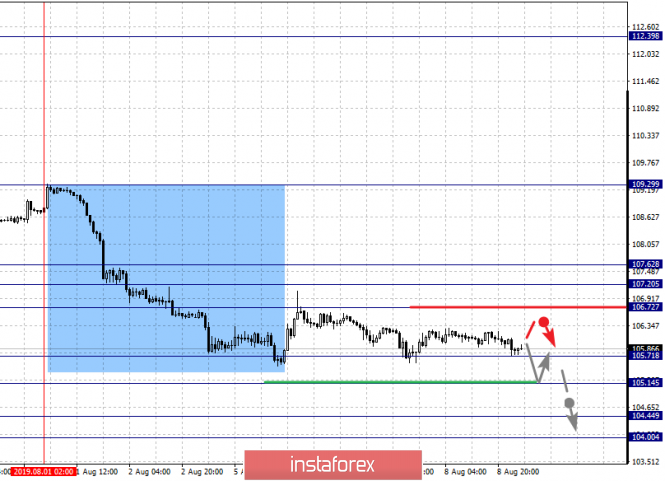
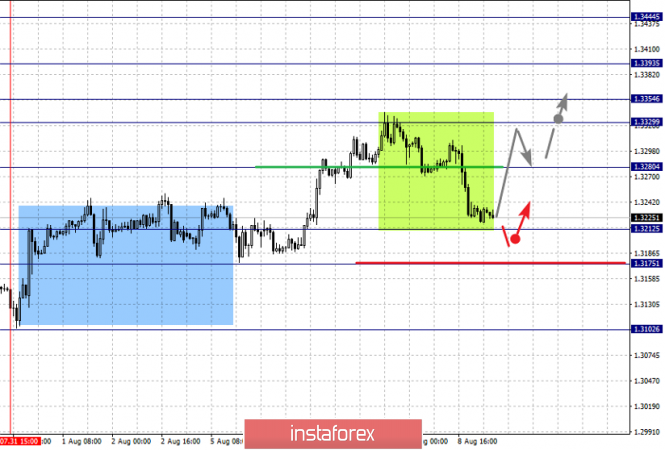
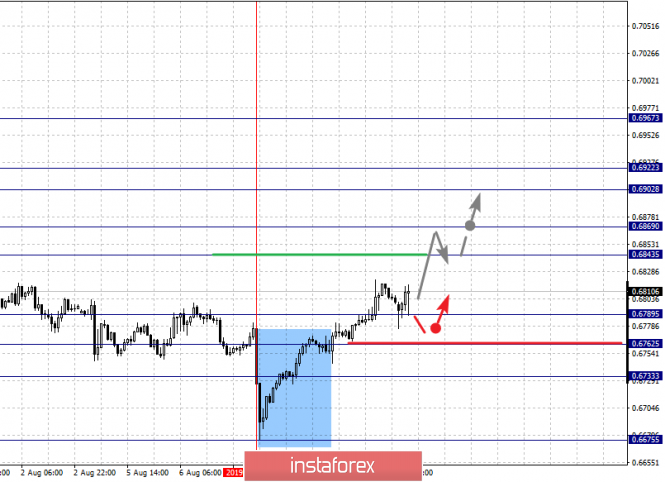
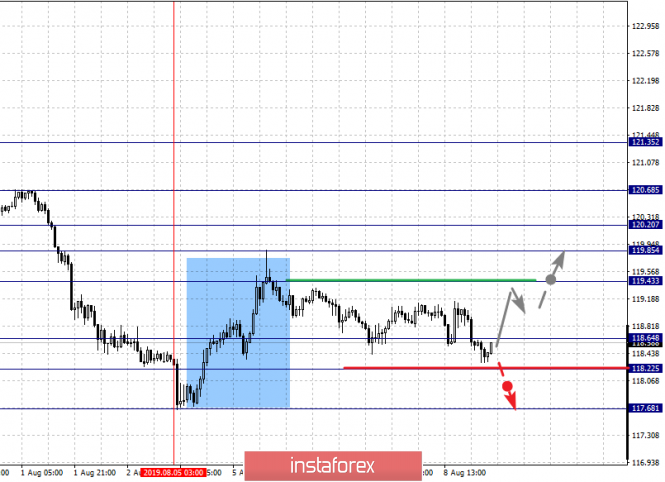
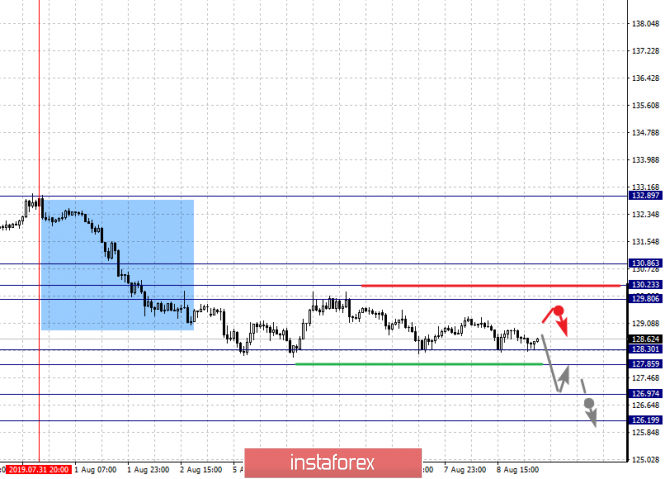
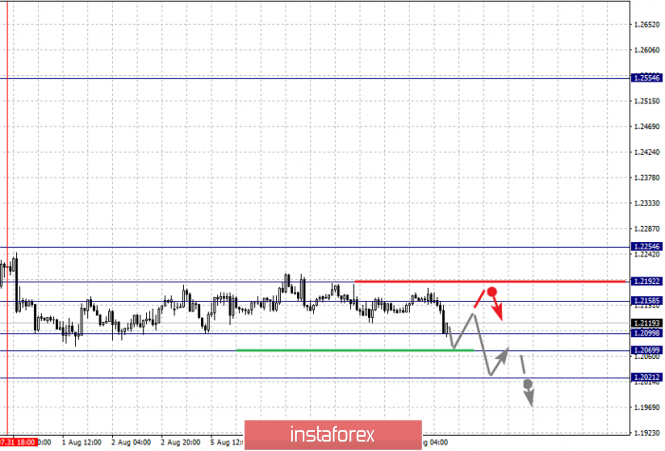
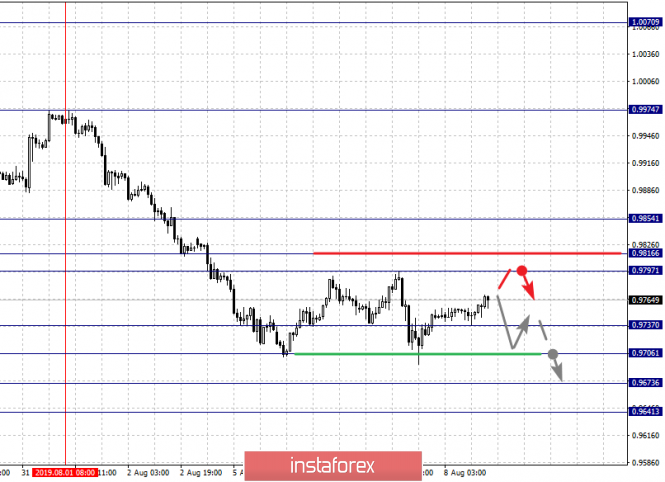
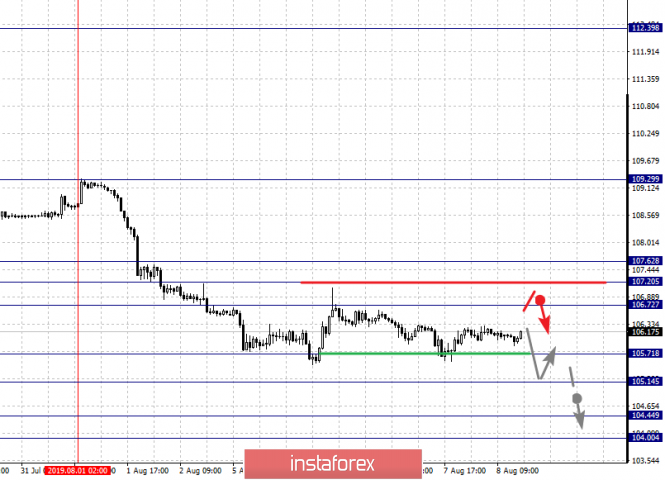
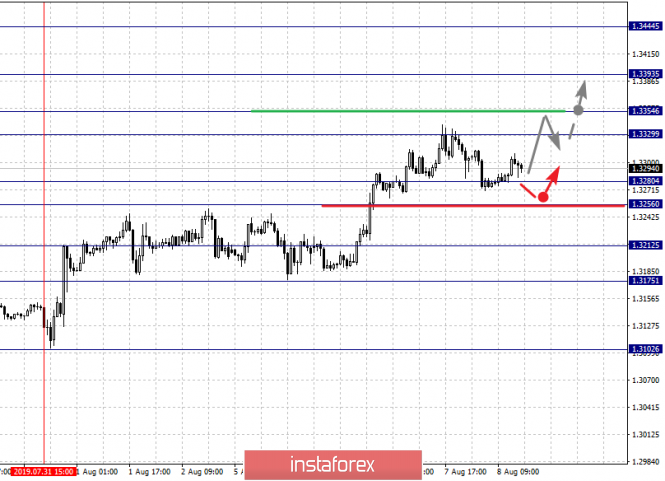
| Fractal analysis of major currency pairs on August 9 Posted: 08 Aug 2019 06:22 PM PDT Forecast for August 9 : Analytical review of currency pairs on the scale of H1: For the euro / dollar pair, the key levels on the H1 scale are: 1.1284, 1.1259, 1.1234, 1.1162, 1.1145 and 1.1120. Here, the price is in the correction zone from the ascending structure on August 1. The continuation of the upward trend is possible after the breakdown of the level of 1.1234. In this case, the target is 1.1259. For the potential value for the top, we consider the level of 1.1284, upon reaching which, we expect consolidation, as well as a pullback to the bottom. Short-term downward movement is possibly in the range of 1.1162 - 1.1145. The breakdown of the last value will lead to a long correction. Here, the goal is 1.1120. This level is a key support for the top. The main trend is the ascending structure of August 1, the correction stage. Trading recommendations: Buy 1.1234 Take profit: 1.1258 Buy 1.1261 Take profit: 1.1284 Sell: 1.1162 Take profit: 1.1146 Sell: 1.1144 Take profit: 1.1122 For the pound / dollar pair, the key levels on the H1 scale are: 1.2254, 1.2192, 1.2158, 1.2099, 1.2069 and 1.2021. Here, we follow the descending cycle of July 19, as well as the local descending structure of July 31. Short-term movement to the bottom is except in the range of 1.2099 - 1.2069. The breakdown of the latter value will allow us to expect movement to a potential target - 1.2021. We expect a correction to this level. Short-term upward movement is possibly in the range of 1.2158 - 1.2192. The breakdown of the last value will lead to the formation of initial conditions for the top. Here, the potential target is 1.2254. The main trend is the downward cycle of July 19, the local structure of July 31. Trading recommendations: Buy: 1.2158 Take profit: 1.2191 Buy: 1.2194 Take profit: 1.2254 Sell: 1.2099 Take profit: 1.2070 Sell: 1.2067 Take profit: 1.2025 For the dollar / franc pair, the key levels on the H1 scale are: 0.9854, 0.9816, 0.9797, 0.9737, 0.9706, 0.9673 and 0.9641. Here, the price is in the correction zone from the downward structure on August 1. The continuation of the movement to the bottom is expected after the breakdown of the level of 0.9737. In this case, the target is 0.9706. Short-term downward movement, as well as consolidation is in the range of 0.9706 - 9637. We consider the level of 0.9641 to be a potential value for the bottom. Upon reaching which, we expect consolidation, as well as a rollback to the top. Short-term upward movement is possibly in the range of 0.9797 - 0.9816. The breakdown of the latter value will lead to an in-depth correction. Here, the target is 0.9854. This level is a key support for the downward structure from August 1. The main trend is the descending structure of August 1, the correction stage. Trading recommendations: Buy : 0.9797 Take profit: 0.9816 Buy : 0.9818 Take profit: 0.9852 Sell: 0.9735 Take profit: 0.9707 Sell: 0.9704 Take profit: 0.9675 For the dollar / yen pair, the key levels on the scale are : 107.62, 107.20, 106.72, 105.71, 105.14, 104.44 and 104.00. Here, we follow the descending structure of August 1. The continuation of the movement to the bottom is expected after the breakdown of the level of 105.71. In this case, the goal is 105.14, and near this level is a price consolidation. The breakdown of the level of 105.14 should be accompanied by a pronounced downward movement. Here, the goal is 104.45. For the potential value for the bottom, we consider the level of 104.00. Upon reaching which, we expect a departure in the correction. Departure to the correction zone is expected after the breakdown of the level of 106.72. Here, the goal is 107.20. The range of 107.20 - 107.62 is the key support for the downward structure. The main trend: descending structure of August 1. Trading recommendations: Buy: 106.72 Take profit: 107.20 Buy : 107.22 Take profit: 107.62 Sell: 105.69 Take profit: 105.15 Sell: 105.13 Take profit: 104.46 For the Canadian dollar / US dollar pair, the key levels on the H1 scale are: 1.3444, 1.3393, 1.3354, 1.3329, 1.3280, 1.3212, 1.3175 and 1.3102. Here, the price is in deep correction from the upward structure on July 31. The breakdown of the level of 1.3212 will lead to the formation of expressed initial conditions for the downward cycle. In this case, the potential target is 1.3175. Price consolidation is near this level. The continuation of the movement to the top is possible after the breakdown of the level of 1.3280. In this case, the first target is 1.3329. Consolidation is in the range of 1.3329 - 1.3354. The breakdown of the level of 1.3355 should be accompanied by a pronounced upward movement. Here, the target is 1.3393. The main trend is the local ascending structure of July 31, the stage of deep correction. Trading recommendations: Buy: 1.3280 Take profit: 1.3329 Buy : 1.3355 Take profit: 1.3392 Sell: 1.3212 Take profit: 1.3178 For the Australian dollar / US dollar pair, the key levels on the H1 scale are : 0.6967, 0.6922, 0.6902, 0.6869, 0.6843, 0.6789, 0.6762 and 0.6733. Here, we follow the development of the ascending structure of August 7th. At the moment, we expect a movement to the level of 0.6843. Short-term upward movement, as well as consolidation is in the range of 0.6843 - 0.6869. The breakdown of the level of 0.6870 should be accompanied by a pronounced upward movement. Here, the target is 0.6902. Price consolidation is in the range of 0.6902 - 0.6922. For the potential value for the top, we consider the level of 0.6967. Upon reaching which, we expect a pullback to the bottom. Short-term downward movement is possibly in the range of 0.6789 - 0.6762. The breakdown of the latter value will lead to an in-depth correction. Here, the target is 0.6733. This level is a key support for the upward structure. The main trend is the formation of initial conditions for the upward cycle of August 7. Trading recommendations: Buy: 0.6845 Take profit: 0.6867 Buy: 0.6870 Take profit: 0.6902 Sell : 0.6787 Take profit : 0.6764 Sell: 0.6760 Take profit: 0.6735 For the euro / yen pair, the key levels on the H1 scale are: 120.68, 120.20, 119.85, 119.43, 118.94, 118.64, 118.22 and 117.68. Here, the price is in deep correction from the ascending structure on August 5. The cancellation of this structure requires the breakdown of the level of 118.20. In this case, the first potential target is 117.68. The continuation of the movement to the top is expected after the breakdown of the level of 119.43. In this case, the target is 119.85. Consolidation is in the range of 119.85 - 120.20. The breakdown of the level of 120.20 should be accompanied by a pronounced upward movement. Here, the goal is 120.68. For the potential value for the top, we consider the level of 121.35. The main trend is the initial conditions for the top of August 5, the stage of deep correction. Trading recommendations: Buy: 119.45 Take profit: 119.85 Buy: 120.20 Take profit: 120.68 Sell: 118.62 Take profit: 118.24 Sell: 118.20 Take profit: 117.72 For the pound / yen pair, the key levels on the H1 scale are : 130.86, 130.23, 129.80, 128.98, 128.30 and 127.85. Here, we follow the local descending structure of July 31. The continuation of movement to the bottom is expected after the price passes the noise range 128.30 - 127.85. In this case, the target is 126.97. For the potential value for the bottom, we consider the level of 126.19. Upon reaching which, we expect a pullback to the top. The range of 129.80 - 130.23 is the key support. Its breakdown will allow counting on movement to the level of 130.86, which is a key resistance for the subsequent development of the upward trend. The main trend is the local descending structure of July 31. Trading recommendations: Buy: 130.26 Take profit: 130.84 Sell: 127.85 Take profit: 127.00 Sell: 126.95 Take profit: 126.20 The material has been provided by InstaForex Company - www.instaforex.com |
| What currencies will the United States buy in case of intervention Posted: 08 Aug 2019 05:08 PM PDT Donald Trump has long been indignant over the fact that the expensive dollar is offsetting the competitive advantages of the United States. At this time, experts from leading banks in the world are vying to talk about the upcoming devaluation of the US currency. Given the speed of the renminbi's fall, the need to act is clearly brewing. Although on the Bank of China stabilized the yuan on Thursday, according to strategists, this is not for long. Fixing the course and focusing the market at around seven is just a distracting maneuver and a desire to divert markets from panic. The dramatic fall of the renminbi cannot be ruled out, Goldman Sachs believes. The risk is that the US Presidential Administration will respond to this kind of incident. Analysts have several options for Washington to conduct a currency intervention against the dollar, including the most extreme. The US can conduct a direct foreign exchange intervention by selling dollars and buying currencies like the euro and the yen. The effect will be minimal, and coordination with Congress will be required. Therefore, the US president is likely to take advantage of a hidden trump card, with which he will immediately solve the problem of the small size of the ESF and will do without the approval of Congress. The owner of the White House may declare the currency intervention emergency, forcing the Fed to sell dollars from its account. This, of course, is unlikely, but given that Trump has already declared a state of emergency to increase duties on China's goods, everything is possible. In this scenario, the dollar will plummet also because confidence in it as a world reserve currency will drop. World central banks and other large investors with $6 trillion worth of Treasuries on their balance sheets will begin to hastily dispose of these securities. It is possible that the warlike rhetoric of the US president is a negative imprint. Demand at auctions for the placement of state bonds jumped up and down, the share of foreigners in the Treasury market fell to a 15-year low of 40%. The largest US lender - China - bought very little. Japan reduced its position in Treasury to its lowest level in almost 20 years. There are analysts, including Goldman Sachs, who doubt the reality of interventions aimed at lowering the dollar. The United States has not attempted to devalue the national currency since 1985, the decision to do so now would look strange and scare off foreign investors, putting all domestic assets — from Treasuries to shares — at risk. What if the intervention happens? The yen along with the Australian and Singapore dollar, as well as the Korean won, could be the main purchasing targets in the Asia-Pacific region. The yuan has significant weight in the effective dollar exchange rate index, but the United States will be politically embarrassed to take Chinese government securities due to hostile relations. The United States can sell dollars, putting pressure on other Asian economies to limit the weakness of their currencies. This includes Malaysia and Vietnam, which are monitored by the Treasury, as well as Taiwan and India, whose currencies affect the effective exchange rate of the dollar. The Bank of America admits that foreign exchange intervention may be successful. Ultimately, it will not lead to the desired goal, moreover, it will be in conflict with the United States' interest. The material has been provided by InstaForex Company - www.instaforex.com |
| Analysts expect British pound rally Posted: 08 Aug 2019 05:02 PM PDT According to some analysts, when all the unrest associated with Brexit and the volatility in the global financial markets is over, investors will begin to massively buy the British currency. Many analysts believe that the pound is underestimated, and it's time will soon come. The British currency is trading near the lows of 2016-2017 at the moment. Analysts at the largest Lloyds bank are confident that the difficult political situation in the UK will make the pound once again show a decline. The bank believes that by the end of 2019, the British currency will be at around 1.29 against the US dollar, and it will rise to 1.33 by the end of 2020. Analyzing the British pound market, other analysts predict a slight increase in the GBP/USD pair. Currently, the pound is trading at $1.2125 against the US dollar. Some analysts recommend selling the British currency. The bank believes that prospects for the pound's dynamics look uncertain, but urge not to fall into pessimism. Lloyds believes that the situation with Brexit will be resolved safely, but they do not exclude the pound rally in the near future. If a compromise is reached regarding Britain's exit from the EU, the prospects for the British currency will be positive, analysts say. This will give confidence to investors who recall the strong undervaluation of the pound and begin to acquire it, according to Lloyds. The material has been provided by InstaForex Company - www.instaforex.com |
| Deciding to sell the euro is not easy right now, but it is worth trying on growth attempts Posted: 08 Aug 2019 04:42 PM PDT Strategists at Bank of Montreal (BMO) believe that one should not be surprised at the recent upward movement of EUR/USD, as well as high hopes for the development of upward dynamics. "Negative rates by the ECB made the euro a funding currency, and the reduction in the position of carry traders in the context of an escalation of the US and China conflict gave a fresh impetus to the growth of EUR/USD. However, the situation in the eurozone, including Germany, has not been doing very well lately, and the deterioration of the prospects for the Chinese economy bodes big trouble in Europe," analysts said. "We believe that the European Central Bank will have to lower rates even lower into the zone of negative values, and the new difficult period in the EU's economy threatens to exacerbate political tension within the bloc, which also risks the consequences of a "hard" Brexit," they added. The BMO expects that over the next three months, the EUR/USD pair may drop to 1.08. "It is obvious that the price of survival of the eurozone is rising, and this will be reflected in some combination of political tension, the weakness of the euro and the limited growth of the region's GDP," representatives of the financial institute said. "There is definitely no reason for buying the euro now. Although selling the single European currency in terms of the accumulated volume of positions, the carry trade does not look like a simple solution. However, for everyone who is not afraid, we recommend selling EUR/USD with a stop at 1.1400 and a target at 1.08," they said. The material has been provided by InstaForex Company - www.instaforex.com |
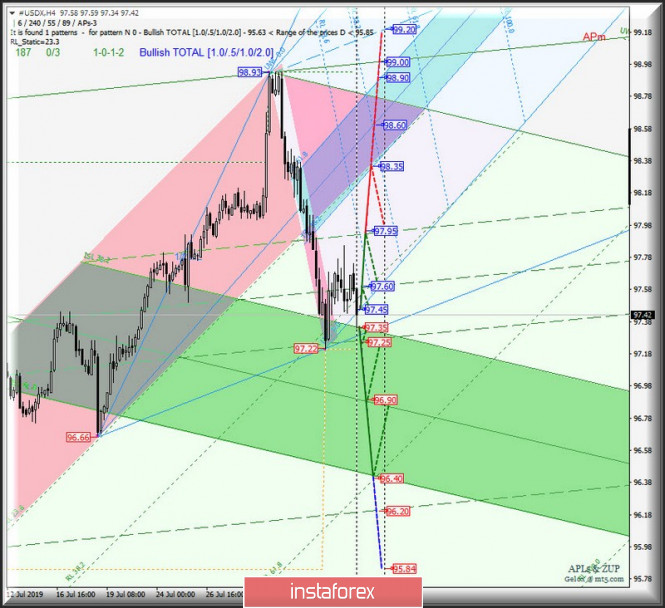
| Posted: 08 Aug 2019 04:33 PM PDT We consider what will happen with the development of the movement of currency instruments in a comprehensive manner - having a specific gravity of 83.1% in the calculation of the dollar index - EUR / USD, GBP / USD and USD / JPY from August 08, 2019. Minuette operational Scale (H4 time frame) ____________________ US dollar index The movement of the dollar index #USDX from August 08, 2019 will receive its development depending on the direction of the breakdown of the range :
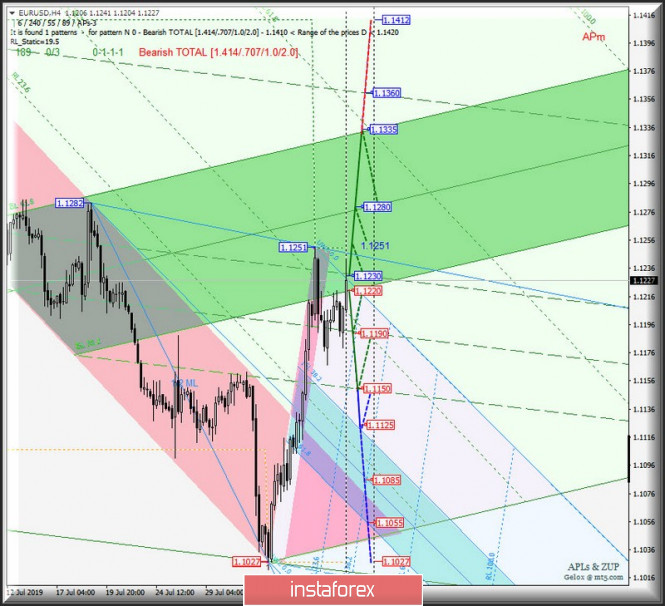
A combined breakdown of ISL38.2 Minuette (support level of 97.35) and the lower border (support level of 97.25) of the 1/2 Median Line channel Minuette will confirm that the further development of the movement of the dollar index will begin to occur within the equilibrium zone (97.35 - 96.90 - 96.40) of the Minuette operational scale. With the breakdown of the resistance level of 97.45 (the starting line SSL Minuette), followed by the breakdown of 1/2 Median Line Minuette (97.60), it will be possible to develop an upward movement of #USDX to the upper boundary of the 1/2 Median Line channel (97.95) of the Minuette operational scale fork and the equilibrium zone (98.35 - 98.60 - 98.90) of the Minuette operational scale fork. The details of the #USDX movement are presented in the animated chart. ____________________ Euro vs US dollar As further as August 08, 2019, the development of the movement of the single European currency EUR / USD will begin to occur. It will be determined by the direction of the breakdown of the range :
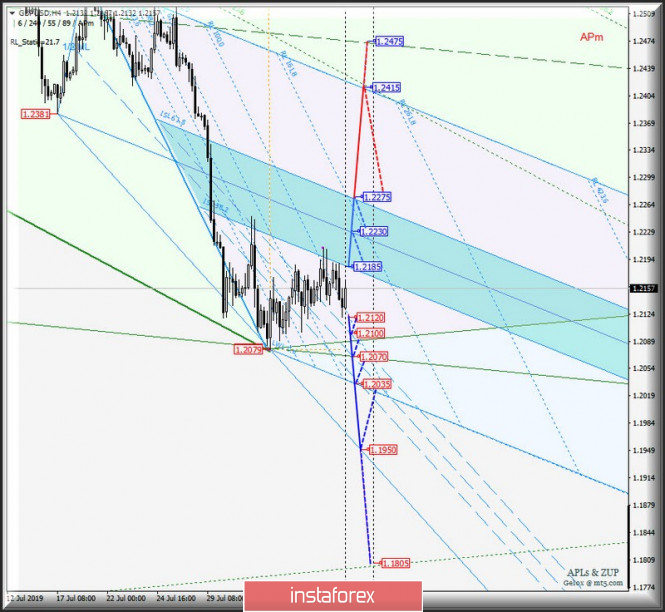
The breakdown of the upper boundary of the 1/2 Median Line channel Minuette (resistance level of 1.1230) will determine the development of the movement of the single European currency inside the equilibrium zone (1.1220 - 1.1280 - 1.1335) of the Minuette operational scale fork, depending on the development of the local maximum 1.1251. The breakdown of the support level of 1.1220 (the lower boundary of the ISL38.2 equilibrium zone of the Minuette operational scale fork) will direct the development of the EUR / USD movement to the targets - 1/2 Median Line Minuette (1.1190) - the lower boundary of the 1/2 Median Line channel Minuette (1.1150) and another option - reaching the boundaries of the equilibrium zone (1.1125 - 1.1085 - 1.1055) of the Minuette operational scale fork. The details of the EUR / USD movement options are shown in the animated chart. ____________________ Great Britain pound vs US dollar The currency of Her Majesty GBP / USD from August 08, 2019 will also develop its movement depending on the direction of the breakdown of the range :
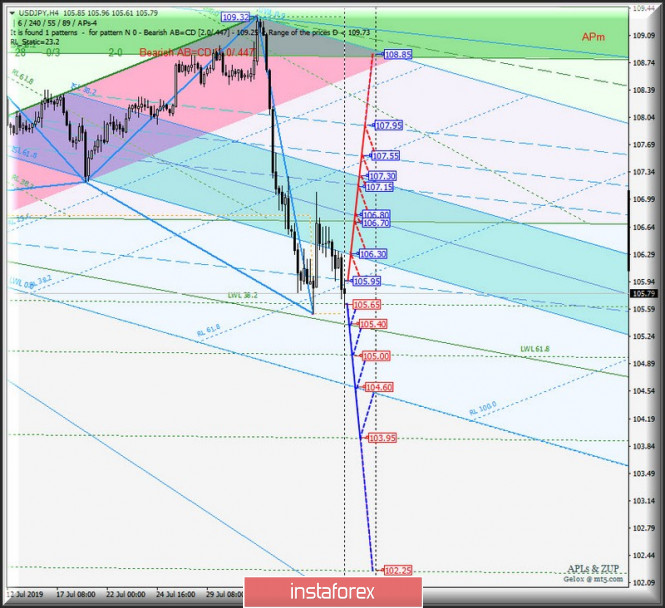
With the breakdown of ISL38.2 Minuette (resistance level of 1.2185), the development of Her Majesty's currency movement will continue to move in the equilibrium zone (1.2185 - 1.2230 - 1.2275) of the Minuette operational scale fork, and if there will be a breakdown of ISL61.8 Minuette (1.2275), then the upward movement of the GBP / USD may continue to the final line FSL Minuette (1.2415). On the contrary, if GBP / USD returns below the RL100.0 Minuette reaction line (support level of 1.2120), the downward movement can continue to the boundaries of the 1/2 Median Line Minuette channel (1.2100 - 1.2070 - 1.2035) with the prospect of reaching the LTL control line (1.1950) of the Minuette operational scale. The details of the GBP / USD movement can be seen on the animated chart. ____________________ US dollar vs Japanese yen The development of the movement of the "currency of the country of the rising sun" USD / JPY from August 08, 2019 will also be determined by the direction of the breakdown of the range :
The breakdown of the support level of 105.65 (warning line LWL38.2 of the Minuette operational scale fork) will make it relevant to continue the development of the downward movement of USD / JPY to targets - the control line LTL Minuette (105.40) - the warning line LWL61.8 Minuette (105.00) - the final line FSL Minuette (104.60) - warning line LWL100.0 Minuette (104.60). The breakdown of the final Schiff Line Minuette (resistance level of 105.95) will direct the development of the currency of the "land of the rising sun" to the boundaries of the equilibrium zone (106.30 - 106.80 - 107.30) and 1/2 Median Line channel (107.15 - 107.55 -107.95) of the Minuette operational scale. We look at the details of the USD / JPY movement on the animated chart. The review is made without taking into account the news background. The opening of trading sessions of the main financial centers does not serve as a guide to action (placing orders "sell" or "buy"). The formula for calculating the dollar index : USDX = 50.14348112 * USDEUR0.576 * USDJPY0.136 * USDGBP0.119 * USDCAD0.091 * USDSEK0.042 * USDCHF0.036. where the power coefficients correspond to the weights of the currencies in the basket: Euro - 57.6% ; Yen - 13.6% ; Pound Sterling - 11.9% ; Canadian dollar - 9.1%; Swedish Krona - 4.2%; Swiss franc - 3.6%. The first coefficient in the formula leads the index to 100 at the start date of the countdown - March 1973, when the main currencies began to be freely quoted relative to each other. The material has been provided by InstaForex Company - www.instaforex.com |
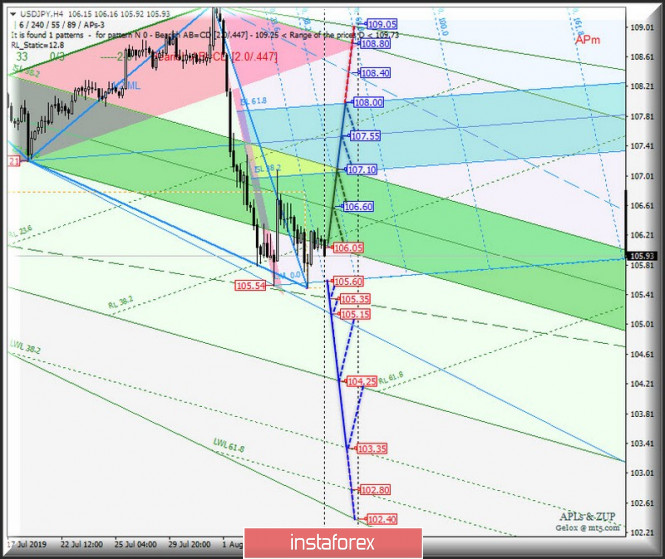
| Posted: 08 Aug 2019 04:33 PM PDT Let's consider how further the development of the USD / JPY currency movement of the "country of the rising sun" and its cross-instrument EUR / JPY and GBP / JPY will begin to flow from August 08, 2019. Minuette operational scale (H4 timeframe) ____________________ US dollar vs Japanese yen The development of the currency movement of the "country of the rising sun" USD / JPY from August 08, 2019 will be determined by the direction of the breakdown of the range :
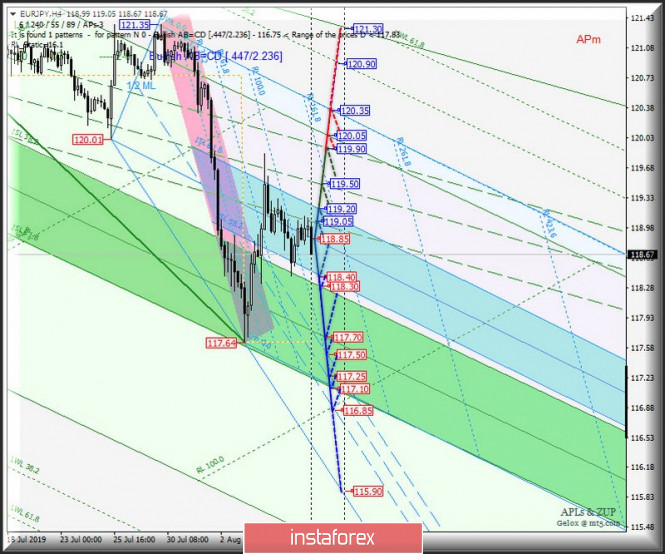
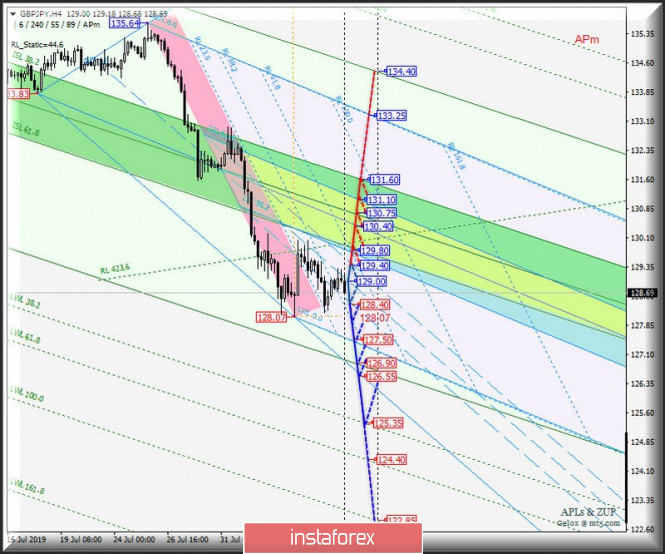
A combined breakdown of the SSL start line (resistance level of 105.60) of the Minuette operational scale fork, the final Schiff Line Minuette (105.35) and the LTL Minuette control line (105.15) will make it possible to continue the downward movement of the currency of the "rising sun" to the final FSL (104.25) and warning LWL38 .2 (103.35) of the Minuette operational scale fork. If the breakdown of the ISL61.8 Minuette takes place (resistance level of 108.25), then the development of the USD / JPY movement will continue within the boundaries of the equilibrium zones of the Minuette (106.05 - 106.60 - 107.10) and Minuette (107.10 - 107.35 - 108.00). The details of the movement of USD / JPY, depending on the direction of breakdown of the range, are shown in the animated chart. ____________________ Euro vs Japanese yen The development of the movement of EUR / JPY cross-instrument from August 08, 2019 will be determined by the development and direction of the breakdown of the boundaries of the equilibrium zone (119.20 - 118.85 - 118.40) of the Minuette operational scale fork. Look at the markup on the animation chart. A successful breakdown of the lower boundary of ISL38.2 (support level of 118.40) of the equilibrium zone of the Minuette operational scale fork and ISL38.2 Minuette (118.30) will determine the development of the EUR / JPY movement within the boundaries of the equilibrium zone (118.30 - 117.70 - 117.10) of the Minuette operational scale fork and 1/2 Median Line channel (117.50 - 117.25 - 116.85) of the Minuette operational scale fork. In case of breakdown of the upper boundary ISL61.8 (resistance level of 119.20) of the equilibrium zone of the Minuette operational scale fork, the development of the movement of this cross-instrument will continue in the 1/2 Median Line channel (119.05 - 119.50 - 119.90) of the Minuette operational scale fork with the prospect of reaching the initial SSL line Minuette (120.05) and the final line FSL Minuette (120.35). The details of the movement of EUR / JPY, depending on the development of the boundaries of this zone, are presented in the animated chart. ____________________ Great Britain pound vs Japanese yen The movement of the GBP / JPY cross-instrument from August 08, 2019 will depend on the development and direction of the breakdown of the channel boundaries of 1/2 Median Line (128.40 - 129.00 - 129.40) of the Minuette operational scale. See the animation for details. If the support level of 128.40 is broken down at the lower boundary of the 1/2 Median Line channel of the Minuette operational scale fork and the local minimum of 128.07 is updated, the downward movement of GBP / JPY will be possible to continue to the targets - the initial SSL Minuette line (127.50) - the final FSL line (126.90) Minuette operational scale fork - control line LTL Minuette (126.55) with the prospect of reaching the warning line LWL38.2 Minuette (125.35). The breakdown of the resistance level of 129.40 (the upper boundary of the 1/2 Median Line Minuette channel) will direct the development of the movement of this cross-instrument to the boundaries of the equilibrium zones of the Minuette operational scales fork 129.80 - 130.40 - 131.10) and Minuette 129.80 - 130.75 - 131.60). The GBP / JPY movement options, depending on the direction of the breakdown of the 1/2 Median Line channel Minuette, are presented in the animated chart. ____________________ The review is made without taking into account the news background. The opening of trading sessions of the main financial centers does not serve as a guide to action (placing orders "sell" or "buy"). The formula for calculating the dollar index: USDX = 50.14348112 * USDEUR0.576 * USDJPY0.136 * USDGBP0.119 * USDCAD0.091 * USDSEK0.042 * USDCHF0.036. where the power coefficients correspond to the weights of the currencies in the basket: Euro - 57.6%; Yen - 13.6% ; Pound Sterling - 11.9%; Canadian dollar - 9.1%; Swedish Krona - 4.2%; Swiss franc - 3.6%. The first coefficient in the formula leads the index to 100 at the start date of the countdown - March 1973, when the main currencies began to be freely quoted relative to each other. The material has been provided by InstaForex Company - www.instaforex.com |
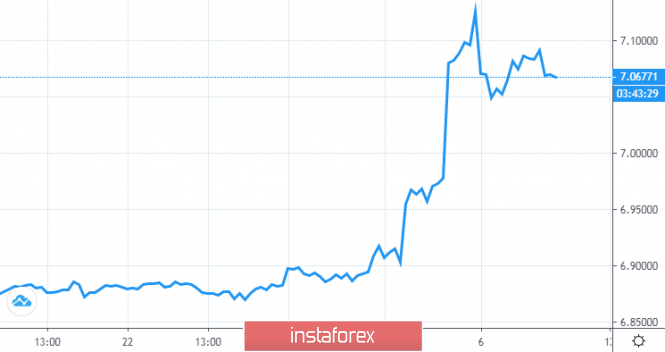
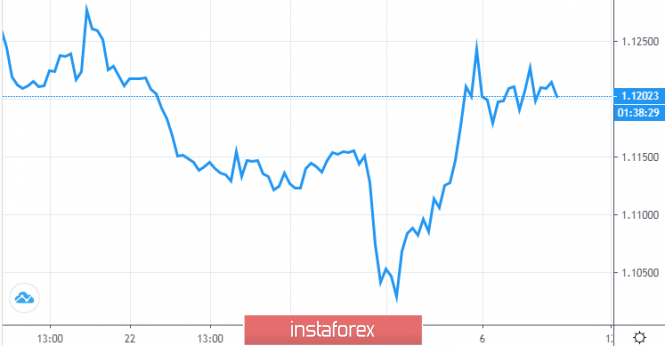
| EUR/USD is waiting for the mark of $1.15 Posted: 08 Aug 2019 04:23 PM PDT China has added some positive to the gloomy market environment, reporting unexpectedly strong export data despite a large-scale trade war. Imports also turned out to be better than market participants could have expected. This means that domestic demand in the country is not so weak. The Bank of China also slightly calmed traders. The country's monetary authorities set the yuan at a more solid level than on Wednesday. The market immediately started talking about the stabilization of the course. The concern that China will continue to devalue its currency is gradually disappearing. It seems that the USD/CNY rally above the psychologically important mark of 7 was nothing more than a weapon demonstration. USD/CNY The health of the Chinese economy is poor due to protectionism. The risks of a recession in leading world countries have recently grown significantly. A decline in the yield curve to its lowest level since 2007 suggests that not everything is as good in the United States as Donald Trump would have liked. Note that this indicator accurately predicted a decline over the past 50 years. The US central bank is sensitive to raising international risks. According to his senior representative Charles Evans, trade conflicts create a headwind for the US economy. With its strengthening, the Fed is obliged to take necessary measures. Earlier, Evans warned that the central bank will not limit itself with one rate cut by 25 bp in 2019. Now the official allows it to fall to zero. In the past few days, the derivatives market has increased the likelihood of three acts of monetary easing by the end of the year from 8% to 50%. The likelihood of a rate cut by 50 bp in September rose from 2% to 33%. JPMorgan believes in lower rates and higher currencies EM Along with the slow growth of global GDP under the influence of the trade conflict, the Fed may unnerve another fact. The central banks of New Zealand, India and Taiwan have loosened monetary policy. Not only them but this is happening all over the world. The Federal Reserve has no other way than to soften politics. This will limit the growth of the dollar and set in motion the exchange rates of developing countries, according to JPMorgan Asset Management. The weakness of the EM currencies is justified after the so-called "hawkish reduction" of the Fed rate and trade tension. Now, according to representatives of the bank, the most important will be to monitor the response of the United States. EM debt in local currency will be profitable for investment, as global central banks cut rates in an effort to counter the slowdown in global GDP growth. The lion's share of respondents are confident in reducing the rate by 75 bp by the end of 2019 If this really happens, the US dollar will seriously weaken its position. The EUR/USD pair is expected to reach the lowest point in two years - $1.15 in 12 months. In the short term, a breakthrough of one of the boundaries of the consolidation range of $1.1175 –1.1245 will allow the single currency to decide on the future direction. EUR/USD |
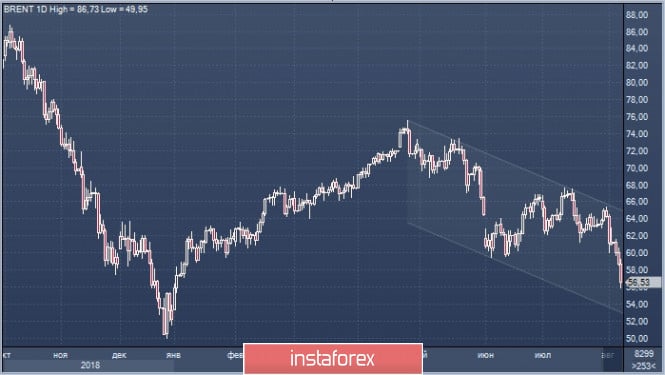
| Oil went to the bottom: quotes at a low of 7 months Posted: 08 Aug 2019 04:11 PM PDT According to analysts, Brent oil quotes show a downward trend at the moment. Brent futures fell 4.3% to $ 56.42 a barrel by the close of trading on Wednesday, August 7. Analysts emphasized that a 7-month low was updated during the trading session. According to preliminary estimates, compared to the record highs of April 2019, the benchmark oil has fallen in price by 20%, although since the beginning of the year the growth has been 5.2%. As for the light WTI grade, quotes for this oil fell 4.4% to $ 51.25 per barrel. According to analysts, futures on Brent and WTI entered the "bearish" phase on Tuesday. At the same time, the downside players increased the pressure, forcing the "bulls" to hastily close long positions. Currently, the price of Brent futures has received support at around $ 56. However, with the intensification of the negative news background, black gold may become even cheaper, and the next level of support will be $55. Last week, the value of Brent fell by more than 12% against the backdrop of the collapse of global stock indices. The decline was triggered by Donald Trump's statements about the introduction of a 10% duty on Chinese imports worth $300 billion from September 1, 2019. According to Gene Mcgillian, Vice President of marketing research at Tradition Energy, the significant decline in the market is due to concerns about the demand for raw materials, as well as concerns about the slowdown in economic growth due to the trade war. According to Josh graves, a leading strategist at RJO Futures, oil prices could fall to $40 per barrel if the market remains bearish. The expert draws attention to the growth of oil production in the United States, as well as to the signals of the stock market, indicating increased concerns about the slowdown of the economy. |
| Central banks lose their nerves, the threat of competitive currency devaluation is growing Posted: 08 Aug 2019 04:02 PM PDT Trade tensions between Beijing and Washington spilled over into the foreign exchange market. Last Monday, after the People's Bank of China allowed the yuan to drop below 7.0 against the dollar, the US Treasury officially recognized China as a currency manipulator. It is noteworthy that China received a "black mark" for sitting idly by. However, the passive position of PBOC, which did not want to interfere in the life of the foreign exchange market, is nothing more than a demonstration of weapons. That is, Beijing clearly demonstrated to Washington that it has something to respond to threats to its economy and that if a full-scale trade war begins, not only China will suffer serious losses. However, the current actions of the US administration are caused not only by the desire to put pressure on China in order to accelerate trade negotiations, but also by the desire to stir up the Fed. Goldman Sachs analysts believe that the growing tension in trade relations between the United States and China means that this year the Federal Reserve will lower the interest rate twice more. "This year the Fed is increasingly responding to the threats of a trade war, the expectations of the bond market and the problems of global growth," they said. Meanwhile, trade tensions and a slowdown in the global economy are causing concern not only among the US central bank. One of the newsmakers of yesterday was the Reserve Bank of New Zealand, which cut the interest rate immediately by 50 basis points, to 1%, while the vast majority of analysts expected it to decrease by only 25 basis points. As a result, the NZD/USD pair collapsed to the level of 0.6400, the lowest level since 2016. The minutes of the RBNZ meeting showed that the regulator is greatly alarmed by the recent escalation of the trade conflict between the United States and China, which could adversely affect investment and economic growth in New Zealand. The kiwi sharply fell following the aussie. The AUD/USD pair plummeted below 0.67, reaching its lowest level in the last ten years due to rumors that the Reserve Bank of Australia could follow the example of its New Zealand counterpart and lower interest rates more than expected. The central bank of India also gave investors a surprise yesterday, immediately cutting the key rate by 35 basis points. According to analysts, national governments are now faced with a difficult choice: they can either put pressure on their currencies by lowering interest rates or direct intervention in the market, or allow exchange rates to strengthen and jeopardize their economies. "It is not yet clear what exactly the United States will do, but the need to act is clearly brewing, given the devaluation of the renminbi rate, which is becoming cheaper at a record pace since 1994," strategists at ING said. Recall that Donald Trump has long been lamenting that an overly expensive greenback will offset the competitive advantages of the United States. Recently, rumors have been circulating that the country's authorities are about to devalue the dollar. JPMorgan is confident that lowering the USD against major world currencies such as the euro and the yen will not be difficult, but there may be a problem with the yuan, whose rate is not floating. So far, Trump has been using tariffs as the main weapon in the trade war, however, Nomura believes that the head of the White House can change his strategy and begin to manipulate exchange rates himself. But Goldman Sachs analysts doubt the reality of the U.S. Treasury Department's interventions aimed at depreciating the dollar. They note that the United States has not attempted to devalue the national currency since 1985, so the decision to do so now would even look strange and frighten off foreign investors, jeopardizing all US assets - from Treasuries to stocks. The material has been provided by InstaForex Company - www.instaforex.com |
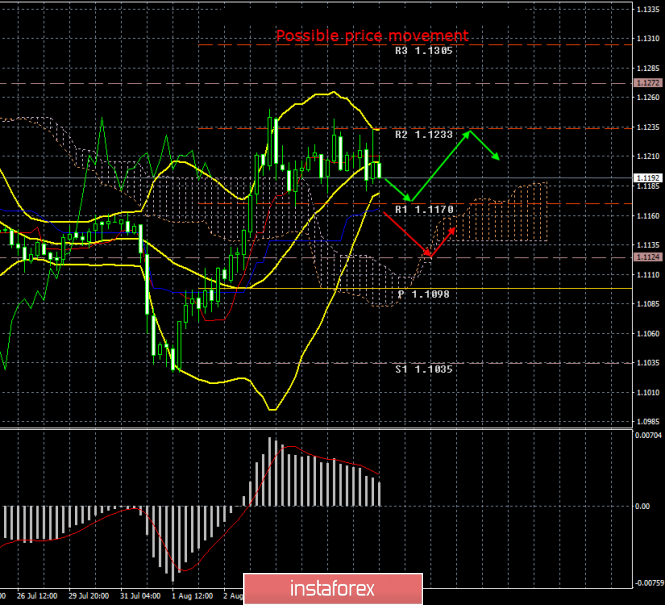
| Posted: 08 Aug 2019 03:49 PM PDT 4-hour timeframe Amplitude of the last 5 days (high-low): 69p - 46p - 110p - 82p - 63p. Average amplitude over the last 5 days: 74p (82p). The EUR/USD currency pair showed no signs of life on Thursday, August 8, trading in a narrow price range for most of the day. No important macroeconomic report has been published to date, and only Donald Trump has struck a fresh chunk of criticism from the Fed through his Twitter account. This time, Trump wrote: "You might think that I admire the power of the dollar. However, it is not! Fed rates are high compared to other countries, which makes the dollar strong. Because of this, it is difficult for our industrial companies such as Caterpillar, Boeing and John Deere, car manufacturers and others to compete in global markets. " "We have the best companies in the world, which cannot be said about the Fed," the US president summed up. Well, nothing new. It seems that pressure on Powell and the Fed will continue until the trade war with China is over, or until the key rate is lowered to levels that suit Trump. As for the trade war, this epic is potentially no less interesting than Brexit. Trump's upper hand, in addition to the introduction of duties on imports from China, are few. By and large, the trump card is not a duty, but the fact that the United States is a huge market for goods manufactured in China. However, Beijing, from our point of view, has much more trump cards. To begin with, it is China that is the largest holder of US government securities. Or remember that more than 200 large American companies produce their goods in China. That is, producing goods in China is much cheaper and easier than in the United States. However, taxes, respectively, are not paid to the US Treasury. Trump wants to return production to the United States, increasing the labor market, taxes to the Treasury, but at the same time shifting all the risks to the companies themselves. It is worthwhile to understand that if, for example, Apple starts producing smartphones in the United States, then the price for them will immediately double twice, at least. Just because labor is much more expensive in America, taxes are higher, there will be a lot of problems with logistics, since most of the suppliers of components for machinery are in China, Korea and Japan. Where is it easier and cheaper to deliver parts? From China, Japan and Korea to China or to America? Well, a rise in prices will entail a drop in income and profits, and, accordingly, in production volumes. Trading recommendations: The EUR/USD currency pair resumed the downward correction, having failed to overcome the level of 1.1233 for the third time. Thus, traders are advised to buy the euro with targets of 1.1272 and 1.1305 only after overcoming the R2 level - 1.1233. In addition to the technical picture, fundamental data and the time of their release should also be considered. Explanation of the illustration: Ichimoku indicator: Tenkan-sen is the red line. Kijun-sen is the blue line. Senkou Span A - light brown dotted line. Senkou Span B - light purple dashed line. Chikou Span - green line. Bollinger Bands Indicator: 3 yellow lines. MACD indicator: Red line and bar graph with white bars in the indicator window. The material has been provided by InstaForex Company - www.instaforex.com |
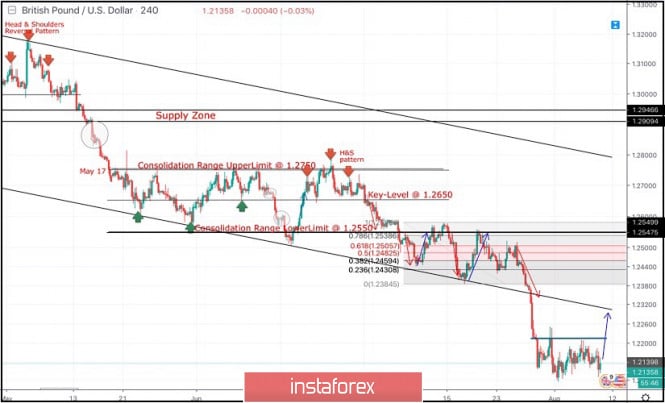
| August 8, 2019 : The GBP/USD Pair remains trapped until Bullish Breakout is achieved above 1.2230. Posted: 08 Aug 2019 09:11 AM PDT
Since May 17, the previous downside movement within the depicted bearish channel came to a pause allowing the recent sideway consolidation range to be established between 1.2750 - 1.2550. On July 5, a bearish range breakout was demonstrated below 1.2550 (the lower limit of the depicted consolidation range). Hence, quick bearish decline was demonstrated towards the price zone of 1.2430-1.2385 (where the lower limit of the movement channel came to meet the GBPUSD pair). On July 18, a recent bullish movement was initiated towards the backside of the broken consolidation range (1.2550) where another valid SELL entry was offered few weeks ago. Moreover, Bearish breakdown below 1.2350 facilitated further bearish decline towards 1.2320, 1.2270 and 1.2125 which correspond to significant key-levels on the Weekly chart. The current price levels are quite risky/low for having new SELL entries. That's why, Previous SELLERS were advised to have their profits gathered. Recently, weak signs of bullish recovery were demonstrated around 1.2100. This may push the GBPUSD to retrace towards 1.2260 then 1.2320 if sufficient bullish momentum is maintained above 1.2230. On the other hand, The price zone of 1.2320 - 1.2350 (backside of the broken channel) stands as a prominent SUPPLY zone to be watched for new SELL positions if the current bullish pullback pursues towards it. Trade Recommendations: Intraday traders are advised to look for early bullish breakout above 1.2230 for a counter-trend BUY entry. Conservative traders should wait for the current bullish pullback to pursue towards 1.2320 - 1.2350 for new valid SELL entries. S/L should be placed above 1.2430. Initial T/P level to be placed around 1.2279 and 1.2130. The material has been provided by InstaForex Company - www.instaforex.com |
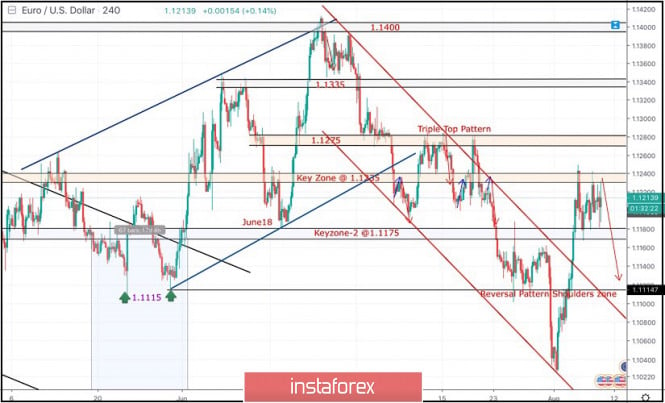
| August 8, 2019 : EUR/USD Pair is demonstrating a Long-term BULLISH Reversal Pattern. Posted: 08 Aug 2019 08:45 AM PDT
Back in June 24, the EURUSD looked overbought around 1.1400 facing a confluence of supply levels. Thus, a bearish movement was initiated towards 1.1275 followed by a deeper bearish decline towards 1.1235 (the lower limit of the previous bullish channel) which failed to provide enough bullish support for the EUR/USD pair. In the period between 8 - 22 July, sideway consolidation-range was established between 1.1200 - 1.1275 until a triple-top reversal pattern was demonstrated around the upper limit. Shortly after, evident bearish momentum (bearish engulfing H4 candlestick) could bring the EURUSD back below 1.1235. Early bearish breakdown below 1.1175 facilitated further bearish decline towards 1.1115 (Previous Weekly Low) where temporary bullish rejection was demonstrated before bearish breakdown could take place on July 31. On July 31, Temporary Bearish breakdown below 1.1115 allowed further bearish decline towards 1.1025 (lower limit of the depicted recent bearish channel) where significant signs of bullish recovery were demonstrated. Risky traders were advised to look for bullish persistence above 1.1050 as a bullish signal for Intraday BUY entry with bullish target projected towards 1.1115, 1.1175 and 1.1235. It's already running in profits. S/L should be advanced to 1.1160 to secure more profits. This Week, the depicted Key-Zone around 1.1235 has been standing as a prominent Supply Area where TWO Bearish Engulfing H4 candlesticks were demonstrated. Yesterday , another bullish visit was demonstrated towards 1.1235 where bearish rejection was anticipated. Thus, the EUR/USD remains trapped between 1.1235-1.1175 until breakout in either directions (probably to the downside). Bearish breakdown below 1.1175 is mandatory to allow further bearish decline towards 1.1125-1.1115 where another intermediate-term bullish position can be offered (The right shoulder of the expected reversal pattern). Trade recommendations : Conservative traders should wait for a deeper bearish movement towards 1.1125-1.1115 for a valid BUY entry. S/L should be placed just below 1.1080 while initial T/P levels should be located around 1.1160 and 1.1200. The material has been provided by InstaForex Company - www.instaforex.com |
| Fractal analysis of the main currency pairs on August 8 Posted: 08 Aug 2019 07:10 AM PDT Hello, dear colleagues. For the Euro/Dollar pair, the price is in the correction zone from the upward cycle of August 1 and the continuation of the upward movement is expected after the breakdown of 1.1234. For the Pound/Dollar pair, the downward trend is expected after the price passes the range of 1.2099 – 1.2069. For the Dollar/Franc pair, the price is in the correction zone from the downward cycle on August 1 and the continuation of the downward movement is expected after the breakdown of 0.9735. For the Dollar/Yen pair, the main trend development is expected after the breakdown of 105.71. For the Euro/Yen pair, the price forms the initial conditions for the top of August 5 and the development of this structure is expected after the breakdown of 119.45 and the level of 118.22 is the key support. For the Pound/Yen pair, the continuation of the development of the downward structure from July 31 is possible after the price passes the range of 128.30 – 127.85. Forecast for August 8: Analytical review of the currency pairs in H1 scale:
For the Euro/Dollar pair, the key levels on the H1 scale are: 1.1284, 1.1259, 1.1234, 1.1162, 1.1145 and 1.1120. The price is in the correction zone from the upward structure on August 1. The resumption of the upward trend is possible after the breakdown of 1.1234. In this case, the goal is 1.1259. We consider the level of 1.1284 as a potential value for the top, upon reaching which, we expect consolidation, as well as a rollback to the bottom. The short-term downward movement is possible in the area of 1.1162 – 1.1145 and the breakdown of the last value will lead to a protracted correction. The goal is 1.1120 and this level is the key support for the top. The main trend is the upward structure from August 1, the stage of correction. Trading recommendations: Buy 1.1234 Take profit: 1.1258 Buy 1.1261 Take profit: 1.1284 Sell: 1.1162 Take profit: 1.1146 Sell: 1.1144 Take profit: 1.1122
For the Pound/Dollar pair, the key levels on the H1 scale are: 1.2254, 1.2192, 1.2158, 1.2099, 1.2069 and 1.2021. We follow the downward cycle of July 19, as well as the local downward structure of July 31. The short-term downward movement is expected in the range of 1.2099 – 1.2069 and the breakdown of the last value will allow us to count on the movement to the potential target – 1.2021, from this level, we expect a correction. The short-term upward movement is possible in the area of 1.2158 – 1.2192 and the breakdown of the last value will lead to the formation of initial conditions for the top. The potential target is 1.2254. The main trend is the downward cycle of July 19, the local structure of July 31. Trading recommendations: Buy: 1.2158 Take profit: 1.2191 Buy: 1.2194 Take profit: 1.2254 Sell: 1.2099 Take profit: 1.2070 Sell: 1.2067 Take profit: 1.2025
For the Dollar/Franc pair, the key levels in the H1 scale are: 0.9854, 0.9816, 0.9797, 0.9737, 0.9706, 0.9673 and 0.9641. The price is in the adjustment zone from the downward structure on August 1. The resumption of the downward movement is expected after the breakdown of 0.9737. In this case, the target is 0.9706 and in the area of 0.9706 – 9637 is the short-term downward movement, as well as consolidation. The potential value for the bottom is the level of 0.9641, upon reaching which we expect consolidation, as well as a rollback to the top. The short-term upward movement is possible in the area of 0.9797 – 0.9816 and the breakdown of the last value will lead to an in-depth correction. The goal is 0.9854 and this level is the key support for the downward structure from August 1. The main trend is the downward structure from August 1, the stage of correction. Trading recommendations: Buy: 0.9797 take profit: 0.9816 Buy: 0.9818 Take profit: 0.9852 Sell: 0.9736 Take profit: 0.9707 Sell: 0.9704 Take profit: 0.9675
For the Dollar/Yen pair, the key levels in the H1 scale are: 107.62, 107.20, 106.72, 105.71, 105.14, 104.44 and 104.00. We follow the downward structure from August 1. We expect the movement to continue to the bottom after the breakdown of 105.71. In this case, the target is 105.14 and near this level is the price consolidation. The breakdown of the level of 105.14 should be accompanied by a pronounced downward movement. The goal is 104.45. We consider the level of 104.00 as a potential value for the bottom, upon reaching which, we expect a correction. Leaving the correction zone is expected after the breakdown of 106.72. The goal is 107.20. The range of 107.20 – 107.62 is the key support for the downward structure. The main trend is the downward structure of August 1. Trading recommendations: Buy: 106.72 Take profit: 107.20 Buy: 107.22 Take profit: 107.62 Sell: 105.69 Take profit: 105.15 Sell: 105.13 Take profit: 104.46
For the Canadian dollar/Dollar pair, the key levels on the H1 scale are: 1.3444, 1.3393, 1.3354, 1.3329, 1.3280, 1.3256, 1.3212 and 1.3175. We continue to monitor the local upward structure from July 31. The short-term upward movement is expected in the range of 1.3329 – 1.3354 and the breakdown of the last value will lead to a movement to the level of 1.3393, upon reaching which we expect consolidation and a possible rollback to the bottom. The potential value for the top is the level of 1.3444. The short-term downward movement is possible in the area of 1.3280 – 1.3256 and the breakdown of the last value will lead to a protracted correction. The goal is 1.3212 and this level is the key support for the top. Its breakdown will allow us to count on the movement to a potential target – 1.3175. The main trend – local upward structure from July 31. Trading recommendations: Buy: 1.3329 Take profit: 1.3354 Buy: 1.3357 Take profit: 1.3392 Sell: 1.3280 Take profit: 1.3256 Sell: 1.3254 Take profit: 1.3214
For the Australian dollar/Dollar pair, the key levels on the H1 scale are: 0.6902, 0.6869, 0.6843, 0.6807, 0.6791, 0.6762, 0.6743, 0.6711 and 0.6675. The price has issued expressed initial conditions for the top of August 7. The continuation of the upward trend development is expected after the price passage of the range of 0.6791 – 0.6807. In this case, the goal is 0.6843 and in the area of 0.6843 – 0.6869 is the short-term upward movement and consolidation. We consider the level of 0.6902 as a potential value for the top, upon reaching which, we expect a rollback to the bottom. The short-term downward movement is possible in the area of 0.6762 – 0.6743 and the breakdown of the last value will lead to an in-depth correction. The goal is 0.6711 and this level is the key support for the upward structure. The main trend is the formation of the initial conditions for the upward cycle of August 7. Trading recommendations: Buy: 0.6807 Take profit: 0.6840 Buy: 0.6845 Take profit: 0.6867 Sell: 0.6762 Take profit: 0.6743 Sell: 0.6740 Take profit: 0.6715
For the Euro/Yen pair, the key levels on the H1 scale are: 120.68, 120.20, 119.85, 119.43, 118.94, 118.64, 118.22 and 117.68. The price forms the expressed initial conditions for the top from August 5. The continuation of the upward movement is expected after the breakdown of 119.43. In this case, the goal is 119.85 and in the area of 119.85 – 120.20 is the consolidation. The breakdown of the level of 120.20 should be accompanied by a pronounced upward movement. The goal is 120.68. We consider the level of 121.35 as a potential value for the top. The short-term upward movement is possible in the area of 118.64 – 118.22 and the breakdown of the last value will have a downward trend. The first target is 117.68. The main trend – the initial conditions for the top of August 5. Trading recommendations: Buy: 119.45 Take profit: 119.85 Buy: 120.20 Take profit: 120.68 Sell: 118.62 Take profit: 118.24 Sell: 118.20 Take profit: 117.72
For the Pound/Yen pair, the key levels on the H1 scale are: 130.86, 130.23, 129.80, 128.98, 128.30 and 127.85. We follow the local downward structure from July 31. The continuation of the downward movement is expected after the passage of the price of the range of 128.30 – 127.85. In this case, the goal is 126.97. We consider the level of 126.19 as a potential value for the bottom, upon reaching which, we expect a rollback to the top. The range of 129.80 – 130.23 is the key support. Its breakdown will allow counting on the movement to the level of 130.86, which is the key resistance for the subsequent development of the upward trend. The main trend is the local downward structure of July 31. Trading recommendations: Buy: Take profit: Buy: 130.26 Take profit: 130.84 Sell: 127.85 Take profit: 127.00 Sell: 126.95 Take profit: 126.20 The material has been provided by InstaForex Company - www.instaforex.com |
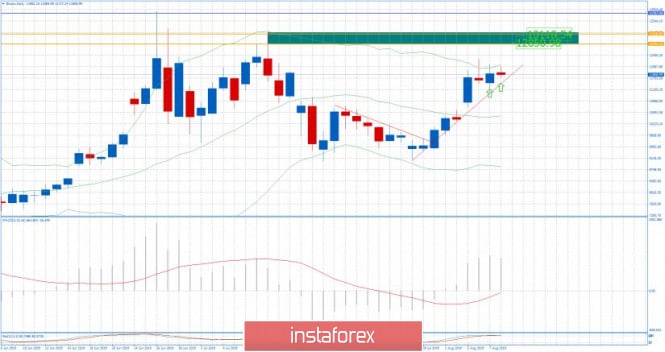
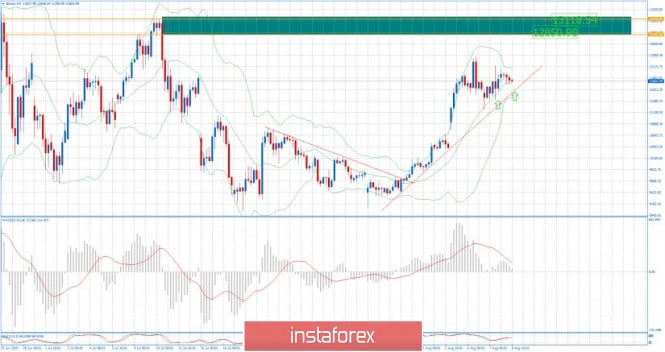
| BTC 08.08.2019 - Sideywas movement with potential new wave up Posted: 08 Aug 2019 06:30 AM PDT Industry news: For the first time ever, Bitcoin's hash rate has topped 80 Exahashes per second. According to Bitinfocharts.com network hash rate hit 80.249 EH/s yesterday. The latest milestone has not gone unnoticed on crypto twitter. In simple terms the hash rate is the speed at which computers on the Bitcoin network operate. The higher the number, the better it is for miners, as the chances of completing the mathematical problem to solve the block and collect the resultant block reward is increased. These measurement records the number of hashes per second Bitcoin miners are performing on the network. Daily view:
Based on the daily time-frame, I found that today BTCis trading sideways between the price of $12.311 and $11.172. Anyway, the underlying trend is bullish and I would watch only for long positions. MACD oscillator is showing the new momentum up, which is good sign for further upside continuation. Important levels to watch based on daily view: Resistance levels: $12.300 $12.850 $13.118 Support levels: $11.172 $11.000 4H time-frame view:
Based on the 4H time-frame, I found that BTC is trading in alignment with the upward trendline, which is good sign for further upside continuation. Additionally, there is the Bull cross on the MACD oscillator, which is another sign of the strength on BTC. Watch for buying opportunities with the upward targets at $12.850 and $13.00. The material has been provided by InstaForex Company - www.instaforex.com |
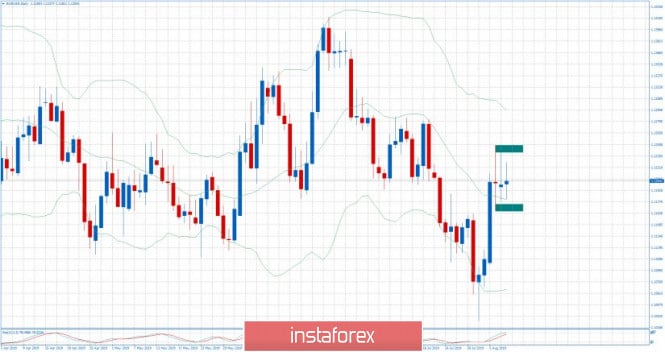
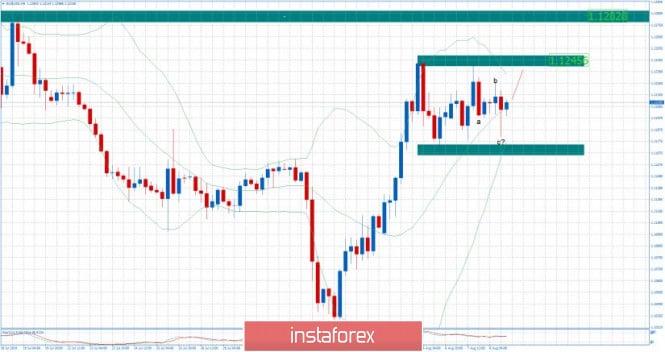
| EUR/USD for August 08,2019 - ABC down completed, upward movement is expexted Posted: 08 Aug 2019 06:11 AM PDT Daily view:
Based on the daily time-frame, I found that today EUR is trading in defined trading range between the price of 1.1245 and 1.1165, which is normal after the trend day like we had few days ago. Anyway, the underlying trend is bullish and I would watch only for long positions. Daily candle did successful rejection of 20EMA and I expect more upside Important levels to watch based on daily view: Resistance levels: 1.1245 1.1282 Support levels: 1.1167 1.1163 4H time-frame view:
Based on the 4H time-frame, I found end of the downward correction abc in the background, which his good sign for further upside continuation. Watch for buying opportunities with the targets at 1.1245 and 1.1282. The material has been provided by InstaForex Company - www.instaforex.com |
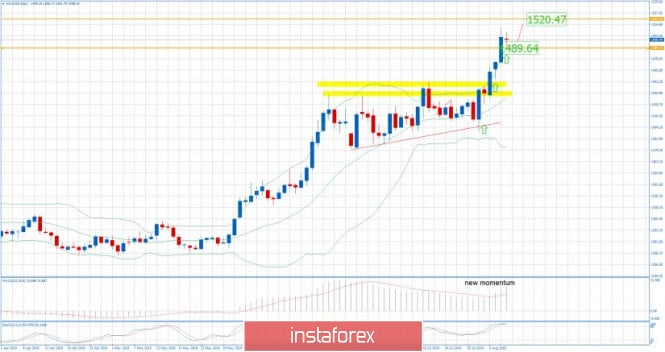
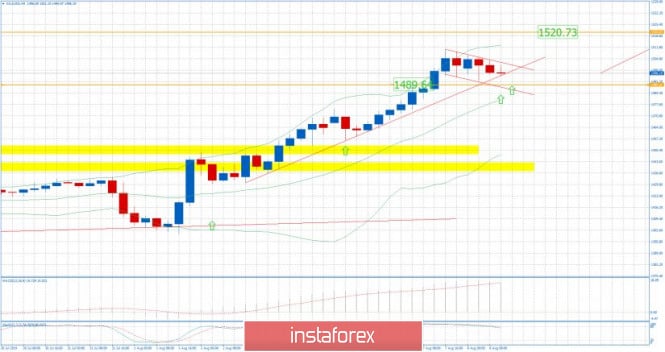
| Gold 08.08.2019 - Consolidation before the new wave up Posted: 08 Aug 2019 05:38 AM PDT Daily view:
Based on the daily time-frame, I found that today GC is so far trading sideways at the price of $1.497, which is normal after the trend day like yesterday. Anyway, the underlying trend is bullish and I would watch only for long positions. Daily candles are closing above the upper Bollinger band, which is another confirmation of the big up trend. Important levels to watch based on daily view: Resistance levels: $1.500.00 $1.520.00 Support levels: $1.472.00 $1.454.00 4H time-frame view:
Based on the 4H time-frame, I found new momentum up on the MACD oscillator, which is sign of the underlying bullish pressure. I also found consistency in the price action towards the level of $15.200. My advice is to watch only for buying positions on the dips due to very strong upward momentum. The material has been provided by InstaForex Company - www.instaforex.com |
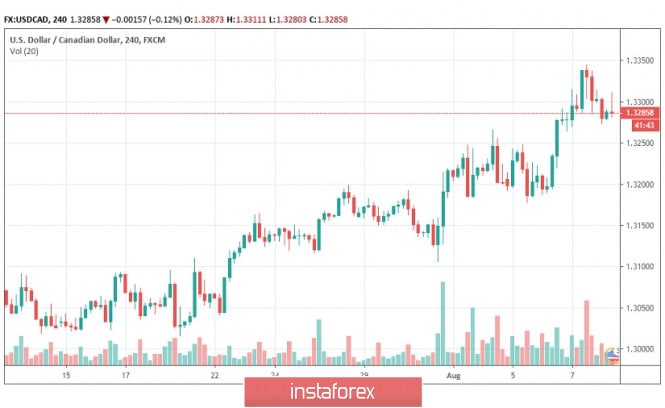
| Labour market data set to boost Canadian dollar Posted: 08 Aug 2019 05:24 AM PDT USD/CAD pushed to 8-week highs near 1.3350 on Wednesday before a retreat to just below 1.3300. The Canadian labour-market data is due on Friday with consensus expectations for an employment gain of around 12,000 for July following a 2,000 drop in the previous month, while the unemployment rate is expected to remain at 5.5%. Housing starts data is also expected to show a sharp decline in June, while building permits have a consensus forecast for a marginal recovery after a 13.0% sharp decline in the previous month. Weak data is priced in with the potential for out-performance. There is also scope for upside surprises in the labour-market with overall sentiment holding firm. Global risk conditions will inevitably remain important given a sustained increase in volatility across asset classes. Fears over the global trade and growth outlook will be a negative factor for the Canadian dollar, while an easing of risks would be a positive one. Canadian dollar moves will tend to be amplified by shifts in energy prices given that the Canadian currency remains positively correlated with oil. The pair will remain volatile especially given underlying US-China tensions and the threat that President Trump will reinforce his anti-China rhetoric. However, there are might be some efforts to ease tensions into the weekend with China looking to hold the yuan steady. Any anti-dollar rhetoric would also support the Canadian dollar. Overall, there is scope for a tentative improvement in risk appetite with buying of risk assets on dips.
|
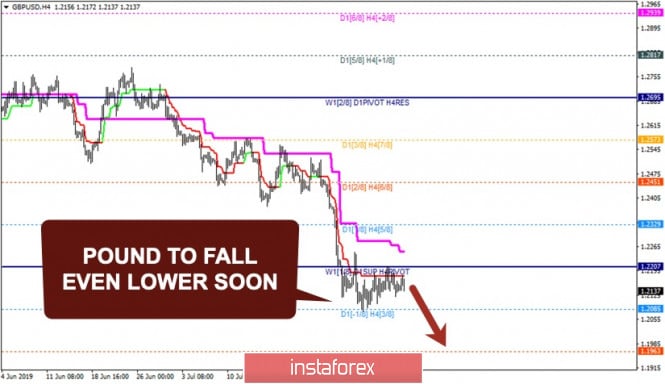
| Bears to push GBP/USD even lower Posted: 08 Aug 2019 05:22 AM PDT
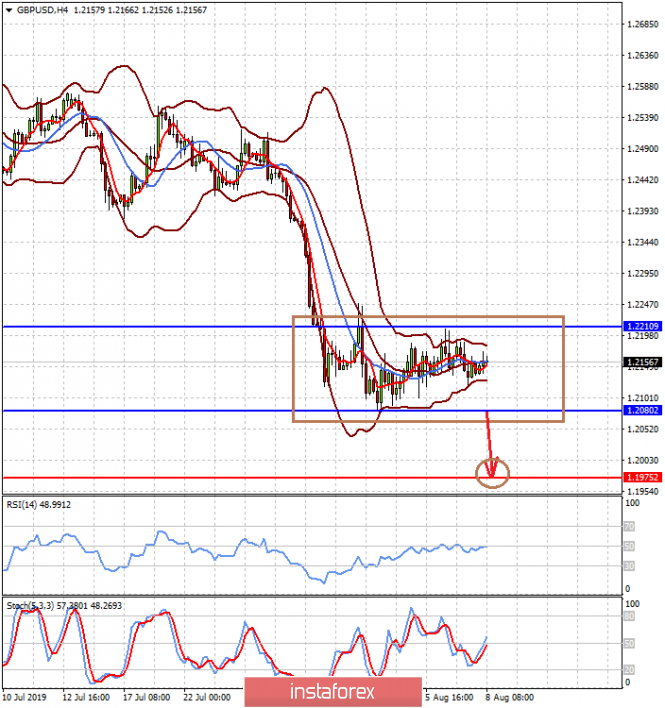
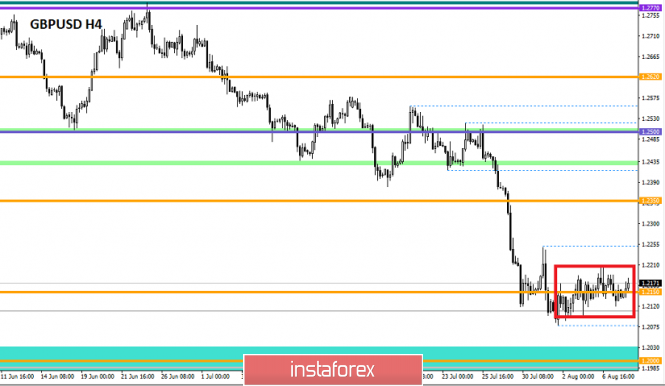
The pair has been consolidating since a pullback from 3/8 MM Level happened. Previously, GBP/USD hasn't fixed above 8/8 MM Level which led to the current decline. Also, the Super Trend Liens have formed a 'Bearish Cross' which confirmed the outlook. Currently, the 4/8 MM Level is acting as strong resistance. The pair has fixed below the four-hour Super Trend Line, that's why the bearish outlook is the main one. Thus, we're likely to have another decline in the direction of the 2/8 MM Level in the coming hours, possibly even today. If the price breaks the 4/8 MM Level, there'll be an open door for a test of the Daily Super Trend Line which could act as resistance. If this happens, we should wait for the price to return under the 4/8 MM Level to confirm this scenario. Meanwhile, if the market breaks the Daily ST-Line, the bearish outlook will be at risk. In other words, if the Daily ST-line turns out to be broken, there'll be an option to have a longer upward correction. The bottom line is that GBP/USD remains bearish and there's no sign in favour of a possible reverse. Thus, we should watch the 2/8 MM Level as a potential intraday target. If the price goes through this level, we should watch lower levels as the next target. The material has been provided by InstaForex Company - www.instaforex.com |
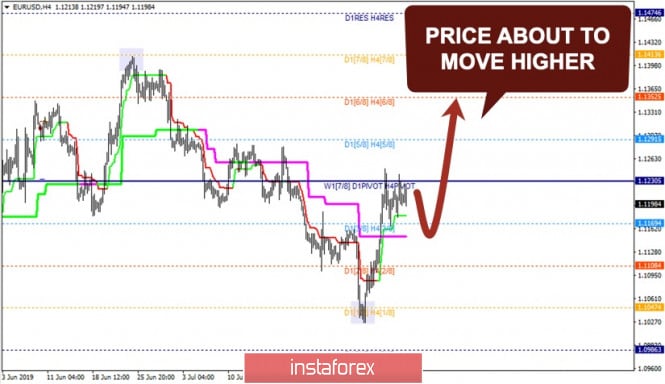
| Posted: 08 Aug 2019 04:50 AM PDT
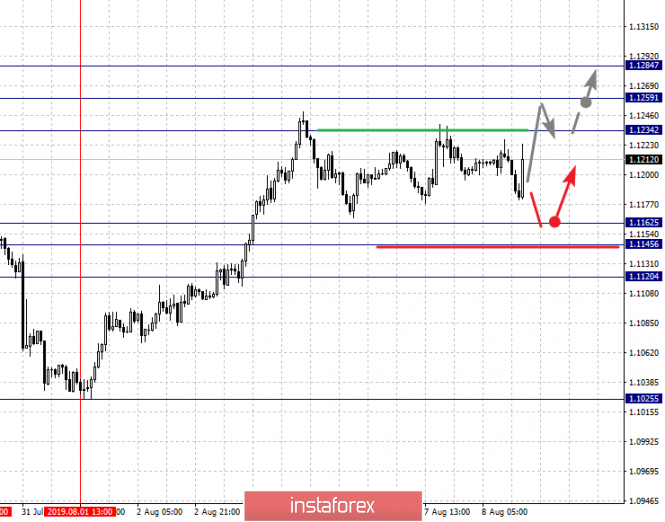
The pair has been consolidating since a pullback from 4/8 Murrey Math Level happened. Previously, 1/8 MM Level has acted as support pushing the price higher. Super Trend Lines have formed a 'Bullish Cross' little later on. It may bring more evidence for the outlook. Thus, a reverse has likely to take place, that's why we're about to have the price even higher in the short term. However, the current local downward correction might be continued before the pait hit new highs. In this case, we should monitor the 3/8 MM Level and Daily Super Trend Line as a potential target for the ongoing correction. The subsequent pullback from these levels could be a starting point for another bullish rally. Firstly, the price should fixate above 4/8 MM Level just to confirm that bulls are coming back into the market. If this happens, there'll be a green light to have an advance in the direction of 6/8 MM Level. If this level turns out to be broken, all eyes will be at 7/8 MM Level as the next target. The bottom line is that EUR/USD is getting bullish. The current sideways price movement is likely a local correction before we have the pair higher. It's essential to see the market above 4/8 MM Level as confirmation for this scenario. Additionally, if the pair breaks Super Trend Lines, the bullish outlook will be under pressure. The material has been provided by InstaForex Company - www.instaforex.com |
| Posted: 08 Aug 2019 03:49 AM PDT The foreign exchange market froze after China took a protective measure against US attacks on its economy at the beginning of the week – significantly lowered the rate of the national currency to the levels of a decade ago. This event, in our view, is a serious signal indicating that trade relations between Washington and Beijing, burdened by the political pressure of the former, are unlikely to be resolved in the near foreseeable future. We believe that the Chinese response was directed specifically at President D. Trump to prevent him from winning the presidential election that had already begun. Everything indicates that Beijing, as they say, does not want to quarrel with the States, which are the most serious trading partner. He was quite satisfied with the relationship that had developed over the years, which allowed the country not only to accumulate financial and intellectual resources but also to develop actively, which ultimately led to the second place in the world economy after the United States. But with the arrival of the forty-fifth President, the situation changed radically, which became the basis for the trade conflict. It seems that the Chinese will try to sit out, watching the presidential race in the States, trying to maximize the damage to Trump. But there is another risk for them. This, we believe, is a high probability of an agreement by the end of this year or early next year, because the President will need a positive external background to win the presidential race, which will be a large-scale new trade agreement with China. But so far, most likely, we should expect an increase in tension and an increase in rates on both sides in this difficult game. But back to the situation on the foreign exchange market. In our view, the American economy is a few steps away from the onset of the recession. Markets understand this, which is manifested in a virtually vertical drop in the yields of US Treasury government bonds. Thus, the yield of the benchmark of 10-year treasuries reached the values of September 2016 and at the moment, it has been steadily keeping below the psychological level of 2.0% for several days now. It should also be noted that our earlier view that the escalation of the US-China crisis will force the Fed to resume lowering interest rates seems to find support. In just the last few days, investors estimate the next decline in interest rates at the September meeting of the Federal Reserve, according to the dynamics of futures on federal funds rates, at 78.8%. The continued tension will likely force the US Central Bank to go for it only once, and possibly three more rate cuts before the end of this year. In this situation, of course, the dollar will be under strong pressure, not only for gold and safe-haven currencies but even with the euro, which over the past 10 years has been perceived as the antithesis of the US currency. Forecast of the day: The EURUSD pair is consolidating above the level of 1.1185. It may remain in the range of 1.1185-1.1280 until the end of this week in anticipation of the latest economic data from the United States. But if it falls below 1.1185, it may fall to the level of 1.1110. The GBPUSD pair is also consolidating in the range of 1.2080-1.2210. If tomorrow's UK GDP data is weaker than forecast, the pair could fall to 1.1975.
|
| Technical analysis of GBP/USD for August 08, 2019 Posted: 08 Aug 2019 03:20 AM PDT Overview:
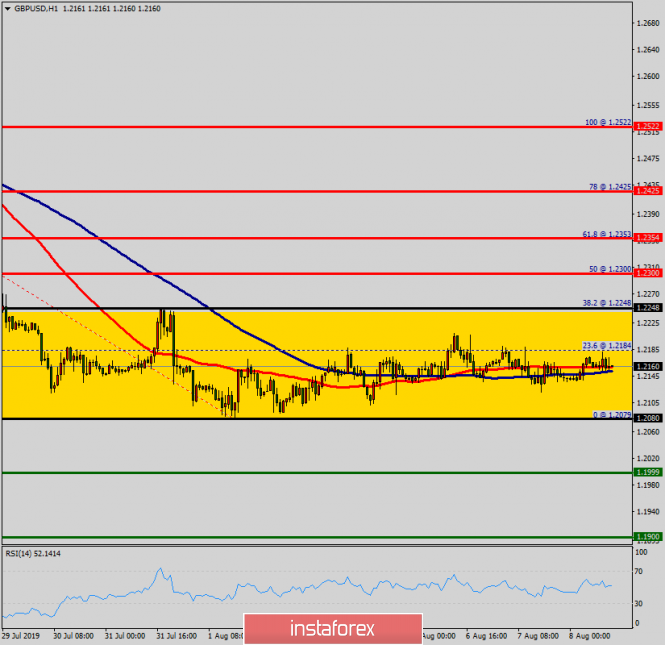
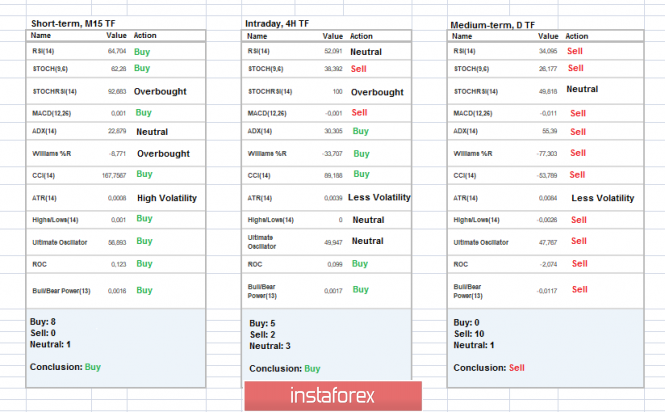
The trend of GBP/USD pair movement was controversial as it took place in a narrow sideways channel, the market showed signs of instability. Amid the previous events, the price is still moving between the levels of 1.2248 and 1.2080. So, the daily resistance and support are seen at the levels of 1.2248 and 1.2080 respectively. Therefore, it is recommended to be cautious while placing orders in this area. So, we need to wait until the sideways channel has completed. On the H1 chart, the market seemed sideways for that the trend had hit only the resistance 1 last week and the range was tiny around 168 pips (1.2248 - 1.2080). Moreover, it should be noted that if moving averages cross over one another, then we expect sideways trend. But if moving averages cross over one another, the trend is probably changing soon. Finaly, if the pair fails to pass through the level of 1.2248, the market will indicate a bearish opportunity below the strong resistance level of 1.2248. Sell deals are recommended below the level of 1.2248 with the first target at 0.6600. If the trend breaks the support level of 1.2080 in rder to test the double bottom. The market is still ranging, hence we still prefer thesideways trend scenario. Consequently, it is of the wisdom to trade only between these levels of 1.2248 and 1.2080 this week.
|
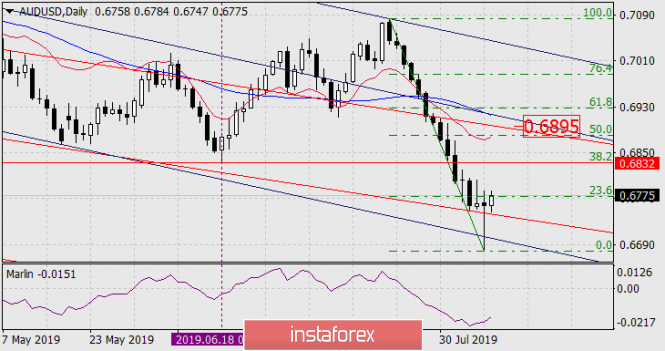
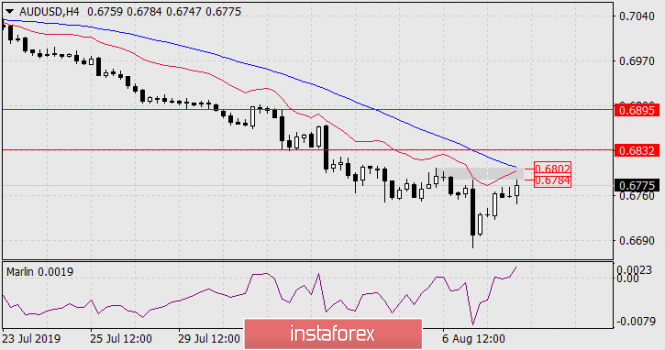
| AUD / USD Forecast August 8, 2019 Posted: 08 Aug 2019 02:11 AM PDT AUD / USD After yesterday's rate cut by the Reserve Bank of New Zealand immediately by 0.50% - from 1.50% to 1.00%, along with the "New Zealander", the Australian dollar went down as well. Its movement directed to more than 80 points in the morning, but the trading day was closed by the "Australian" 2 points below. As a result, the price only pierced two support of two price channels at once - red and blue, and today, in the Asian session, it fluctuates in the range of Monday-Tuesday. On the daily chart, the signal line of the Marlin oscillator is turning up from the oversold zone, which after an unsuccessful break down can be a sign of a beginning correction. However, the big question is the depth of a possible correction. First of all, we note that a correction of 23.6% of the 14-day decline has already taken place. The desire of the market to increase it gives us a guideline of 38.2% Fibonacci level at the price of 0.6832, which exactly corresponds to the low of June 18th. Consolidating above the level will allow the price to rise to the area of 50.0% Fibonacci, where the lines of price channels and indicator lines of resistance accumulate, and for the price, it seems that it will be insurmountable resistance. On a four-hour chart, the price is below the lines of balance (indicator red) and MACD (indicator blue), the Marlin oscillator in the territory of the growing trend. Here, the resistance is in the range 0.6784-0.6802, in which the MACD line hurries to infiltrate. Whether the price can overcome this near and strong resistance is unclear. Thus, we should continue to wait for the development of events. The material has been provided by InstaForex Company - www.instaforex.com |
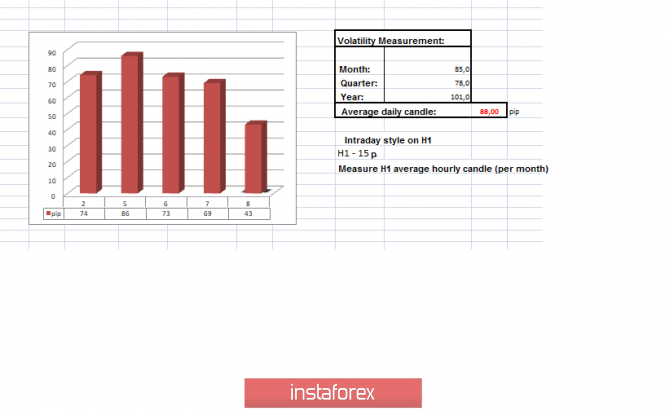
| Trading recommendations for the GBPUSD currency pair - placement of trade orders (August 8) Posted: 08 Aug 2019 01:46 AM PDT Over the past trading day, the pound / dollar currency pair showed a low volatility of 69 points. As a result, the quotation invariably continued to accumulate. From the point of view of technical analysis, we see an amazing picture: from the beginning of the month, the quotation drove itself into exactly horizontal movement along the mirror level of 1.2150, as a result, having the borders of 1.2100-1.2200 (+/- 20p). As discussed in a previous review, traders fatally hold short positions, albeit partially fixing them earlier. The ambiguity and external background inspire fear among market participants. However, such accumulations will bear fruit in any case, even if the movement is not downward. Considering the trading chart in general terms (daily timeframe), we see that the "Correction" tact has not yet arrived on the market and the "Impulse" phase is still being kept in a global downward trend. The information and news background of the past day contained only the housing price index from Halifax in Britain, where we saw a decrease from 5.7% to 4.1%. The most interesting event is the spontaneous criticism of US President Donald Trump against the Fed, where by tradition he put his thoughts on Twitter. The head of the American state once again rode the Fed's working methods, calling them too proud to admit their mistakes. Trump again called on the Fed to lower its base interest rate and stop its ridiculous quantitative tightening right now. This kind of rhetoric from the side of the head of state scares only the crowd, not the Fed, which spilled over into the local strait of the American currency, and even not for all currency pairs. The pound, in turn, continues to be an adherent of the Brexit faith, thereby ignoring the rest of the background. In the vastness of the UK & EU divorce proceedings, everything is calm and moderate. Everyone is discussing rumors that Boris Johnson is ready to go to the end and that Britain will leave the EU on October 31, even if Johnson gets a vote of no confidence. All the rumors, statements and noise, paired with the horizontal movement of the chart, make us understand that the market is waiting for something worthwhile in terms of information background, or rather an explanation of everything that happens in the actions of all people. Today, in terms of the economic calendar, we have an amazing day, since nothing worthwhile is published at all. If you suck it out of your finger, then we only have applications for unemployment benefits in the United States, where, in principle, there are no changes. Initial bids remain at 215K, and repeated orders are reduced by 9K. Thus, hope remains only on the information background, and then, in particular, according to Brexit. Further development Analyzing the current trading chart, we see the preservation of amplitude fluctuations within the boundaries of 1.2100-1.2200 (+/- 20p), where at the current time the quote is moving towards the upper frame. Traders, in turn, are a little nervous about the prolonged stagnation, which provokes them to temporarily exit the market and considering the method of stretching trading orders relative to existing borders. It is likely to assume that the fluctuation within the values of 1.2100-1.2200 (+/- 20p) will continue for some time until the circumstances become clear. It should not be forgotten that from the point of view of technical analysis of this kind of accumulation is a harbinger of a strong jump at the moment of breaking the boundaries of the cluster. Thus, the method of waiting and analysis of price fixation points relative to existing borders looks like a worthy strategy. Based on the available information, it is possible to expand a number of variations, let's specify them: Positions to buy are considered in case of fixing a price higher than 1.2220, but do not forget that a puncture of this value is not enough. It is the move paired with the information background in the form of pressure. A similar technique is applied to sales positions, where we monitor the value of 1.2100. Indicator analysis Analyzing a different sector of timeframes (TF), we see that indicators in the short and intraday perspective are prone to upward movement, but due to the fact that the current fluctuation carries sideways movement, indicators can be changeable. On the other hand, the medium-term outlook invariably signals a downward trend for all indicators. Volatility per week / Measurement of volatility: Month; Quarter; Year Measurement of volatility reflects the average daily fluctuation, calculated for the Month / Quarter / Year. (August 8 was built taking into account the time of publication of the article) The current time volatility is 43 points. Volatility will be fixated on the amplitude fluctuation of the price if its formation is maintained. In the event of a breakdown in accumulation, volatility will quickly exceed the daily average. Key levels Resistance zones: 1.2150 **; 1.2350 **; 1.2430; 1.2500; 1.2620; 1.2770 **; 1.2880 (1.2865-1.2880) *; 1.2920 * 1.3000 **; 1.3180 *; 1.3300 Support areas: 1.2150 **; 1,2000; 1.1700; 1.1475 ** * Periodic level ** Range Level *** The article is built on the principle of conducting a transaction, with daily adjustment The material has been provided by InstaForex Company - www.instaforex.com |


| You are subscribed to email updates from Forex analysis review. To stop receiving these emails, you may unsubscribe now. | Email delivery powered by Google |
| Google, 1600 Amphitheatre Parkway, Mountain View, CA 94043, United States | |
No comments:
Post a Comment