
Forex analysis review |
- Forecast for AUD / USD pair on September 11, 2019
- Forecast for EUR/USD on September 11, 2019
- Forecast for GBP/USD on September 11, 2019
- Fractal analysis of the main currency pairs for September 11
- GBP/USD. September 10. Results of the day. Unemployment in the UK declined, wages rose
- EUR/USD. September 10. Results of the day. Where will the euro go after the European Central Bank meeting?
- AUD/USD paused, awaits news after a five-day rally
- GBP/USD: "White line" for the pound: key indicators are growing, negotiations continue
- Yen in positive territory: growth continues
- EURUSD and GBPUSD: UK will not use negative interest rates. ECB unlikely to launch asset buyback program at this meeting
- Oil returns to the past
- September 10, 2019 : GBP/USD Intraday technical analysis and trade recommendations.
- September 10, 2019 : EUR/USD Intraday technical analysis and trade recommendations.
- EUR/USD for September 10,2019 - Potential test of the upper diagonal
- Gold 09.10.2019 - Gold is testing key support zone, potential rally incoming
- BTC 09.10.2019 -Sellers in control, downward target set at $9,350
- EURUSD is very close to providing a new bullish signal.
- Gold could be forming a daily bullish reversal candle
- What to expect from Bitcoin, autumn growth or preparing for the harsh winter (September 10)
- GBP/USD: plan for the American session on September 10. Mark Carney's speech and the decline in the unemployment rate in
- EUR/USD: plan for the American session on September 10. The euro remained in the narrow side channel, as the bulls failed
- Technical analysis of EUR/USD for September 10, 2019
- Trading recommendations for EURUSD currency pair – placement of trade orders (September 10)
- Unexpected rise in inflation in China supported demand for Litecoin (We expect continued consolidation of the Bitcoin/USD
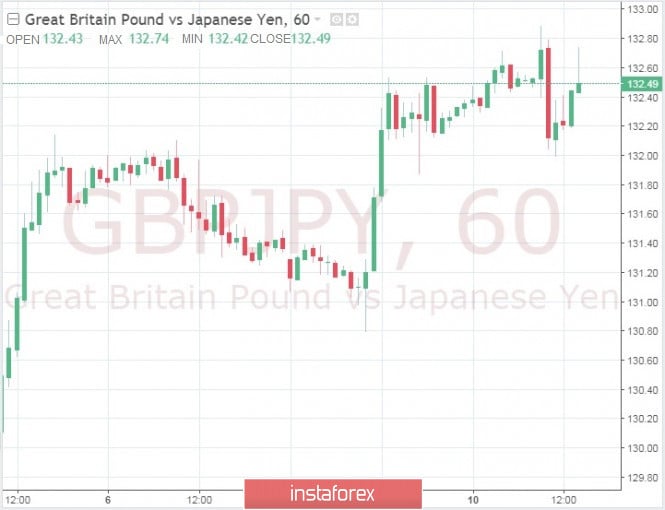
- British pound shows strength against the Japanese yen
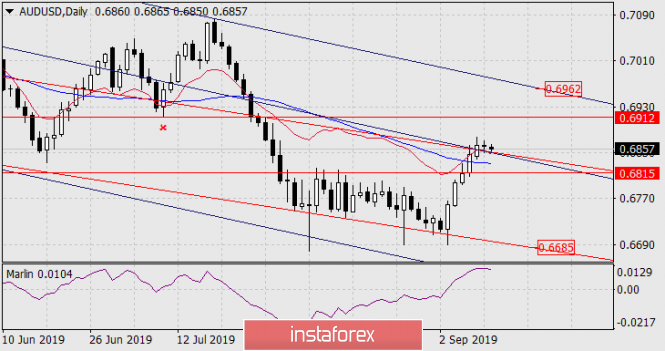
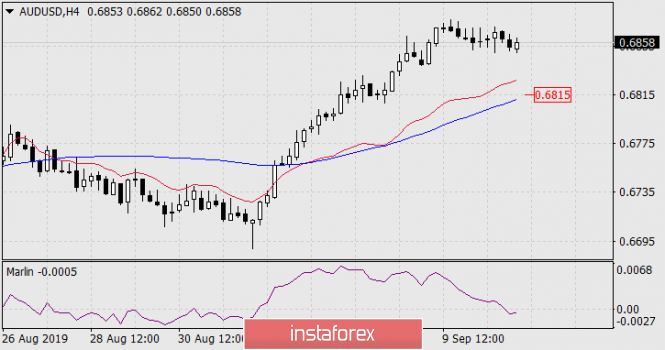
| Forecast for AUD / USD pair on September 11, 2019 Posted: 10 Sep 2019 08:28 PM PDT AUD / USD pair In the last two days, the Australian dollar has fixed above both lines of the price channels (red and blue) for the weekly and monthly scales. The price is also higher than the balance lines and MACD daily chart. The nearest target is open to July 10 minimum at 0.691. Subsequent consolidation above a new level opens the second target of 0.6962, which is the upper border of the blue (weekly) price channel. For the development of a falling scenario, the price should fall below the support of the MACD line on the four-hour chart at 0.6815. Under this condition, the downward target below opens to 0.6685, which is the embedded line of the red (monthly) price channel. |
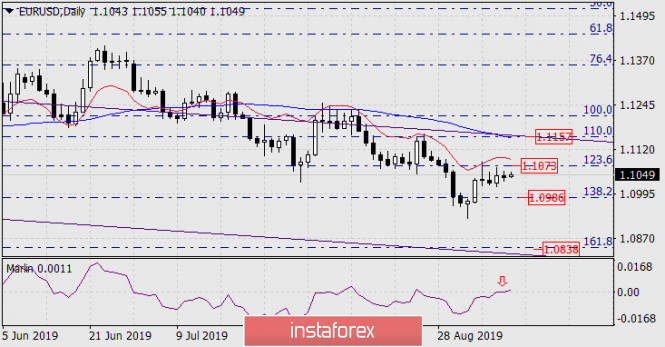
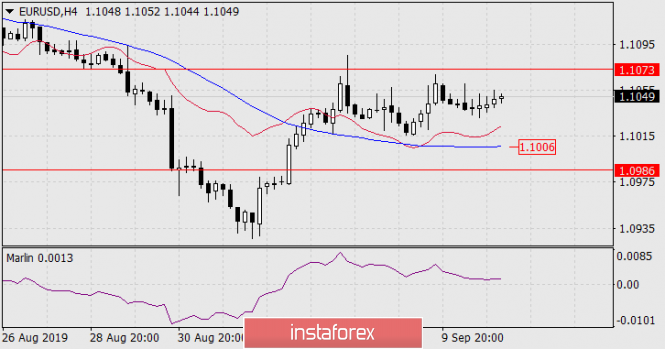
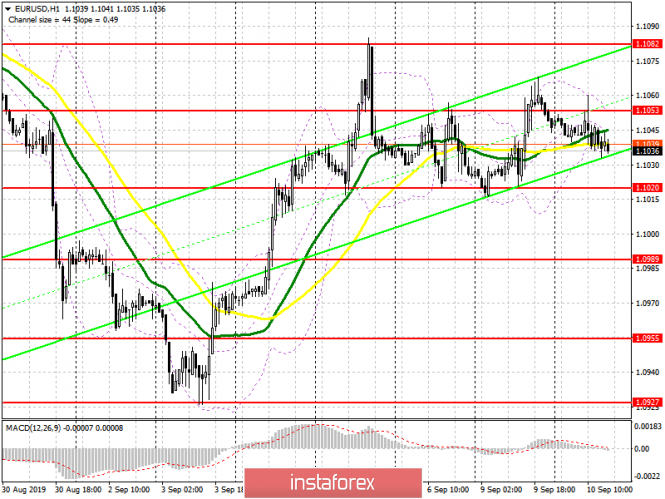
| Forecast for EUR/USD on September 11, 2019 Posted: 10 Sep 2019 08:23 PM PDT EUR/USD Markets already have ideas about tomorrow, when the ECB is expected to announce new measures to ease monetary policy. As usual, exaggerated expectations include lowering the rate, compensating banks for the negative impact of negative rates, launching an asset purchase program on the regulator's balance sheet ... Of course, all measures, even if they were discussed in the working order, cannot be introduced immediately. Up to the point that nothing can be changed at all but only announce imminent changes tomorrow. The reaction of the euro can be completely unpredictable here. From rise to fall. As an effect of deceived expectations and as a work ahead of schedule. From the technical side, the euro remains unchanged from yesterday, the control levels are not broken, and this facilitates the practical task; if the price consolidates above the upper level of 1.1073 - the Fibonacci level of 123.6%, the price will go to the magnetic point of 1.1157 formed by the coincidence of the Fibonacci level of 110.0%, the price channel line and the MACD line on the daily chart. Such a development of the situation is partly indicated by the Marlin oscillator of the daily TF - its signal line has not yet reversed from the boundary with the growth territory. The price drop below the Fibonacci level of 138.2% (1.0986) opens the way to a fall in the area of the Fibonacci level of 161.8% and the lower line of the price channel, to the area of 1.0838. On the four-hour chart, the price also remains in a neutral situation, but here the Marlin oscillator came even closer to the trend change line. The material has been provided by InstaForex Company - www.instaforex.com |
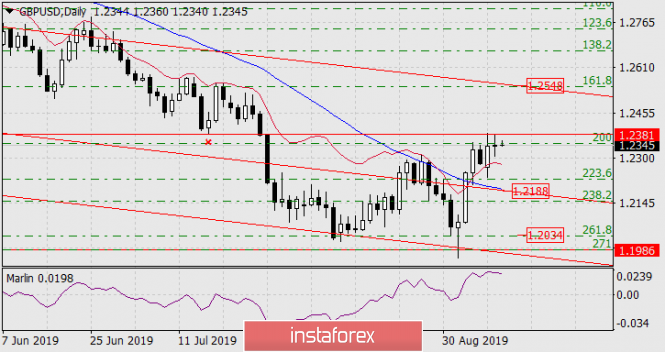
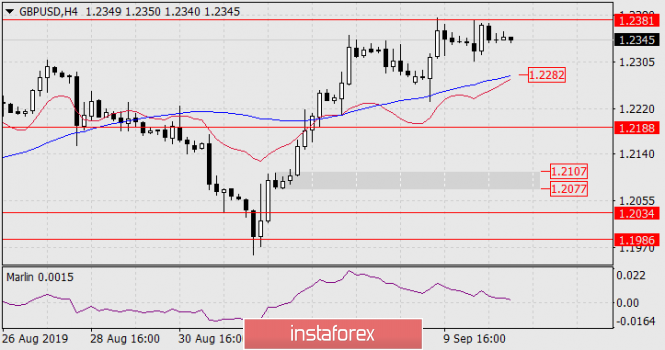
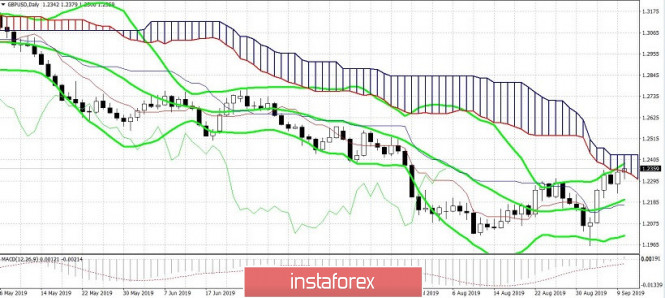
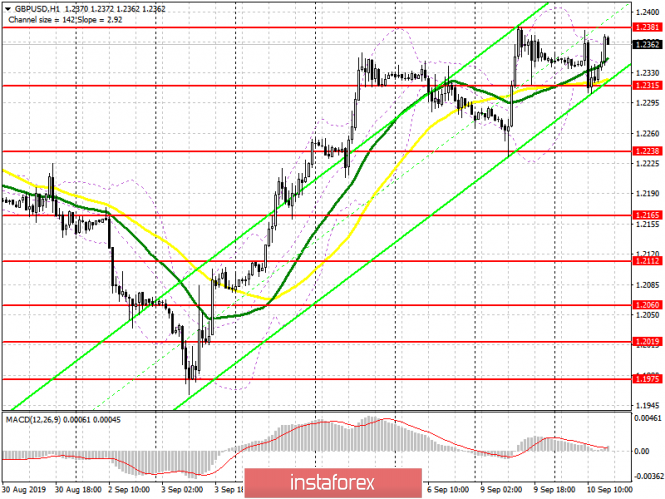
| Forecast for GBP/USD on September 11, 2019 Posted: 10 Sep 2019 08:03 PM PDT GBP/USD Yesterday, the British pound again touched the control level of 1.2381 with declining technical indicators, primarily ahead of the Marlin oscillator. On the one hand, this could be a sign of a price reversal downward, the movement to support the price channel line and the MACD line on the daily chart, to the level of 1.2188, on the other hand, the price exit above 1.2381 opens the way for further growth with the target at 1.2548 - Fibonacci level of 161.8%, and then the decline of Marlin automatically becomes a mere discharge of the indicator in front of a new wave of growth. However, the declining scenario remains basic. The pound's first task in implementing this scenario will be to consolidate the price below the MACD line on the four-hour chart (1.2282), after which it is possible to achieve important support of the daily scale 1.2188. Leaving the price below opens the subsequent target at 1.2077-1.2107. |
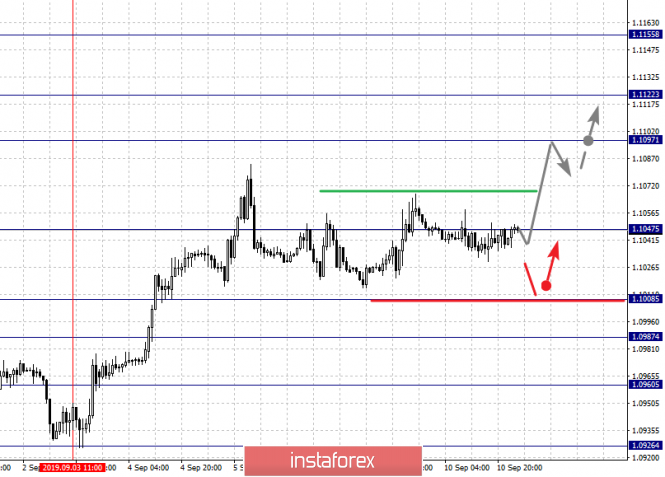
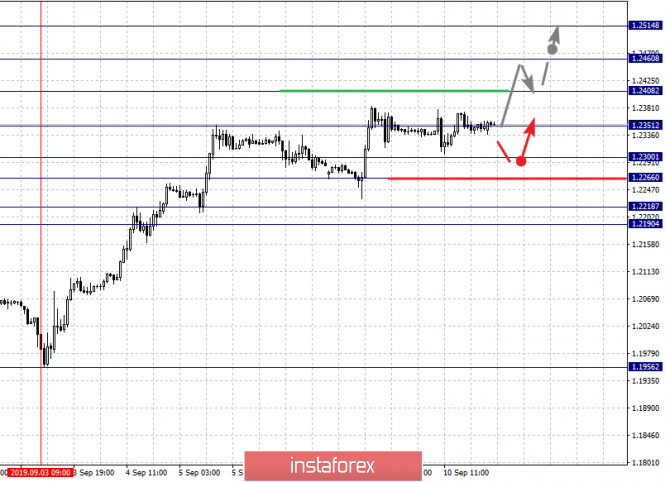
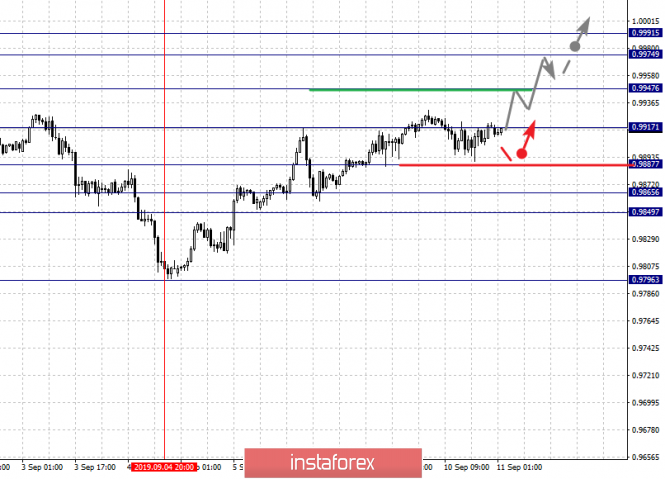
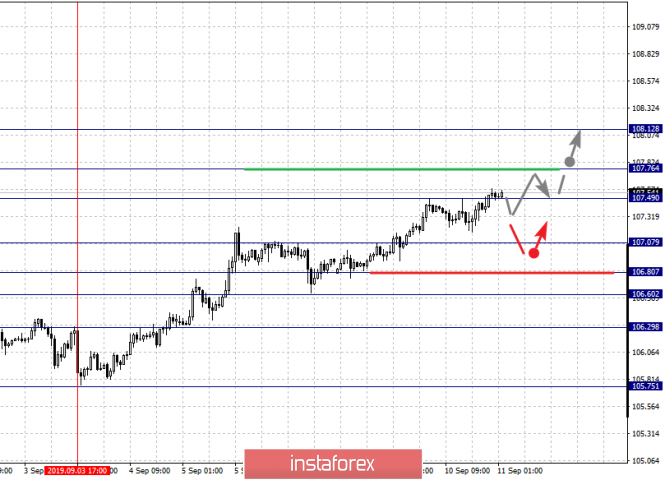
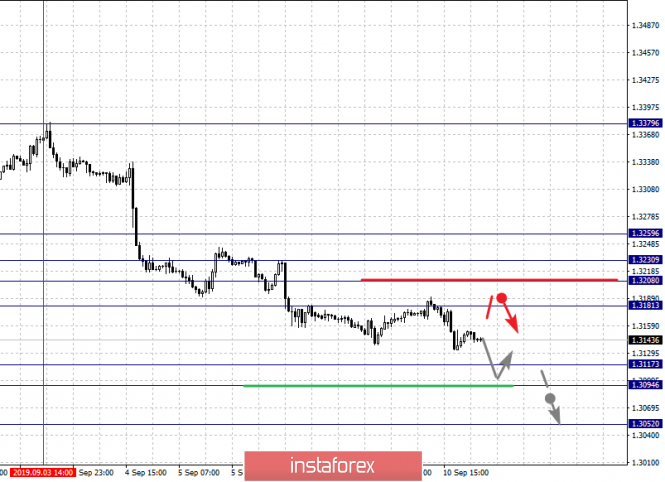
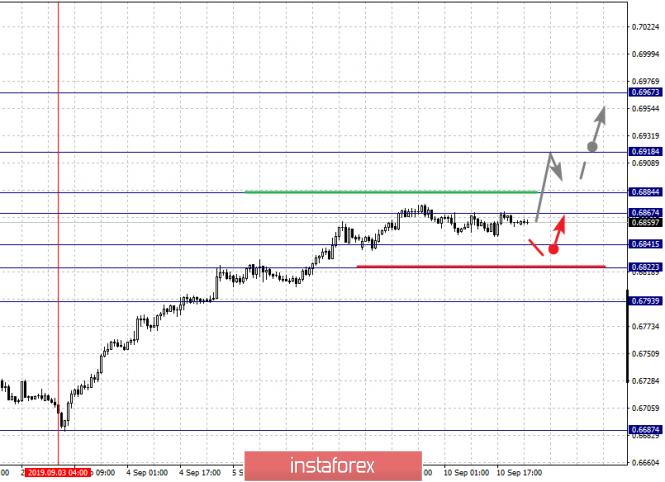
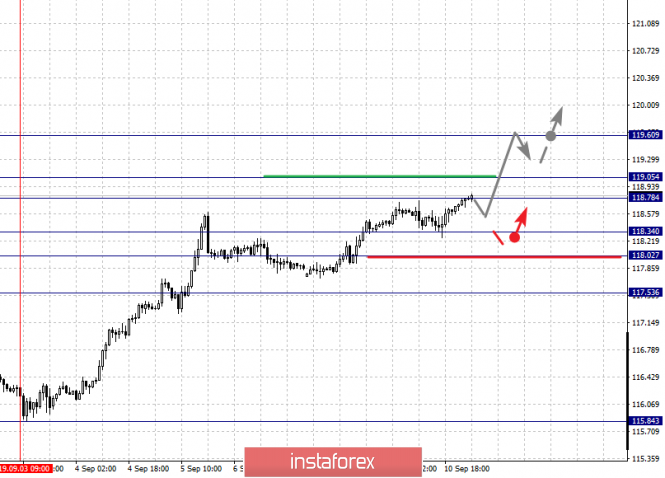
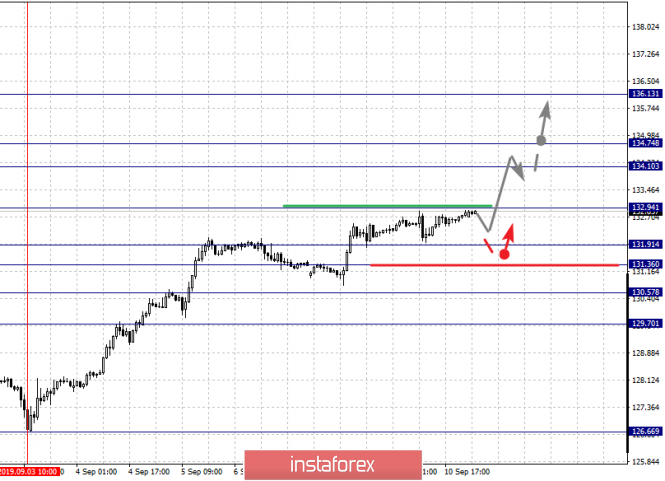
| Fractal analysis of the main currency pairs for September 11 Posted: 10 Sep 2019 05:14 PM PDT Forecast for September 11: Analytical review of currency pairs on the scale of H1: For the euro / dollar pair, the key levels on the H1 scale are: 1.1155, 1.1122, 1.1097, 1.1047, 1.1008, 1.0987, 1.0960 and 1.0926. Here, we continue to monitor the development of the ascending structure of September 3. The continuation of the movement to the top is expected after the breakdown of the level of 1.1047. In this case, the target is 1.1097. Short-term upward movement, as well as consolidation is in the range of 1.1097 - 1.1122. We consider the level of 1.1155 to be a potential value for the upward trend. Upon reaching which, we expect consolidation, as well as a pullback to the bottom. Short-term downward movement is expected in the range of 1.1008 - 1.0987. The breakdown of the last value will lead to an in-depth correction. Here, the target is 1.0960. This level is a key support for the upward structure. Its passage at the price will lead to the formation of a local downward structure. In this case, the first goal is 1.0926. The main trend is the upward structure of September 3. Trading recommendations: Buy: 1.1050 Take profit: 1.1095 Buy 1.1098 Take profit: 1.1120 Sell: 1.1008 Take profit: 1.0988 Sell: 1.0985 Take profit: 1.0960 For the pound / dollar pair, the key levels on the H1 scale are: 1.2460, 1.2408, 1.2351, 1.2300, 1.2266, 1.2218 and 1.2190. Here, we follow the development of the upward cycle of September 3. The continuation of the movement to the top is expected after the breakdown of the level of 1.2351. In this case, the target is 1.2408. The breakdown of which, in turn, will allow us to expect movement to the level of 1.2460, and upon reaching this level, we expect consolidation in the range of 1.2408 - 1.2460. For the potential value for the top, we consider the level of 1.2514. Upon reaching which, we expect a pullback to the bottom. Consolidated movement is expected in the range of 1.2300 - 1.2266. The breakdown of the latter value will lead to an in-depth correction. Here, the target is 1.2218. The range of 1.2218 - 1.2190 is the key support for the upward cycle. The main trend is the upward cycle of September 3. Trading recommendations: Buy: 1.2351 Take profit: 1.2406 Buy: 1.2409 Take profit: 1.2460 Sell: 1.2300 Take profit: 1.2268 Sell: 1.2264 Take profit: 1.2218 For the dollar / franc pair, the key levels on the H1 scale are: 0.9991, 0.9974, 0.9947, 0.9917, 0.9865, 0.9849, 0.9824 and 0.9796. Here, we follow the development of the ascending structure of September 4. The continuation of the movement to the top is expected after the breakdown of the level of 0.9917. In this case, the target is 0.9947. Price consolidation is near this level. The breakdown of the level of 0.9947 will lead to movement to a potential target - 0.9974. Upon reaching this value, we expect consolidation in the range of 0.9974 - 0.9991, as well as a pullback to the bottom. Departure for correction is expected after the breakdown of the level of 0.9887. In this case, the target is 0.9865. Short-term downward movement is expected in the range of 0.9865 - 0.9849. The breakdown of the latter value will favor the development of a downward structure. The main trend is the rising structure of September 4. Trading recommendations: Buy : 0.9917 Take profit: 0.9945 Buy : 0.9948 Take profit: 0.9972 Sell: 0.9885 Take profit: 0.9867 Sell: 0.9865 Take profit: 0.9850 For the dollar / yen pair, the key levels on the scale are : 108.12, 107.76, 107.49, 107.17, 106.80, 106.60 and 106.29. Here, we follow the development of the ascending structure of September 3. Short-term upward movement is expected in the range of 107.49 - 107.76, hence, the likelihood of a reversal in the correction. For the potential value for the top, we consider the level of 108.12. Upon reaching which, we expect a pullback to the bottom. A correction can take place, after the breakdown of the level of 107.07. Here, the target is 106.80. A short-term downward movement is in the range of 106.80 - 106.60. The breakdown of the last value will lead to the development of a downward trend. Here, the potential target is 106.29. Main trend: local upward structure from September 3. Trading recommendations: Buy: 107.50 Take profit: 107.74 Buy : 107.78 Take profit: 108.10 Sell: 107.05 Take profit: 106.82 Sell: 106.78 Take profit: 106.60 For the Canadian dollar / US dollar pair, the key levels on the H1 scale are: 1.3259, 1.3230, 1.3208, 1.3181, 1.3117, 1.3094 and 1.3052. Here, we follow the development of the descending structure of September 3. The continuation of movement to the bottom is expected after the price passes the noise range 1.3117 - 1.3094. In this case, the potential target is 1.3052, when this level is reached, we expect a pullback to the top. Departure for correction is expected after the breakdown of the level of 1.3181. In this case, the first goal is 1.3208. Short-term upward movement is possibly in the range of 1.3208 - 1.3230. The breakdown of the last value will lead to a long correction. Here, the target is 1.3259. This level is a key support for the downward structure. The main trend is the descending structure of September 3. Trading recommendations: Buy: 1.3181 Take profit: 1.3208 Buy : 1.3208 Take profit: 1.3230 Sell: 1.3117 Take profit: 1.3095 Sell: 1.3092 Take profit: 1.3052 For the Australian dollar / US dollar pair, the key levels on the H1 scale are : 0.6967, 0.6918, 0.6884, 0.6867, 0.6841, 0.6822 and 0.6793. Here, we follow the development of the ascending structure of September 3. Short-term upward movement is expected in the range of 0.6867 - 0.6884. The breakdown of the latter value will lead to a movement to the level of 0.6918. Price consolidation is near this value. For the potential value for the top, we consider the level of 0.6967. Upon reaching this level, we expect a pullback to the bottom. Short-term downward movement is possibly in the range of 0.6841 - 0.6822. The breakdown of the last value will lead to a long correction. Here, the potential target is 0.6793. This level is a key support for the top. The main trend is the upward structure of September 3. Trading recommendations: Buy: 0.6886 Take profit: 0.6918 Buy: 0.6920 Take profit: 0.6965 Sell : 0.6840 Take profit : 0.6822 Sell: 0.6820 Take profit: 0.6795 For the euro / yen pair, the key levels on the H1 scale are: 119.60, 119.05, 118.78, 118.34, 118.02 and 117.53. Here, we continue to monitor the development of the ascending structure of September 3. Short-term upward movement is expected in the range of 118.78 - 119.05. The breakdown of the last value will lead to movement to a potential target - 119.60, when this level is reached, we expect a pullback to the bottom. Short-term downward movement is expected in the range of 118.34 - 118.02. The breakdown of the last value will lead to an in-depth correction. Here, the goal is 117.53. This level is a key support for the upward structure. The main trend is the upward cycle of September 3. Trading recommendations: Buy: 118.78 Take profit: 119.05 Buy: 119.07 Take profit: 119.60 Sell: 118.34 Take profit: 118.04 Sell: 118.00 Take profit: 117.55 For the pound / yen pair, the key levels on the H1 scale are : 136.13, 134.74, 134.10, 132.94, 131.91, 131.36, 130.57 and 129.70. Here, we continue to monitor the development of the upward cycle of September 3. The continuation of the movement to the top is expected after the breakdown of the level of 132.96. In this case, the target is 134.10. Short-term upward movement, as well as consolidation is in the range of 134.10 - 134.74. For the potential value for the top, we consider the level 136.13. Upon reaching which, we expect a pullback to the bottom. Short-term downward movement is possibly in the range of 131.91 - 131.36. The breakdown of the last value will lead to an in-depth correction. Here, the target is 130.57. This level is a key support for the upward structure. Its passage in price will lead to the formation of a downward structure. Here, the potential target is 129.70. The main trend is the upward structure of September 3. Trading recommendations: Buy: 132.96 Take profit: 134.10 Buy: 134.10 Take profit: 134.72 Sell: 131.90 Take profit: 131.36 Sell: 131.34 Take profit: 130.58 The material has been provided by InstaForex Company - www.instaforex.com |
| GBP/USD. September 10. Results of the day. Unemployment in the UK declined, wages rose Posted: 10 Sep 2019 04:29 PM PDT 4-hour timeframe Amplitude of the last 5 days (high-low): 147p - 176p - 144p - 65p - 151p. Average volatility over the past 5 days: 137p (high). Well, the UK Parliament has officially gone on a 5-week vacation, and Boris Johnson has softened his rhetoric on Brexit. Now the prime minister believes that a "deal" with the European Union can be achieved and every effort should be made to do so. But if this option is not possible, the country must leave the European Union without an agreement and can withstand it, Johnson said. Former British Prime Minister Tony Blair also spoke on this occasion. He said that the snap parliamentary elections Johnson is seeking will not help solve the difficult situation with Brexit. Only one more popular referendum can resolve the current crisis. Blair said that it is incorrect, in principle, to mix issues of early elections in Parliament and Brexit, as these two issues should be separated. According to Blair, Boris Johnson believes that the early elections will give him the opportunity to raise the question of Brexit with an edge: either the country leaves the EU without a "deal", or Jeremy Corbyn becomes the new prime minister. Probably, it means that Corbyn, as prime minister, will not satisfy a much larger number of British citizens than an unordered "divorce" with the European Union. We can also add that the prime minister clearly hoped to increase the presence of Conservatives in Parliament through re-elections, which would allow him to more easily push the "hard" Brexit through the wall of warring opposition. However, all this will not happen. In the coming weeks, we will be observing the actions of Boris Johnson, who should now ask the EU leaders for a delay, and the EU leaders who must give Johnson an answer. The question now stands on the agenda: will the European Union approve the new Brexit date postponement? Meanwhile, the pound is again rising against the US dollar thanks to another very good package of macroeconomic statistics from the United Kingdom. Today, September 10, it became known that the unemployment rate fell from 3.9% to 3.8% in July, and the average wage including bonuses increased by 4.0% in July against the forecast of +3.7%. Traders found these reports strong enough to continue buying the British currency. Well, what in the end? As a result, the pound has risen and remains in this position. Until Boris Johnson begins to pull the rope to his side, the fundamental background for the British pound will remain very favorable, because the main question that worries the currency market now is whether the hard Brexit will take place before October 31 or will it be postponed. thanks to the actions of the Parliament, but are there possible options? Thus, until Boris Johnson takes any actions that again bring them closer to a disorderly exit, the pound will be prone to growth. Trading recommendations: The GBP/USD currency pair resumed an upward movement with targets at resistance levels 1.2437 and 1.2499. The average volatility in the pair remains quite high. The MACD indicator has begun to discharge. Thus, it is recommended to trade with the stated goals, and to manually close trades use signals to rebound from target levels or by moving Stop Loss up. In addition to the technical picture, fundamental data and the time of their release should also be taken into account. Explanation of the illustration: Ichimoku indicator: Tenkan-sen is the red line. Kijun-sen is the blue line. Senkou Span A - light brown dotted line. Senkou Span B - light purple dashed line. Chikou Span - green line. Bollinger Bands Indicator: 3 yellow lines. MACD indicator: Red line and bar graph with white bars in the indicator window. The material has been provided by InstaForex Company - www.instaforex.com |
| Posted: 10 Sep 2019 04:09 PM PDT 4-hour timeframe Amplitude of the last 5 days (high-low): 53p - 69p - 68p - 37p - 52p. Average volatility over the past 5 days: 56p (average). The European currency slightly fell against the US dollar on the second trading day of the week, September 10. It can be seen that after good progress at the end of last week, bulls need fundamental feed in order to continue to buy the euro/dollar pair. However, the calendar of macroeconomic events in the United States and the EU is absolutely empty in the first three days of the week. Moreover, there was not a single speech by Mario Draghi or Jerome Powell, or even Donald Trump. There was not a single report on the subject of the China-US trade war. Thus, traders in the truest sense of the word have nothing to react to. Moreover, in anticipation of the announcement of the results of the ECB meeting on Thursday, the bulls clearly do not want to risk it. After all, the decision that the European regulator will take can be either "dovish" or "hawkish". In the first case, the ECB will lower the rate on deposits by 0.1% and will not yet announce the resumption of the bond redemption program. In the second, it will lower the deposit rate immediately by 0.2% and announce the start of a monthly bond redemption in the amount, according to analyst agencies, of about 30 billion euros. In both cases, the euro will fall. The euro's only chance is in the hands of forex market traders. Perhaps, in the first option, market participants will decide that such a softening of monetary policy is not enough to lower the euro currency even further. After all, by and large, the euro/dollar continues to trade very close to its two-year lows. Furthermore, traders can recall that the Federal Reserve meeting will soon be held, at which the regulator can lower the key rate for the second time in a row. However, even if the euro somehow manages to miraculously avoid a selloff on Thursday, its prospects are still very vague. It is gloomy because a trade war with America looms ever more clearly on the horizon. According to many analysts, in mid-November this year, Donald Trump may return to his desire six months ago to impose duties on the products of the engineering industry of the European Union. It is clear that in this case, the demand for the euro will fall even more, and Donald Trump will seek the signing of a trade agreement, which, of course, will be primarily beneficial to the United States and not the European Union. And of course, a trade war with the United States will be more disadvantageous to the European Union than America. The only chance for the euro in the long run, which, however, is not really needed by the ECB leadership, is a trade war between China and the United States. The fact is that Donald Trump has long insisted that the dollar is too high, and the main enemy of the country is not China, but the Fed, which stubbornly does not want to cut rates, making the dollar less attractive in the foreign exchange market. However, knowing Trump, until his presidency is over, he will continue to push Jerome Powell, the other members of the monetary committee, the Fed as a whole. It is also possible that sooner or later it will achieve a rate cut to such a level when the US dollar will no longer be so attractive for purchases. James Bullard has already announced his readiness to vote for lowering the rate immediately by 0.5%. This is precisely the long-term chance of the euro. At the moment, the technical picture of the euro suggests the preservation of the upward trend, but it will take a miracle so that the fundamental background this week does not break this trend. Turning the MACD indicator up and overcoming the Senkou Span B line will make it possible to continue moving up with the target of 1.1090. Trading recommendations: EUR/USD is adjusting as part of a very volatile upward trend. Thus, it is now recommended to wait until the completion of this correction and buy the euro with the first goal of 1.1090. If the euro/dollar goes below the critical line, then the bears will take over the initiative in the forex market again. In addition to the technical picture, fundamental data and the time of their release should also be taken into account. Explanation of the illustration: Ichimoku indicator: Tenkan-sen is the red line. Kijun-sen is the blue line. Senkou Span A - light brown dotted line. Senkou Span B - light purple dashed line. Chikou Span - green line. Bollinger Bands Indicator: 3 yellow lines. MACD indicator: Red line and bar graph with white bars in the indicator window. The material has been provided by InstaForex Company - www.instaforex.com |
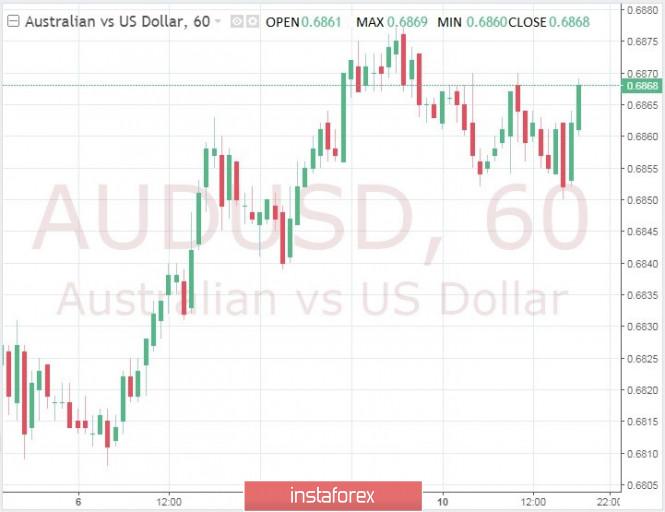
| AUD/USD paused, awaits news after a five-day rally Posted: 10 Sep 2019 04:09 PM PDT After a sharp rally during the previous five trading days and adding almost 150 pips over this period, the AUD/USD pair entered the consolidation phase and fluctuates in a narrow range near 0.6850. Earlier, the National Australia Bank reported that the business confidence index fell to 1 point in August from 4 points in July, and the business conditions index fell to 1 point from 2 points, in such conditions it is difficult for the aussie to continue to press the dollar. In addition, the producer price index in China fell to -0.8% in August year-on-year, which further inhibits growth. On the other hand, the lack of significant macroeconomic data from the United States did not make it possible for the US dollar index to strengthen and limited losses in the pair. At the moment, the US dollar index shows a small daily gain of 98.38 points. It seems that investors are likely to stand aside and watch, waiting for new events around the trade conflict between the US and China. Earlier today, the White House trade adviser said that "patience is needed regarding trade negotiations between the US and China," but he has not made any statements hinting at progress in the negotiations. The material has been provided by InstaForex Company - www.instaforex.com |
| GBP/USD: "White line" for the pound: key indicators are growing, negotiations continue Posted: 10 Sep 2019 04:08 PM PDT The pound continues to receive support from the fundamental background. Data on the growth of Britain's GDP, industrial production, as well as labor market indicators unexpectedly came out in the "green zone", exceeding forecast values. Although Brexit's prospects are still of primary importance for the British currency, traders of the GBP/USD pair could not ignore the above releases. Recently, macroeconomic statistics in the UK have not pleased investors: on the contrary, during the summer, analysts seriously talked about the risks of recession, given the series of negative releases, ranging from PMI indices to June data on economic growth in the country. Therefore, now that the indicators have come out "better than expected", the pound has taken off, especially against the backdrop of a series of defeats of Prime Minister Johnson in the House of Commons. The pound updates its weekly and 1-a month high against the dollar today. The above combination of fundamental factors made it possible for the bulls to develop corrective growth, which, it would seem, was "doomed" after harsh statements by EU representatives. But due to the positive of recent days, the demand for the sterling has increased again. Thus, according to the latest data, the volume of British GDP on a monthly basis increased by 0.3% in July against the forecast of -0.1% and after falling to zero in June. The services sector made the strongest contribution to the growth of this indicator - this sector of the economy showed the strongest growth over the past 8 months. The volume of industrial growth also pleased investors: the indicator grew by 0.1%, while most analysts were confident that it would remain in the negative area. The data on the labor market in Britain today only secured success. The unemployment rate unexpectedly dropped to 3.8% (although many were confident that it would remain at the previous level of 3.9%), but the average earnings jumped immediately to 4% (including premiums) and 3.8% (excluding bonuses). These indicators have shown consistent positive dynamics since the spring of this year, and last month the indicator without bonuses was at its highest since June 2008 (this month the indicator fell only 0.1% of the highest value). All this suggests that the price pressure on the part of salaries is increasing, and this fact will have a beneficial effect on inflationary growth in the future. Thus, if it were not for the "Brexit factor," traders could count on a tightening of the rhetoric of the English regulators' representatives, indicating a possible increase in the interest rate in the first half of next year. But Mark Carney is still focused on the consequences of the "divorce proceedings". Today, the head of the Bank of England said that the financial system of Britain is ready for Brexit, "in whatever form it occurs." But at the same time, he noted that in the case of a "hard" scenario, changes will occur in one moment, so the regulator will have to "adapt to dynamic changes." Carney did not talk about the prospects of monetary policy in plain text, only noting that the central bank is unlikely to use negative rates as a defense tool. Given the voiced position of the head of the Bank of England, it is worth recognizing that, despite the good data on the growth of key economic indicators, the focus of attention of the regulators' members is still on Brexit. I note that yesterday Boris Johnson suffered another debacle in the House of Commons: MPs refused to hold early elections in October. Now, the head of government will not be able to strengthen his position in Parliament and cancel the law, which actually binds his hands, until October 31. However, the risk of implementing a hard Brexit still remains. Let me remind you that the French foreign minister recently announced that Paris will not support the extension of the Brexit negotiation process after December 31. Later, a similar position was expressed by Holland and some politicians of other EU countries. France even threatened to veto the decision to postpone if London "does not substantiate its request in detail". In turn, Johnson is not only not going to ask Brussels about this, but also intends to "strongly recommend" his European colleagues not to take such steps. Thus, the British prime minister plans to bypass the law adopted last week, which obliges him to agree to the granted delay. According to Johnson, he will not violate the prescriptive norms if he simultaneously sends two letters to the EU leadership: one asking for a delay (as required by law), and the other with the opposite request (as deputies did not directly forbid him to take such steps). Another scenario being discussed on Downing Street involves litigation. According to some analysts, Johnson may challenge this law in court. Or he can be challenged by those Conservative deputies who voted against him in the House of Commons. As soon as Boris Johnson starts implementing one of the above scenarios, the pound will be under significant pressure (having returned paired with the dollar to the area of 21-22 figures). But so far, the market is living with hopes. Brexit negotiator David Frost today went to Brussels, where he will hold talks with EU representatives until the end of the week. The market is still hoping that Britain and the EU will find a common denominator (primarily on the issue of back-stop) by closing a historic deal at the October 18 summit. Although, in my opinion, this scenario is highly unlikely, given the background of this issue. From a technical point of view, the pair has the potential for further correctional growth to the level of 1.2430 (the upper boundary of the Kumo cloud on the daily chart). The next resistance level is the price of 1.2520 (the middle line of the Bollinger Bands indicator on the weekly chart), but this price target will be available only if one of the top EU politicians hints at progress in the negotiations. The support level remains at 1.2180 - at this price point, the middle line of the Bollinger Bands indicator coincides with the Kijun-sen line (on D1). The material has been provided by InstaForex Company - www.instaforex.com |
| Yen in positive territory: growth continues Posted: 10 Sep 2019 04:08 PM PDT Positive forecasts of analysts regarding the yen were successful. Currently, the USD/JPY pair surpassed the 107 mark amid growth of high yield on bonds and the US stock market. The Japanese currency is trading between 107.37-107.39, analysts say. The strengthening of the US currency against the Japanese yen is due to the elimination of speculative positions in connection with the growth of Treasury yields. According to analysts, the USD/JPY pair received significant support from a powerful rebound in the yield of US Treasury bonds. As a result, the pair resumed growth, analysts emphasize. On Tuesday, September 10, the USD/JPY pair rose 0.2% to 107.41. Previously, the pair briefly reached the level of 107.50 - the highest since the beginning of August 2019. At the moment, a slight decrease in the yen has been recorded. Currency Strategists at Westpac Banking Corp. believe that the Japanese currency will recover to 105 against the dollar in the fourth quarter of this year. Most analysts are upbeat about the prospects for the Japanese currency. The material has been provided by InstaForex Company - www.instaforex.com |
| Posted: 10 Sep 2019 03:56 PM PDT The British pound managed to regain its position against the US dollar after another attempt at a downward correction, which was undertaken by sellers at the beginning of the European session. Good activity in the UK labor market is a direct signal that the economy will be able to avoid a recession by the end of the year, having begun its active recovery, despite the unforeseen Brexit scenario. According to the National Bureau of Statistics, unemployment in the UK from May to July 2019 decreased and amounted to 3.8%. The last time such a low mark was recorded was back in 1974. The ILO report also indicated that over the same period, the number of unemployed in the UK fell by 11,000 compared with the previous three-month period, to 1.294 million people. The number of applications for unemployment benefits rose by 28,000 in August against 19,000 in July. Economists predicted growth of 29,000. It is worth noting that, despite the weakening economy, the pace of employment remained quite high. In addition, a report was released today, which indicated a rise in wages in the UK, which would certainly spur inflation and allow the Bank of England to maintain a tendency to raise rates. The average earnings in the UK from May to July increased by 3.8%, while economists had expected this indicator at the level of 3.7%. Let me remind you that recently the Bank of England paid attention to the labor market, on which the further scenario of increasing interest rates depends, if Brexit goes smoothly. A statement by the Governor of the Bank of England also supported the demand for the British pound in the morning. Among the risks, Carney drew attention to the likelihood of a global economic downward turn, which has recently increased significantly. However, in his opinion, central banks have the most tools to counter the recession, and the United States has the greatest free monetary policy potential to respond to possible problems, although the ECB will find it difficult to respond to the usual recession. As for the UK economy, despite the downside risks to the outlook, the core of the UK financial system is ready for Brexit. Mark Carney believes that even if the scenario of hard Brexit slows down the UK economic growth, it will spur inflation, which will lead to higher interest rates in the future. The governor of the Bank of England made it clear that negative interest rates in the UK would not be used as a tool, which led to sharp purchases of the British pound. As for the technical picture of the GBPUSD pair, it remained unchanged. Buyers can not cope with resistance at 1.2390, and only its breakdown will provide the trading instrument with a new surge of strength. If trading continues to be below this range, a repeated downward correction to the lower boundary of the 1.2240 channel, which was formed yesterday after the bears' unsuccessful attempt to return to the market, is not ruled out. The lack of clearer benchmarks for Brexit, of course, will scare away large buyers, but the demolition of a number of sellers' stop orders above 1.2390 and a return to this level should not be ruled out either. EURUSD There are few data on the eurozone countries at the beginning of this week. Today there was only a report on industrial production in France, which in July this year grew by only 0.3% compared with June, while growth was projected at 0.2%. In Italy, a similar indicator was completely reduced by 0.7%, which once again indicates problems in this sector of the economy. Traders are in no hurry to return to the market due to a very important meeting of the European Central Bank. As some economists expect, the ECB is unlikely to restart the bond purchase program this fall and will limit itself to only lowering interest rates by 10 points in the negative direction. First of all, there is no consensus among leaders regarding the need for a new round of quantitative easing, as the ECB has not many instruments in the conditions of zero interest rates to influence a slowing economy. As for the technical picture of the EURUSD pair, it remained unchanged compared to previous forecasts, since market activity before the important decision of the European Central Bank is quite low. Most likely, the bears will again try to return to the area below the support of 1.1020, but the demand for the euro will resume after updating lows around 1.0990 and 1.0950. A break in the range of 1.1055 will increase the demand for the trading instrument and lead to the updating of local highs in the region of 1.1090 and 1.1120, which was not done yesterday. The material has been provided by InstaForex Company - www.instaforex.com |
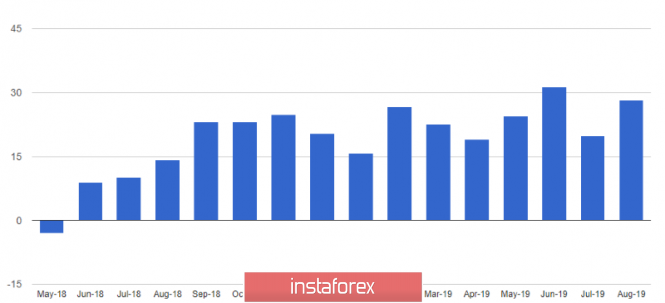
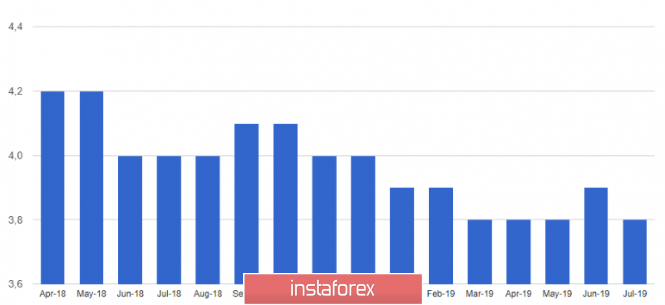
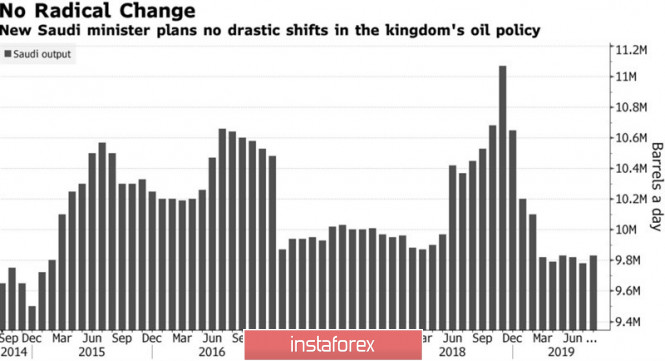
| Posted: 10 Sep 2019 03:54 PM PDT Once upon a time in the market they seriously believed that oil prices could change if the prince of Saudi Arabia sneezed. It seems that old times are returning. Despite the fact that the new Minister of Energy, Prince Abdulaziz bin Salman, claims that nothing will change in Riyadh's policy and the country will continue long-term cooperation with Russia and other producers, prices are rising at a dash. Brent quotes reached a 6-week peak simply because Saudi Arabia violated its principle of not appointing members of the Royal Family. The situation seems to be critical, and in anticipation of the important IPO Saudi Aramco, the Saudis need oil at a higher price than the current one. In previous articles, we talked about how the fall of Brent stalled the economy of Saudi Arabia. To balance the budget, it needs a North Sea grade of $80 per barrel. Yes, the new Minister of Energy argues that there will be no fundamental changes in Riyadh's policy, but the very fact that the Saudis keep their desire to stabilize the market pushes futures quotes higher. Rumors are actively circulating in the market that OPEC may prolong the Vienna agreement to reduce production by 1.2 million bpd for a longer period. The dynamics of oil production by Saudi Arabia In addition, Prince Abdulaziz bin Salman, in his first speech as Minister of Energy, dealt a blow to the main trump card of the Bears - Brent and WTI - global demand. In his opinion, the fall in prices is speculative. Investors fear a recession in the global economy, but in reality there will be no recession. The trade war between the US and China will soon end, and the black gold market will improve. It should be recognized that it was the factor of reduction in world demand that pulled down futures quotes, while the factor of growth in production in the US was offset by its reduction from OPEC and other producing countries. So, Citi claims that the loss of global demand since March 2018 amounted to 800 thousand bpd. The indicator will grow by 940 thousand bpd in 2019, and if trade frictions in Washington and Beijing keep going for another six months - by 600-700 thousand bpd. In such circumstances, it will be difficult for bulls on oil to push quotes higher. However, if Prince Abdulaziz bin Salman is right, then the situation is fundamentally changing. Investors sincerely hope that opponents will take a step towards each other in October, and we can talk about a de-escalation of the conflict. Moreover, according to the US Treasury Secretary Steve Mnuchin, the Americans are ready for negotiations, and substantial progress is taking place in relations between the United States and China. Stock indices react to this news with growth, which indicates an increase in global risk appetite and favorably affects both grades of black gold. Technically, as expected, a breakthrough of the upper limit of the consolidation range of $57.45-61.35 per barrel activated the Shark pattern and increased the risks of its target by 88.6%. In addition, Wolfe waves were formed on the Brent daily chart, so the growth of quotes can continue up to $68.2 and higher. The material has been provided by InstaForex Company - www.instaforex.com |
| September 10, 2019 : GBP/USD Intraday technical analysis and trade recommendations. Posted: 10 Sep 2019 10:37 AM PDT
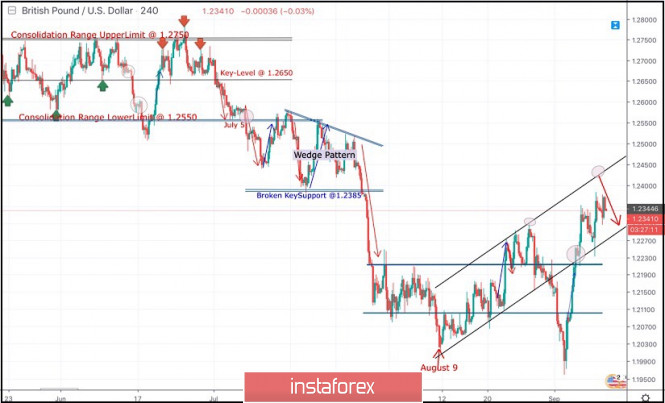
On July 26, Bearish breakdown below 1.2385 (Wedge-Pattern Key-Level) facilitated further bearish decline towards 1.2210 and 1.2100 which corresponded to significant key-levels on the Weekly chart. In Early August, another consolidation-range was temporarily established above 1.2100 before August 9 when temporary bearish movement was executed towards 1.2025 (Previous Weekly-Bottom). Recent bullish recovery was demonstrated off the recent bottom (1.2025). This brought the GBP/USD pair back above 1.2100 (Lower limit of the recently established consolidation-zone) within the depicted short-term bullish channel. As expected, further bullish advancement was demonstrated towards 1.2230 then 1.2280 where recent bearish rejection was demonstrated (near the upper limit of the recent movement channel). Bullish persistence above 1.2160 (the recent consolidation range pivot-point) was needed to enhance further bullish advancement. Instead, another quick bearish decline was demonstrated towards 1.2100 then 1.2000 (corresponding to the previous bottom established on August 9). Last Week, Early signs of bullish recovery (Bullish Engulfing candlesticks) were manifested around 1.1960 bringing the GBPUSD back above 1.2100. As expected, further bullish advancement was demonstrated towards 1.2200 where the GBPUSD pair looked overbought. However, further bullish momentum was demonstrated towards 1.2320 bringing the pair back inside the depicted movement channel again. Further bullish advancement should be expected towards 1.2400 - 1.2420 where the upper limit of the current movement channel comes to meet the pair. The Long-term outlook remains bearish as long as the upper limit of the current movement channel around 1.2400 remains defended by the GBPUSD bears. Trade Recommendations: Conservative traders should wait for the current bullish movement to pursue towards 1.2400-1.2420 (upper limit of the depicted movement channel) for a valid SELL entry. T/P level to be placed around 1.2300, 1.2250 then 1.2220 while S/L should be placed above 1.2450. The material has been provided by InstaForex Company - www.instaforex.com |
| September 10, 2019 : EUR/USD Intraday technical analysis and trade recommendations. Posted: 10 Sep 2019 10:18 AM PDT
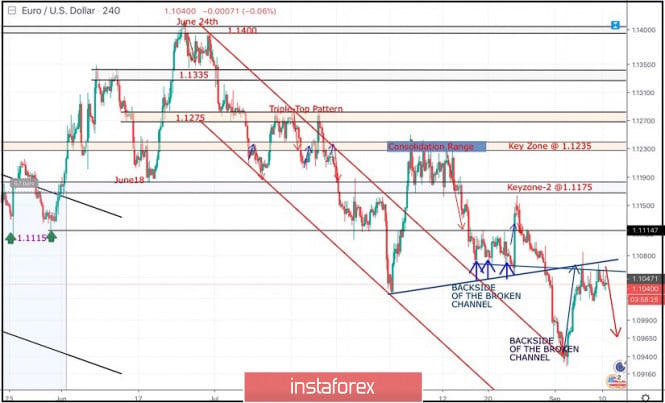
In Mid-August, the EUR/USD has been trapped between 1.1235-1.1175 for a few trading sessions until bearish breakout below 1.1175 occurred on August 14. Bearish breakout below 1.1175 promoted further bearish decline towards 1.1075 where the backside of the broken bearish channel has provided temporary bullish demand for sometime (Bullish Triple-Bottom pattern). Bullish persistence above 1.1115 was needed to confirm the short-term trend reversal into bullish. However, the depicted Triple-Bottom pattern was invalidated especially after the EURUSD pair bulls have failed to establish Bullish persistence above 1.1115. Moreover, the recently established short-term uptrend line has been invalidated as well thus rendering the short-term outlook as bearish. Two weeks ago, a quick bearish decline was demonstrated towards 1.0965 - 1.0950 where the backside of the broken channel came to meet the EURUSD pair again. Risky traders were advised to look for a valid BUY entry anywhere around the price levels of 1.0950. All T/p levels were successfully reached within the recent bullish movement during last week's consolidations. Today, the EUR/USD pair is currently testing the backside of both broken trends around 1.1060-1.1080 where early signs of bearish rejection are being demonstrated as expected in Yesterday's article Trade recommendations : Conservative traders are advised to look for a valid SELL entry anywhere around the price levels of (1.1050-1.1070). S/L should be placed just above 1.1115 while target levels to be located at 1.1025, 1.0988 and 1.0935. The material has been provided by InstaForex Company - www.instaforex.com |
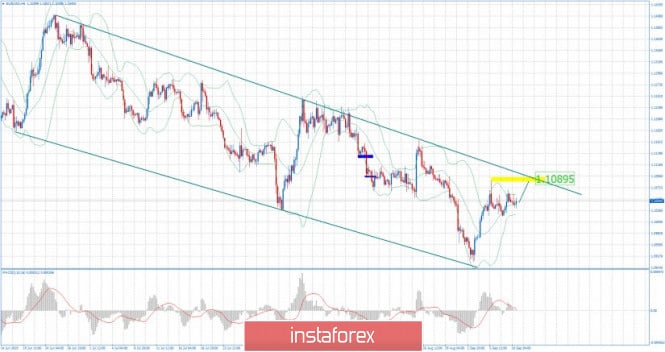
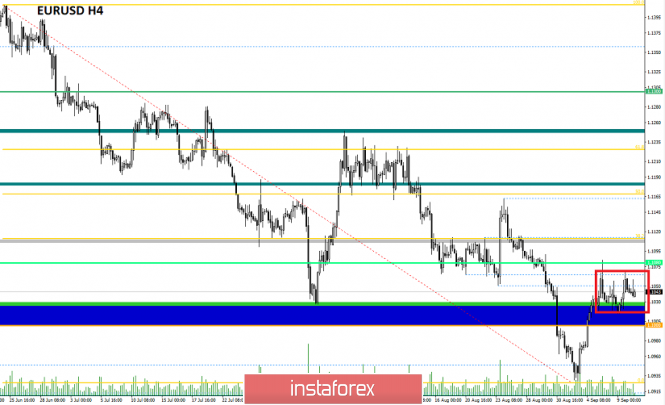
| EUR/USD for September 10,2019 - Potential test of the upper diagonal Posted: 10 Sep 2019 09:23 AM PDT EUR/USD has been trading sideways at the price of 1.1047. There is still upside pressure from the background and potential test of the upper diagonal of the downward channel. Watch for potential re-test of the 1.1090.
Yellow rectangle – Resistance level Green lines – Downward channel Based on the 4H time-frame, I still see that there is chance for re-test of the 1.1090. Key support zone is at 1.1015 and resistance levels at 1.109. Bears need to be very cautious as there is strong support on the test and potential re-test of the upper line of the channel. As long as the EUR is holding above 1.1015 there is a chance for potential test of 1.1090 or higher. The material has been provided by InstaForex Company - www.instaforex.com |
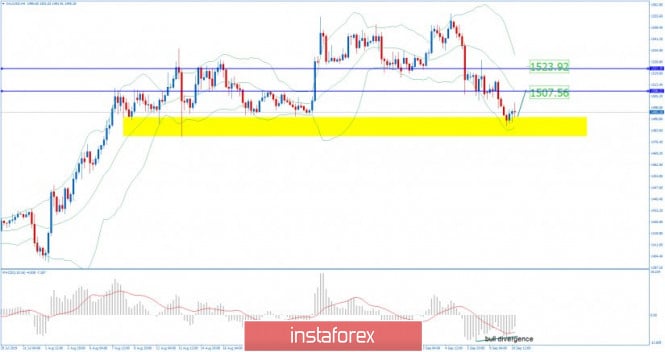
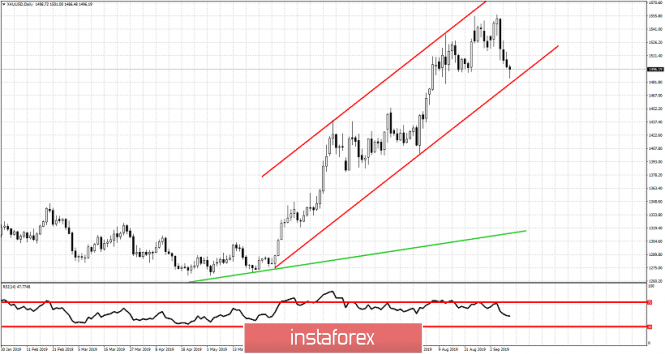
| Gold 09.10.2019 - Gold is testing key support zone, potential rally incoming Posted: 10 Sep 2019 09:14 AM PDT Gold price had an downward movement in past 24H.Anyway, there is still chance for more upside and potential test of $1,507 and $1,523. Key support zone is set at the price of $1,490-$1,480.
Blue horizontal lines – Important resistance levels and upward objective Yellow rectangle - major support area Green rising line – Expected path Based on the 4H time-frame, I found that MACD oscillator showed us the bullish divergence, which is good confirmation for the potential rally. Key support zone is at $1,490-$1,480 and resistance levels at $1,507-$1,523. Bears need to be very cautious as there is strong support on the test and bullish divergence on oscillator. As long as the Gold is holding above $1,480 there is a chance for potential test of $1,523 or higher. The material has been provided by InstaForex Company - www.instaforex.com |
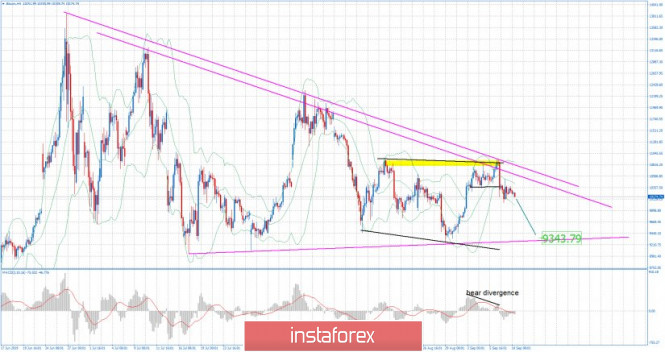
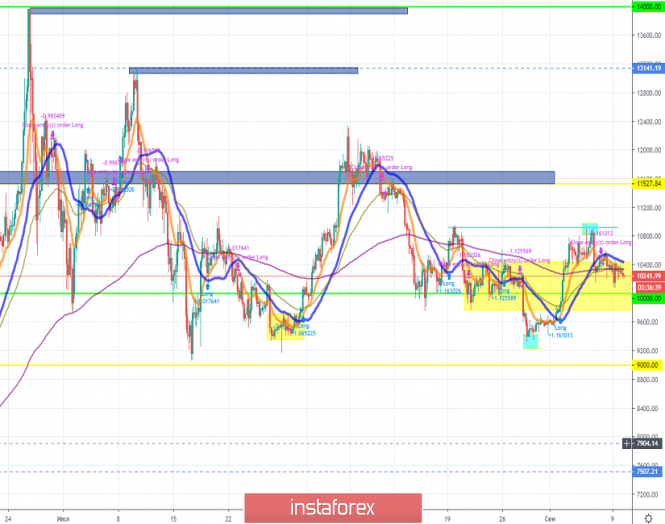
| BTC 09.10.2019 -Sellers in control, downward target set at $9,350 Posted: 10 Sep 2019 08:47 AM PDT Industry news: Chairman of the United States Securities and Exchange Commission (SEC), Jay Clayton has said that the organization is getting ever closer to finally approving a bitcoin ETF. However, Clayton went onto warn that further work needs to be done to avoid the manipulation of price and make sure the market is transparent. Technical view:
Bitcoin did exactly what I expected last yesterday and our downward target is still expected at the price of $9.350 Pink lines – Larger symmetrical triangle in play Black lines - Channel Green falling line – Expected path Nothing specially changed since my yesterday's analysis.I still still expect potential new wave down for potential fulfill of the lower symmetrical triangle boundary. Additionally, I found that momentum on the upside decreasing in last up wave, which is indication for the weak buyers on the market. Key support is at $9.350 and resistance at $11.000 and $11.200. Bulls need to be very cautious as there is strong aggressive selling from the key resistance. As long as the Bitcoin is trading below $11.200, I would watch for selling opportunities. Watch for selling opportunities on the rallies on lower frames 5/15 for better timing. Most recently, I found rejection of the middle Bollinger band, which is another confirmation for the downward continuation. The material has been provided by InstaForex Company - www.instaforex.com |
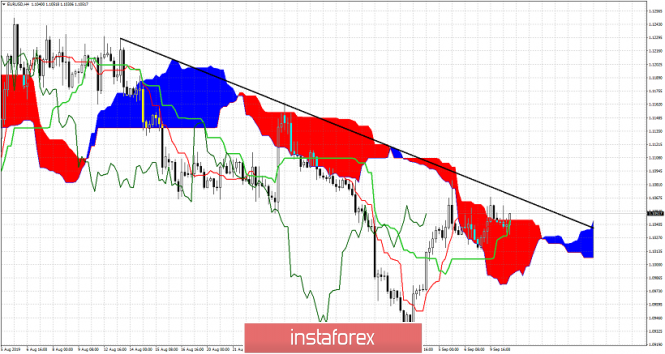
| EURUSD is very close to providing a new bullish signal. Posted: 10 Sep 2019 08:28 AM PDT EURUSD bulls have so far managed to hold prices above the 1.1020-1.10 support area. Price is breaking above the 4 hour cloud resistance but still remains below the major trend line resistance.
EURUSD is trading above the 4 hour Kumo. Price is challenging recent highs at 1.1050-1.1080 area where we also find the important downward sloping trend line resistance. EURUSD bulls need to break above 1.1090 in order to hope for a move towards 1.1115 or 1.1175. Support is at 1.10. As long as price is above it we expect price to continue higher towards 1.1150. The material has been provided by InstaForex Company - www.instaforex.com |
| Gold could be forming a daily bullish reversal candle Posted: 10 Sep 2019 08:22 AM PDT Gold price as expected has pushed lower towards the lower boundary of the bullish medium-term channel. Price so far has not fallen as low as $1,480 but we have seen a low at $1,486. Price could now be forming a bullish hammer candlestick pattern implying a reversal could come until the end of the week.
Green line - major support trend line Gold price has pulled back from $1,557 towards $1,480. This so far remains a healthy and natural pull back after the strong rally from $1,400. The Daily candlestick could now be forming a bullish hammer pattern. If we see prices close today above $1,494 the we will have a hammer pattern. A bullish follow through tomorrow will strengthen this bullish pattern and we could see a new move higher maybe even to new 2019 highs. Support is key at $1,475-$1,480 area. Breaking below this area will increase the chances of a major top. The material has been provided by InstaForex Company - www.instaforex.com |
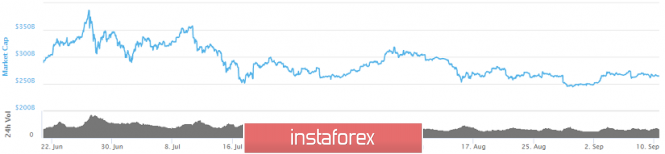
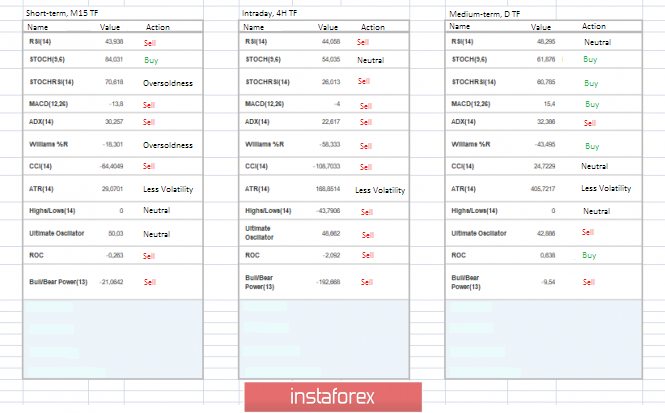
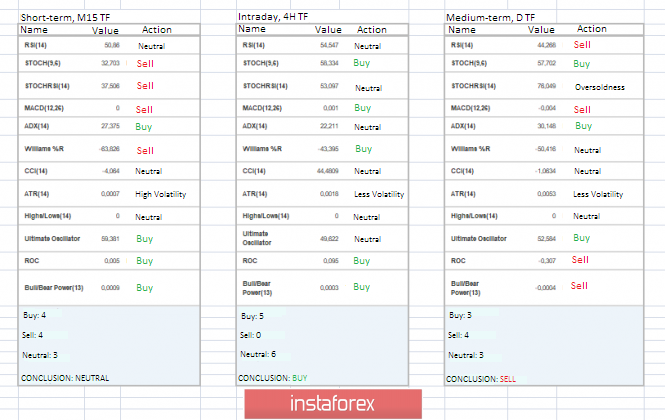
| What to expect from Bitcoin, autumn growth or preparing for the harsh winter (September 10) Posted: 10 Sep 2019 06:45 AM PDT The first cryptocurrency since the beginning of autumn is not so bad. The return of quotes above the $10,000 mark gives optimism to market participants, and an influx of cash may provide a chance for solid growth of Bitcoin. Now, there are several theories about new turns of growth of Bitcoin, and they all focus on living money from the real world. The first and one of the most high-profile news was against the background of the movement of a very large transaction of 94,504 BTC (more than $1 billion). On September 6, the Whale Alert robot, which tracks the movement of large crypto transactions in real-time, recorded an unusual movement of capital in the amount of 94,504 BTC. A noteworthy point is that the wallets from which such a significant amount was moved do not belong to any of the crypto exchanges. One of the theories of this movement is that large transactions may be involved in institutional investors who replenish Bakkt deposits. Then this is very good news for the crypto industry, so funds can pump the market with real money, which will result in an upward trend. The next theory came from China, where, according to Bloomberg, residents began to hedge risks due to the ongoing trade war with the United States, transferring part of their savings to cryptocurrencies. As a result, sharp jumps in the rate of bitcoin on local exchanges. Digest of the past days: • Apple Pay Vice President Jennifer Bailey expressed his opinion about cryptocurrencies in an interview with CNN: "We are watching cryptocurrencies. We think it's interesting and they have long-term potential." The opinion of one of the largest corporations in the world is a big plus in the development of the crypto industry. • It has been reported that the Chicago Mercantile Exchange (CME Group) plans to launch bitcoin options soon. Let me remind you that at the end of 2017, CME launched bitcoin futures. • The future head of the ECB, Christine Lagarde, urged central banks not to exert excessive pressure on cryptocurrencies. "About new technologies, such as digital currencies, it is necessary to be alert when it comes to financial stability, privacy, and unlawful acts, and to ensure that all the requirements are presented to direct technologies for the benefit of society. But it also means recognizing the wider benefits to society of innovation and providing space for their development, "said Christine Lagarde. • At a forum sponsored by the Swiss Institute for International Studies, Fed Chairman Jerome Powell spoke out on cryptocurrencies and stablecoins. So, Powell said that the Fed is watching the crypto industry, but does not plan to create its cryptocurrency. • Chairman of the US Securities and Exchange Commission (SEC) Jay Clayton in an interview with CNBC said that cryptocurrency enterprises are already much closer to the necessary standards, but they have not yet proved the safety of Bitcoin ETFs for investors. As we can see from the news flow, the crypto industry is not just developing, it is beginning to gain a new trend, attracting more attention. What we have now is a small correctional move of September 6, where the quote returned to the previously formed cluster at the level of 10000/10400. The goal of many is to keep quotes above $10,000, as in this case, it will be possible to consider the gain from the psychological level and the range of accumulation, which will give strength in the further formation of the upward move. What are the assumptions for further development? The priority has already been voiced above, it is holding quotes above $ 10,000, but as you know, these are hopes, but in reality, we can see another entry into the accumulation framework, that is, 9800/10500. What is most important in setting forecasts is the fact that when expectations coincide in the form of entering the market of institutional investors, an upward trend may appear, which will help bitcoin escape from the ill-fated framework. As you know, such judgments do not carry the prospect of a day, a week, or even a month; this is something closer to a long-term recommendation, so keep this in mind if your positions are designed for several days. Key coordinates for the upward stroke: 10950; 12330; 13130; 13970. Key coordinates for the downward stroke: 10000; 9400; 8500; 7500. The general background of the cryptocurrency market Analyzing the general market capitalization, we see that the volume of the market has been moving almost horizontally for quite a long time, but, as experienced traders say, an ascending sidebar is visible. Compared to the previous article, capitalization fell by $ 3.3 billion and currently amounts to $ 264.4 billion. Such changes in terms of the entire cryptocurrency market are negligible, and thus we see that, in principle, the market is worth it. If we consider the volume chart in general terms, the current ceilings are 272 – 281 – 320 – 356 – $385 billion. The index remained unchanged and is at the level of 41p. As we can see, the correctional movement didn't scare market participants and we go at critically low levels, perhaps this fall and the truth will be safe for the crypto industry. Technical analysis Analyzing different sectors of timeframes (TF), we see that the indicators in the short-term and intraday interval signal sales, reflecting the actual corrective course of the market. The medium-term outlook maintains an upward interest, filtering the current correction. |
| Posted: 10 Sep 2019 06:29 AM PDT To open long positions on GBP/USD, you need: The British pound tried to resume the downward correction again, which was stopped in the morning by a report on the UK labor market, as well as data on the decline in the unemployment rate, which is a good signal for the economy, slowing down due to the situation with Brexit. At the moment, the buyers' task is to break through the same resistance of 1.2380, which limited the upward potential yesterday in the afternoon. Only this will allow the bullish market to resume, the target of which will be the highs of 1.2427 and 1.2460, where I recommend taking the profits. If the bears build a downward correction in the second half of the day, the support will be provided by the level of 1.2315, but you can buy from there only in the scenario of a false breakdown. It is best to open long positions for a rebound around the low of 1.2238. To open short positions on GBP/USD, you need: Sellers will actively protect the maximum of 1.2380, and the formation of a false breakdown there in the second half of the day will necessarily lead to a correction of GBP/USD to the support area of 1.2315, where I recommend fixing the profits. With a larger closing of long positions, the pair can test the area of 1.2238. If the bullish momentum in the North American session leads to a breakdown of the resistance at 1.2380, it is best to consider new short positions after updating the local highs around 1.2427 and 1.2460. However, without news on Brexit, and preferably positive, it will be very problematic to count on a larger increase in GBP/USD. Signals of indicators: Moving Averages Trading is just above 30 and 50 moving averages, which still holds hope for a further bullish scenario. Bollinger Bands Volatility gradually decreases, which does not give signals to enter the market.
Description of indicators
|
| Posted: 10 Sep 2019 06:24 AM PDT To open long positions on EURUSD, you need: From a technical point of view, in the absence of important fundamental statistics, nothing has changed. Weak reports on the reduction of industrial production in Italy and France helped the sellers of the euro to defend the level of 1.1053, above which the bulls cannot gain a foothold for the second day in a row. At the moment, the focus remains on the breakdown of the resistance of 1.1053, which will lead to an update of the last week's high at 1.1082 and to the test of the new resistance of 1.1115, where I recommend taking the profit. In the scenario of EUR/USD decline, you can count on support in the area of 1.1020, but it is best to open long positions from there after a false breakdown or buy the pair for a rebound from the minimum of 1.0989. To open short positions on EURUSD, you need: Euro sellers activated after the resistance update of 1.1053, and the formation of a false breakdown there was a signal to open short positions. Now, the target of the bears is the support of 1.1020. However, the more important task is to break through and consolidate below this minimum, which will push EUR/USD to the area of large levels of 1.0989 and 1.0955, where I recommend taking the profit. In the scenario of further growth above the resistance of 1.1053, it is best to expect sales to rebound from the high of 1.1082, which kept the pair from further growth last week. Signals of indicators: Moving Averages Trading is conducted in the area of 30 and 50 moving averages, which indicates the lateral nature of the market. Bollinger Bands Volatility is low, which does not give signals to enter the market.
Description of indicators
|
| Technical analysis of EUR/USD for September 10, 2019 Posted: 10 Sep 2019 05:54 AM PDT Overview: EUR/USD: The market is still indicating a strong bullish trend from the area of 1.1017. So, support is seen at the 1.1017 level for that this support has rejected two times confirming the validity of an uptrend. The bullish trend is still expected for the upcoming days as long as the price is above 1.1017. The EUR/USD pair reached a new maximmum at the price of 1.1030/1.1045. So, today the price may reach one more maximmum around the spot of 1.1073, which coincides with the ratio of 61.8% Fibonacci retracement levels. Today, the EUR/USD pair is challenging the psychological resistance at 1.1045. The EUR/USD pair will probably go up because an upward trend is still strong and the RSI is still signaling that the trend is upward. The breakthrough of 1.1045 will allow the pair to go further up to the levels of 1.1073 and 1.1112. As a result, it is gainful to buy above this price of 1.1017 with targets at 1.1073 and 1.1112.
|
| Trading recommendations for EURUSD currency pair – placement of trade orders (September 10) Posted: 10 Sep 2019 05:38 AM PDT Over the past trading day, the EUR/USD currency pair showed volatility close to the daily average of 53 points, as a result of which the quote returned to the stagnation area on Thursday last week. From technical analysis, we see that the last day turned out to be successful for the single currency, and we returned to the value of 1.1060 again. Is it possible to characterize this return as a step to a further upward move, I would not draw hasty conclusions since the initial consideration is in the form of a flat stagnation 1.1015/1.1060. As discussed in the previous review, traders are not prone to hasty actions, initially considered a flat movement, but there were no clear price fixations outside the borders, thereby sitting on the fence continued. Looking at the trading chart in general terms (daily period), we see that the correction phase is still maintained in the market, where there is a clear ambiguity at its peak, which is characterized by high shadows. The news background of the last day had only data on the volume of exports of Germany, which interested market participants in the growth of 0.7% after a long decline. The main round of fluctuations fell on the information background, and so, with the Brexit delay in case of an unsuccessful agreement, they decided. Queen Elizabeth II has approved a bill to ban Brexit without an agreement with the European Union, but the British Prime Minister does not stop, he continues to work to find a way to leave the EU on October 31. Madness or carefully thought-out tactics – we will already know in October, while Europe looks at everything with great skepticism, even in terms of postponement. So, the Dutch foreign trade minister generally believes that Brexit without a deal is still better than another delay, and French Foreign Minister Jean-Yves Le Drian, who a day earlier spoke badly about the new postponement, agrees. What to expect next in this long-playing series? While we are waiting for October 17, where Boris Johnson will try to reach an agreement at the European Council summit, in my opinion, the extension of this Santa Barbara for another season is inevitable. Today, in terms of the economic calendar, we have only open vacancies in the United States labor market (JOLTS), where a slight decline of 7.348M – 7.311M is expected. Further development Analyzing the current trading chart, we see a clear emergence of a cumulative process, with the conditional limits of 1.1015/1.1060. What is the reaction of the traders? Yes, in principle, no, the work is being done in terms of analysis, waiting for further steps regarding the existing framework. It is likely to assume that the sluggish fluctuation will continue for some time in the market, where either we will see a breakdown or everything will be delayed until the ECB meeting on September 12. There is another option – this is the EU's spontaneous answers towards the divorce process, in particular, the postponement, but the euro has already managed to adapt so well to all this hype that it's not even sure that it will help. Based on the above information, we will derive trading recommendations:
Technical analysis Analyzing a different sector of timeframes (TF), we see a distinct versatile interest, and so, the short-term period has taken a neutral position, the intraday perspective is a variable upward position, but the medium-term side maintains a downward position. Volatility per week / Measurement of volatility: Month; Quarter; Year. Measurement of volatility reflects the average daily fluctuation, calculated for the Month / Quarter / Year. (September 10 was built taking into account the time of publication of the article) The current time volatility is 23 points. If the accumulation process drags on, then we will not see high volatility soon, thereby waiting for a breakdown and a spontaneous information background. Key level Resistance zones: 1.1100**; 1.1180*; 1.1300**; 1.1450; 1.1550; 1.1650*; 1.1720**; 1.1850**; 1.2100 Support zones: 1.1000***; 1.0850**; 1.0500***; 1.0350**; 1.0000***. * Periodic level ** Range level *** Psychological level **** The article is based on the principle of conducting transactions, with daily adjustments. The material has been provided by InstaForex Company - www.instaforex.com |
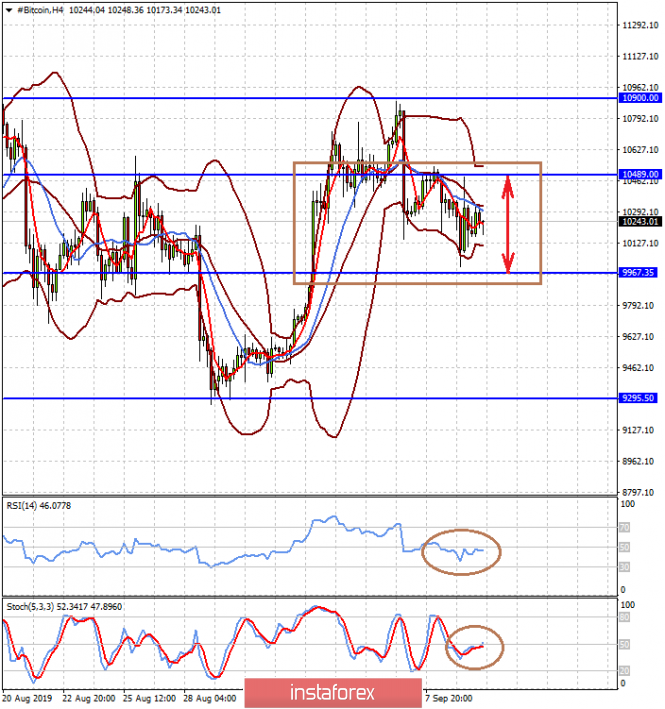
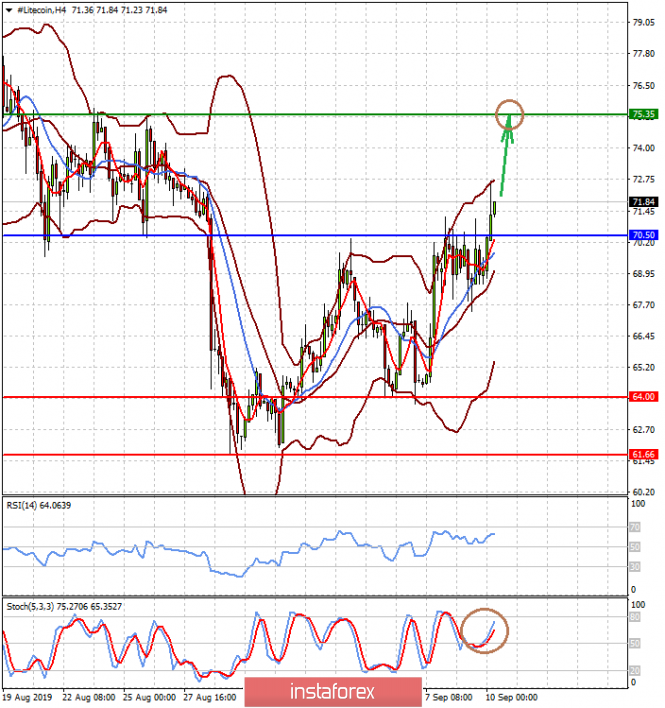
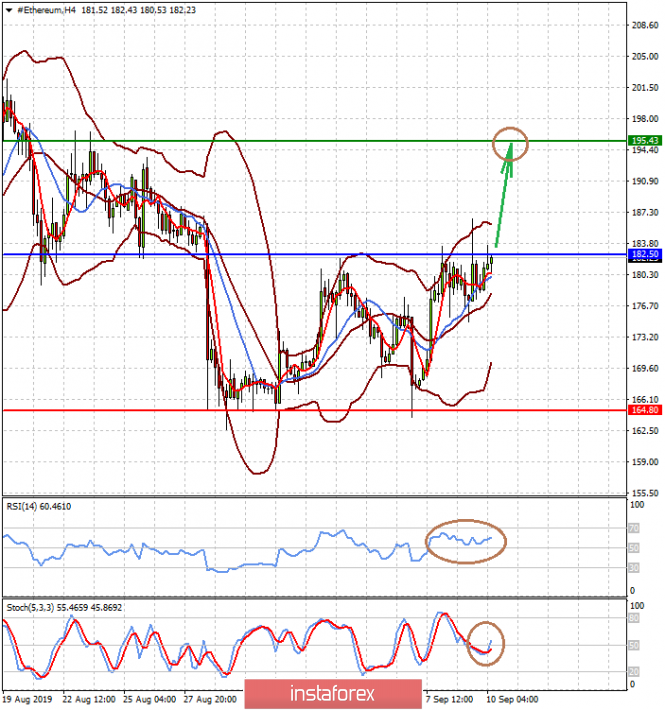
| Posted: 10 Sep 2019 05:22 AM PDT While the cryptocurrency market is expanding, and interest in these assets remains at a high level due to the attention to this topic of the largest world companies, such as Apple, investors are trying to understand what can be expected in this specific market in the near future. Earlier, cryptocurrency market analysts quite justifiably stated that there are no fundamental factors that could suggest to investors possible directions of the movement of cryptocurrency rates so far. However,the situation began to change gradually. Now, after the boom of interest in these tools at the end of 2017 (when the value of the assets of this market soared up), it is necessary not only to evaluate from a technical point of view the likely dynamics of assets in order to "enter" the market with a high degree of probability, but also to use the manifested interdependencies with the behavior of traditional financial instruments and news flows. In our analysis, we adhere to the emerging situation of a certain mirroring in the behavior of the dollar and cryptocurrencies traded for the same dollar, as well as the dynamics of the dollar and Chinese yuan, and the behavior of the American stock market. In our opinion, one should pay attention to the fundamental reasons that drive the exchange rate of the American currency and take them into account in the analysis. A clear weakening of the dollar is supporting cryptocurrencies, but it should be recognized that until the situation with the future monetary policy of the Fed is clarified, we do not expect any specific directional movements. Therefore, we are of the opinion that the general sideways trend will continue until the Fed meeting. After the opening of Monday trading in the United States, quotes of the cryptocurrency three came under pressure in the wake of positive dynamics in the stock market. Before the start of trading, the pairs including BTC/USD, LTC/USD and ETH/USD rose sharply but also retreated dynamically despite the weakening dollar against a basket of major currencies. We believe that if such market sentiment persists and such a probability does occur, then the dynamics of the three cryptocurrency pairs will be formed in rather narrow ranges until the end of this week. After the publication of data on inflation in China on Tuesday, which unexpectedly intensified, the renminbi began to grow, which, in our opinion, was the reason for the local increase in the LTC/USD pair. However, while the other pairs - BTC / USD and ETH / USD - did not show activity, these remained in very narrow ranges. Technical picture and trading ideas: In the short term, we expect the Bitcoin/USD pair to remain in a wide range of 9295.50-10900.00 in the wake of waiting for news on the topic of the trade conflict between the US and China. Today, it is likely that the pair will remain in an even narrower range of 9967.35-10489.00. The Litecoin/USD pair has broken out from the level of 70.50 in the wake of the local appreciation of the renminbi against the US dollar. Holding above this mark, it is likely that it will continue to grow to 75.35. The Ethereum/USD pair still remains in the lateral range 164.80-182.50. However, if it overcomes the level of 182.50, there is a high probability that it will continue to increase to 195.43. |
| British pound shows strength against the Japanese yen Posted: 10 Sep 2019 05:06 AM PDT The revival of demand for safe assets plays into the hands of the Japanese yen paired with the pound and holds back growth, but positive news regarding Brexit may support the British pound. As it turned out, the bulls were not very impressed with the optimistic report on jobs in the UK, and the GBP/JPY pair fluctuates between weak profits and insignificant losses near more than a month high. The pound gained amid positive news and recovered from a multi-year low to 1.3300, primarily due to optimism about Brexit. Recall that the British Parliament passed a law prescribing control over the Brexit program. The bulls of this pair were impressed mainly because of the positive data on employment in the UK. Moreover, the prevailing cautious moods provided a slight increase in the relative safe-haven of the Japanese yen and restrained further growth of the pound. The data showed that the average weekly wage in the UK, including bonuses, increased by 4.0% in July compared with the previous month, and the unemployment rate fell to 3.8%. Given these factors, it can be assumed that the pound is likely to feel the recently received positive momentum and conquer a new peak. |


| You are subscribed to email updates from Forex analysis review. To stop receiving these emails, you may unsubscribe now. | Email delivery powered by Google |
| Google, 1600 Amphitheatre Parkway, Mountain View, CA 94043, United States | |
No comments:
Post a Comment