
Forex analysis review |
- Forecast for EUR/USD on September 27, 2019
- Forecast for GBP/USD on September 27, 2019
- #USDX vs EUR / USD vs GBP / USD vs USD / JPY - H4. Comprehensive analysis of movement options from September 27, 2019 APLs
- GBP/USD. September 26. Results of the day. Boris Johnson's new strategy
- EUR/USD. September 26. Results of the day. The euro has updated two-year lows and is ready to fall further
- The British Parliament resumed work, the political crisis in Great Britain is gaining momentum
- EURUSD: Bad news for euro buyers. The expected recession in the eurozone will maintain a long-term bearish trend
- September 26, 2019 : EUR/USD Intraday technical analysis and trade recommendations.
- September 26, 2019 : GBP/USD Intraday technical analysis and trade recommendations.
- 4 hour Ichimoku cloud indicator analysis of USDJPY
- Gold remains above key support of $1,500 but looks vulnerable
- GBP/USD 09.26.2019 - Conrimed Head and Shoulders pattern for the downside
- Gold 09.26.2019 - Selling climax in the background, potential rally into the play
- BTC 09.26.2019 -Strong down momentum in the background, watch for selling opportunities
- NZD / USD: "Quiet" RBNZ meeting supported New Zealander
- The dollar shows unexpected strength, the euro goes on thin ice, and the yen is preparing for the worst
- Fractal analysis for major currency pairs as of September 26
- GBP/USD: plan for the American session on September 26th. Morning divergence kept the pound from a larger wave of decline
- EUR/USD: plan for the American session on September 26. Euro buyers have only hope for the level of 1.0930
- Technical analysis of AUD/USD for September 26, 2019
- Bets made: the pound turned out to be a bargaining chip?
- Trading recommendations for the EURUSD currency pair – placement of trade orders (September 26)
- Trading plan for EUR / USD and GBP / USD pairs on 09/26/2019
- Control zones for USD / CAD pair on 09/26/19
- Bitcoin's secret fear: will it really collapse again?
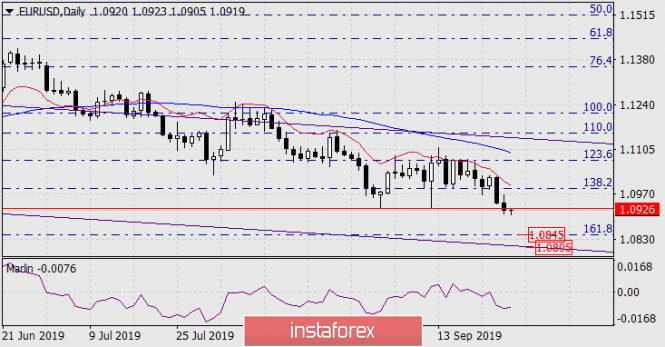
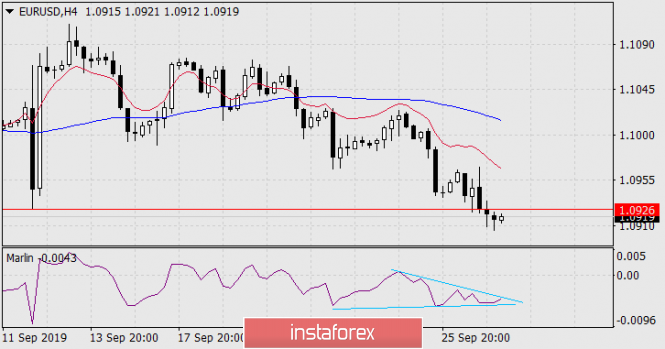
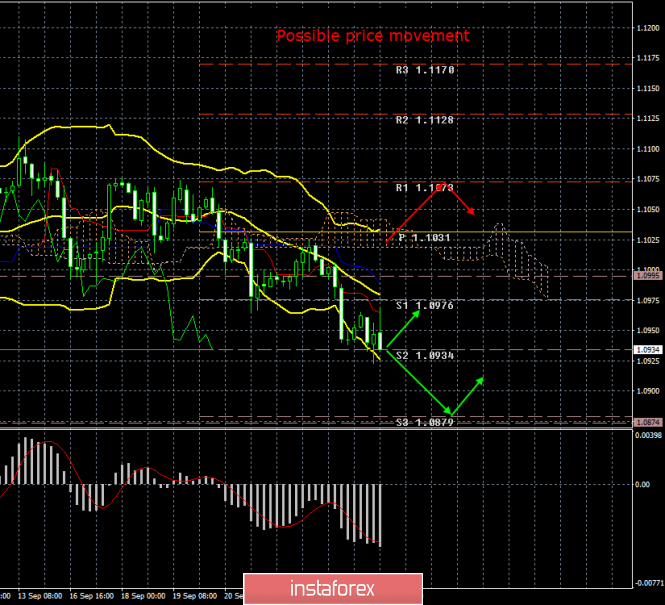
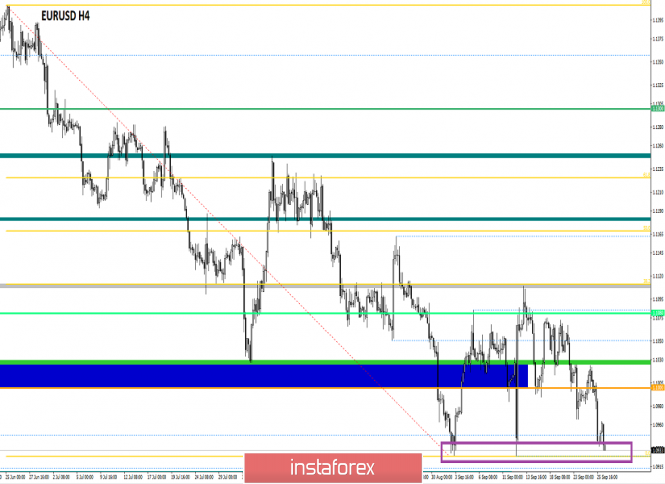
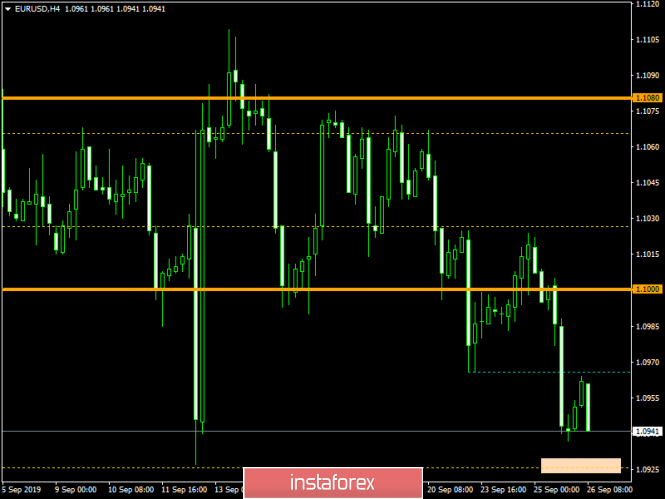
| Forecast for EUR/USD on September 27, 2019 Posted: 26 Sep 2019 08:16 PM PDT EUR/USD On Thursday, amid a calm political background, the euro pushed through the signal support of 1.0926 and is now ready to work out the target range of 1.0805/45. The final estimate of US GDP for the 2nd quarter remained unchanged at 2.0%, which supported moderate optimism in the market. Today, orders for durable goods for August are expected to decrease by -1.1%, but personal income is projected to grow by 0.4%, as well as expenditures by 0.3%. Taking into account yesterday's data on incomplete sales in the secondary market at 1.6% against the forecast of 1.0%, as well as rising indicators for real estate prices and growth in consumer confidence released this week, data on expenses and income may even exceed expectations. which can become the main news of the day. Technically, on the daily chart, the situation is completely falling - chart indicators and the oscillator in a downward position. On the four-hour chart, there is also a downward trend; price below the lines of balance and MACD, the signal line of the Marlin oscillator forms a kind of triangle, which may be a sign of a continuation of the downward trend. |
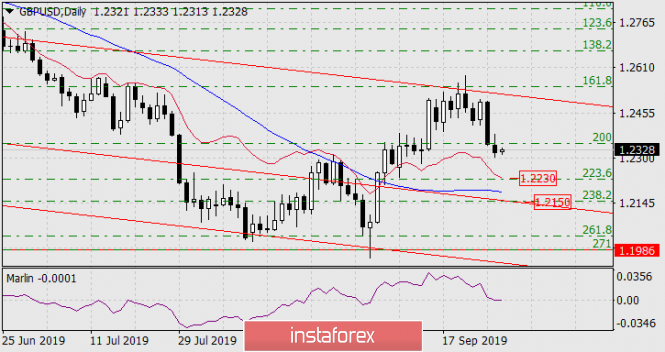
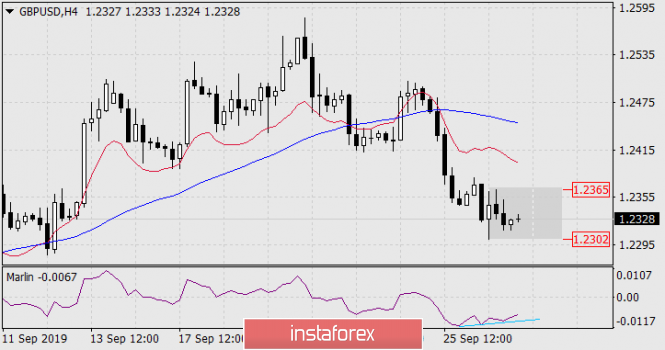
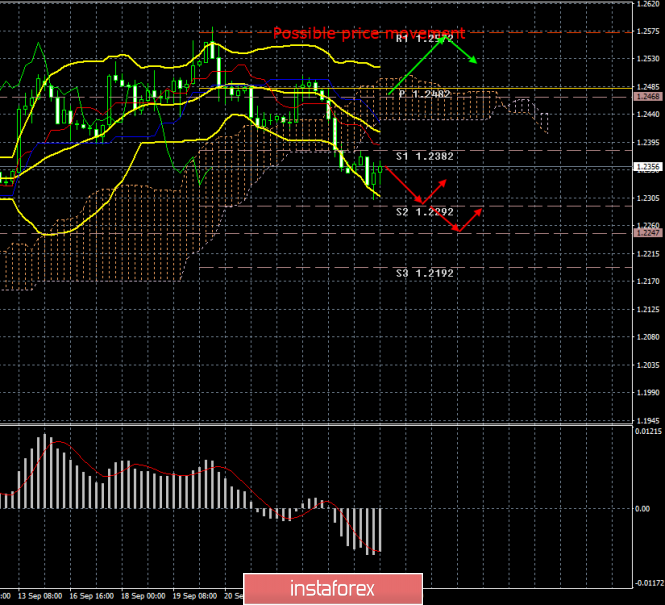
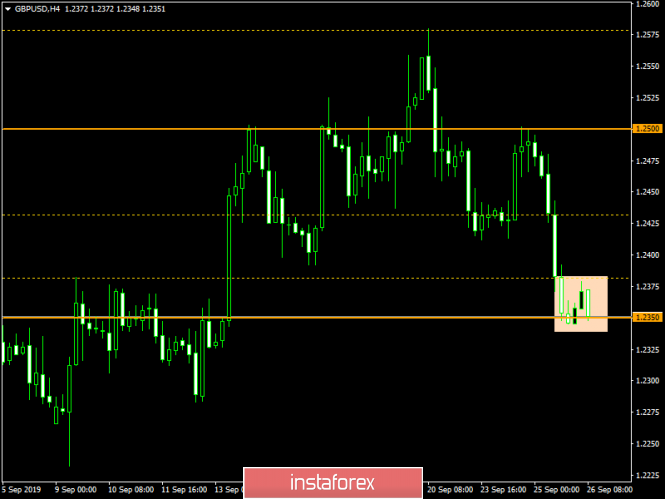
| Forecast for GBP/USD on September 27, 2019 Posted: 26 Sep 2019 08:16 PM PDT GBP/USD The British pound slightly fell yesterday, gaining a foothold at the Fibonacci level of 200.0% on the daily chart. The Marlin oscillator is introducing itself into the zone of negative numbers - into the decreasing trend zone. The 1.2230 target, defined by the Fibonacci level of 223.6%, has become relevant. Below it is the second target at 1.2150 - the level of 238.2%. The MACD line gravitates towards it. On a four-hour chart, the Marlin oscillator shows a small and weak, but double convergence. This can be realized in price consolidation in the gray box marked on the chart. Upon completion of the consolidation (or without it), we are waiting for the price at target levels. |
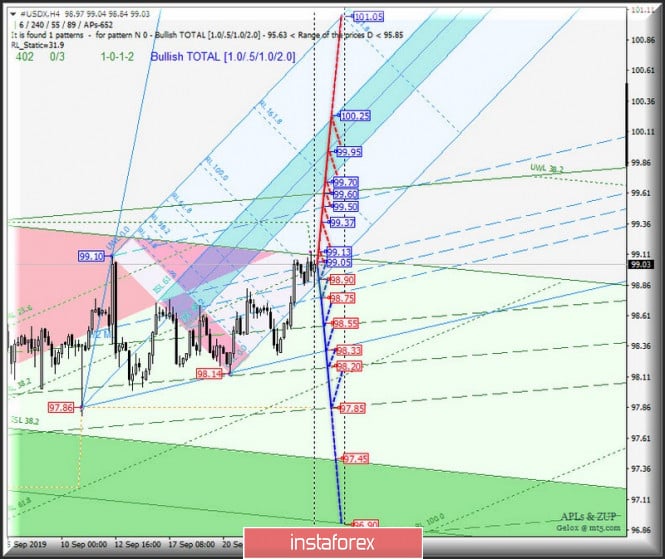
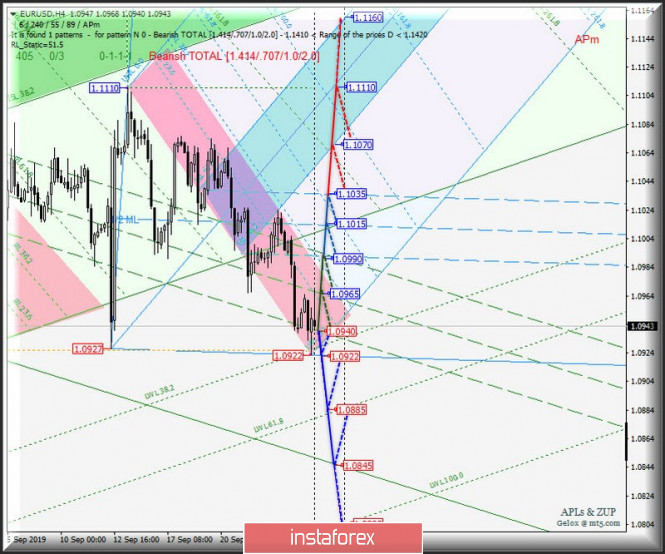
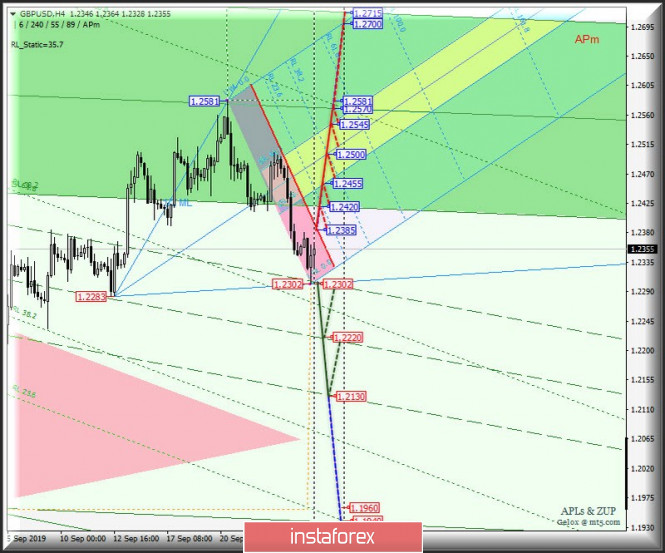
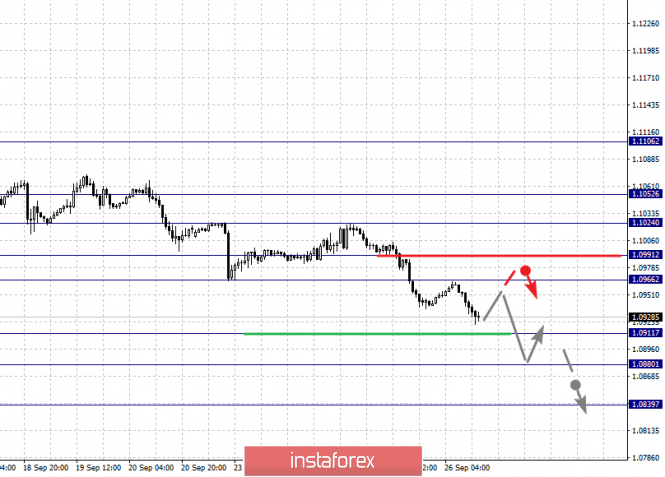
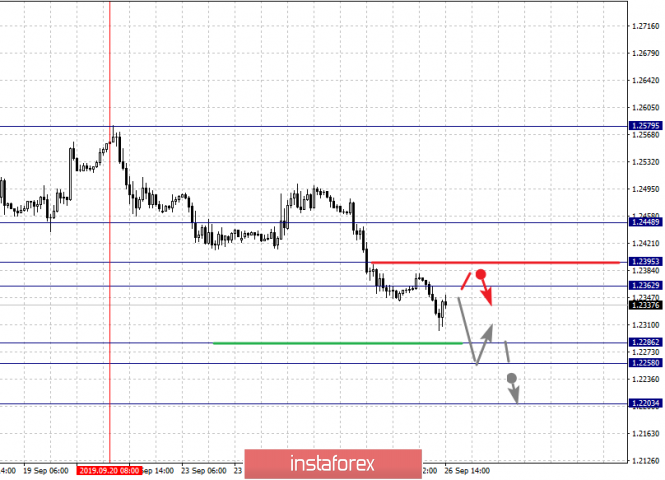
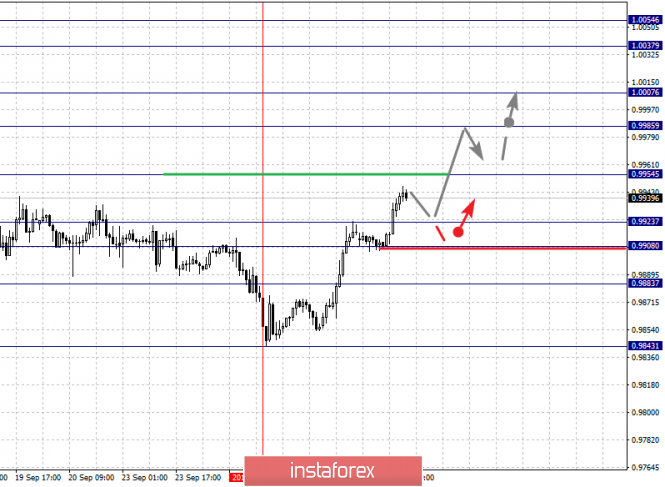
| Posted: 26 Sep 2019 06:06 PM PDT Let me bring to your attention, in an integrated form, the development options for the movement of currency instruments #USDX, EUR / USD, GBP / USD and USD / JPY from September 27, 2019. Minuette operational scale (H4 time frame) ____________________ US dollar index Starting from September 27, 2019, the development of the #USDX dollar index movement will continue to be determined by the development and direction of the breakdown of the boundaries of the 1/2 Median Line channel (99.05 - 98.90 - 98.75) of the Minuette operational scale fork. We look at the animated chart for working out the levels above. A combined breakdown of the upper boundary of the 1/2 channel Median Line Minuette (resistance level of 99.05) and the initial SSL line (99.13) of the Minuette operational scale fork will make it relevant to continue the development of the upward movement of the dollar index to targets - local maximum 99.37 - final Schiff Line Minuette (99.50) - control line UTL Minuette (99.60) - equilibrium zone (99.70 - 99.95 - 100.25) of the Minuette operational scale fork. On the contrary, in case of breakdown of the lower boundary of the 1/2 Median Line channel (support level of 98.75) of the Minuette operational scale forks, it will be possible to develop a downward movement of #USDX to the boundaries of the 1/2 Median Line channel (98.55 - 98.20 - 97.85) of the Minuette operational scale forks. The details of the #USDX movement are presented in the animated chart. ____________________ Euro vs US dollar From September 27, 2019, the movement of the single European currency EUR / USD will continue to depend on the development and direction of the breakdown of the boundaries of 1/2 Median Line channel (1.0990 - 1.0965 - 1.0940) of the Minuette operational scale fork. The movement markings inside the mentioned channel are shown in the animated chart. In case of breakdown of the lower boundary of the 1/2 Median Line channel (support level of 1.0940) of the Minuette operational scale fork, the outgoing movement of the single European currency may continue to target - local minimum 1.0922 - warning line LWL61.8 Minuette (1.0885) - control line LTL Minuette (1.0845) Meanwhile, the breakdown of the upper boundary of the 1/2 Median Line channel (resistance level of 1.0990) of the Minuette operational scale fork will confirm that further development of the EUR / USD movement will begin to occur in the 1/2 Median Line Minuette channel (1.0990 - 1.1015 - 1.1035) with the prospect of reaching the equilibrium zone boundaries (1.1070 - 1.1110 - 1.1160) of the Minuette operational scale fork. The details of the EUR / USD movement options are shown in the animated chart. ____________________ Great Britain pound vs US dollar On the other hand, the development of Her Majesty's GBP / USD currency movement from September 27, 2019 will be determined by the direction of the breakdown of the range :
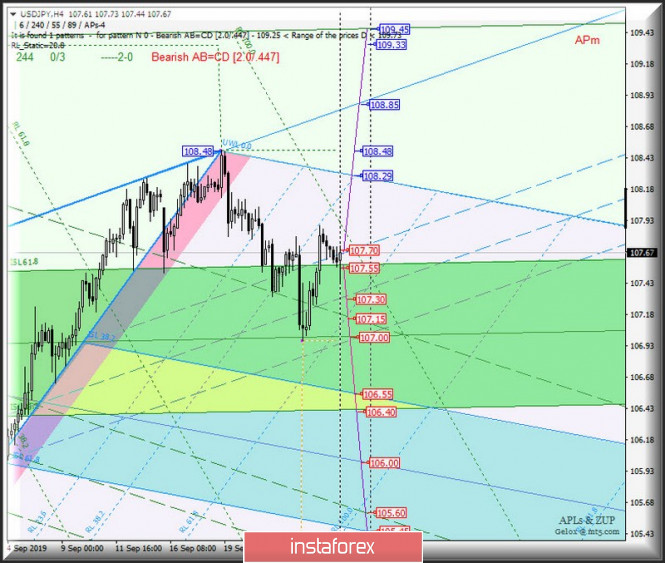
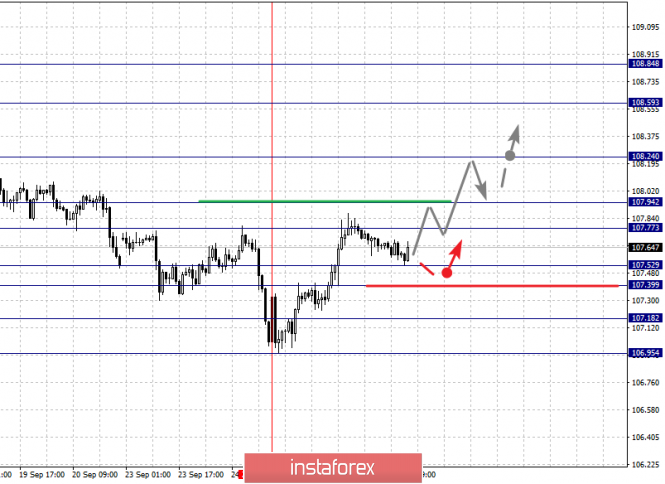
In case of breakdown of the support level of 1.2302, the development of Her Majesty's currency movement will continue in the 1/2 Median Line channel (1.2302 - 1.2220 - 1.2130) of the Minuette operational scale fork. However, the breakdown of the resistance level 1.2385 at the boundary of the red zone of the Minuette operational scale fork, it will become possible to develop an upward movement of GBP / USD towards the targets - the lower boundary of the ISL38.2 (1.2420) equilibrium zone of the Minuette operational scale fork- the zone of equilibrium (1.2455 - 1.2500 - 1.2545) of the Minuette operational scale fork - the Median Line Minuette (1.2570). The details of the GBP / USD movement can be seen in the animated chart. ____________________ US dollar vs Japanese yen Similarly, the currency movement of the "country of the rising sun" USD / JPY from September 27, 2019 will also depend on the development and direction of the breakdown of the range :
The breakdown of the upper boundary of the 1/2 Median Line Minuette channel (resistance level of 107.70) will determine the continued development of the upward movement of the currency of the "country of the rising sun" to the initial SSL line (108.29) of the Minuette operational scale forks with the prospect of updating the local maximum of 108.48 and reaching the UTL Minuette control line (108.85). On the contrary, the breakdown of ISL61.8 Minuette (support level of 107.55) - JPY / USD movement will continue in the equilibrium zone (107.55 - 107.00 - 106.40) of the Minuette operational scale fork taking into account the development - 1/2 Median Line Minuette (107.30) - final Schiff Line Minuette (107.15) - the upper bounday of ISL38.2 (106.55) of the equilibrium zone of the Minuette operational scale fork. We look at the details of the USD / JPY movement in the animated chart. ____________________ The review is made without taking into account the news background. Thus, the opening of trading sessions of the main financial centers does not serve as a guide to action (placing orders "sell" or "buy"). The formula for calculating the dollar index : USDX = 50.14348112 * USDEUR0.576 * USDJPY0.136 * USDGBP0.119 * USDCAD0.091 * USDSEK0.042 * USDCHF0.036. where the power coefficients correspond to the weights of the currencies in the basket: Euro - 57.6% ; Yen - 13.6% ; Pound Sterling - 11.9% ; Canadian dollar - 9.1%; Swedish Krona - 4.2%; Swiss franc - 3.6%. The first coefficient in the formula leads the index to 100 at the start date of the countdown - March 1973, when the main currencies began to be freely quoted relative to each other. The material has been provided by InstaForex Company - www.instaforex.com |
| GBP/USD. September 26. Results of the day. Boris Johnson's new strategy Posted: 26 Sep 2019 03:38 PM PDT 4-hour timeframe Amplitude of the last 5 days (high-low): 122p - 124p - 78p - 88p - 150p. Average volatility over the past 5 days: 112p (high). All the most interesting news for the GBP/USD pair continues to come from the UK Parliament. The pound sterling, which resumed falling against the US currency on September 20, continues to decline. Today we would like to elaborate on Boris Johnson's new strategy of action, of course, if it can be called a strategy. The prime minister's latest speeches suggest that Johnson will do his best to achieve not a hard Brexit, but a Brexit "at any cost", any possible Brexit, but re-elections to Parliament. It is in this that he sees a solution to the impasse in which the British government has fallen and has been in since the first blocking of Theresa May's "deal" with the European Union. The problem is that the two "divorce" options proposed by the two prime ministers with the European Union, which had a real opportunity to be executed, did not suit the majority of the MPs. All the proposals of the prime ministers were rejected, and the country remained in the UK and since March 29, the date of Brexit is simply permanently postponed to a later date. Now the moment of the next deadline is approaching, and the Parliament has already blocked the hard Brexit, which Johnson wanted to implement. Threats of the prime minister to carry out Brexit despite the ban of Parliament did not work, as Johnson himself understands that this will be followed not just by a vote of no confidence, but also criminal proceedings. Given the cancellation of the Supreme Court prorogation of Parliament, which can be interpreted as abuse of power by Boris Johnson, now any of his unauthorized action by Parliament will be considered in court and punished to the fullest extent of the law. Johnson and the MPs understands. It is also clear to everyone that if the current composition of the Parliament can not collect the necessary number of votes to authorize Brexit, the composition needs to be changed. However, the MPs themselves are not interested in early elections. The main opposition party - the Labour Party - led by Johnson's main opponent Jeremy Corbyn, is not interested in this either. According to the Labour Party, first the government should postpone Brexit to January 31, 2020, and only then it will be possible to talk about re-elections. Otherwise, the opposition fears, the new Parliament could approve Johnson's" hard " Brexit by October 31. Well, Johnson's feint in the course of his last speech, in which he literally proposed to pass him a vote of no confidence, is the next populist step. With this proposal, he, firstly, showed that he was ready for such a step by the opposition, and secondly, it was this step of the MPs that could lead to re-election. Thus, it can already be said that until the moment when Johnson has to ask Brussels to postpone Brexit (unless, of course, Johnson does not agree to a direct violation of the law), the deputies will not declare him a vote. Traders of the pound/dollar currency pair now have to wait for the further development of events on the Brexit topic, because now everything depends on it. Sooner or later, Boris Johnson will begin to take any action that will be closely scrutinized by market participants and depending on the nature of the pound will go up or continue to fall in price. From a technical point of view, the pair consolidated below 1.2382, the sell signal from Ichimoku is strong, and the Bollinger bands turned down. Thus, the downward movement may continue. Trading recommendations: The GBP/USD currency pair is currently moving down. Thus, it is now recommended that the pound be sold with targets at 1.2292 and 1.2247. It is recommended to return to the pair's purchases no earlier than when the price consolidates above the Kijun-sen critical line. In addition to the technical picture, fundamental data and the time of their release should also be taken into account. Explanation of the illustration: Ichimoku indicator: Tenkan-sen is the red line. Kijun-sen is the blue line. Senkou Span A - light brown dotted line. Senkou Span B - light purple dashed line. Chikou Span - green line. Bollinger Bands Indicator: 3 yellow lines. MACD indicator: Red line and bar graph with white bars in the indicator window. The material has been provided by InstaForex Company - www.instaforex.com |
| Posted: 26 Sep 2019 03:38 PM PDT 4-hour timeframe Amplitude of the last 5 days (high-low): 51p - 72p - 60p - 40p - 84p. Average volatility over the past 5 days: 61p (average). The EUR/USD currency pair continues not too hastily, but surely to slide down. Despite the fact that in recent days there was not too much important information from the European Union and the United States, traders continue to sell the currency of the European Union, buying in exchange for US dollars. Today, the pair managed to break through the low of the "double bottom" pattern, which gave hope to traders for the formation of an upward trend. However, the general fundamental background, which we have already written about many times, does not provide the bulls a reason to "engage in battle." Now we have a triple bottom pattern, which has every chance to cancel today or tomorrow, and the currency pair will continue to fall in this case. The technical picture fully supports this particular scenario, since all indicators are directed downward. Today, the United States published annual GDP data. According to the Bureau of Economic Analysis, an increase of 2.0% in the second quarter was recorded, which is fully consistent with the forecast values. It completely coincides with the forecast that gives reason to assume that the reasons for the euro's new fall are not directly related to recent macroeconomic reports. The index of personal consumption expenditures in the US for the second quarter was also published today, which exceeded forecast values and amounted to +1.9%. However, the euro updated its lows at the European trading session, and not at the US session, when the data were published. Thus, the conclusions remain the same: the euro/dollar continued to get cheaper, despite the possible impeachment of Donald Trump, despite the trade wars of the US president, despite the easing of the monetary policy of the Federal Reserve. It will continue to become cheaper until serious changes in the positive direction begin to be observed in the economy of the European Union. But each week we have an old picture: macroeconomic indicators of the European Union are falling, business activity in the manufacturing sector has been in the "recession zone" for several months, and Mario Draghi himself said that this recession could negatively affect other economic indicators. "May reflect" in our case means "must reflect". In addition to all the problems of an economic nature in the eurozone, administrative problems also begin. Today, September 26, it became known that a member of the ECB Board of Governors, Sabina Luatenshlager, has resigned. Lautenschlager voluntarily leaves her post without providing reasons. However, it is known that Lautenschlager is an opponent of the policy of ultra-low rates, opposed a new easing of monetary policy and the resumption of the asset purchase program. Here is such a departure from the post of one of the members of the board of governors - this is another bad news for the euro. Everyone immediately remembers what the picture was in the British Parliament about a year ago, when ministers and other high-ranking officials who disagreed with Theresa May's policy left their posts one by one. In principle, the same thing goes on under Boris Johnson. In simple words, this means "escaping from a sinking ship." But no one "escapes from the ship" if it would not sink and there are no problems. One could assume that the problem in Mario Draghi, for example, is an internal conflict or disagreement with his policies. However, Draghi is set to leave his post after a month from now. Thus, nothing changes for the euro, and we expect the pair to continue to fall. The only hope is at the level of 1.0926, if it stands, then an upward correction is possible. However, in the current conditions, it is a correction. Looking at the older timeframe, a downtrend is clearly visible, which suggests a further fall in the euro / dollar pair. Trading recommendations: The EUR/USD pair resumed the downward movement. A price rebound from the second support level of 1.0934 may trigger a round of corrective movement, but this correction has not begun in the last 11 hours. Therefore, it is recommended to stay in short positions while aiming for 1.0879. In order for purchase orders to become relevant, it is recommended to wait until the Ichimoku cloud is consolidated above. In addition to the technical picture, fundamental data and the time of their release should also be taken into account. Explanation of the illustration: Ichimoku indicator: Tenkan-sen is the red line. Kijun-sen is the blue line. Senkou Span A - light brown dotted line. Senkou Span B - light purple dashed line. Chikou Span - green line. Bollinger Bands Indicator: 3 yellow lines. MACD indicator: Red line and bar graph with white bars in the indicator window. The material has been provided by InstaForex Company - www.instaforex.com |
| The British Parliament resumed work, the political crisis in Great Britain is gaining momentum Posted: 26 Sep 2019 03:38 PM PDT The joy of the bulls on GBP/USD from the verdict of the Supreme Court of Great Britain, which recognized the actions of the country's Prime Minister Boris Johnson to suspend the national Parliament as unlawful, was short-lived, since there was no further clarity in the Brexit process. Moreover, the hopes that the head of government, oppressed by a series of defeats, would step down, did not materialize. The House of Commons resumed its work, and a number of deputies urged B. Johnson to resign, to which he replied that he wanted to hold Brexit and accused the MPs of a sabotage. "Apparently, the Parliament does not want the British exit from the EU to take place at all. Parliament should either step aside and allow Brexit to take place or a vote of no confidence in the government be passed and ultimately face the voters," he said. At the same time, the prime minister noted that he was ready for such a turn of events, but recalled that the last step with respect to the cabinet would mean early elections, and suggested that the head of the Labor Party, Jeremy Corbyn, is trying to evade them. "Does Corbyn still want to be prime minister?" Why won't Labour allow him to cast his spell on the electorate? Is it because they are not only afraid that he will lose, but are even more afraid of the illusive possibility that he can win?" B. Johnson said. It is worth noting that if the leader of the Scottish National Party, Nicola Sturgeon, stated that the opposition should pass a vote of no confidence in the prime minister, if he does not resign, then Jeremy Corbyn takes a more restrained position. He reiterated his willingness to support early elections only after agreeing on a new Brexit postponement. Thus, B. Johnson is still at the helm of the cabinet, the risks of early elections have not disappeared, there is still no "divorce" agreement, as well as the confidence that the Brexit deadline will be postponed from October 31 to October January 31st. The British prime minister refuses to ask Brussels about this, and claims that if necessary, he will withdraw the country from the EU on October 31 without a deal. As for the pound, if the bulls in GBP/USD manage to cling to support at 1.2295-1.231, then the British currency will be able to attract new buyers. If the bears succeed in pushing the level of 1.2315, then this will increase the risk of a further decline to 1.2270 and further to 1.2200. The material has been provided by InstaForex Company - www.instaforex.com |
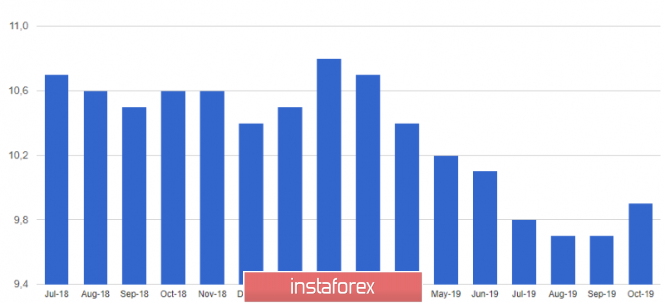
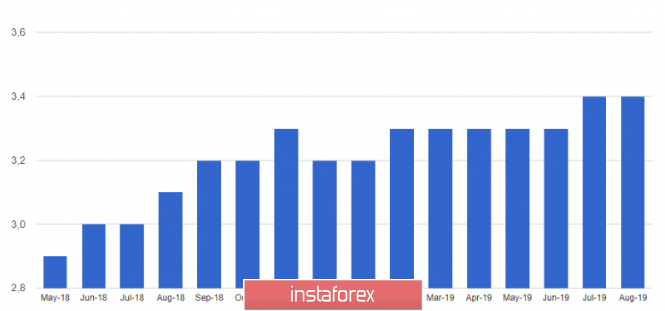
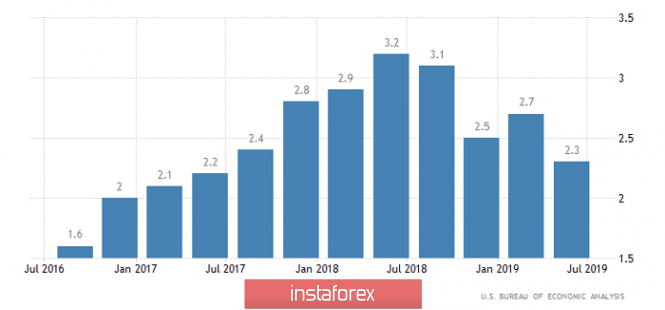
| Posted: 26 Sep 2019 03:38 PM PDT The euro continued to decline on Thursday against a number of world currencies amid growing pessimism associated with an increased risk of recession in the eurozone. The fundamental data released in the morning on the growth of German consumer sentiment did not affect risky assets. Most likely, the medium-term pressure on the euro will continue further, since the fears that the eurozone will soon face a recession are not unfounded. The economy of Germany alone is close to a technical recession, and weak production activity in a number of countries in the eurozone, which is likely to continue to decline further, pulling down other sectors. At the same time, the US economy retains its strength, which today will once again be convinced by the report on GDP growth for the second quarter of this year. Today, the president of the European Central Bank will also make an announcement, which will certainly make a number of statements on the topic of interest rates and provide a forecast on monetary policy. The pessimism of euro buyers is due to the fact that the European Central Bank, compared with the US Federal Reserve, has little room to lower rates in order to stimulate the economy, which once again confirms the likelihood of a real recession in the eurozone economy in the coming years. A number of economists expect eurozone GDP growth to be only 1% in 2019 and only 0.7% in 2020. Thus, the long-term bearish trend in the euro, which strives for the lows of 2017, will continue further, albeit with slight upward corrections. As I noted above, consumer sentiment in Germany will improve in October this year, and this will happen due to the launch of measures to stimulate economic growth, which were announced during the September meeting of the European Central Bank. According to the GfK research group, the consumer confidence index in Germany in October 2109 should show growth to 9.9 points from 9.7 points in September. Economists assumed that the indicator would remain unchanged at 9.7 points. However, the situation may change dramatically if, by the end of October, the situation with Brexit does not become clearer, and US trade conflicts with China and the eurozone worsen. The indicator of economic expectations in September rose to -9.0 points, while the indicator of expectations regarding own income fell to 46.8 points from 50.1 points in August. Data on growth in lending to companies in the eurozone in August also did not return demand for the European currency. Despite this, the growth of lending indicates the preservation of momentum in the economy of the region. The report of the European Central Bank indicated that the annual growth in lending to non-financial corporations accelerated to 4.3% in August from 4% in July. But lending to eurozone households grew by 3.4% in August, as in July. The growth of the M3 monetary aggregate amounted to 5.7% in August versus 5.1% in July, while economists had forecast an increase of 5.1%. As for the technical picture of the EURUSD pair, sellers of risky assets pushed the trading instrument to new lows this year and updated support at 1.0925. However, further downward potential directly depends on the speech of the head of the ECB. A break of the low of the year will lead to a further downward trend of the euro with a test level of 1.0840 and 1.0800. In the upward correction scenario, the upper boundary of the short-term downward channel is seen in the resistance area of 1.0971. The material has been provided by InstaForex Company - www.instaforex.com |
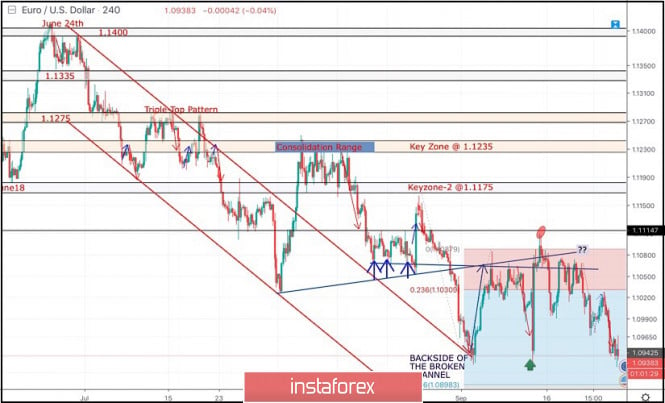
| September 26, 2019 : EUR/USD Intraday technical analysis and trade recommendations. Posted: 26 Sep 2019 09:26 AM PDT
On September 5, the EUR/USD pair was testing the backside of both broken trends around 1.1060-1.1080 where significant bearish pressure was demonstrated pushing the pair directly towards 1.0940 (Prominent Weekly Bottom). Bearish Breakout below the price level of 1.0940 was needed to enhance further bearish decline towards 1.0900 and 1.0840 (Fibonacci Expansion Key-Levels). However, considerable bullish rejection was demonstrated as a quick bullish spike towards 1.1100 where another episode of bearish pressure was expressed. By the end of last week's consolidations, Bearish Breakout below 1.1030 was demonstrated. This renders the recent bullish spike as a bullish trap. As Expected, the recent bullish pullback towards the price level of 1.1030 was obviously rejected by the end of Tuesday's consolidations. Currently, the EUR/USD is demonstrating a long-term Double-TOP pattern extending between (1.0930 - 1.1080) with neckline located around 1.0940. Bearish persistence below 1.0940 confirms this long-term pattern. Pattern projection target would be located around 1.0840. In the short-term, Bearish persistence below the price level of 1.0970 (recent daily bottom) is mandatory to enhance more bearish decline towards 1.0930 and 1.0898 (Fibonacci Expansion 78.6%). Trade recommendations : Intraday traders who were advised to have a valid SELL entry around the price level of 1.1030 can gather their profits around the current price levels. Conservative traders should wait for a considerable bearish closure below 1.0940 for a valid SELL entry. Initial Target levels should be located at 1.0900, 1.0850 and 1.0830. The material has been provided by InstaForex Company - www.instaforex.com |
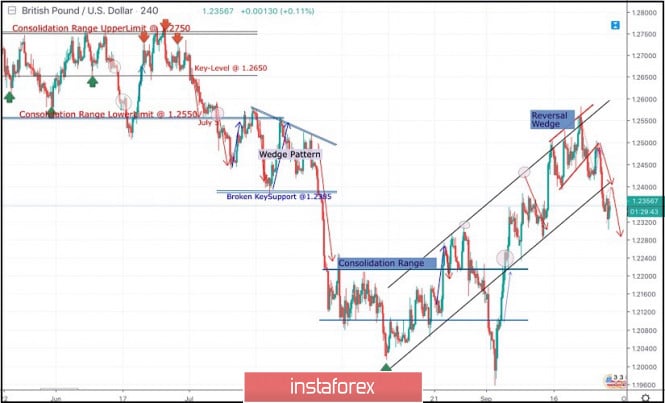
| September 26, 2019 : GBP/USD Intraday technical analysis and trade recommendations. Posted: 26 Sep 2019 08:39 AM PDT
In Early August, another consolidation-range was temporarily established between the price levels of (1.2100 - 1.2220) except on August 9 when temporary bearish decline below 1.2100 was executed towards 1.2025 (Previous Weekly-Bottom). Since then, the GBP/USD pair has been trending-up within the depicted bullish channel except on September 3 when a temporary bearish breakout was demonstrated towards 1.1960. Around the price level of 1.1960, aggressive signs of bullish recovery (Bullish Engulfing candlesticks) brought the GBPUSD back above 1.2230 where the pair looked overbought. However, further bullish momentum was demonstrated towards 1.2320 maintaining the bullish movement inside the depicted movement channel. Moreover, Temporary bullish advancement was demonstrated towards 1.2550 where a reversal wedge pattern was established. As anticipated, the reversal wedge pattern was confirmed by the end of Monday's consolidations supported by obvious bearish price action demonstrating a successful bearish closure below 1.2450. The Long-term outlook remains bearish as long as the most recent top established around 1.2500 remains defended by the GBP/USD bears. On Tuesday, the backside of the confirmed reversal wedge was successfully re-tested around 1.2500 where a new episode of bearish rejection was expressed. Bearish persistence below 1.2440-1.2400 (Reversal-Pattern Neckline) allowed more bearish decline to occur towards the price levels of 1.2360 and 1.2310 where early signs of bullish rejection is being demonstrated Today. Trade Recommendations: Conservative traders can wait for bullish pullback towards the backside of the broken channel (Anywhere around 1.2400) for another valid SELL entry. T/P level to be placed around 1.2360, 1.2330 and 1.2280 while S/L should be set as a H4 candlestick closure above 1.2450. The material has been provided by InstaForex Company - www.instaforex.com |
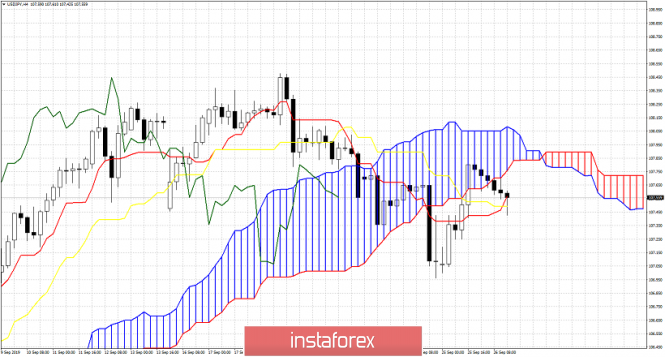
| 4 hour Ichimoku cloud indicator analysis of USDJPY Posted: 26 Sep 2019 07:42 AM PDT USDJPY has bounced off the 107 price level as expected and we now have a weak bullish signal by the Ichimoku cloud indicator as the tenkan-sen has crossed the kijun-sen. Recapturing 108 will give us another bullish signal with a cloud break out.
Red line - tenkan-sen Yellow line- Kijun-sen Green line - Chikou span In the 4 hour chart we have a weak bullish signal by tenkan-sen crossing above the kijun-sen. It is a weak signal because price is still below the cloud and the Chikou span is below price and inside the cloud. A break above 108 will strengthen the bullish scenario for the 4 hour chart. Support is at 107.50 and bulls need to hold prices above it. Otherwise we could see prices move towards 106 specially if price breaks below 107. The material has been provided by InstaForex Company - www.instaforex.com |
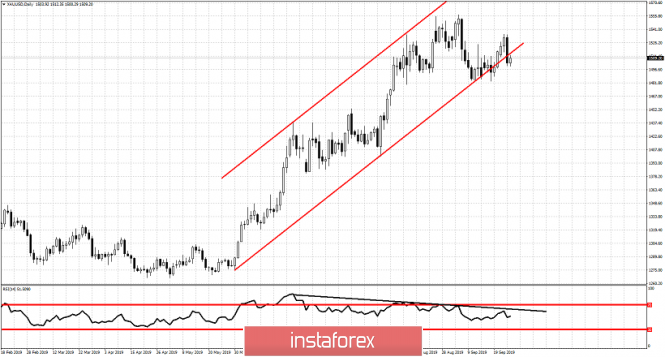
| Gold remains above key support of $1,500 but looks vulnerable Posted: 26 Sep 2019 07:33 AM PDT Gold price got rejected above $1,535 yesterday and bulls were unable to hold prices above short-term support and previous resistance at $1,525. The RSI not breaking out was the warning we gave yesterday.
Black line -RSI resistance trend line Gold price is breaking out and below the bullish channel. Price however remains above key short-term support at $1,500-$1,485 but unless we see Gold price above $1,525 soon, the chances for a new low towards $1,450-$1,400 will increase. The RSI as we warned yesterday can not break above the black downward sloping trend line resistance. Despite bulls recapturing $1,525, the inability for the RSI to break above its resistance was a worrying sign and we got confirmed. Price reversed strongly from $1,535 to $1,500. Keep a close eye on $1,500 as failure to hold above it will increase the chances of breaking $1,484 and moving lower towards $1,450. The material has been provided by InstaForex Company - www.instaforex.com |
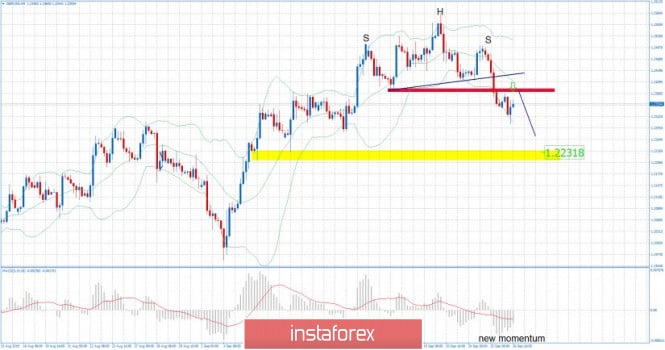
| GBP/USD 09.26.2019 - Conrimed Head and Shoulders pattern for the downside Posted: 26 Sep 2019 07:12 AM PDT GBP/USD has been trading downwards as we expected. The head and shoulders pattern is confirmed based on 4H time-frame and I do expect more downside yet to come. The downward target is set at the price of 1.2230.
Red rectangle – Important resistance level Yellow rectangles – Support level and objective target Purple falling line – Expected path MACD oscillator is showing the new momentum low in the background, which is indication for the domination of sellers. Any decent rally into the resistance may produce good sell entry. Support levels are seen at the price of 1.2304, 1.2282 and 1.2230. Resistance levels are set at 1.2380 and 1.2415. Watch for selling opportunities. The material has been provided by InstaForex Company - www.instaforex.com |
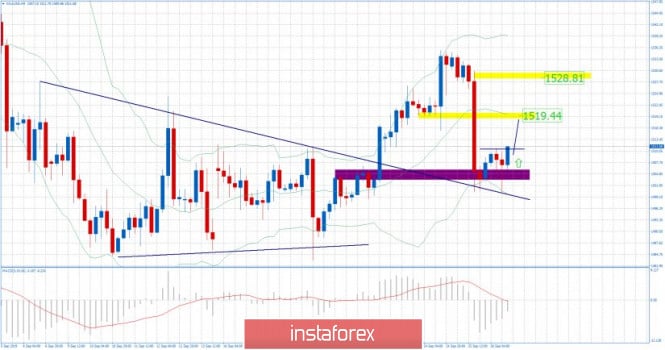
| Gold 09.26.2019 - Selling climax in the background, potential rally into the play Posted: 26 Sep 2019 06:45 AM PDT Gold got a strong drop yesterday and the level of $1,500 was tested. Anyhow, I see potential double bottom formation on the 4H time-frame, which is sign that there are still buyers on the Gold and that Gold might trade to $,519 and $1,528.
Purple rectangle – Important support level Yellow rectangles – Resistance levels and upward objectives Purple rising line – Expected path MACD oscillator is decreasing on the second test of the $1,500, which is sign that there is bullish divergence on the momentum. Support levels are seen at the price of $1,500 and $1,496. Resistance levels are seen at $1,519 and $1,528. Watch for potential buying opportunities as long as the level of $1,500 is holding. The material has been provided by InstaForex Company - www.instaforex.com |
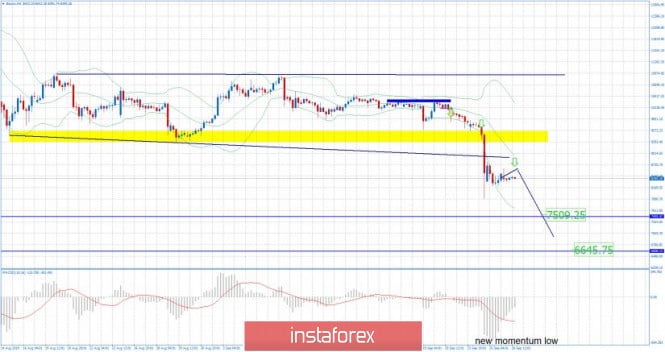
| BTC 09.26.2019 -Strong down momentum in the background, watch for selling opportunities Posted: 26 Sep 2019 06:34 AM PDT Bitcoin has been trading in consolidation mode in past 24 hours but I do expect more downside yet to come.
Blue horizontal lines – Important support levels and next objective targets Yellow rectangle – Broken support became resistance Purple falling line – Expected path My analysis from yesterday is still valid and it even adds more weakness due to no strong reaction from buyers.MACD oscillator is showing good new momentum down in the background and I do expect at least move lower. Support levels are seen at $7,900, $7,500 and $6,650. Resistance levels are seen at $8,800 and $9,500.Bulls need to be very cautious as there is strong downward momentum in the background and potential selling the rally type of feeling. Selling opportunities are still preferable.The material has been provided by InstaForex Company - www.instaforex.com |
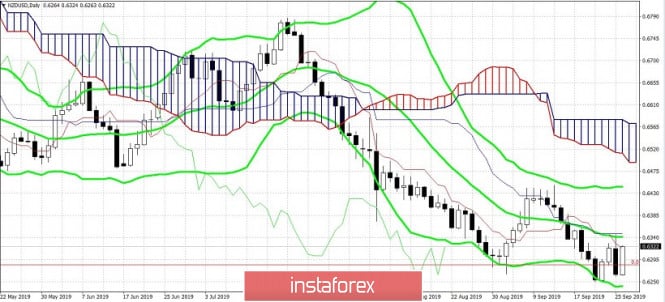
| NZD / USD: "Quiet" RBNZ meeting supported New Zealander Posted: 26 Sep 2019 06:34 AM PDT Amid high-profile political events in the United States, the market virtually ignored the September meeting of the Reserve Bank of New Zealand. Although it was the RBNZ that drew the line of the onset of the "era of monetary easing" this summer, lowering the interest rate by 50 basis points at once. But this time, the meeting of the regulator turned out to be quite "passing" and surprisingly optimistic. The New Zealand dollar reacted negatively to only one phrase of the head of the RBNZ Adrian Orr - that low-interest rates will remain for a long time, namely for many years. Such hopeless prospects put pressure on the Kiwi, and the pair indicated a local minimum of 0.6260 weeks. Nevertheless, the bears failed to develop downward impulse despite the general strengthening of the American currency. Today, the pair is testing the 63rd figure, remaining within 100-point price range at 0.6250-0.6350. It is worth noting here that the greenback now dominates almost all dollar pairs. This is especially pronounced in the EUR/USD, GBP/USD AND USD/CHF pairs. But against the backdrop of such hegemony of the buck, the New Zealander is still trying to show character, holding on to his gained position. Naturally, there is no talk of a trend reversal, however, downward prospects are now in great question. In all likelihood, the NZD/USD pair will move sideways in anticipation of the outcome of the US-Chinese talks. Let me remind you that on the eve of the September RBNZ meeting, many experts (the vast majority) were sure that the regulator would either lower the interest rate or announce its decrease at the last meeting this year - in November. However, members of the New Zealand Central Bank showed a surprisingly restrained position, voicing optimistic assessments regarding the growth prospects of the national economy. So, according to Adrian Orr, the monetary and fiscal stimulus measures taken by the regulator and the government will bring positive results at the beginning of next year. He said that the growth in economic activity will be determined primarily by the growth of government spending, investment, and monetary conditions. Moreover, he virtually ruled out the use of "non-traditional monetary policy instruments" (first of all, we are talking about the notorious QE), repeating that the New Zealand economy is "in fairly good shape." As you can see, the New Zealand regulator is quite "philosophical" in its assessment of the current situation in the country's economy. After the release of strong data on labor market growth, RBNZ sharply reduces the rate, but now he is optimistic about the prospects for economic development just a few days after the publication of extremely weak data on GDP growth. In September, the regulator decided that "the glass is half full", and thereby supported the "kiwi". Although the data on New Zealand's GDP growth suggests the opposite: the key figures came out at a forecasted level, confirming the slowdown of the national economy. In the second quarter, the indicator grew to only 2.1% (in annual terms), and in quarterly terms by 0.5%. In other words, the New Zealand economy has slowed to its lowest level in five years, reflecting the effects of the global trade conflict. Nevertheless, the fact remains that the Central Bank of the island state is optimistic about the future, forcing many experts to revise their forecasts. Last week, the probability of a rate reduction to 0.75% at the November meeting was almost one hundred percent. Now, the date of the next reduction has been "moved" to the beginning of 2020. The regulator has made it clear that the Central Bank and the government have taken all necessary (emergency) measures, so further steps in this direction are unnecessary - at least for now. Now the RBNZ has taken a wait and see attitude, especially in light of a possible breakthrough in the negotiations between China and the United States. Obviously, the regulator has high hopes for the October round of negotiations, since China is the main and largest export market for New Zealand. Therefore, the period of "thaw" in relations between the superpowers also provides indirect support for the New Zealand currency. If next week the parties at least outline the framework of the future deal, the NZD/USD pair will receive a powerful impetus for their growth -at least towards the middle of the 64th figure. In the meantime, the pair is trading sideways within the range of 0.6250-0.6350 (the lower and middle lines of the Bollinger Bands indicator on the daily chart). If the pair overcomes the upper boundary of the indicated range, the next resistance level will be 0.6440, which is the upper line of the Bollinger Bands on the same timeframe. The material has been provided by InstaForex Company - www.instaforex.com |
| Posted: 26 Sep 2019 06:16 AM PDT Despite the launch of the impeachment proceedings against US President Donald Trump, the USD index, the US stock market, and Treasury yields have shown unexpected strength. Apparently, markets doubt that the Senate, who are controlled by Republicans, will support the idea of removing the head of the White House from power. In addition, Washington-Beijing trade talks are on the nose. The latter gets one more reason to spend time and this is not necessary for anyone, especially investors. US assets also benefited from a statement by Donald Trump that a trade deal with China could be concluded earlier than many believed. Amid this news, the USD/JPY pair jumped sharply after a four-day decline. JPMorgan Chase analysts predict that the pair will rise to around 110 by the end of the year. "The last three months of the year are seasonally weak for the yen. This year, this period still coincides with a large repayment of Japanese government bonds. Considering that the yield in the Land of the Rising Sun is still close to record low levels, we expect that local investors will send most of the proceeds from the repayment of bonds to foreign assets, "they said. According to some estimates, Japan should repay state bonds in the amount of 24.3 trillion yen (about 226 billion dollars) by the end of the year. "Even if the Fed cuts the interest rate one or two more times, the yield on US treasury bonds will remain attractive to Japanese investors," the JPMorgan said. Meanwhile, the global economy is on the verge of a new trade war. According to Bloomberg, the WTO has confirmed that EU subsidies for the Airbus giant violate international trade rules and is ready to allow the United States to levy duties worth $7-8 billion in European imports. Brussels intends to respond. News on this subject put pressure on the single European currency. When competitors are weak, the dollar has no choice but to go up. Greenback is steadily gaining ground despite the growing political risks in the United States. According to Fed President Dallas Robert Kaplan, the United States can skate on the ice of a freezing global economy with strong consumer spending and the job market. In turn, the head of the Federal Reserve Bank of Chicago, Charles Evans, does not see the need to further reduce the rate on federal funds. The difference in the economic growth of the US and the eurozone, as well as doubts about the continuation of monetary expansion by the Fed, propelled the EUR/USD pair to the lower border of the short-term consolidation range at 1.093-1.1095. It is assumed that her breakthrough will increase the chances of continuing movement in the direction of 1.087 and 1.08. However, the attack of the "bears" is unlikely to take place in one breath since it may take some time to prepare for the assault. The material has been provided by InstaForex Company - www.instaforex.com |
| Fractal analysis for major currency pairs as of September 26 Posted: 26 Sep 2019 06:00 AM PDT Hello, dear colleagues. For the Euro/Dollar pair, we expect the downward movement to continue after the breakdown of 1.0910 and the level of 1.0991 is the key support. For the Pound/Dollar pair, we continue to continue downward movement after the breakdown of 1.2286. For the Dollar/Franc pair, the price formed expressed initial conditions for the upward movement of September 24 and the level of 0.9954 is the key resistance. For the Dollar/Yen pair, we are following the formation of the upward structure of September 24 and the development of which is expected after the breakdown of 107.94. For the Euro/Yen pair, we are following the downward structure of September 18 and we will continue to move down after passing the range of 117.73 – 117.51 and the level of 118.28 is the key support. For the Pound/Yen pair, the development of the downward structure of September 20 is expected after the breakdown of 132.40 Forecast for September 26: Analytical review of currency pairs on the H1 scale:
For the Euro/Dollar pair, the key levels in the H1 scale are 1.1052, 1.1024, 1.0991, 1.0966, 1.0911, 1.0880, and 1.0839. We continue to follow the development of the downward structure of September 13. The short-term downward movement is expected in the range of 1.0911 – 1.0880 and the breakdown of the last value will lead to a movement to the potential target – 1.0839, upon reaching this level, we expect a pullback upwards. The short-term upward movement is possible in the area of 1.0966 – 0991 and the breakdown of the last value will lead to an in-depth correction. The target is 1.1024 and this level is the key support for the bottom. Its breakdown will allow you to rely on a movement to the potential target – 1.1052, the level of expected initial conditions for the top. The main trend is the downward structure of September 13. Trading recommendations: Buy: 1.0966 Take profit: 1.0990 Buy 1.0993 Take profit: 1.1024 Sell: 1.0910 Take profit: 1.0882 Sell: 1.0878 Take profit: 1.0840
For the Pound/Dollar pair, the key levels in the H1 scale are 1.2448, 1.2395, 1.2362, 1.2362, 1.2286, 1.2258, and 1.2203. We follow the development of the downward structure of September 20. The short-term downward movement is expected in the range of 1.2286 – 1.2258 and the breakdown of the last value will lead to a movement to the potential target – 1.2203, upon reaching this level, we expect a pullback upwards. The short-term upward movement is expected in the range of 1.2362 – 1.2395 and the breakdown of the last value will lead to an in-depth correction. The target is 1.2448 and this level is the key support for the downward structure. The main trend is the downward structure of September 20. Trading recommendations: Buy: 1.2362 Take profit: 1.2395 Buy: 1.2397 Take profit: 1.2446 Sell: 1.2286 Take profit: 1.2260 Sell: 1.2256 Take profit: 1.2204
For the Dollar/Franc pair, the key levels in the H1 scale are 1.0054, 1.0037, 1.0007, 0.9985, 0.9954, 0.9923, 0.9908, and 0.9883. The price issued the expressed initial conditions for the upward cycle of September 24. The continuation of the upward movement is expected after the breakdown of 0.9954. In this case, the target is 0.9985 and in the area of 0.9985 – 1.0007 is the short-term upward movement and consolidation. The potential value for the top is the level of 1.0037, after which we expect a consolidated movement in the area of 1.0037 – 1.0054. The short-term downward movement is possible in the area of 0.9923 – 0.9908 and the breakdown of the last value will lead to an in-depth correction. The target is 0.9885 and this level is the key support for the upward potential from September 24. The main trend is the initial conditions for the top of September 24. Trading recommendations: Buy: 0.9955 Take profit: 0.9985 Buy: 0.9987 Take profit: 1.0005 Sell: 0.9923 Take profit: 0.9909 Sell: 0.9906 Take profit: 0.9885
For the Dollar/Yen pair, the key levels in the H1 scale are 108.84, 108.59, 108.24, 107.94, 107.77, 107.52, 107.39, 107.18, and 106.95. The price has issued a pronounced upward structure from September 24. The short-term upward movement is expected in the range of 107.77 – 107.94 and the breakdown of the last value will lead to a pronounced movement. The target is 108.24 and near this level is the consolidation. The breakdown of 108.25 will lead to a movement to the level of 108.59, from this level, there is a high probability of turning into a correction. The potential value for the top is the level of 108.84. The short-term downward movement is expected in the area of 107.52 – 107.39 and the breakdown of the last value will lead to an in-depth correction. The target is 107.18 and this level is the key support for the top. The main trend is the formation of the upward structure of September 24. Trading recommendations: Buy: 107.78 Take profit: 107.92 Buy: 107.96 Take profit: 108.22 Sell: 107.50 Take profit: 107.40 Sell: 107.36 Take profit: 107.20
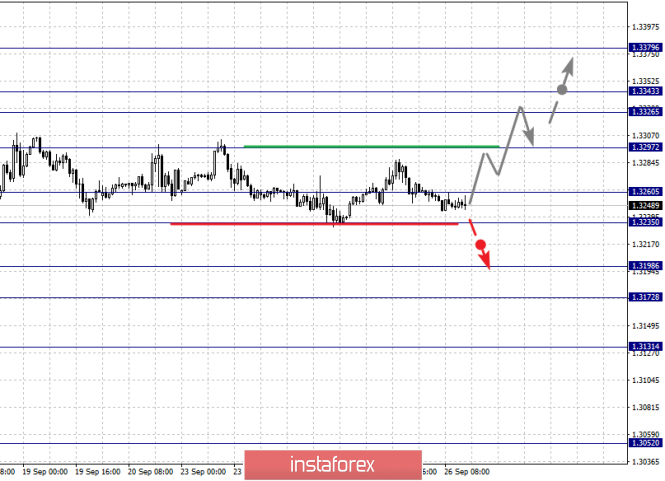
For the Canadian dollar/Dollar pair, the key levels in the H1 scale are 1.3379, 1.3343, 1.3326, 1.3297, 1.3260, 1.3235, 1.3198, and 1.3172. The situation is in equilibrium. The continuation of the upward movement is expected after the breakdown of 1.3297. The target is 1.3326 and in the area of 1.3326 – 1.3343 is the consolidation. The potential value for the top is the level of 1.3379, after reaching this level, we expect a rollback downwards. The short-term downward movement, as well as consolidation, are possible in the area of 1.3260 – 1.3235 and the breakdown of the last value will lead to an in-depth correction. The target is 1.3198 and this level is the key support for the top. Its breakdown will have a downward structure. In this case, the potential target – 1.3172. The main trend is the equilibrium situation. Trading recommendations: Buy: 1.3299 Take profit: 1.3226 Buy: 1.3344 Take profit: 1.3378 Sell: 1.3233 Take profit: 1.3200 Sell: 1.3197 Take profit: 1.3173
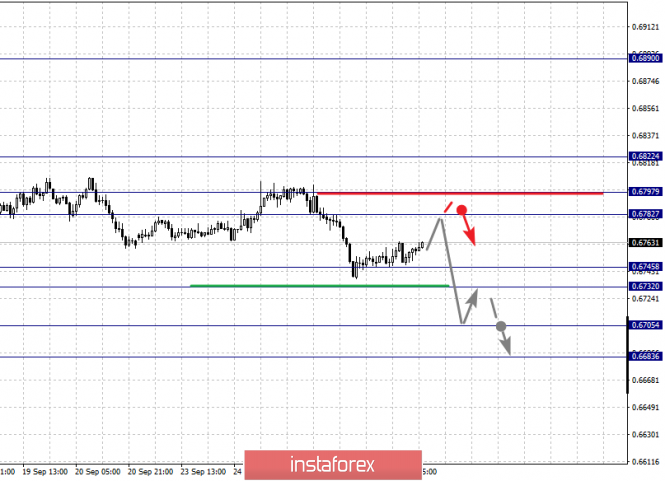
For the Australian dollar/Dollar pair, the key levels in the H1 scale are 0.6822, 0.6797, 0.6782, 0.6745, 0.6732, 0.6705, and 0.6683. We follow the development of the downward cycle of September 13. The short-term downward movement is possible in the range of 0.6745 – 0.6732 and the breakdown of the last value should be accompanied by a pronounced downward movement. The target is 0.6705 and near this value is the consolidation. The potential value for the bottom is the level of 0.6683, after which we expect to go into correction. The short-term upward movement is possible in the area of 0.6782 – 0.6797 and the breakdown of the last value will lead to a prolonged correction. The potential target is 0.6822 and this level is the key support for the downward structure. The main trend is the downward cycle of September 13th. Trading recommendations: Buy: 0.6782 Take profit: 0.6795 Buy: 0.6797 Take profit: 0.6820 Sell: 0.6745 Take profit: 0.6734 Sell: 0.6730 Take profit: 0.6707
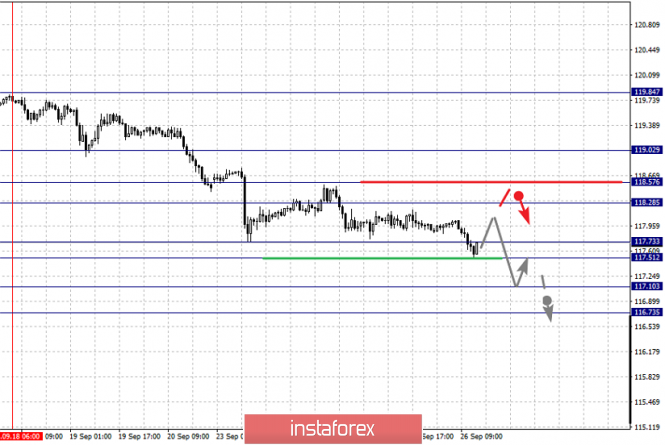
For the Euro/Yen pair, the key levels in the H1 scale are 119.02, 118.57, 118.28, 117.73, 117.51, 117.10, and 116.73. We follow the development of the downward structure of September 18. We expect the downward movement to continue after the price passes the range of 117.73 – 117.51. In this case, the target is 117.10. The potential value for the bottom is the level of 116.73, after reaching this value, we expect a rollback upward. The short-term upward movement is possible in the range of 118.28 – 118.57 and the breakdown of the last value will lead to an in-depth movement. The target is 119.02 and this level is the key support for the downward structure. The main trend is the downward structure of September 18. Trading recommendations: Buy: 118.28 Take profit: 118.55 Buy: 118.60 Take profit: 119.00 Sell: 117.50 Take profit: 117.10 Sell: 117.08 Take profit: 116.73
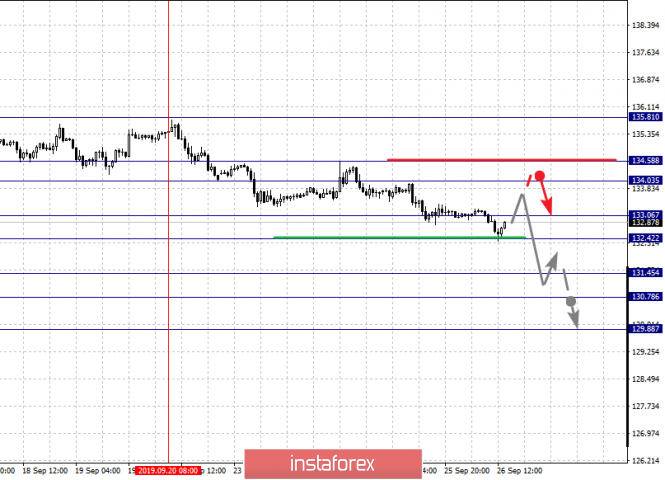
For the Pound/Yen pair, the key levels in the H1 scale are 135.81, 134.58, 134.03, 133.06, 132.42, 131.45, 130.78, and 129.88. We follow the development of the downward structure of September 20. The short-term downward movement is expected in the range of 133.06 – 132.42 and the breakdown of the last value should be accompanied by a pronounced downward movement. In this case, the target is 131.45 and in the area of 131.45 – 130.78 is the consolidation. The potential value for the downward movement is the level of 129.88, after reaching this level, we expect a rollback upward. The short-term upward movement is possible in the area of 134.03 – 134.58 and the breakdown of the last value will have to form an upward structure. In this case, the potential target is 135.81. The main trend is the formation of a downward structure from September 20. Trading recommendations: Buy: 134.03 Take profit: 134.55 Buy: 134.60 Take profit: 135.80 Sell: 132.40 Take profit: 131.45 Sell: 131.43 Take profit: 130.80 The material has been provided by InstaForex Company - www.instaforex.com |
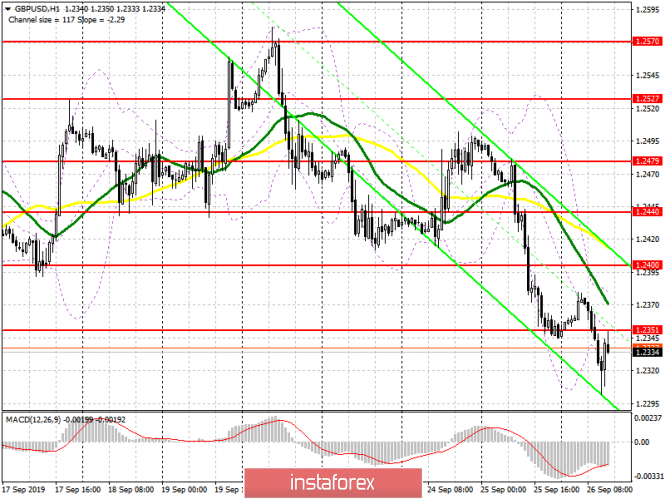
| Posted: 26 Sep 2019 05:30 AM PDT To open long positions on GBP/USD, you need: In the morning, I paid attention to the political risks within the UK Parliament, as well as to the divergence of the MACD indicator, which limited the short-term downward potential in the pair. At the moment, the task of the bulls is to return and consolidate above the resistance of 1.2351, which was formed in the first half of the day. Only after that, you can count on a larger upward correction to the maximum area of 1.2400, where I recommend taking the profit. In the scenario of a decline in the pound in the second half of the day, which may occur after the GDP data or the speech of the Governor of the Bank of England Mark Carney, it is best to consider new long positions on the rebound from a major support in the area of 1.2284 or after updating the minimum of 1.2238. To open short positions on GBP/USD, you need: Bears coped with the morning task, but the downward movement was limited by divergence, which led to the expected profit-taking and the upward correction of the pound. At the moment, the new target of sellers is the formation of a false breakdown in the resistance area of 1.2351, which will lead to the formation of additional pressure on the pair and a repeated wave of decline to the area of the minimum of 1.2284, where I recommend taking the profit. If the pressure on the pound is larger, after the release of the above fundamental statistics, we can expect to update the area of 1.2238. In the scenario of a breakthrough and a return of GBP/USD to the resistance of 1.2351, it is best to count on short positions on a false breakdown from the maximum of 1.2400 or sell on a rebound from 1.2440. Signals: Moving Averages Trading is below 30 and 50 daily averages, which indicates a bearish trend. Bollinger Bands In the case of an upward correction, the upper limit of the indicator around 1.2385 will act as a resistance.
Description of indicators
|
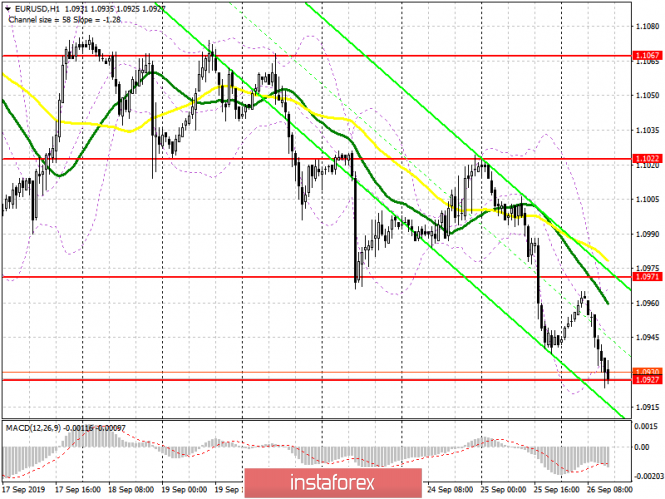
| Posted: 26 Sep 2019 05:30 AM PDT To open long positions on EURUSD, you need: The pressure on the euro remained in the first half of the day, which led to the update of the support of 1.0930 and the formation of divergence on the MACD indicator. While trading is above this level, we can expect an upward correction in EUR/USD, but much will depend on what will be the data on US GDP for the 2nd quarter of this year. In the case of a breakthrough of the low of 1.0927, it is best to return to long positions in the euro to rebound from the lows of 1.0900 and 1.0873. A little later, there will be a speech by the President of the European Central Bank, which may weaken the position of the euro even more. If the bulls manage to turn the market to their side, the task for the second half of the day will be to return to the resistance of 1.0971 and consolidate on it, which will give EUR/USD an upward impulse to the area of the maximum of 1.1022, where I recommend fixing the profits. To open short positions on EURUSD, you need: Bears coped with the task for this week, and, despite the divergence of MACD, returned the pair to a minimum of 1.0930, testing this range for the third time. Most likely, the North American session will be another more successful attempt to break the above level, which will lead to an update of the support of 1.0900, where I recommend taking the profit. After the demolition of stop orders of speculative buyers below 1.0900, large players can return to the market, so selling at the breakdown of 1.0927 is a very dangerous idea. A more optimal scenario for selling EUR/USD will be a return to the resistance of 1.0971 with the formation of a false breakdown there, and it is best to open short positions immediately for a rebound from the maximum of 1.1022. Signals: Moving Averages Trading is below 30 and 50 moving averages, which indicates the continuation of the bearish trend. Bollinger Bands If the euro rises, the upper limit of the indicator around 1.0965 will act as a resistance, from where it is possible to open short positions immediately for a rebound.
Description of indicators
|
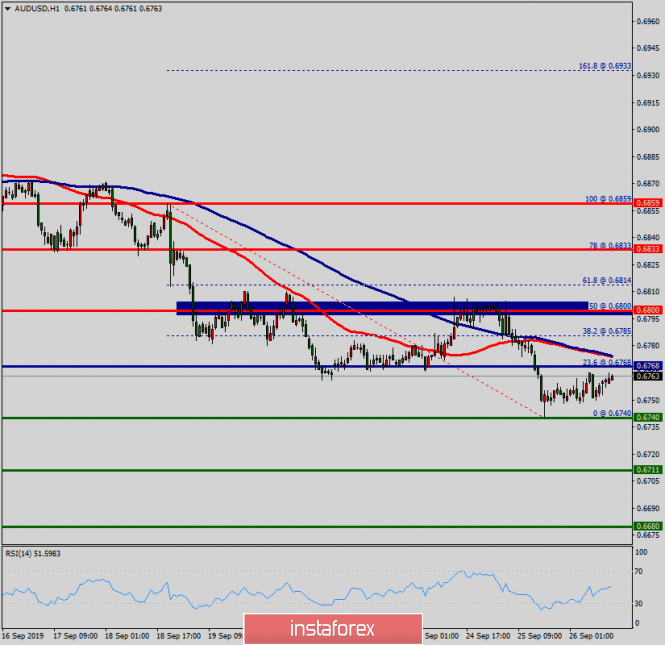
| Technical analysis of AUD/USD for September 26, 2019 Posted: 26 Sep 2019 04:45 AM PDT The AUD/USD pair hit the weekly pivot point and resistance 1, because of the series of relatively equal highs and equal lows. But, the pair has dropped down from the price of 0.6800 in order to bottom at the point of 0.6740. Hence, the major support was already set at the level of 0.6740. Moreover, the double bottom is also coinciding with the major support this week. Equally important, the RSI and the moving average (100) are still calling for a downtrend. Therefore, the market indicates a bearish opportunity at the level of 0.6800. Today, in the one-hour chart, the current rise will remain within a framework of correction. From this point, sell orders are recommended below the spot of 0.6800 with the first target at the level of 0.6740. If the pair succeeds to pass through the level of 0.6740, the market will indicate a bearish opportunity below the level of 0.6711. Trading recommendations: According to the previous events of AUD/USD pair in the Forex market, the price has still been trading between the level of 0.6800 and the 0.6740 level. Therefore, it will be advantageous to sell below 0.6800 with a first target 0.6740 in order to test the double point. It may resume to 0.6711 if the price is able to break 0.6740. On the other hand, stop loss should always be in account, consequently, it will be of wholesome to set the stop loss above the resistance 1 at the price of 0.6833. Today, in the one-hour chart, the current rise will remain within a framework of correction. The material has been provided by InstaForex Company - www.instaforex.com |
| Bets made: the pound turned out to be a bargaining chip? Posted: 26 Sep 2019 04:36 AM PDT This time, the British currency did not have a very enviable fate - to be a bargaining chip and to some extent a pawn in the political game. The pound has become almost the object of the game in the casino: one of the leading investors put it to a fall by the end of October. The news background around the British currency is far from stability. Prime Minister of Great Britain, Boris Johnson, has again tightened his rhetoric regarding the country's exit from the EU without a deal. The current situation is displeasing to the British Parliament. At the same time, investor tactics are changing. They seek to insure risks and turn to currency hedging instruments to protect themselves from the negative consequences of Brexit. In the futures and options market, an unexpected reaction from one of the major investors also followed. This market participant has pounded 190 million pounds ($235 million) to drop the pound by more than 10% to 1.1080 by the end of Halloween. Recall that this is the end of October - the beginning of November 2019, when the UK expires from the European Union. At the moment, options remain the most effective pound rates against the backdrop of the high likelihood of a "hard" Brexit and the coming to power of the Labor Party, analysts at Allianz Global Investors say. On Thursday, September 26, the British currency stabilized after Boris Johnson emerged victorious from the struggle in the House of Commons. Recall, the politician refused to resign or apologize after the decision of the British Supreme Court on the illegality of his actions related to the suspension of Parliament. Currently, the GBP/USD pair is trading in the range of 1.2343–1.2350. Note that since the beginning of September, sterling has added more than 2%, but the chronic uncertainty around Brexit does not give him a chance to grow further. In the course of today's trading, the British currency fell by more than 1.2% to 1.2340, along with the collapse of hopes for a delay in Brexit. Experts consider the current dynamics of the pound to be a pullback after the 5% rally recorded at the beginning of the month. Prior to this, sterling reacted positively to the shift in the exit date from the Euroblock as this reduced the chances of Brexit without a deal. According to analysts, currency options are not the only way to hedge risk by investors. In the financial market, bets on the "hard" Brexit are also rising. By betting certain amounts on the line, investors believe that Britain's exit from the EU without an agreement will push the Bank of England to ease monetary policy as soon as possible. The material has been provided by InstaForex Company - www.instaforex.com |
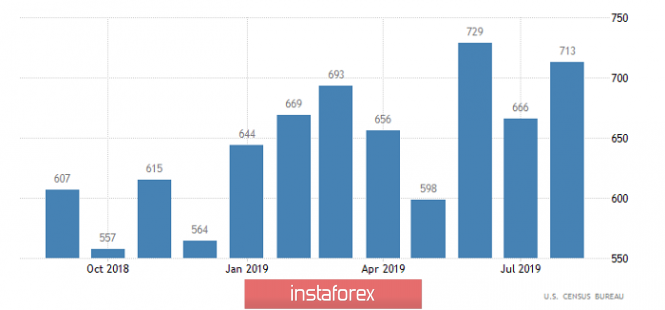
| Trading recommendations for the EURUSD currency pair – placement of trade orders (September 26) Posted: 26 Sep 2019 03:37 AM PDT Over the last trading day, the euro/dollar currency pair showed high volatility of 85 points, as a result of which the quote rushed to the base point of the prolonged oscillation. From technical analysis, we see that the theory stated in the previous review coincided with 100%. The stagnation within the psychological level of 1.1000 did not last long, and there was a massive downward move in the afternoon, which was called as the inertial impulse. The movement was really beautiful, and most importantly – profitable, the price almost reached the base point of 1.0927, where there was a slight stagnation/pullback within 1.0937, just in time for the Pacific-Asian trading session. As discussed in the previous review, speculators were at a low start in terms of short positions, some entered the transaction already from the psychological level of 1.1000, others with a slight delay in the coordinates of 1.0980 and 1.0960, but all without exception made a profit. Looking at the trading chart in general terms (daily period), we see that the recovery process has led us to the key coordinate of 1.0927, where repeatedly there was a stop followed by a rebound. Now, the question is whether sellers will be able to overcome this ill-fated coordinate and resume the initial downward trend or whether the long-playing toffee [1.0927/1.1000/1.1080(1.1115)] will also last for the fourth week. The news background of the previous day had data on sales of new homes in the United States, where, in principle, expected growth, but the result was even more beautiful picture. So, the previous data was revised for the better 635K to 666K, and the current figures were 713K with a forecast of 660K. Such a positive statistic left in the treasury, and so growing as the leverage of the American dollar. The information background did not stand still and pleased speculators' hysterical flow of information regarding the impeachment of US President Donald Trump. If we analyze this burning story briefly, then on Tuesday (September 24), US House Speaker Nancy Pelosi announced the start of the impeachment proceedings against Donald Trump, citing alleged intelligence and the scandal surrounding Trump's telephone conversation with Ukrainian President Vladimir Zelensky. The "family", intra-American squabbles of Trump and Biden have reached a new level, where both are trying to measure political forces, but it's still not clear what all this will lead to, but I think the next fiasco in terms of attacks on Trump and further transfer of discussion to the sidelines of the ruling elite. How the US dollar reacted to all this show is surprising, but positive, which is hard to explain in terms of logic. Most likely, Trump played a certain openness in terms of actions, who declassified the transcript of a telephone conversation with Zelensky and is ready to participate in this show, and he has plenty of experience, like a showman. Today, in terms of the economic calendar, we have data on US GDP for the second quarter, where they are waiting for confirmation of a slowdown in economic growth from 2.7% to 2.3%, which may put local pressure on the US dollar. In terms of informational background, further clarifications of the hysterical data stream regarding the battles of Trump & Biden are awaiting. We follow the news feed. Further development Analyzing the current trading chart, we see how the quote comes close to the key value of 1.0927 while drawing an impressive candle. Now, the important question is whether we will be able to push the coordinates (of 1.0927) not just in the form of puncture and to keep the inertial speed. Speculators, in turn, are insured and try to bury the available short positions as much as possible, since, in the case of a rebound, the work will be built in a completely different perspective, where there will also be enough profit. Short positions are not removed in a distant suitcase, as their consideration and further entry will be made in the case of fixing the price below 1.0900. It is likely to assume that the current day will be no less interesting and volatile at the same time, where the tactics of two interests are actively considered, that is, the "Breakdown/Rebound" method. That is, analyze the behavior of quotes within the control point (of 1.0927), at the same time we study the news feed and make a decision – Breakdown or Rebound. Based on the above information, we will derive trading recommendations:
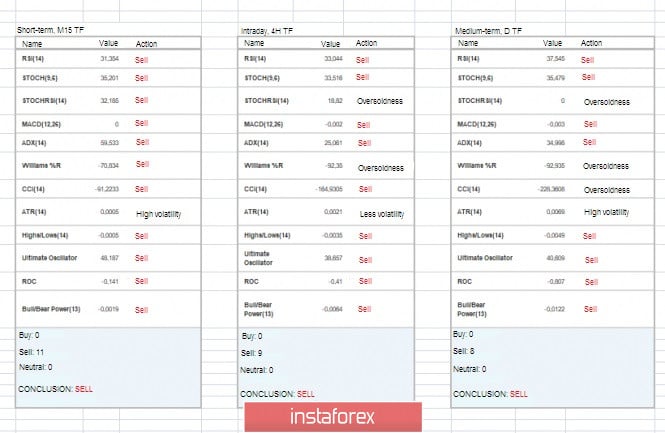
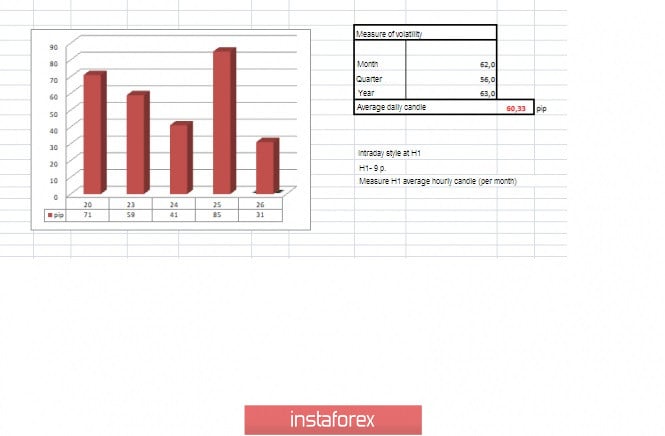
Technical analysis Analyzing different sectors of timeframes (TF), we see that the indicators in all major time intervals retain downward interest due to the general background and inertial movement. If the fulcrum in the area of 1.0927 is still found, the indicators in the smaller time sections will quickly change their interest. Volatility per week / Measurement of volatility: Month; Quarter; Year. Measurement of volatility reflects the average daily fluctuation, calculated for the Month / Quarter / Year. (September 26 was built taking into account the time of publication of the article) The volatility of the current time is 31 points, which is more than 50% of the daily average. It is likely to assume that due to the information and news background, volatility will still show itself, exceeding the daily average. Key level Resistance zones: 1.1000***; 1.1100**; 1.1180* ; 1.1300**; 1.1450; 1.1550; 1.1650*; 1.1720**; 1.1850**; 1.2100 Support zones: 1.0926*; 1.0850**; 1.0500***; 1.0350**; 1.0000***. * Periodic level ** Range level *** Psychological level **** The article is based on the principle of conducting transactions, with daily adjustments. The material has been provided by InstaForex Company - www.instaforex.com |
| Trading plan for EUR / USD and GBP / USD pairs on 09/26/2019 Posted: 26 Sep 2019 03:14 AM PDT The most popular series of modern times set new records for cash collection. The British Supreme Court has joined in the endless dancing around Brexit, ruling that the suspension of parliament was illegal. The happy MPs huddled their sleeves into their favorite jobs and away they go. Jeremy Corbin, no longer embarrassed, calls himself the next Prime Minister. He promises to hold a new referendum on European Union membership within six months after his election and urges Boris Johnson to resign along the way. Even the Attorney General of the United Kingdom has inserted his five cents, saying that the current parliament is incapacitated and it is high time for it to disperse and call new elections. Looking at everything that's happening, Boris Johnson was forced to hastily leave the United Nations General Assembly and head to London to extinguish an unextinguished political fire. It turned out not to be particularly impressive -if at least something happened. So far, the incumbent prime minister has once again cast spells about fulfilling his promise to Brexit by October 31. For that, the House of Commons should not interfere with it. The parliamentarians politely listened to him, passing all his words past their ears and continued to put the sticks in the wheels. So, it's not surprising that the pound went down all day. However, the strengthening of the single European currency against the background of all these political battles looks somewhat strange. Indeed, in the United States, they are once again trying to launch the franchise of the British blockbuster, but with their own specifics. The Democratic Party film studio once again announced the release of a pilot series of the television series entitled "Give the impeachment of Donald trump!" This time, the plot is being twisted around the upcoming US presidential election. The villains, played by Donald Trump, are blackmailing Ukraine's unfortunate President, Vladimir Zelensky, to provide him with compromising information on the best and most benevolent US presidential candidate, Joseph Bid. If Zelensky does not provide Trump with information about the corruption schemes used by Biden's son to seize the Odessa port, he will not provide Ukraine with the means to strengthen the army. In the opinion of the democratic film studio, supporters of the positive hero immediately called it pressure on the head of another state and unacceptable behavior for the president of the United States. And of course, the very fact of gathering incriminating evidence against your opponent is the worst mortal sin. Hence, across the Atlantic was fun too but the dollar is not cheaper in relation to the single European currency. Although in Europe itself it was quiet, like in a cemetery. Apparently, investors are already fed up with all kinds of entertainment TV shows and just do not turn on the TV but they closely followed macroeconomic statistics. Instead, they followed closely the macroeconomic statistics that showed them an incredible rise in home sales in the United States by 7.1% not by 3.5%, as expected. Here is the explanation for the dollar's strange disregard for the hype in all kinds of mass media and disinformation. New Home Sales (United States of America): You can be sure that the information hype will not subside today. On the contrary, it will only intensify. But the macroeconomic data published today is much more significant than yesterday. After all, the final data on the United States GDP for the second quarter will be published today, which should confirm a preliminary estimate that showed a slowdown in economic growth from 2.7% to 2.3%. As if that were not surprising to anyone, it would certainly prove that, for the most honest media of agitation and disinformation, as well as an army of speculators, it would be another proof that a terrible and terrible recession is imminent. All the front lines will be buzzed by another prophecy of the Apocalypse and the like. In short, they will again begin to undermine the gentle childhood psyche of the unfortunate Jerome Powell, urging him to lower the refinancing rate several more times, ostensibly to save the American economy from the recession; like, only in this way you can avert trouble. GDP growth rate (United States of America): However, it is highly likely that the next pilot episode of the democratic film studio will again fail. Indeed, the most positive hero of their television series, so to speak, has a stigma in the cannon. At one time, in the presence of a couple of hundred people, and even on a television camera, he described how he demanded that Ukraine's previous president, Petro Poroshenko, sack the prosecutor general, or else the United States would not lend Ukraine a very small amount of money. That is, Donald Trump is essentially blamed for the same thing, for which they do not want to blame Joseph Biden. And of course, it is understandable that Donald Trump will put this argument on the table. So the Democrats' case is made with white thread, and another attempt to trigger impeachment may fall apart before it starts. Admittedly, this turn of events is likely to inspire investors. At least in the citadel of democracy, everything is calm. The Euro/Dollar currency pair still could not resist in the region of the psychological level of 1.1000, where the recent correction served as a kind of regrouping of trading forces, and, as a fact, the downward positions returned to the market. It is likely to assume that the base point in the face of the value of 1.0926 will nevertheless be able to play the role of a support, slowing down the quotation and adjusting the price in the opposite direction against the background of the news flow, locally creating outbursts in the market. The Pound/Dollar currency pair has worked out the level of 1.2500 once again, traced the impulse move in the direction of the subsequent value of 1.2350, where, as a fact, it slowed down. It is likely to assume a temporary bolt within the level of 1.2350, where it makes sense to apply the rebound/breakdown technique while working on the situation. |
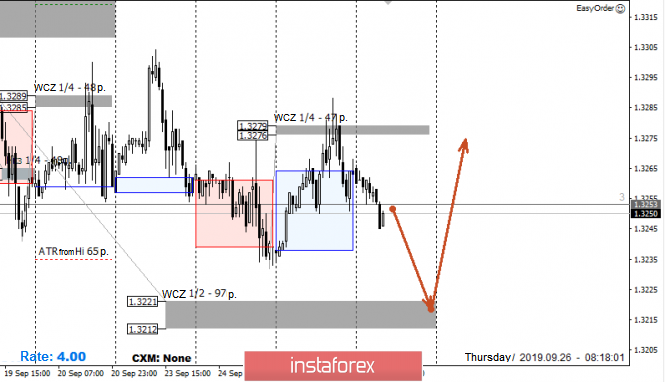
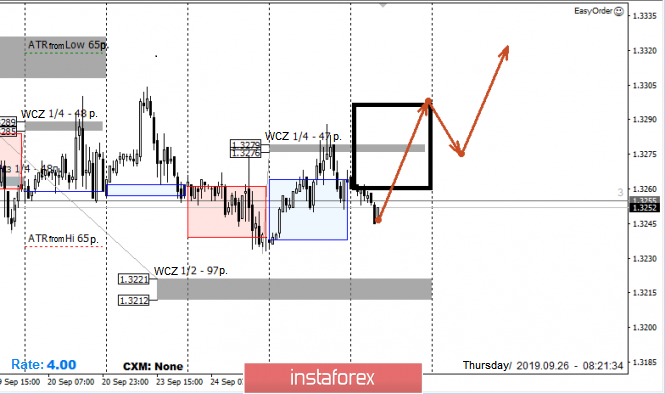
| Control zones for USD / CAD pair on 09/26/19 Posted: 26 Sep 2019 02:22 AM PDT Yesterday's test of 1/4 WCZ at 1.3279-1.3276 allowed to go on sale. The first goal of the decline is 1/2 WCZ of 1.3221-1.3212. Working within the framework of the flat is the main one, so any test of these zones will require full or partial fixation. If the demand appears in the lower zone, it will be necessary to open purchases after the formation of the "false breakdown" pattern. In terms of long-term dynamics, the probability of a further decline in early September is higher, so some sales may be left in the event that the closing of the trading occurs below the 1/2 refinery. An alternative model will be developed if today's trading closes above the 1/4 refinery. This will indicate the resumption of upward momentum and allow you to look for purchases after a correctional decline. Daily CZ - daily control zone. The area formed by important data from the futures market, which changes several times a year. Weekly CZ - weekly control zone. The area formed by marks from the important futures market, which changes several times a year. Monthly CZ - monthly control zone. The area is a reflection of the average volatility over the past year. The material has been provided by InstaForex Company - www.instaforex.com |
| Bitcoin's secret fear: will it really collapse again? Posted: 26 Sep 2019 02:03 AM PDT The recent and seemingly unreasonable another collapse of the cryptocurrency market inspires strong fears to investors and keeps traders in suspense. Recently, a slow slide in the leading digital asset has been recorded, which led to its collapse. Thus, experts are trying to figure out the reasons for what is happening. Currently, the volume of the cryptocurrency market decline has reached 15%. Analysts fear that at this pace, another "bubble" explosion will occur. However, the headache of the current moment is a serious collapse of the MTC quotes. On Wednesday, September 25, after a long stay near $ 10,000, Bitcoin dropped to $ 8,500. In the future, cryptocurrency No. 1 continued to decline. In just an hour, BTC hit $ 1300, breaking July minimums, and soon reached $ 8100. The decline over Tuesday was about 12%, analysts emphasize. After some time, Bitcoin broke through the boundary of the downward triangle at $ 9500, horizontal support at $ 9400 and key moving averages. In the future, experts do not exclude the possibility of a decline in the region of $ 5000 or even lower. On Thursday, September 26, the leading virtual asset is being traded sideways with support at around $ 8,230. Yesterday, buyers were not able to restore the price of MTC to acceptable levels. By Wednesday evening, Bitcoin was near the resistance level of $ 8500. Market participants believe that the decline in the region of $ 8000 will resume during the day. Forecasts regarding the further dynamics of Bitcoin look contradictory: someone is counting on its rise, but most experts are inclined to fall. According to a number of market players, a negative trend will dominate the cryptocurrency market in the coming days. Some speculate that BTC will test the $ 7,500 level. At this level, cryptocurrency No. 1 will receive support and strengthen its position. Analysts find it difficult to explain the sudden rapid collapse of bitcoin. One of the factors affecting the weakening activity of miners could be the increase in repression in China in relation to enterprises engaged in the production of military-technical cooperation. Earlier, the authorities of the Celestial Empire confirmed information about a possible limitation of the activities of mining enterprises in the country, attracting impressive amounts of computing power due to favorable prices for electricity. Another reason for the collapse of Bitcoin, experts believe the launch of the Bakkt cryptocurrency platform. Contrary to the opinion of some experts, this project could not positively affect the BTC course, but, on the contrary, weakened it. The collapse of the leading digital asset is associated with the "buy by rumor, sell on the news" approach in the context of launching Bakkt deliverable futures. Therefore, it is possible that investors missed the massive growth of bitcoin after the launch of the project. However, realizing that the price of it was too high, they began to get rid of the asset. Another reason for the collapse of the military-technical cooperation is the sharp decrease in bitcoin hash on Monday, which exceeded 30% in one day. The hash rate fell from 98 EH / s to 67.7 EH / s. This indicator is subject to sharp fluctuations from time to time, however, the latest collapse is the largest in recent network history. One of the most fantastic versions put forward by experts is the opinion that world elites conduct an experiment and test the currencies of the future in the current realities. Nevertheless, many experts are sure that over time, cryptocurrencies will occupy an important place in the world of finance. The material has been provided by InstaForex Company - www.instaforex.com |


| You are subscribed to email updates from Forex analysis review. To stop receiving these emails, you may unsubscribe now. | Email delivery powered by Google |
| Google, 1600 Amphitheatre Parkway, Mountain View, CA 94043, United States | |
No comments:
Post a Comment