
Forex analysis review |
- AUD/USD. Aussie's southern outlook: weak reports ahead of RBA meeting
- September 27, 2019 : GBP/USD Intraday technical analysis and trade recommendations.
- September 27, 2019 : EUR/USD Intraday technical analysis and trade recommendations.
- EURUSD and GBPUSD: Is it time to buy the pound after a major fall? The upward correction of the euro is unlikely to be long
- Dollar sweeps barriers
- Gold 09.27.2019 - Is the Gold ready for rejection?
- GBP/USD 09.27.2019 - Bullish divergence on the MACD oscillator and potential rally in the play
- GBP/USD: the pound got a foot from the Bank of England
- BTC 09.27.2019 - BTC almost reached our first target, watch for selling on the rallies
- Fed driven by trump lures EUR/USD bears into a trap
- GBP/USD: plan for the American session on September 27th. Bears left the market on volume, which will keep the upward correction
- EUR/USD: plan for the American session on September 27th. A return to the level of 1.0938 will lead to a larger increase
- Fractal analysis for major currency pairs as of September 27
- Trading recommendations for the EURUSD currency pair – prospects for further movement
- Trading recommendations for the GBPUSD currency pair – prospects for further movement
- Technical analysis of EUR/USD for September 27, 2019
- Back to the bottom: Bitcoin collapse - the result of market manipulations?
- Trading strategy for EUR/USD on September 27th. The reasons for the growth of the dollar. Separate "flies from cutlets"
- Trading strategy for GBP/USD on September 27th. How is Johnson going to get around the parliamentary bill?
- Euro will fall against the dollar but still far from parity (We expect EUR/USD and GBP/USD pairs to decline)
- The euro is confused: To find the bottom? Push off? Does it have enough strength?
- The topic of impeachment pushes into the background the approach of recession: Dollar Strengthens, EUR and GBP Under Pressure
- Analysis of EUR / USD and GBP / USD for September 27. The euro currency aimed at 1.08 and the pound is also ready to fall
- Simplified wave analysis for September 27th. AUD/USD: correction continues; EUR/USD and GBP/JPY: is a trap being prepared
- Hot forecast for EUR/USD on 09/27/2019 and a trading recommendation
| AUD/USD. Aussie's southern outlook: weak reports ahead of RBA meeting Posted: 27 Sep 2019 09:16 AM PDT The Australian dollar paired with the US currency behaves cautiously, trading within the 100-point range without leaving the 67th figure. High-profile political events in the US only indirectly affected the "Aussie" – the pair fell by 70 points against the background of the overall strengthening of the US dollar. But in general, the situation remained the same: after the completion of the corrective growth (which lasted for almost two weeks), the pair settled in the range of 0.6740 – 0.6800.
Uncertain steps of both bears and bulls of the pair indicate that traders cannot determine the vector of further movement of AUD/USD. On the one hand, the Reserve Bank of Australia at the last meeting showed a neutral and wait-and-see position, while relations between Beijing and Washington have warmed. On the other hand, the minutes of the September RBA published later were rather "dovish-like" in nature, and the negative consequences of the global trade conflict continue to remind themselves in the form of weak macroeconomic reports. In conditions of such uncertainty, the flat movement of the pair is quite justified, especially in anticipation of the October meeting of the RBA, which will be held early next week. It is worth recalling that at the end of the previous meeting, the regulator voiced a rather restrained position – according to the text of the accompanying statement, the RBA will only "if necessary" resort to reducing the interest rate to maintain sustainable economic growth. Reacting to this rhetoric, the AUD/USD pair demonstrated a fairly large-scale correction, rising by 150 points – from the base of the 67th figure to the middle of the 68th level. However, the minutes of this meeting published last week cooled the ardor of AUD/USD bulls. The document allowed a more detailed "decipher" the intentions of the members of the regulator – and they were very "dovish". The Central Bank did not rule out a further rate cut before the end of this year if the main indicators of the economy show a slowdown again. In the context of this formulation, the pair's traders switched to key macroeconomic releases, which in turn continue to disappoint. In particular, the data on the Australian labor market published at the end of last week did not impress the members of the Australian regulator at all. First, contrary to the expectations of most experts, the unemployment rate rose to 5.3%, while the consensus forecast assumed the preservation of the indicator at 5.2%. The increase in the number of employees, on the one hand, showed a positive trend: the forecast growth of 15 thousand, the figure jumped to 34 thousand. However, the structure of this indicator suggests that optimistic conclusions are premature. The fact is that the increase in employment in August was entirely due to part-time employment. But full employment collapsed into a negative area, resuming a negative trend. This indicator in the last month of summer decreased by 15 thousand. This factor has an extremely negative impact on the dynamics of wage growth, as full-time positions offer a higher level of wages and a higher level of social security. It is not surprising that the level of consumer confidence in Australia has a persistent downward trend, against the backdrop of weak wage growth.
Also, previously published data on GDP growth in Australia. The negative trend is most pronounced. The indicator has been declining for four quarters – in the first quarter of last year, this indicator came out at the level of 3.2%, in the first quarter of this year, the indicator grew by only 1.8%. The week before last, data for the second quarter of 2019 were published: contrary to the weak hopes of some optimists, they came out at the level of forecasts: the key indicator continued its downward trend, falling to the level of 1.4%. Thus, given the latest releases, members of the Australian regulator are unlikely to change their position on the prospects for monetary policy. Moreover, they can more clearly signal a possible rate cut before the end of this year or early next year. This fact will certainly put pressure on the "Aussie". At the same time, we can express confidence that at the October meeting the Central Bank will certainly retain the parameters of monetary policy. In anticipation of the US-Chinese talks (which, as it became known today, will be held October 10-11), the members of the RBA will certainly not rush things by taking any steps. In terms of technology, the situation is as follows. On D1, W1 and MN timeframes, the AUD/USD pair are on the lower line of the Bollinger Bands indicator under all the lines of the Ichimoku Kinko Hyo indicator, which formed a strong bearish signal "Parade of Lines". This suggests a clear advantage of the southern movement. The main target of the southern movement is located on the lower line of the Bollinger Bands indicator, which corresponds to the price of 0.6650. The material has been provided by InstaForex Company - www.instaforex.com |
| September 27, 2019 : GBP/USD Intraday technical analysis and trade recommendations. Posted: 27 Sep 2019 08:56 AM PDT
In Early August, another consolidation-range was temporarily established between the price levels of (1.2100 - 1.2220) except on August 9 when temporary bearish decline below 1.2100 was executed towards 1.2025 (Previous Weekly-Bottom). Since then, the GBP/USD pair has been trending-up within the depicted bullish channel except on September 3 when a temporary bearish breakout was demonstrated towards 1.1960. Around the price level of 1.1960, aggressive signs of bullish recovery (Bullish Engulfing candlesticks) brought the GBPUSD back above 1.2230 where the pair looked overbought. However, further bullish momentum was demonstrated towards 1.2320 maintaining the bullish movement inside the depicted movement channel. Moreover, Temporary bullish advancement was demonstrated towards 1.2550 where a reversal wedge pattern was established. As anticipated, the reversal wedge pattern was confirmed by the end of Monday's consolidations supported by obvious bearish price action demonstrating a successful bearish closure below 1.2450. On Tuesday, the backside of the confirmed reversal wedge was successfully re-tested around 1.2500 where a new episode of bearish rejection was expressed. The Long-term outlook remains bearish as long as the most recent top established around 1.2500 remains defended by the GBP/USD bears. Bearish persistence below 1.2440-1.2400 (Reversal-Pattern Neckline) allowed more bearish decline to occur towards the price levels of 1.2360 and 1.2310 where early signs of bullish rejection is being demonstrated Today. Trade Recommendations: Conservative traders can wait for bullish pullback towards the backside of the broken channel (Anywhere around 1.2400-1.2450) for another valid SELL entry. T/P level to be placed around 1.2360, 1.2330 and 1.2280 while S/L should be set as a H4 candlestick closure above 1.2450. The material has been provided by InstaForex Company - www.instaforex.com |
| September 27, 2019 : EUR/USD Intraday technical analysis and trade recommendations. Posted: 27 Sep 2019 08:38 AM PDT On September 5, the EUR/USD pair was testing the backside of both broken trends around 1.1060-1.1080 where significant bearish pressure was demonstrated pushing the pair directly towards 1.0940 (Prominent Weekly Bottom). Bearish Breakout below the price level of 1.0940 was needed to enhance further bearish decline towards 1.0900 and 1.0840 (Fibonacci Expansion Key-Levels). However, considerable bullish rejection was demonstrated as a quick bullish spike towards 1.1100 where another episode of bearish pressure was expressed. By the end of last week's consolidations, TWO DESCENDING-Tops were established around 1.1080 and 1.1050. This renders the recent bullish spike as a bullish trap. Since then, the EURUSD has been trending-down within the depicted short-term bearish channel. Shortly After, a recent bullish pullback towards the price level of 1.1020 was obviously rejected by the end of Tuesday's consolidations. Currently, the EUR/USD is demonstrating a long-term Head & Shoulders continuation pattern extending between (1.0930 - 1.1080) with neckline located around 1.0940. Bearish persistence below 1.0940 confirms this continuation pattern. Pattern projection target would be located around 1.0840. In the short-term, Bearish persistence below the price level of 1.0965 (recent daily bottom) is mandatory to enhance more bearish decline towards 1.0930 and 1.0890 (Fibonacci Expansion 161.8%). Trade recommendations : Intraday traders who were advised to have a valid SELL entry around 1.1030 can gather their profits around the current price levels. Conservative traders should look for a valid SELL entry anywhere around the price zone of 1.0960-1.0980 (upper limit of the depicted movement channel). Initial Target levels should be located at 1.0900, 1.0850 and 1.0840. The material has been provided by InstaForex Company - www.instaforex.com |
| Posted: 27 Sep 2019 08:17 AM PDT Although sentiment in the eurozone industry was at its worst in six years, the eurozone consumer confidence index remained unchanged in September. According to the report of the European Commission, the confidence index in the eurozone industry in September 2019 fell to -8.8 points from -5.8 points in August. Not surprisingly, the export orders of eurozone companies fell to the lowest level since August 2013. But the eurozone services confidence index rose slightly to 9.5 points in September from 9.2 points in August. However, many experts believe that the problems in the industrial sector will sooner or later spread to other industries, including the service sector. The eurozone consumer confidence index also recovered slightly in September from August and rose to -6.5 points against -7.1 points. The low level of interest rates and the availability of credit along with a good labor market had a positive impact on the index. The data completely coincided with the forecasts of economists. As a result of the overall assessment, the European Commission's index of sentiment in the eurozone economy in September fell to 101.7 points against 103.1 points in August. The measures are taken by the European Central Bank to reduce interest rates (it is about deposits) during the September meeting, as well as a return to the asset buyback program will certainly protect a significant part of the eurozone economy from the problems of the manufacturing sector, but this will not save from a recession in the coming years. Today, data on the preliminary consumer price index in France were released. The report shows that inflation in September decreased by 0.3% compared to August and increased by only 0.9% year-on-year. Economists had forecast inflation to fall by 0.2% and rise to 1.0%, respectively. The preliminary harmonized by EU standards consumer price index in France in September strengthened by 1.1% per annum. Weak inflation remains a key problem of the European Central Bank, and the released data once again convinced traders of the need for more drastic measures. A weak report on consumer spending cuts in France will harm economic growth by the end of the year. According to the data, spending in France in August remained unchanged compared to July and decreased by 0.4% compared to August 2018. The decline in spending is directly linked to a more cautious approach by households given the slowing global economy and the impending recession. Economists had forecast spending growth of 0.5% for August and a decline of only 0.1%, respectively. As for the technical picture of the EURUSD pair, the situation has not changed dramatically compared to the morning forecast, but the market took the side of buyers of risky assets, which allowed it to stay above the annual minimum in the area of 1.0900 and approach yesterday's resistance in the area of 1.0940. A breakthrough in this range will lead to the demolition of stop orders of sellers and a larger upward correction to the area of 1.0970 and 1.1000. GBPUSD The British pound fell against the US dollar today after comments by Michael Saunders, member of the Bank of England's Monetary Policy Committee. Saunders said that no matter what the Brexit scenario is, it will not lead to a sharp growth of the UK economy, even if one can avoid a hard Brexit, the uncertainties surrounding the details of the divorce from the EU, as well as the global slowdown, will put pressure on the Bank of England decisions interest rates. In this scenario, the regulator will continue to maintain a soft monetary policy and may further soften it, but only in case of a deterioration of the situation in the economy, as the current level of inflation allows this to be done. As for the technical picture of GBPUSD, the rebound from the level of 1.2280 was not associated with the return of bulls to the market, but with profit-taking on short positions at the end of the week. However, the first "call" for the bears sounded. It is unlikely that the demand for the trading instrument will continue above the resistance of 1.2350, however, larger players will consider the market to continue the downward movement only after the new benchmarks from the UK Parliament, as the downward movement of the pair in the last few days has become a serious reason to think about opening long positions by institutional players. The lower the pound, the more attention it will attract, as the scenario of extending the term of the UK's exit from the EU so far seems more realistic than a disordered exit. If Parliament wanted a sharp break in relations, it would have done it a couple of years ago. Few people believe that Prime Minister Boris Johnson will be able to negotiate with the EU and conclude a deal in the remaining time until October 31. The material has been provided by InstaForex Company - www.instaforex.com |
| Posted: 27 Sep 2019 07:12 AM PDT As you meet the new week, spend it. Weak statistics on business activity in the eurozone has become the guiding star of the EUR/USD bears. Germany's purchasing managers index fell to its lowest level in more than 10 years. Clearly, the currency bloc remains weak and the ECB hawks' to assure that this is not the case seem unfounded. At the same time, the Fed does not doubt the strength of US GDP, and divergence in economic growth is an important driver of exchange rate formation on Forex. The euro did not help either the verdict of the British Supreme Court on the illegality of the actions of the dismissed parliament of Boris Johnson, nor the growth of political risks in the States. The Prime Minister clearly abused the power but did not resign because of this, so the uncertainty over the pound and other European currencies has not disappeared. As for rumors about Donald Trump's impeachment, they did not, as one might expect, cost an egg. Trade wars have returned to the center of investor attention. If Germany, with a substantial share of exports in GDP, is one of the countries most affected by the trade conflict between Washington and Beijing, the United States feels very confident. It would seem that the Fed has no reason to reduce the rate because unemployment is half a century old while inflation is accelerating, and GDP is pleasing to the eye. Nevertheless, the Central Bank refers to international risks, particularly the problems of the production sector. He responds sensibly to trade wars, as well as in the yield of US Treasury bonds. Dynamics of yield on US bonds and PMI in the manufacturing sector The Federal Reserve is looking at US debt market rates and stock indices, and Donald Trump, who wants to get a monetary stimulus, can only pull the strings so that investors put in the stock quotes expectations of a weakening monetary policy. This can be done with the help of criticism of Jerome Powell, which the President of the United States and is engaged in. Nevertheless, neither the White House's desire nor the Fed's willingness to cut interest rates help the EUR/USD bulls. Yes, the dollar is vulnerable, but the euro looks frankly weak. The economy is crumbling and Mario Draghi discusses helicopter money. Will the ECB buy bonds in the primary market? However, this question will arise before Christine Lagarde. The central event of the week by October 4 is the release of data on the American labor market. Strong employment outside the agricultural sector will reduce the likelihood of the third act of monetary expansion by the Fed in 2019 and strengthen the dollar. On the contrary, the weakness of non-farm payrolls will allow the euro bulls to gain a foothold in the range of $1.093-1.1095. Technically, if the bears were able to keep the EUR / USD quotes below the support of 1.093, we could talk about activating the AB = CD pattern with a target of 161.8%. It corresponds to the mark of 1.08. So far, the first assault has been repelled and the situation is like a false breakdown. Further developments in the pair will depend on the ability of sellers to repeat the test and on how successful it is. EUR / USD daily chart |
| Gold 09.27.2019 - Is the Gold ready for rejection? Posted: 27 Sep 2019 07:07 AM PDT Gold has been trading downwards in the past 24 hours. The price tested the major support cluster at the level of $1,486. Be very careful with selling since there is potential rally coming.
Yellow rectangle – Recent swing low like potential resistance Blue horizontal lines – Support levels Rising purple line – Expected path MACD oscillator is showing potential bullish divergence and my advice is to watch for buying opportunities. The first upward target is set at the price of $1,501. Key support level is set at the price of $1,483. As long as the level of $1,483 is holding, watch for buying opportunities. The material has been provided by InstaForex Company - www.instaforex.com |
| GBP/USD 09.27.2019 - Bullish divergence on the MACD oscillator and potential rally in the play Posted: 27 Sep 2019 06:49 AM PDT GBP/USD has been trading downward as I expected yesterday. The support was found at the swing low 1.2287. I expect potential rally back to 20EMA on the 4h time-frame.
Yellow rectangle – Support levels Red rectangle – Swing low acting like resistance Rising purple line – Expected path MACD oscillator is showing bullish divergence, which may cause GBP to rally.. Watch for potential long opportunities with the target at 1.2380. The GBP is still trading in the downward channel but the rally is likely to happen till end of the day. The breakout of the 1.2270 may confirm further downside and test of 1.2210. The material has been provided by InstaForex Company - www.instaforex.com |
| GBP/USD: the pound got a foot from the Bank of England Posted: 27 Sep 2019 06:46 AM PDT The GBP/USD pair sank today to the area of three-week lows on the "dovish" comments of the representative of the Bank of England Michael Saunders. "The likelihood of a" soft "Brexit, which was considered by the Central Bank as the main scenario in early August, has decreased," said a member of the Monetary Policy Committee. According to him, if the United Kingdom leaves the European Union without a deal, the regulator will consider all monetary policy options, depending on the damage to economic growth and on how much inflation in the country will accelerate as a result of the likely fall of the pound. "Even in the case of the soft Brexit, a high level of uncertainty will remain, which will continue to put pressure on the UK economy," said M. Saunders. "In this case, it may be appropriate to maintain a very stimulating monetary policy for a long period and possibly soften it at some stage, especially if global growth remains disappointing," he said. On the statements of M. Saunders, the pound depreciated against the US dollar by about 0.5%, to $1.2278. Now it remains to be seen whether the GBP/USD will be able to find support on local minima or continue to decline, as the focus is on another round of negotiations on an agreement for Fog Albion's withdrawal from the EU. Today, British Minister of Brexit Stephen Barclay and EU chief negotiator Michel Barnier are due to meet in Brussels. In essence, they have nothing to discuss, because nothing new London can offer Brussels. The British parliament cannot decide on the Brexit project and Brussels refuses to make any concessions. United Kingdom Prime, Minister Boris Johnson, continues to promise to pull Britain out of the EU with or without an agreement on October 31. The material has been provided by InstaForex Company - www.instaforex.com |
| BTC 09.27.2019 - BTC almost reached our first target, watch for selling on the rallies Posted: 27 Sep 2019 06:40 AM PDT BTC has been trading downwards as I expected. The BTC is approaching our first downward target from previous forecast at the price of $7,510. My current expectation is that we might see small rally and more potential downside towards the level of $7,510.
Blue horizontal lines – Support levels based on the price action Red rectangle – Swing low acting like resistance Yellow rectangle – Major resistance Falling purple line – Expected path MACD oscillator is showing bullish divergence, which may cause BTC to rally.. Good selling zone is set at $8,420-$8,450. Based on the 4H time-frame, I BTC is still trading in the downward channel with not big signs for any reversal. Downward targets are set at the price of $7,510 and $6,645. The material has been provided by InstaForex Company - www.instaforex.com |
| Fed driven by trump lures EUR/USD bears into a trap Posted: 27 Sep 2019 06:38 AM PDT Whether Fed officials want it or not, the regulator seems to be under the heel of Donald Trump. When the American president began to criticize the head of the Federal Reserve Jerome Powell, it looked like nothing more than a childish prank because from the point of view of the law. The White House can not impose its will on the Central Bank. However, in reality, it turned out that it can - indirectly, through financial markets. The more actively Trump calls on the Fed to lower the interest rate, the higher are the chances of monetary expansion. Fearing a collapse in stock indices, the regulator is forced not only to weaken monetary policy but also to soften the rhetoric. First, the Federal Reserve stopped raising the rate, then began to lower it, the day is not far off when it will fall by 1% from the July maximum of 2.5%. Apparently, the US president acts on the principle: let the Central Bank be the head, but it will turn wherever the neck wants. While the whole world is watching the impeachment attempt of Trump, which he is threatened by democrats, the main event for the foreign exchange market has been a steady decline in the euro. On the eve of the Federal Reserve Bank of New York, it increased the limit of one-day operations from $75 billion to $100 billion, however, demand was still higher. The reasons for the lack of liquidity are called auctions for placement of treasuries and the tax period. It is noteworthy that a significant proportion of the excess reserves of the American banking system is at the disposal of four financial institutions - BofA Merrill Lynch, Citigroup, JP Morgan Chase, and Wells Fargo. It is possible that they act on the orders of the White House, forcing the Fed to return to build up the balance, including through the resuscitation of QE. If so, then Trump acts very competently. In this regard, the potential for EUR/USD decline seems to be limited to the areas of 1.0875-1.0885 and 1.0775-1.0795, even despite the divergence in the economic growth of the United States and the eurozone, as well as a large-scale monetary stimulus from the ECB. The Hawks refused to follow Mario Draghi's calls to rally the Governing Council. The head of the Bundesbank, Jens Weidmann, said he was ready to do everything possible so as not to delay the increase in interest rates and Sabine Lautenschlager, who did not agree with the resumption of QE, resigned. It should be noted that it is the representatives of the German lobby who are the main opponents of the weak euro currency. If we add France's intentions to increase fiscal stimulus by €10 billion in 2020 and Paris calls for Berlin to start investing in the eurozone as soon as possible. It becomes obvious that the common European currency is not doing as bad as is commonly believed. The material has been provided by InstaForex Company - www.instaforex.com |
| Posted: 27 Sep 2019 05:45 AM PDT To open long positions on GBP/USD, you need: In the first half of the day, the update of a large support in the area of 1.2284, which I drew attention to in my morning review, led to a return to the buyers market, and a large surge in volume at this level indicated the exit of speculative sellers of the pound by the end of the week. At the moment, the task of the bulls remains the test level of 1.2351, where I recommend fixing the profit. In the scenario of GBP/USD decline in the second half of the day after the US data, it is best to consider new long positions from the new monthly low of 1.2238, as bulls are unlikely to try to hold the support of 1.2284 again. To open short positions on GBP/USD, you need: The bears have completed all the tasks for this week and retreated after the test minimum of 1.2284, which I paid attention to in the morning. At the moment, it is best to count on short positions in the pair after the formation of a false breakdown in the resistance area of 1.2351 or sell immediately for a rebound from the maximum of 1.2400. The main movement will be based on data on the spending and income of Americans, which is a leading indicator of the future state of the economy. If sellers manage to break below the level of 1.2284 in the second half of the day, the downward trend is likely to be limited only in the support area of 1.2238. Signals: Moving Averages Trading is below 30 and 50 daily averages, which indicates a bearish trend. Bollinger Bands The resistance is the average border of the indicator around 1.2315, a breakthrough of which will lead to larger growth of the pound.
Description of indicators
|
| Posted: 27 Sep 2019 05:45 AM PDT To open long positions on EURUSD, you need: In the first half of the day, data on the consumer confidence index came out, which in September did not deteriorate, but remained unchanged compared to August, which allowed the bulls to keep the morning support level of 1.0900, which I drew attention to in my review. Now, the task of the bulls is to break through and consolidate above the resistance of 1.0938, which can happen after the release of the report on the change in the volume of orders for durable goods in the US. The key target of the bulls at the end of the week will be a maximum of 1.0967, where I recommend fixing the profit. In the scenario of a further decline of EUR/USD in the second half of the day on the trend, the same minimum of 1.0905 will provide support, but it is best to open larger long positions on a rebound from the area of 1.0873. To open short positions on EURUSD, you need: Bears have not coped with the morning task, and the whole calculation is now on the resistance. The formation of a false breakdown after the release of the US data will be the first signal to open new short positions to break through and consolidate below the level of 1.0905, which will provide an influx of new sellers of the euro. The main task of the bears will be to test the lows in the area of 1.0873 and 1.0840, where I recommend fixing the profit. In the scenario of buyers returning to the market and rising above the resistance of 1.0938 in the afternoon, it is best to return to short positions by a rebound from the maximum of 1.0967, however even this will not lead to a break in the current downward trend. Signals: Moving Averages Trading is below 30 and 50 moving averages, which indicates the continuation of the bearish trend. Bollinger Bands The upper border of the indicator in the area of 1.0938 kept the pair from growing, however, its break will come to a new upward wave. In the case of a decline in the euro in the afternoon, the lower border of the indicator in the area of 1.0910 will provide support.
Description of indicators
|
| Fractal analysis for major currency pairs as of September 27 Posted: 27 Sep 2019 05:45 AM PDT Hello, dear colleagues. For the Euro/Dollar pair, we expect the continuation of the downward movement after the breakdown of 1.0910 and the level of 1.0966 is the key support. For the Pound/Dollar pair, we expect the continuation of the downward movement after the breakdown of 1.2286. For the Dollar/Franc pair, the development of the upward structure from September 24 is expected after the breakdown of 0.9954 and the level of 0.9908 is the key support. For the Dollar/Yen pair, we expect the continuation of the upward movement after the breakdown of 108.25 and the level of 107.77 is the key support. For the Euro/Yen pair, we are following the downward structure from September 18 and the continuation of the downward movement is expected after the passage of the range of 117.73 – 117.51 and the level of 118.28 is the key support. For the Pound/Yen pair, the development of the downward structure from September 20 is expected after the breakdown of 132.40. Forecast for September 27: Analytical review of currency pairs on the H1 scale:
For the Euro/Dollar pair, the key levels in the H1 scale are 1.1052, 1.1024, 1.0991, 1.0966, 1.0911, 1.0880, and 1.0839. We continue to follow the development of the downward structure of September 13th. The short-term downward movement is expected in the range of 1.0911 – 1.0880 and the breakdown of the last value will lead to a movement to a potential target of 1.0839, upon reaching this level, we expect a pullback to the top. The short-term upward movement is expected in the area of 1.0966 – 1.0991 and the breakdown of the last value will lead to an in-depth correction. The target is 1.1024 and this level is the key support for the bottom. Its breakdown will allow you to count on movement to a potential target of 1.1052, the level of expected initial conditions for the top. The main trend is the downward structure of September 13th. Trading recommendations: Buy: 1.0966 Take profit: 1.0990 Buy 1.0993 Take profit: 1.1024 Sell: 1.0910 Take profit: 1.0882 Sell: 1.0878 Take profit: 1.0840
For the Pound/Dollar pair, the key levels in the H1 scale are 1.2448, 1.2395, 1.2362, 1.2362, 1.2286, 1.2258, and 1.2203. We follow the development of the downward structure of September 20. The short-term downward movement is expected in the range of 1.2286 – 1.2258 and the breakdown of the last value will lead to a movement to a potential target of 1.2203, upon reaching this level, we expect a pullback to the top. The short-term upward movement is expected in the range of 1.2362 – 1.2395 and the breakdown of the latter value will lead to an in-depth correction. The target is 1.2448 and this level is the key support for the downward structure. The main trend is the downward structure of September 20. Trading recommendations: Buy: 1.2362 Take profit: 1.2395 Buy: 1.2397 Take profit: 1.2446 Sell: 1.2286 Take profit: 1.2260 Sell: 1.2256 Take profit: 1.2204
For the Dollar/Franc pair, the key levels in the H1 scale are 1.0054, 1.0037, 1.0007, 0.9985, 0.9954, 0.9923, 0.9908, and 0.9883. The price issued the expressed initial conditions for the upward cycle of September 24. The continuation of the upward movement is expected after the breakdown of 0.9954. In this case, the target – 0.9985 and in the area of 0.9985 – 1.0007 is the short-term upward movement and consolidation. The potential value for the top is the level of 1.0037, upon reaching which, we expect a consolidated movement in the area of 1.0037 – 1.0054. A short-term downward movement is possible in the area of 0.9923 – 0.9908 and the breakdown of the last value will lead to an in-depth correction. The target is 0.9885 and this level is the key support for the upward potential of September 24. The main trend is the initial conditions for the top of September 24. Trading recommendations: Buy: 0.9955 Take profit: 0.9985 Buy: 0.9987 Take profit: 1.0005 Sell: 0.9923 Take profit: 0.9909 Sell: 0.9906 Take profit: 0.9885
For the Dollar/Yen pair, the key levels in the H1 scale are 109.51, 108.84, 108.59, 108.24, 107.94, 107.77, 107.52, 107.39, 107.18, and 106.95. We follow the development of the upward structure from September 24. The continuation of the upward movement is expected after the breakdown of 108.24. In this case, the target is 108.59 and in the area of 108.59 – 108.84 is the short-term upward movement and consolidation. We consider the level of 109.15 as a potential value for the top, upon reaching this level, we expect a rollback to the bottom. The short-term downward movement is expected in the area of 107.94 – 107.77 and the breakdown of the last value will lead to an in-depth correction. The target is 107.52 and the range of 107.52 – 107.39 is the key support for the top. Its passage in price will lead to the formation of a downward structure. In this case, the potential target is 107.18. The main trend is the upward structure from September 24. Trading recommendations: Buy: 108.25 Take profit: 108.56 Buy: 108.60 Take profit: 108.80 Sell: 107.94 Take profit: 107.78 Sell: 107.75 Take profit: 107.52
For the Canadian dollar/Dollar pair, the key levels in the H1 scale are 1.3379, 1.3343, 1.3326, 1.3297, 1.3260, 1.3235, 1.3198, and 1.3172. The situation is in equilibrium. The continuation of the upward movement is expected after the breakdown of 1.3297. The target is 1.3326 and in the area of 1.3326 – 1.3343 is the consolidation. We consider the level of 1.3379 as a potential value for the top, upon reaching this level, we expect a pullback to the bottom. The short-term downward movement, as well as consolidation, are possible in the area of 1.3260 – 1.3235 and the breakdown of the last value will lead to an in-depth correction. The target is 1.3198 and this level is the key support for the top. Its breakdown will have a downward structure. In this case, the potential target is 1.3172. The main trend is the equilibrium situation. Trading recommendations: Buy: 1.3299 Take profit: 1.3226 Buy: 1.3344 Take profit: 1.3378 Sell: 1.3233 Take profit: 1.3200 Sell: 1.3197 Take profit: 1.3173
The Australian dollar/Dollar pair, the key levels in the H1 scale are 0.6822, 0.6797, 0.6782, 0.6745, 0.6732, 0.6705, and 0.6683. We follow the development of the downward cycle of September 13. The short-term downward movement is possible in the range of 0.6745 – 0.6732 and the breakdown of the last value should be accompanied by a pronounced downward movement. The target is 0.6705 and consolidation is near this value. We consider the level of 0.6683 as a potential value for the bottom, upon reaching which, we expect a departure in the correction. The main trend is the downward cycle of September 13th. Trading recommendations: Buy: 0.6782 Take profit: 0.6795 Buy: 0.6797 Take profit: 0.6820 Sell: 0.6745 Take profit: 0.6734 Sell: 0.6730 Take profit: 0.6707
For the Euro/Yen pair, the key levels in the H1 scale are 119.02, 118.57, 118.28, 117.73, 117.51, 117.10, and 116.73. We follow the development of the downward structure of September 18. We expect the continuation of the downward movement after the price passes the range of 117.73 – 117.51. In this case, the target is 117.10. We consider the level of 116.73 as a potential value for the bottom, upon reaching this value, we expect a rollback to the top. The short-term upward movement is possible in the range of 118.28 – 118.57 and the breakdown of the last value will lead to an in-depth movement. The target is 119.02 and this level is the key support for the downward structure. The main trend is the downward structure of September 18th. Trading recommendations: Buy: 118.28 Take profit: 118.55 Buy: 118.60 Take profit: 119.00 Sell: 117.50 Take profit: 117.10 Sell: 117.08 Take profit: 116.73
For the Pound/Yen pair, the key levels in the H1 scale are 135.81, 134.58, 134.03, 133.06, 132.42, 131.45, 130.78, and 129.88. We follow the development of the downward structure of September 20. The short-term downward movement is expected in the range of 133.06 – 132.42 and the breakdown of the last value should be accompanied by a pronounced downward movement. In this case, the target is 131.45 and in the area of 131.45 – 130.78 is the consolidation. We consider the level of 129.88 as a potential value for the downward movement, upon reaching this level, we expect a rollback to the top. The short-term upward movement is possible in the area of 134.03 – 134.58 and the breakdown of the last value will have to form an upward structure. In this case, the potential target – 135.81. The main trend is the formation of a downward structure from September 20. Trading recommendations: Buy: 134.03 Take profit: 134.55 Buy: 134.60 Take profit: 135.80 Sell: 132.40 Take profit: 131.45 Sell: 131.43 Take profit: 130.80 The material has been provided by InstaForex Company - www.instaforex.com |
| Trading recommendations for the EURUSD currency pair – prospects for further movement Posted: 27 Sep 2019 05:45 AM PDT The euro/dollar currency pair for the last trading day showed volatility close to the daily average of 58 points, as a result of which the quote overcame the ill-fated fulcrum, but whether it can be considered a breakdown, we will analyze in the article. From technical analysis, we see that the quote for the first time since the beginning of autumn fell below 1.0926. Let's start from the beginning, the point of 1.0926 was the very support where the corrective movement originated, which passed into the stage of a wide horizontal course. The coordinates of 1.0926 became not just a periodic value of the support, but a full-fledged range level, where the amplitude boundary could stretch by 30-40 points. Thus, the desire to shout about the breakdown may be premature, it is worth waiting a little longer at least for the price to fix below the mark of 1.0900. As discussed in the previous review, the speculators, having a solid profit more from the value of 1.1000, went into the stage of full fixation as soon as the price began to approach the fulcrum of 1.0926. Insurance always plays an important role, the probability of another rebound from the fulcrum, referring to the regularity of the past, was high, and what's the point of taking risks, if in any case there is always the opportunity to enter again. Naturally, no one canceled further short positions in terms of consideration, but the transition was planned below 1.0900, which did not happen. Considering the trading chart in general terms (daily period), there is a direct arrangement of Feng Shui. The global downward trend smoothly leaves the zone of sleep, where there is an attempt to break the fulcrum of the corrective course. In the case of confirmation of the breakdown and the preservation of the inertial course, the downward move can return us to the area of the values of the beginning of 2017, which cannot but rejoice, but, again, do not make hasty conclusions, wait for clarification in terms of the mood of the sellers. The news background of the previous day had data on the GDP of the United States for the second quarter, where the rate of economic growth was confirmed in the form of a slowdown from 2.7% to 2.3%. The reaction of the dollar in terms of weakening was short-term, where the recovery came almost immediately. In terms of the information background, there was an uproar about the resignation of one of the leaders of the European Central Bank, Sabine Lautenschlager. The ECB statement did not explain the reason for the resignation, but if you refer to anonymous sources, the reason lies in Sabina's tough stance on the resumption of the quantitative easing program (QE). We saw a difference of opinion that led to the resignation. The available news is not so fresh, as information about the resignation appeared on the night of Wednesday to Thursday, that is, at the time of the inactive trading session. We probably got some belated market reaction. In terms of the rest of the information noise, in a sense, everything is calm. The hysteria about the impeachment of US President Donald Trump has faded, which was to be expected, and interesting statements about Brexit did not come out. If we step back a little from the background and go simply to the prospects of the eurozone economy, we see that the level of industry has fallen to its lowest in the last six years due to the influence of uncertain trade tensions and, of course, Brexit as a factor of deterioration. Thus, when we talk about a global downward trend for EURUSD, there are many factors, and a change in the mood at this time is not foreseen. Today, in terms of the economic calendar, we have only data on orders for durable goods in the United States, where they are projected to decline by 0.1%, which can put local pressure on the US dollar. At a similar time, a member of the Fed Open Market Committee R. Quarles will give a speech, but I doubt that something solid will be said. The upcoming trading week in terms of the economic calendar pleases with a wide profile of statistical data, where from Monday to Friday there is plenty of news for comfortable trading in terms of volatility. In any case, the flow of spontaneous information background will support the interest of ardent speculators. The most interesting events displayed below: On Monday, September 30th 07:00 to 08:55 London time – It is worth monitoring statistics package from Germany EU 10:00 London time – Unemployment rate (August): Prev 7.5% – Forecast 7.5% On Tuesday, October 1st Germany 08:55 London time – German manufacturing PMI (September): Prev 41.4 EU 10:00 London time – Index of business activity in the manufacturing sector (PMI) (September): Prev 45.6 – Forecast 47.0 USA 15:00 London time – ISM index of business activity in the manufacturing sector (September): Prev 49.1 – Forecast 50.4 On Wednesday, October 2nd USA 13:15 London time – Change in the number of employees in the non-agricultural sector from ADP (September): Prev 195K – Forecast 153K On Thursday, October 3rd EU 09:00 London time – Index of business activity in the services sector (September): Prev 52.0 – Forecast 53.4 EU 10: 00 London time – Retail sales (y/y) (August): Prev 2.2% – Forecast 2.0% USA 15:00 London time – ISM Business Activity Index for Services Sector (September): Prev 56.4 – Forecast 55.8 On Friday, October 4th USA 13:30 London time – The number of new jobs created outside the agricultural sector (September): Prev 130K – Forecast 162K Further development Analyzing the current trade chart, we see that the price continues to swing within the previously completed fulcrum of 1.0926, where an explicit accumulation is formed with an approximate amplitude of 1.0900/1.0940. Speculators, in turn, are waiting for distinct signals of what will happen next – another rebound or a breakdown. In any case, there are good opportunities for earnings, thus monitoring the behavior of quotes and price-fixing points. It is likely to assume that the amplitude fluctuation of 1.0900/1.0940 will continue for some time, where it is necessary to monitor the price-fixing points relative to the expected boundaries. As you may have guessed, the trading method for the near future: Breakdown/Rebound. Based on the above information, we will derive trading recommendations:
In both cases, it is advised to fix the potential of the inertial motion, so that the probability of success is high. Technical analysis Analyzing different sectors of timeframes (TF), we see that the indicators in the short-term areas signal an upward interest, which may display a rebound signal, but the quote is still within the expected accumulation. The intraday and medium-term outlook maintain a downward mood against the general background of the market. Volatility per week / Measurement of volatility: Month; Quarter; Year Measurement of volatility reflects the average daily fluctuation, calculated for the Month / Quarter / Year. (September 27 was built taking into account the time of publication of the article) The volatility of the current time is 34 points, which is more than 56% of the daily average. It is likely to assume that if one of the scenarios occurs – breakdown or rebound, the volatility will increase, exceeding the daily average. Otherwise, due to stagnation (accumulation), volatility of the day will be limited. Key level Resistance zones: 1.0926**; 1.1000***; 1.1100**; 1,1180* ; 1.1300**; 1.1450; 1.1550; 1.1650*; 1.1720**; 1.1850**; 1.2100. Support zones: 1.0926**; 1.0850**; 1.0500***; 1.0350**; 1.0000***. * Periodic level ** Range level *** Psychological level **** The article is based on the principle of conducting transactions, with daily adjustments. The material has been provided by InstaForex Company - www.instaforex.com |
| Trading recommendations for the GBPUSD currency pair – prospects for further movement Posted: 27 Sep 2019 05:03 AM PDT The pound/dollar currency pair showed a low volatility of 77 points over the last trading day, but this fluctuation was enough to focus below the level of 1.2350. From technical analysis, we see that the process of fixing the price below 1.2350 was in full swing, where the amplitude of the oscillation had a range of 1.2300/1.2380. Is this platform a regrouping of trading forces after the breakthrough from the level of 1.2500? Yes, very likely, since a stop/rollback was necessary in this case. As discussed in the previous review, speculators are delighted with the past fluctuations, so, the main profit from the move to 1.2500 (1.2400) – 1.2350 was recorded yesterday, in the first half of the day. After that, the process of monitoring the behavior of quotes began, just in the phase of fixing the price relative to the level of 1.2350. The task was to identify a breakdown or a rebound relative to the level of 1.2350, where sellers seemed to have trump cards, who nevertheless saw the potential for further decline, and the point of 1.2325 became a reference point. The primary prospect, in this case, was located at around 1.2300, where the quote reached 1.2302, but after that, it slowed down the fluctuation just around the Pacific-Asian trading session. Considering the trading chart in general terms (day period), we see that the theory of recovery of the initial downward trend has almost passed into the stage of implementation in terms of producing 48% relative to the elongated correction. Of course, it is too early to talk about a full resumption of the downward trend, as the support point of 1.1957 is still more than 300 points, but progress is already being felt. The news background of the previous day had data on the GDP of the United States for the second quarter, where the rate of economic growth was confirmed in terms of slowing from 2.7% to 2.3%. The US dollar, in turn, retained its leading position in terms of growth, as compared with the British currency, things are much better in the States. While the news background pokes fun at the not-so-successful Prime Minister Boris Johnson, the consequences of Brexit continue to hit business in Britain. So, Jaguar Land Rover announced its intention to suspend production in the UK because of Brexit. In this case, we are talking about the suspension of four factories in Britain in the first week of November to mitigate the consequences of a failure in the supply of components after the country's exit from the EU. Let me remind you that in August, automakers such as Toyota and BMW (Mini) announced stopping production of cars at British factories on October 31 and November 1 for the same reason. This morning, the pound was no longer set, a speech will be made by a member of the Bank of England Monetary Policy Committee, Michael Saunders, who said that regardless of Brexit's outcome, whether hard or by agreement, the UK needs to cut its key rate. Naturally, the pound could not resist such positive news and continued to decline in the form of a local impulse candle (08:00 London time). In terms of news flow, in the afternoon, we are waiting for data on orders for durable goods in the United States, where they are predicted to decrease by 0.1%, which may put local pressure on the US dollar. The upcoming trading week in terms of the economic calendar expects to be no less interesting. So, since Monday, we have a stream of statistical data, which will publish an estimate of GDP (Q2) of the UK, after which we have packages of indices and, of course, NonFarm data, which will not be ignored by speculators. The most interesting events displayed below: On Monday, September 30th Great Britain 09:30 London time – GDP y/y Q2: Prev 1.2% Great Britain 09:30 London time – Number of approved mortgages (August): Prev 67.31K – Forecast 66.17K Great Britain 09:30 London time – Volume of mortgage lending (August): Prev 4.61V – Forecast 3.70V On Tuesday, October 1st Great Britain 09:30 London time – The index of business activity in the manufacturing sector Markit (September): Prev 47.4 USA 15:00 London time – ISM index of business activity in the manufacturing sector (September): Prev 49.1 – Forecast 50.4 On Wednesday, October 2nd USA 15:00 London time – Change in the number of employees in the non-agricultural sector from ADP (September): Prev 195K– Forecast 153K On Thursday, October 3rd Great Britain 09:30 London time – Composite PMI (September): Prev 50.2 Great Britain 09:30 London time – Index of business activity in the services sector (September): Prev 50.6 – Forecast 51.0 USA 15:00 London time – ISM business activity index for services sector (September): Prev 56.4 – Forecast 55.8 On Friday, October 4th USA 13:30 London time – The number of new jobs created outside the agricultural sector (September): Prev 130K – Forecast 162K Further development Analyzing the current trading chart, we see a local speculative surge due to the speech of Michael Saunders, after which a partial recovery effect, which fully reflects the speculative process. The very same movement in terms of recovery is developing in the right format, overcoming the periodical coordinates of 1.2300. In turn, speculators continue to feast, previously open trades in the area of 1.2325 is already profitable, where the background of the jump was a partial commit. It is likely to assume that the surge caused by the information background, temporarily stalled in the area of current values, where it is necessary to observe the behavior of quotes and how sellers are willing to go further in terms of decline. Thus, the outcome of the current day can be in two scenarios: Firstly, the hype subsides and we again return to the level of 1.2350, where we already observe the behavior of the quotes, in terms of the next gulf of short positions; the second scenario displays the opposite picture, that is, relative to the current points, a stop is formed, where, as a result, sellers come back, which are fixed below 1.2270, which makes it possible to resume the downward move towards 1.2200 – 1.2150. Based on the above information, we concretize trading recommendations:
Technical analysis Analyzing a different sector of timeframes (TF), we see that the process of restoring quotes turned all the indicators in the downward direction, where we see an almost unanimous decision. As you know, in the case of the first scenario, the indicators on the minute and intraday intervals will turn in the opposite direction. Volatility per week / Measurement of volatility: Month; Quarter; Year Measurement of volatility reflects the average daily fluctuation, calculated for the Month / Quarter / Year. (September 27 was built taking into account the time of publication of the article) The volatility of the current time is 65 points, which is not bad for this period. It is likely to assume that volatility can still grow, but in the case of a slowdown and a proper background, we will be limited to 80-100 points. Key level Resistance zones: 1.2350**; 1.2500**; 1.2620; 1.2770**; 1.2880 (1.2865-1.2880)**. Support zones: 1.2150**; 1.2000***; 1.1700; 1.1475**. * Periodic level ** Range level *** The article is based on the principle of conducting transactions, with daily adjustments. The material has been provided by InstaForex Company - www.instaforex.com |
| Technical analysis of EUR/USD for September 27, 2019 Posted: 27 Sep 2019 03:27 AM PDT Overview: Daily pivot point: 1.0943. The EUR/USD pair continues to move downwards from the level of 1.1050. Yesterday, the pair dropped from the level of 1.0967 to the bottom around 1.0905 yesterday. The first resistance level is seen at 1.0943 followed by 1.0967, while daily support 1 is seen at 1.0905. The RSI starts signaling a downward trend, as the trend is still showing strength above the moving average (100) and (50). Thus, the market is indicating a bearish opportunity below 1.0967. The price is in a bearish channel now. Amid the previous events, the pair is still in a downtrend because the price spot of 1.0967 remains a significant resistance zone. Therefore, a possibility that the EUR/USD pair will have downside momentum is rather convincing and the structure of a fall does not look corrective. In order to indicate a bearish opportunity below 1.0967, sell below 1.0967 with the first targets at 1.0880 and 1.0854. Trading recommandations: The pair is trading below its pivot point. It is likely to trade in a lower range as long as it remains below the pivot point. Short positions are recommended with the first target at 1.0880. A break of that target will move the pair further downwards to 1.0854. The pivot point stands at 1.0943. However, the stop loss should be located above the level of 1.1006. Overall I still prefer a bearish scenario at this phase in the 1-hour time frame. The material has been provided by InstaForex Company - www.instaforex.com |
| Back to the bottom: Bitcoin collapse - the result of market manipulations? Posted: 27 Sep 2019 03:07 AM PDT The steady collapse of the main cryptocurrency over several trading sessions has caused legitimate questions of market participants. Experts at Arcane Research, a leading research firm, believe that the sharp decline is the result of active market manipulation. For four consecutive sessions, Bitcoin has been declining. On Thursday, September 26, cryptocurrency No. 1 continued to fall, losing 5% and dropping to $7,800 at the moment. Since the beginning of this week, the leading digital asset has fallen by an impressive 20%, analysts say. Arcane Research highlights such important fact as the espionage of futures contracts for bitcoin. Experts believe that this is the cause of the downturn. According to their observations, from January 2018 to August 2019, the price of PTS was actively decreasing just before quarterly excesses. This was recorded in 75% of cases, that is, 15 out of 20. Arcane Research researchers emphasize that the asset's value has fallen by about 2.27% recently in the run-up to the exploitation of bitcoin futures contracts. Most experts believe that in the near future the forecast for the price of PTS will remain "bear" as cryptographic currency No. 1 trades below the $9,100 level. Analysts see the Bakkt Bitcoin futures as the main reason for the bearish trend, which has become a catalyst for sales in the cryptocurrency market. However, many believe that the start of another investment instrument simply coincided with the collapse of the market. If anything, Bitcoin now needs support as never before since its decline may be delayed, experts warned. Most experts believe that the forecast for the price of MTC will remain "bearish", while cryptocurrency No. 1 is trading below $9100 in the near future. |
| Posted: 27 Sep 2019 02:58 AM PDT EUR/USD – 4H. As seen on the 4-hour chart, the EUR/USD pair fell to the correction level of 161.8% (1.0918) and closed below it. It should be noted that the closing at the moment is not too confident, and everything can still end with a rebound from the specified level. Nevertheless, a more confident consolidation will increase the probability of a further drop in quotations in the direction of the next corrective level of 200.0% (1.0802) within the downward trend channel, in which the euro/dollar pair continues to be located. If we briefly analyze the information background and the movement of the EUR/USD currency pair over the past year, one thing becomes clear: most of this year, the US currency was in high demand and steadily grew against the euro. Thus, based on this factor, it can be concluded that the initiation of the impeachment procedure of Donald Trump does not affect the growth of the dollar. That is, the reason for the growth of the US currency is not impeachment of Trump. Why? Because Trump has done a lot over the last year of his presidency, which has led to a slowdown in the US economy and the global economy: he launched a trade war with China, which is disadvantageous for both sides, stopped the work of all public services for a record period due to lack of funding. And the dollar continued to grow. Thus, I believe that the main reason for the continued growth of the US currency lies in the strength of the US economy, which even taking into account the slowdown, is still stronger than the European one (if you take the EUR/USD pair). It is not worth talking about the British economy now. Well, the topic of possible impeachment becomes quite clear if you remember the chronology of events and ask yourself the question: what else did the Democrats have to do? That is, Donald Trump, roughly speaking, gave rise to his opponents to begin the impeachment procedure. The main opposing party is the Democratic. The main contender for the presidency in 2020 – Joe Biden – representative of the Democrats. Donald Trump asked Vladimir Zelensky to investigate Biden's activities in Ukraine. It is clear that to cast a shadow on the main competitor in the run-up to the presidential election. The circle is complete. The Democrats had no choice but to take advantage of the given chance and start the impeachment procedure, as there are reasons for this. Trump was accused of violating the oath, and, according to rough estimates, 218 politicians are ready to support the start of the impeachment procedure. That's how many votes it takes to start the procedure. And what the outcome of this procedure – it does not matter. If by some miracle it will be possible to displace Trump from his post – fine, the Democrats need it. If it does not succeed, then to cast a shadow on Donald Trump, who, it turns out, tried to get foreign aid in the 2020 elections and not quite honestly "eliminate" the main competitor, is also excellent. So it doesn't matter how the impeachment process ends? These are political wars between the two main parties of the country, between the two candidates for the presidency. No more. On September 27, I expect the euro/dollar pair to continue falling in the direction of the correction level of 200.0% (1.0802). The information background today can be tangible, as several important economic reports will be released in America, and the topic of impeachment of the President may also be developed. The rebound of quotations from the Fibo level of 161.8% will work in favor of the euro and will allow traders to count on some growth in the direction of the correction level of 127.2% (1.1024). The Fibo grid is based on the extremes of May 23, 2019, and June 25, 2019. Forecast for EUR/USD and trading recommendations: I recommend today to remain in previously opened sales with the target of 1.0927 and to open new ones with the target of 1.0802 if closing at 1.0918 is completed. A stop-loss order above the level of 1.0927. It will be possible to buy the pair after the close above the downward trend channel, before – I do not recommend it. The material has been provided by InstaForex Company - www.instaforex.com |
| Posted: 27 Sep 2019 02:58 AM PDT GBP/USD – 4H.
As seen on the 4-hour chart, the GBP/USD pair performed a fall to the corrective level of 23.6% (1.2293), thus reaching the target on the previous signal. The consolidation of the pound/dollar pair under this Fibo level will work in favor of continuing the fall of quotations in the direction of 1.2014 (1.1959). At the moment, no indicator has any emerging divergences, and there is likely to be no rebound from the correction level of 23.6%. The passions in the British Kingdom calmed down a bit after the Supreme Court decided to overturn the decision of Boris Johnson to suspend the work of Parliament until October 14. The work of Parliament resumed, the opposition continues to fight with the Prime Minister and the Prime Minister – with the opposition. But the closer the October 31 date approaches, to which only 5 weeks remain, the more pressing the question is: how, exactly, is Boris Johnson going to implement his Brexit "No Deal" if Parliament obliged him to ask for a delay from the European Union? There are several options. First: Johnson will really violate the laws and will not ask for a postponement, so Brexit will be implemented on October 31, and then the Prime Minister will be involved in many years of litigation with a whole bunch of appeals. In this case, he will face a real prison term, and the opposition will do everything possible to make this punishment real for Johnson. Second: Johnson will indeed send a letter to EU leaders asking them not to postpone Brexit's date. It is difficult to say whether such an option is real and how the European Union will react to it. But still, theoretically, this is possible. Then the UK will again leave the EU on October 31 according to the "No Deal" scenario. Third: Johnson has a hidden ace in his sleeve and, of course, does not play it ahead of time. That is, it has a surprise. But what a surprise it may be, now one can only guess. And there are no possible answers. Fourth: Boris Johnson is just bluffing and at the summit on October 17-18, he will ask EU representatives to postpone Brexit on January 31 next year, despite his desire to "die in a ditch, just not to ask the EU for a new transfer of Brexit." For the pound, another portion of the uncertainty is like death. Traders fear a dark future and in such circumstances do not risk simply selling the British pound. Indeed, why take the risk ahead of the unknown actions of Boris Johnson, if you can buy a dollar that continues to grow to many currencies? Therefore, for the pound to regain demand among traders, it is necessary that, firstly, the situation with the actions of Boris Johnson became clear, and secondly, that these actions were not associated with Brexit "No Deal". What to expect from the pound/dollar currency pair today? The pound/dollar pair continues the process of falling. Today, traders have the right to expect consolidation under the correction level of 23.6% (1.2293) and further fall of the pound/dollar pair in the direction of 1.2014. The information background will remain negative for the pair, at least until the release of the report on orders for durable goods in the US. The Fibo grid is based on the extremes of March 13, 2019, and September 3, 2019. Forecast for GBP/USD and trading recommendations: I do not recommend buying the pair shortly, as traders have again started and continue active sales. Information background on the side of the US currency. I recommend considering the new sales of the pair with a target of 1.2014 if a close is performed under the level of 23.6%, with the stop-loss order above the level of 1.2308. The material has been provided by InstaForex Company - www.instaforex.com |
| Posted: 27 Sep 2019 02:11 AM PDT In the foreign exchange market, there is a discussion of the possibility of a fall in the single European currency to parity with the US dollar. Investors, who are evaluating the prospects for starting a new stimulus program, admit this probability. Indeed, watching everything that happens, I want to ask if such a probability really exist or will it all end at best near the minimum values that were at the beginning of 2017? Of course, evaluating such prospects, one should also consider the state of the American economy, Fed's view of monetary policy. the increased risks of Donald Trump's impeachment, and the situation surrounding the US global trade war with China. That is, aside from other events such as the economic situation in the eurozone, the ECB monetary policy, the Brexit crisis, as well as the consequences of a rash migrant policy, primarily of the German authorities. Analyzing the big picture in the eurozone or wide Europe, we note that the slowdown in the region's economy against the backdrop of the uncertainty of possible losses from Britain's exit from the EU has already forced the ECB to decide on the beginning of new stimulus measures from October 1 of this year. The program will affect the purchase of government bonds, corporate securities, as well as pumping the financial system with liquidity. In addition, there is the likelihood of an even deeper reduction in rates on negative territory. In fact, we can say that Europe has taken almost all measures that are possible in this situation but what about the US? According to the latest release on Thursday, the growth of the American national economy is 2.0%. Inflation is at 1.7% and the unemployment rate is at 3.7%, which is the lowest over the past 50 years. In our opinion, if it had not been for the start of the US-Chinese trade war, the Fed would not have started lowering interest rates. This decrease is due to the desire of the regulator to insure itself against a possible negative lack of trade agreements. Yes, the bank began to conduct repos to support liquidity in the financial system. While there is a discussion about whether to continue actively reduce the cost of borrowing or not, the dollar is doing pretty well. Another important point, despite the low yield of government bonds in the United States characteristic of economically developed countries, they are higher than, for example, the German "bundes." So, is there a chance that the eurodollar pair will fall to the level of parity or not? We believe that while the Fed will discuss economic growth in America, it will remain at an acceptable level of 2.0% amid low unemployment and inflation near the current level. The pair will continue to fall to the minimum values of 2017. But whether there will be parity in the future or not, it will largely depend on the prospects for concluding a new trade agreement between Washington and Beijing, the state of the American and European economies, as well as other reasons some of which we mentioned above. Yet, overall, we assess the likely trend of the pair as negative in the short term. Forecast of the day: The EUR/USD pair is consolidating above the level of 1.0905. Overcoming it against the background of the expected positive data on basic orders for durable goods, as well as the basic price index for personal consumption in the US, will lead to a continued fall in prices to 1.0830. The GBP/USD pair remains under pressure above 1.2285. We believe that it will continue to fall in the wake of the government crisis in Britain and the impasse in negotiations with the EU generated by Brexit. A breakthrough at the level of 1.2285 will lead to a decrease in prices to 1.2200 and an additional incentive to reduce will be positive data on the US economy. |
| The euro is confused: To find the bottom? Push off? Does it have enough strength? Posted: 27 Sep 2019 02:06 AM PDT The single European currency faced a number of difficult questions. It has repeatedly declined over several trading sessions, but now, it is necessary to stop, take a breath and begin a gradual rise. However, experts believe that this is hardly possible in the near future. A prolonged fall in the euro is in the spotlight of the currency markets. On Thursday, September 26, most of the world's leading currencies strengthened against the US dollar, but the "European" was an exception. Its collapse began shortly after the opening of the American market, and by the end of the European session, the process gained momentum. Even a strong IFO report on Germany, reflecting the country's business climate index, could not contain the fall of the euro. In addition, the European currency was not supported by the growth of the GFK consumer confidence index in Germany. These two positive economic factors passed by the "European". Experts are sure that the EUR / USD pair can be supported by the launch of budgetary incentives from the German regulator. However, Berlin has not yet decided on these measures. In such a situation, the probability of EUR / USD falling to the level of 1.0800 increases significantly, analysts warn. Moreover, more pessimistic forecast for the single European currency is the assumption by experts of the largest Japanese bank MUFG. Experts are sure that it can fall to a critical level of 1.0500. This is possible in case of breakdown of the level at 1.0926, emphasize in MUFG. On Thursday, September 26, the euro was trading at around 1.0944, and before that, the EUR / USD pair declined to 1.0923. Experts consider this indicator the weakest since mid-2017. MUFG believes that conflicting economic data and an unstable news background on both sides of the Atlantic play against the European currency. The strengthening of the American currency also contributes to the weakening of the "European", analysts emphasize. "Cherry on the cake", which put the bandwagon on the euro, was weak data on the eurozone economy, which raised concerns about the inevitable recession, while economic data in the US exceeded the expectations of the market. According to MUFG's forecasts, the EUR / USD pair will be at the level of 1.0700 by the end of the year. Experts believe that the pair is moving towards the middle of the "bear" channel. Currently, the EUR / USD pair is trading in the range 1.0916–1.0922. The "bearish" trend in relation to the euro has reached a new low since the beginning of this year, experts sum up. |
| Posted: 27 Sep 2019 01:58 AM PDT Political uncertainty in the United States and Trump's controversial statements regarding the prospects for a trade agreement with China put pressure on investor sentiment, stock markets do not find reason to resume growth. At the same time, macroeconomic indicators, primarily in one way or another are responsible for inflation, looked quite convincing this week. The housing price index rose by 0.4% in July, which turned out to be slightly better than expected. Other data released include a steady growth in August for new home sales and a price index of GDP for the second quarter. It increased by 2.6% against the forecast of 2.4%, and the forecast showed a rise in personal consumption prices. Inflationary expectations also seem to be on the rise, but business is in no hurry to adjust them. The yield of 5-year-old Tips inflation-protected bonds has been in a declining trend since April, forming a downward series of local lows. Furthermore, by the end of the week there are no signs of a reversal. A business that assesses the trend better and deeper than consumers assumes that inflation will continue to decline and this means an increase in the likelihood of expanded stimulus measures by the Fed. At the same time, the fact that the business reduces inflationary expectations even against the background of a decrease in the rate and the likelihood of the suspension of the Fed's balance sheet reduction indicates that the dollar is considered as a refuge even in such harsh conditions. In fact, this graph indirectly confirms that the recession in the United States cannot be avoided, and the fact that the dollar is strengthening with such trends indicates that the recession in most other countries is supposed to be even deeper. By Friday evening, volatility may increase, as a number of important releases will be released. On personal income and expenses in August, orders for durable goods, and the consumer confidence index from the University of Michigan will also be published. There may also be surprises regarding the development of the situation with the impeachment of Trump. In general, an increase in demand for defensive assets is likely by the end of the week. EUR/USD pair After the unexpected resignation of ECB board member Sabina Lautenschlager , the German Ministry of Finance announced yesterday that it would soon propose a new candidate to replace her. Markets see her sresignation as a sign of hawks retreating, which may indicate that an internal discussion in the ECB is taking place in favor of expanding the incentive program. ECB chief economist Lane has already said that the ECB has the opportunity to further reduce rates, citing Denmark and Switzerland as an example with interest rates of -0.75%. The development of events does not contribute to the growth of bullish sentiment on the euro. Furthermore, the update of the two-month low indicates the technical possibility of downward momentum. Today, the European Commission will assess the mood in the business environment. Forecasts are moderately pessimistic and the output of data at the level of expectations will put pressure on the euro. There may also be surprises from speeches by the ECB Vice President Luis de Guindos and the head of the Bundesbank, Weidmann. The support level of 1.0925 turned into resistance that will restrain recovery attempts. The closest target is the level of 1.0865, accounting for 76.4% of the previous wave. At the same time, it is located at the lower boundary of the channel. GBP/USD pair After the Supreme Court of Great Britain ruled that the decision to dissolve Parliament was illegal, the political situation in the country has somewhat calmed down but clarity was not added. The pound lost the chance to develop momentum and downward. The current level of 1.2308 is at the same time as the first support, from which a slight pullback up to 1.2380/85 is possible. However, growth attempts are likely to be used for sales. The next most important support is at the level of 1.2269 and further to 1.2200 if the situation around Brexit does not bring new surprises. The material has been provided by InstaForex Company - www.instaforex.com |
| Posted: 27 Sep 2019 01:18 AM PDT EUR / USD Thursday, September 26, ended for the pair EUR / USD with the loss of another 25 basis points. Thus, a successful attempt was made to break through the lows of waves 3 and 5 , in 3. The confirmation of the readiness of the Forex currency market to continue building a downward trend section, as well as the wave structure of which has acquired a 5-wave form has been received. If this assumption is correct, then the decline in quotations will continue in the direction of the level of 161.8% Fibonacci. Yesterday's second quarter GDP report in America recorded an increase of 2.0%, which was exactly the same how markets expected to see, so there was no euphoria. However, the US dollar continued to increase, despite the fact that there were no other news and reports during the day. The "bearish" mood of the markets is visible to the naked eye. Fundamental component: News with a possible impeachment to Donald Trump is not too much interesting in the market. The markets are eagerly awaiting the economic reports that will come today from the United States. First of all, it is about changing the number of orders for durable goods. Over the past year, just 4 months ended in the red, the last two showed an increase in orders. Thus, a recession may follow again in August, which is what most forecasts indicate. A reduction of 1.0% is expected. This indicator has several variations: indicators excluding transport, excluding defense orders, excluding defense and aviation. All of them are also important, and the market reaction will consist of reactions to each of the 4 reports. Also today a report on the change in personal income is expected... ... and the personal expenses of the Americans. According to forecasts, the growth rate of personal incomes should grow by 0.4%, and expenditures should be reduced to 0.3%. However, these figures will in any case mean an increase in both expenditures and incomes of the American population. The latest to come is the Michigan Consumer Confidence Index. In the last two months, as you can see, consumer confidence has declined, but still remains quite high. By the end of September, no significant changes in the index are expected. Purchase goals: 1.1109 - 0.0% Fibonacci Sales goals: 1.0876 - 127.2% Fibonacci 1.0814 - 161.8% Fibonacci General conclusions and recommendations: The euro-dollar pair has transformed the entire wave markup. Now, I expect the pair to continue to decline with targets located near the calculated levels of 1.0876 and 1.0814, which equates to 127.2% and 161.8% Fibonacci. Wave 5, on the other hand, can turn out to be both very long and shortened. Thus, everything will depend on the news background. GBP / USD The pair GBP / USD on September 26 fell by another 25 basis points. Thus, the construction of the proposed first wave as part of a new downward trend continues. The UK news calendar in recent days is completely empty, and markets can only keep track of messages from the UK Parliament, which does not stop being the main source of news. But, unfortunately, even now, apart from debates and new furious calls by Boris Johnson to support Brexit until October 31 or early elections, no one is taking place. Meanwhile, debate over the possible resignation of Donald Trump continues in the US. An investigation into the pressure on Kiev has been launched because of Trump's desire to investigate the activities of his main rival in the fight for the presidency in the upcoming elections of Joe Biden. Thus, in order for the impeachment process to officially start, the support of 218 votes of the House of Representatives is necessary, and it seems that the right number of votes is at the disposal of the Democrats. The dollar, however, does not really respond to this news. Fundamental component: Today, the UK economic news calendar is empty again. Although, until Great Britain officially leaves the European Union, markets will have an inexhaustible stream of news from the British and European governments, which speak with enviable regularity on Brexit. In addition, there is a huge stream of news from the British Parliament, which continues the confrontation between Boris Johnson and the opposition. Thus, it is these news that I recommend tracking. Sales goals: 1.2297 - 50.0% Fibonacci 1.2229 - 61.8% Fibonacci Purchase goals: 1.2582 - 0.0% Fibonacci General conclusions and recommendations: The upward trend section supposedly completed its construction. Thus, now, I expect a decline in the instrument in the direction of the levels of 50.0% and 61.8% Fibonacci. The news background from the UK and economic reports from the USA continue to have the greatest impact on the dynamics of the euro-dollar instrument. The material has been provided by InstaForex Company - www.instaforex.com |
| Posted: 27 Sep 2019 12:59 AM PDT EUR/USD Analysis: Since August 1, an upward wave structure of the wrong type has been developing on the chart of the European currency. In its wave level, it claims to correct the wave of a long-term trend. In the incomplete last section of the last 2 weeks, the price is adjusted. The price is in the zone of a potential reversal of a large TF. Forecast: The current downward course is expected to be completed. The US session today will be rich in news, which can provoke a sharp increase in volatility, a reversal and the beginning of price growth. Potential reversal zones Resistance: - 1.0980/1.1010 Support: - 1.0910/1.0880 Recommendations: Euro sales make sense in short-term "scalping" deals. It is recommended to monitor the reversal signals to find the optimal entry points in a longer position.
AUD/USD Analysis: The bearish wave that started on September 12 took the place of the correction in the larger wave model of August 7. The price is approaching the upper limit of the strong potential reversal zone, but there are no signals of the rate change on the chart. Forecast: The continuation of the current downward movement is expected in the coming days. At the European session, short-term price growth is possible, not further than the borders of resistance. In the area of estimated support, the probability of completion of the entire current wave is high. Potential reversal zones Resistance: - 0.6780/0.6810 Support: - 0.6710/0.6680 Recommendations: Purchases of "Aussie" today can be very risky. The safest tactic would be to sell the instrument at the end of the upcoming pullback up. When the price reaches the support zone, pay attention to the counter signals.
GBP/JPY Analysis: On the pair chart, an upward wave has been developing since the beginning of September. In the last 2 weeks, the price forms a correction in the form of an expanding triangle. The price reached the support level of a large TF. The structure of the downward wave looks complete. Forecast: The price decline is expected to be completed today. The most likely scenario for the next session will be a "sideways" in the price corridor between the nearest oncoming zones. By the end of the day, we can expect the volatility to increase and the pair's move vector to change. Potential reversal zones Resistance: - 133.30/133.60 Support: - 132.40/132.10 Recommendations: Today, it is better not to sell the pair because of the risk of "price saw". It is recommended to focus on the search for pair buy signals. The time of the news blocks release can serve as a pivot point.
Explanations: In the simplified wave analysis (UVA), the waves consist of 3 parts (A-B-C). The last unfinished wave is analyzed. The solid background of the arrows shows the formed structure, dotted – the expected movement. Attention: The wave algorithm does not take into account the length of time the tool moves! The material has been provided by InstaForex Company - www.instaforex.com |
| Hot forecast for EUR/USD on 09/27/2019 and a trading recommendation Posted: 27 Sep 2019 12:24 AM PDT The forecasts that the US economy is slowing down came true. United States economic growth in the second quarter slowed from 2.7% to 2.3%. In principle, this did not surprise anyone, since that is what preliminary estimates showed. However, the single European currency was already losing ground in the morning, winning back the resignation of Sabine Lautenschlaeger, who represented Germany on the board of the European Central Bank. The reason for her resignation was a disagreement with the policies pursued by Mario Draghi. In addition to the actual resumption of the quantitative easing program, she made a reservation about reducing interest rates. In other words, Lautenschlaeger, almost directly warned everyone that the European Central Bank will reduce the refinancing rate in the near future. Although this is a logical step, after reducing the deposit rate from -0.4% to -0.5%. However, before the publication of the data on the United States GDP for the second quarter, the single European currency fully won back the decline, and then once again went down. The US economy may be slowing down, but the talk about a possible recession has been overshadowed by the realization that the European Central Bank will soon please everyone with a negative refinancing rate. Nevertheless, a rebound in the dollar suggests itself, and market participants are just waiting for a suitable occasion. Today, we may be given such an occasion, in the form of data on orders for durable goods in the United States, which may decrease by 1.0%. Given that these data are largely ahead of industry and retail sales, they indicate a decline in key macroeconomic indicators in the near future. So fears about the recession will only grow. Durable Goods Orders (US): Nevertheless, a rebound in the dollar suggests itself, and market participants are just waiting for a suitable occasion. Today, we may be given such an occasion, in the form of data on orders for durable goods in the United States, which may decrease by 1.0%. Given that these data are largely ahead of industry and retail sales, they indicate a decline in key macroeconomic indicators in the near future. So fears about the recession will only grow. Durable Goods Orders (US): The EUR/USD pair still managed to maintain a downward interest, as a result of which it was not just a control rapprochement with the pivot point of 1.0926, but an attempt to consolidate below while maintaining downward interest. Considering what is happening in general terms, we see that the main downward trend is alive as never before, and if in the process of consolidating/pulling back, the quotation still manages to maintain bearish interest, then we can see an interesting price development in the region of 2017. It is worth considering that the quote kept the 1.0926 coordinate almost all of September and not the fact that we have already passed it. It is likely to assume the formation of a temporary amplitude fluctuation in the region of 1.0900/1.0930, where it is worth analyzing the behavior of quotes and consolidation points. That is, in the work we take two Buy & Sell orders at once, after which we liquidate the previous order and proceed to the conduct of a moving stop. Concretizing all of the above into trading signals: • Long positions, we consider above the level of 1.0935, with the prospect of a move to 1.0965-1.0980. • We consider short positions in case of price consolidation lower than 1.0895, with the prospect of a move to 1.0850. From the point of view of a comprehensive indicator analysis, we see that amid an intense downward mood, indicators unanimously record a sell signal, but in case of accumulation we can see a diverse interest. |

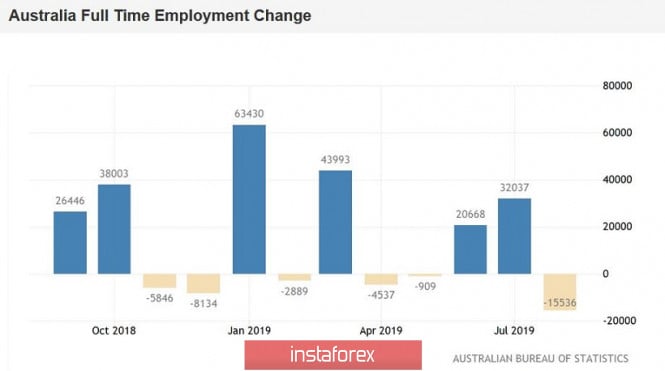
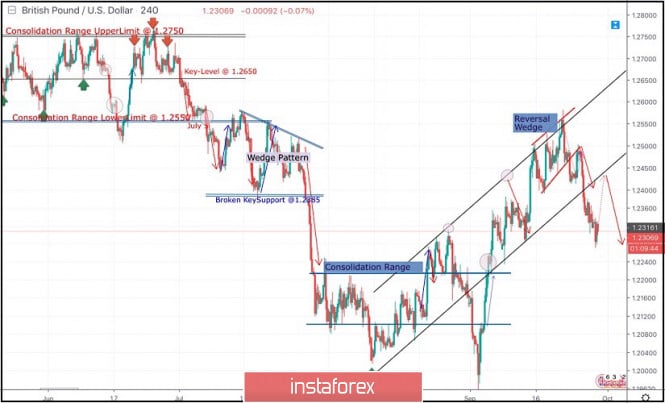
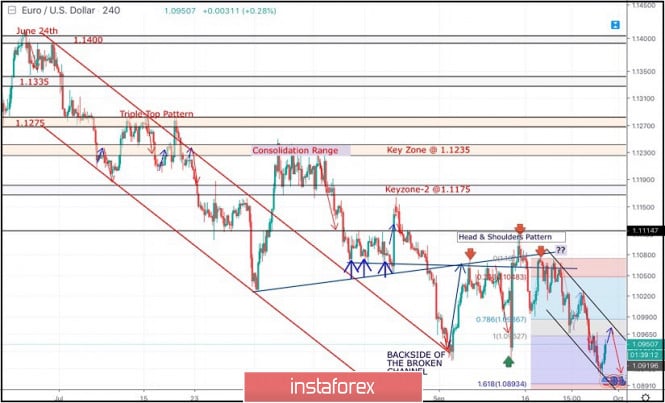

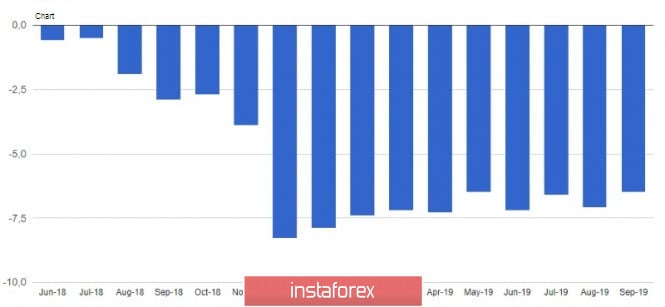
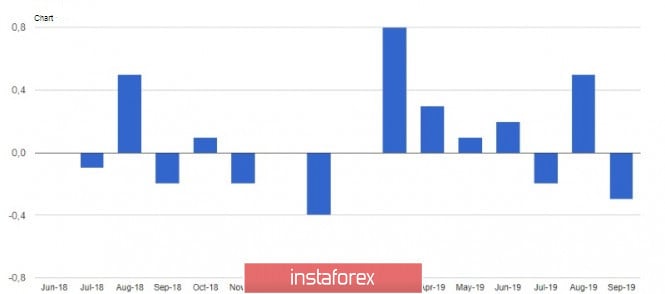
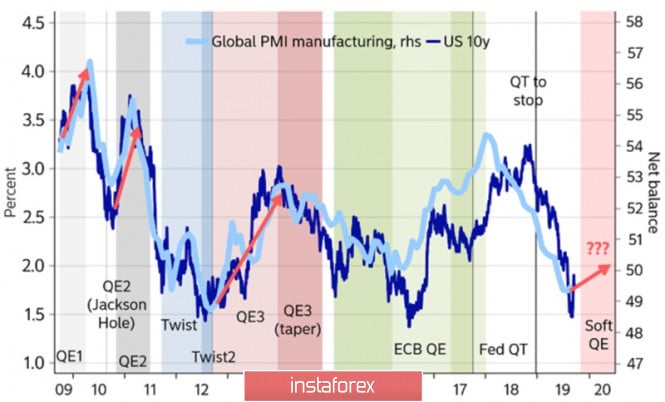
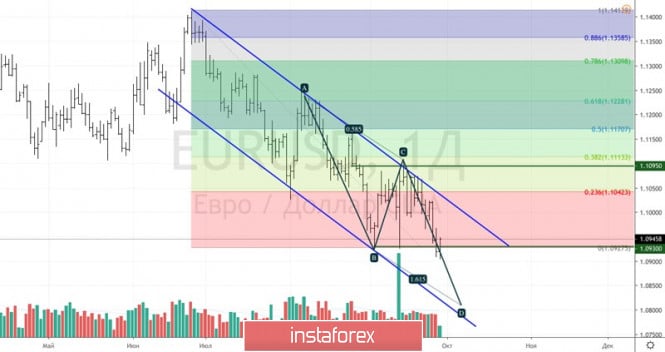
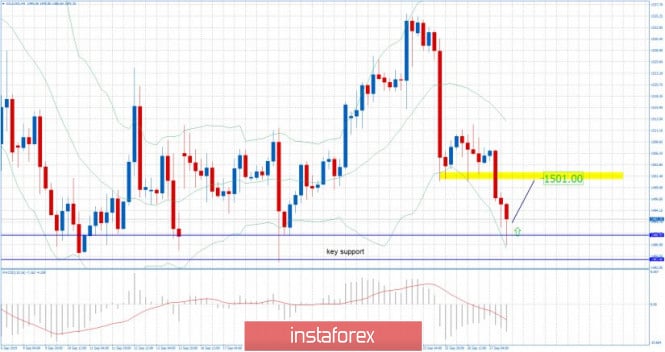
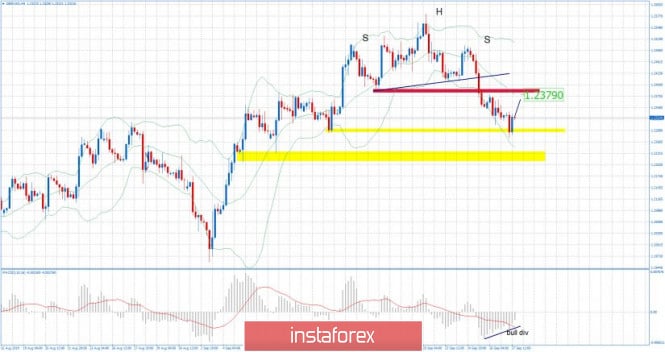
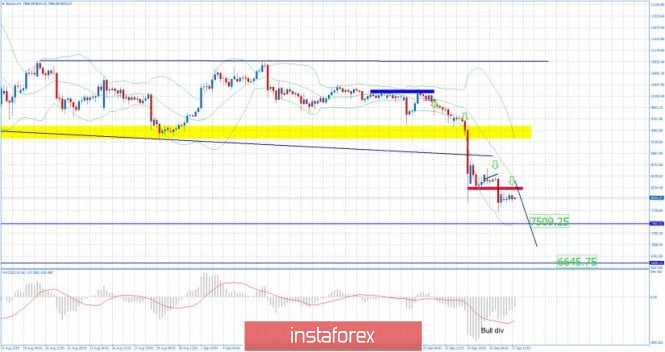

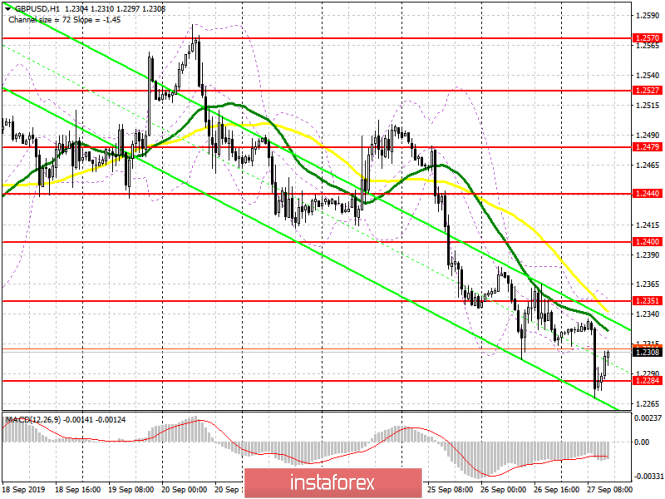
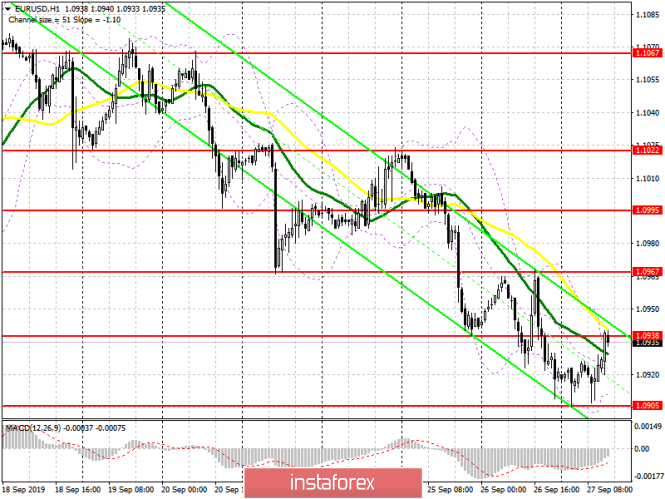
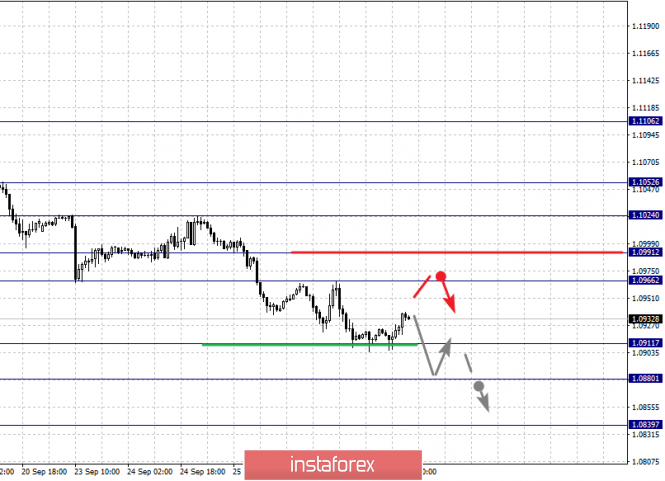
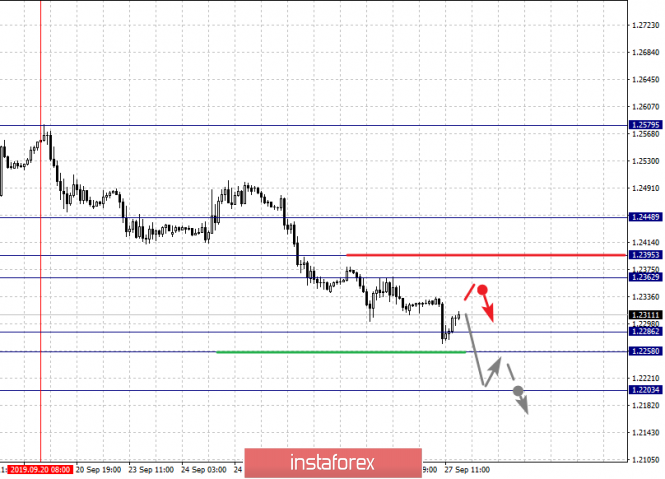
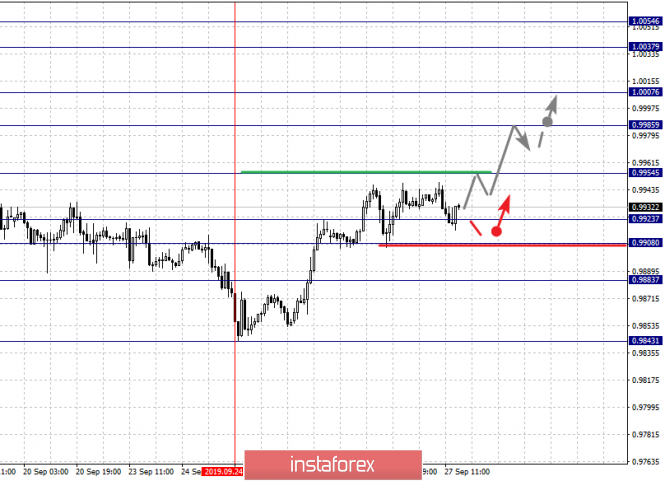
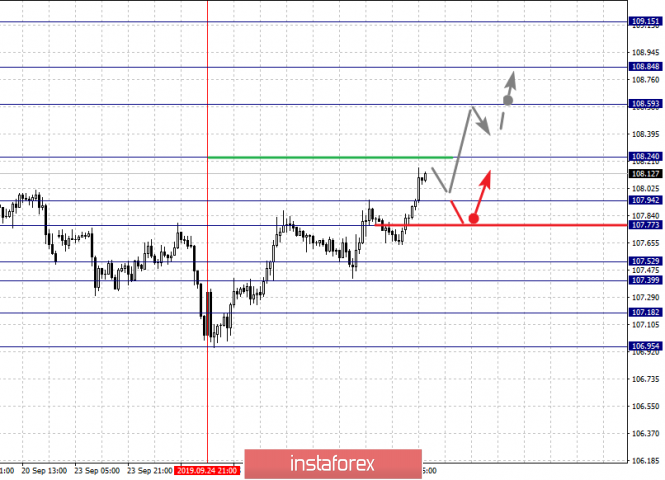
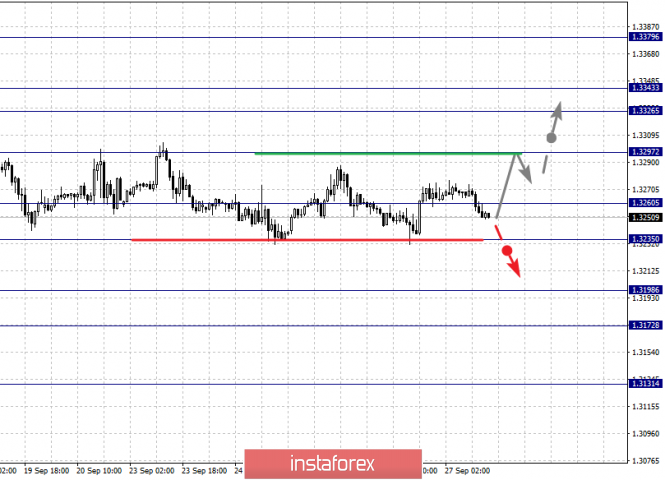
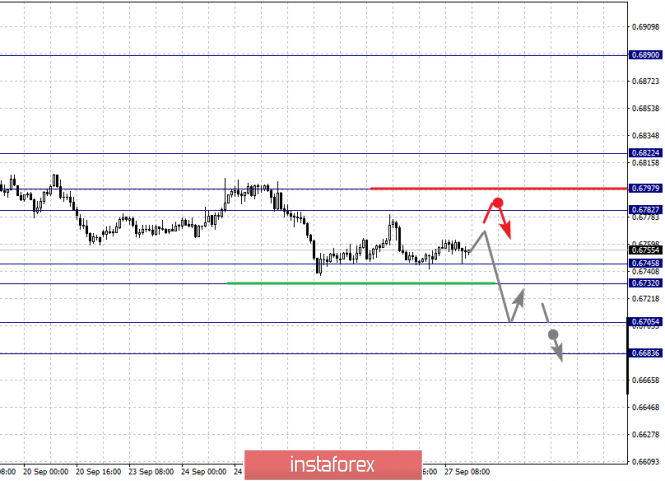
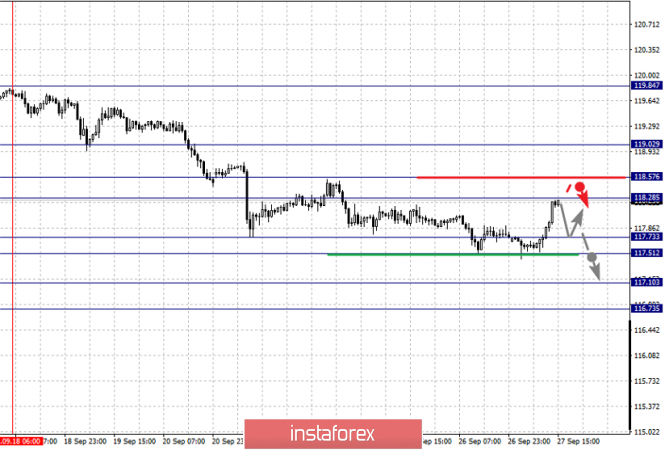
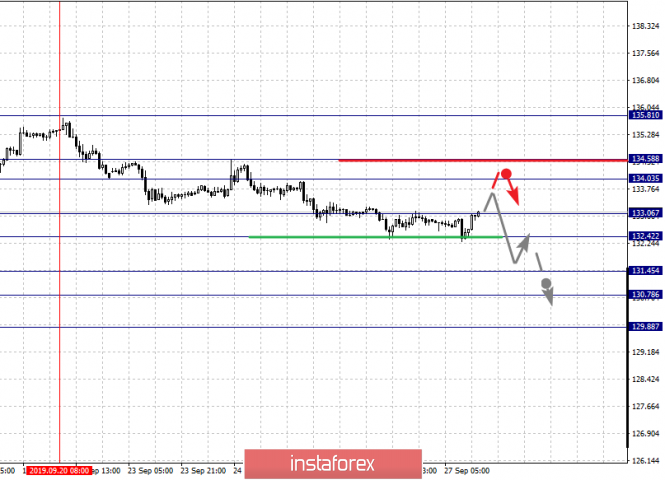
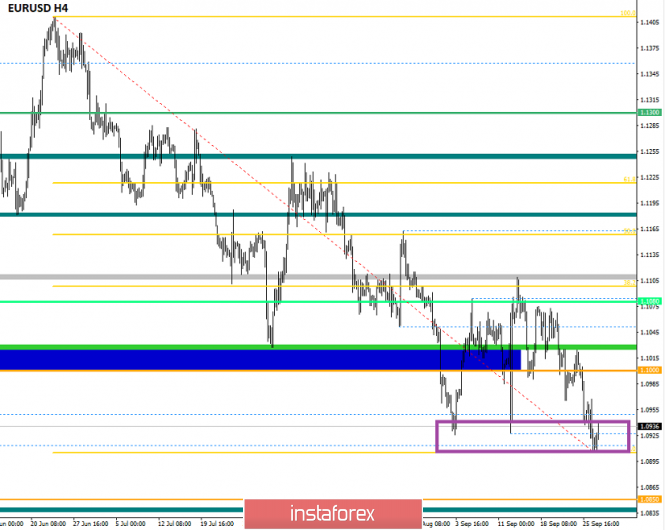
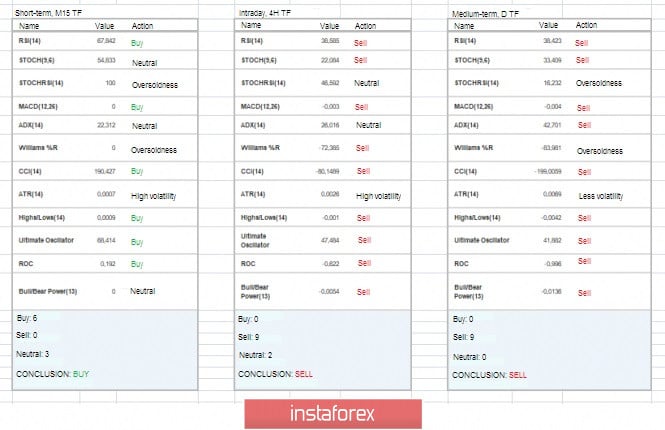
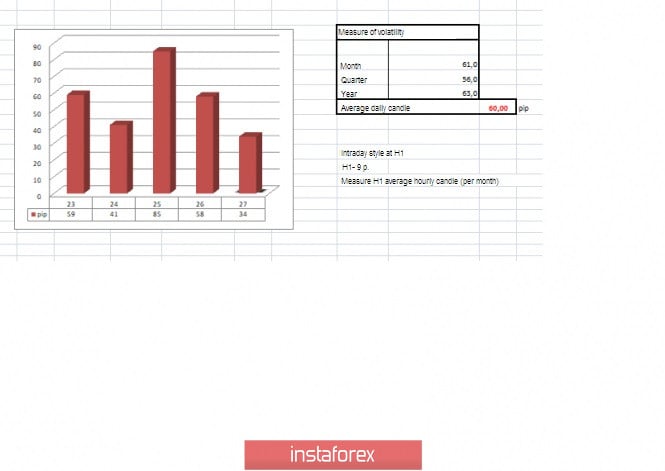

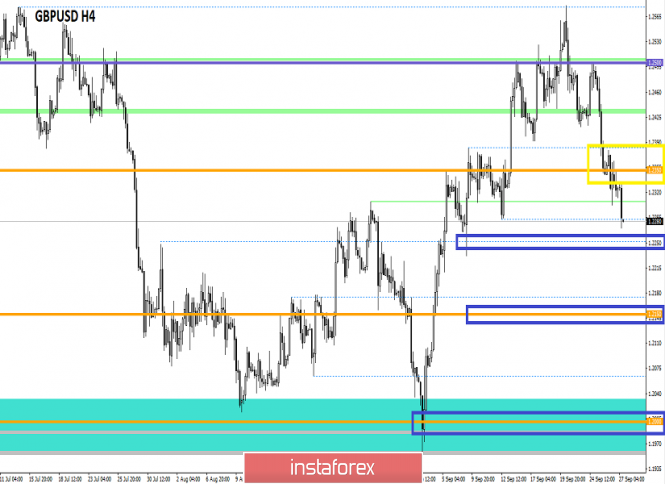
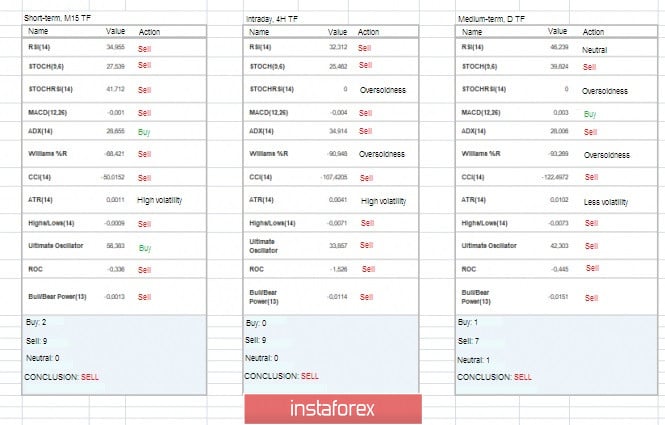
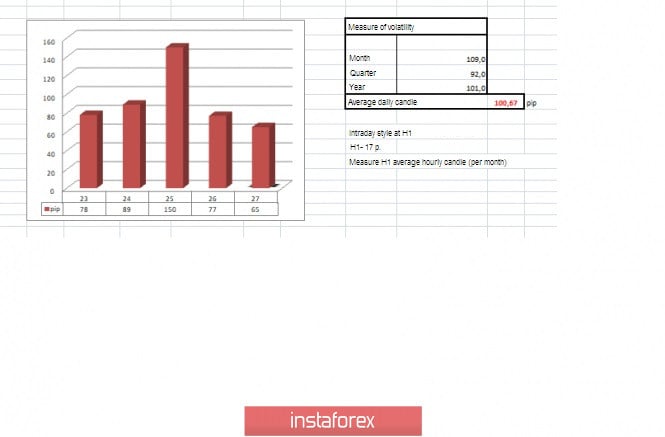
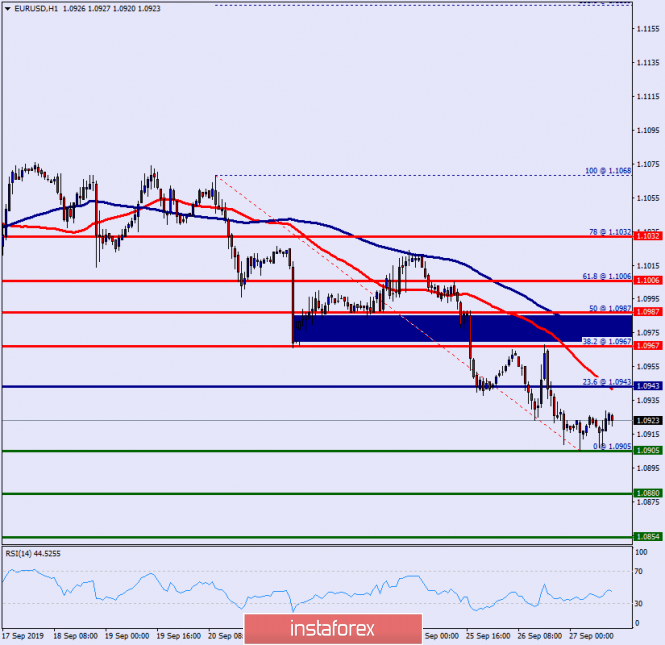

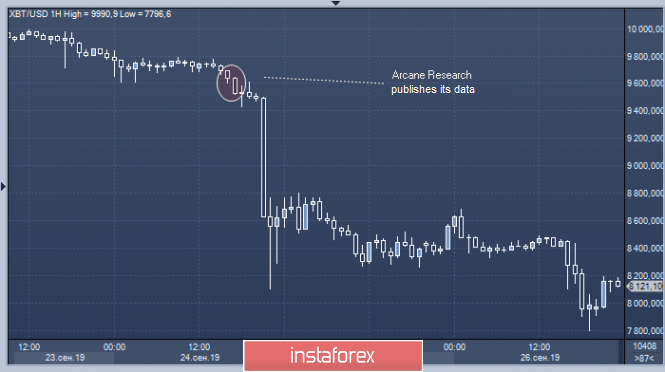
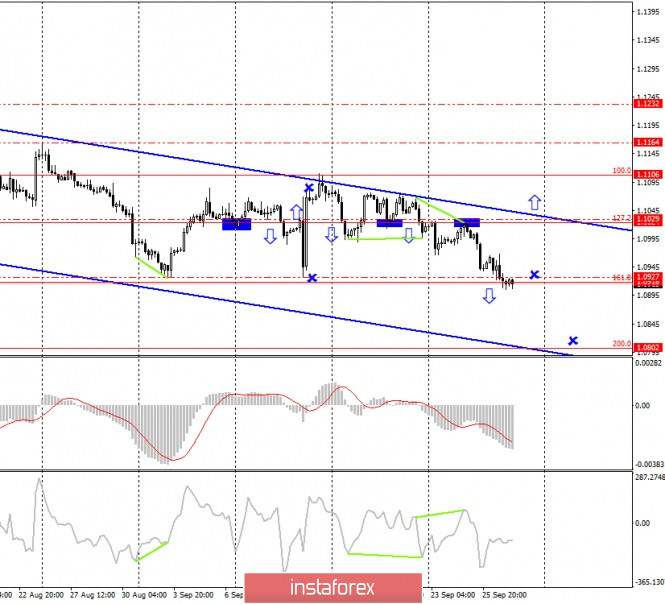
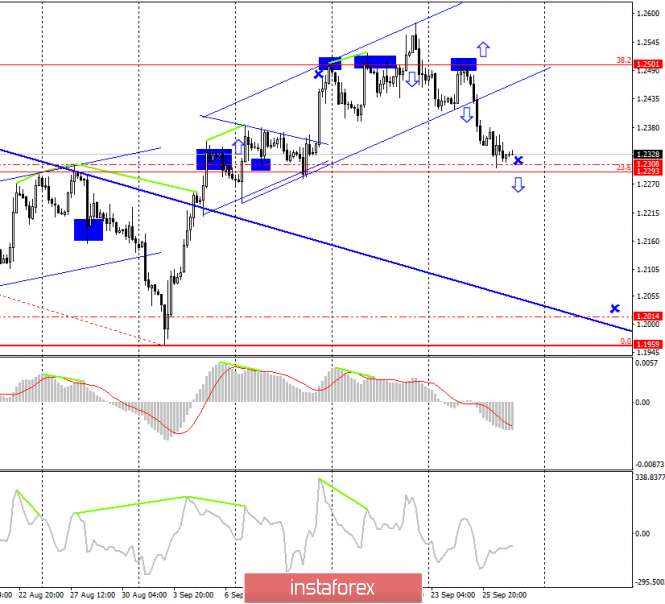
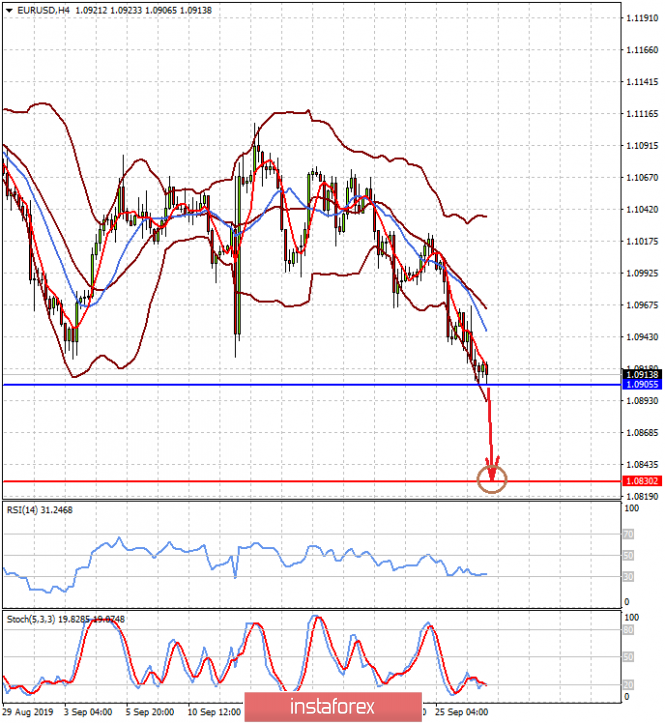
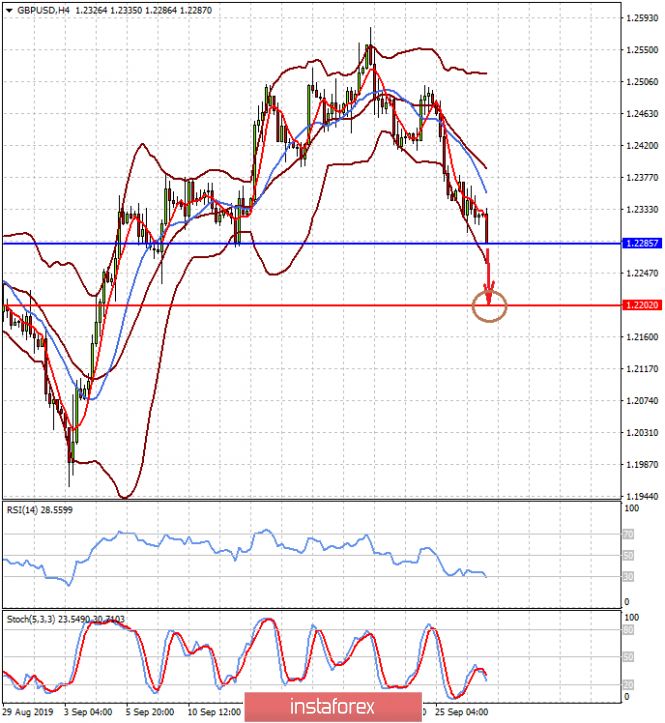
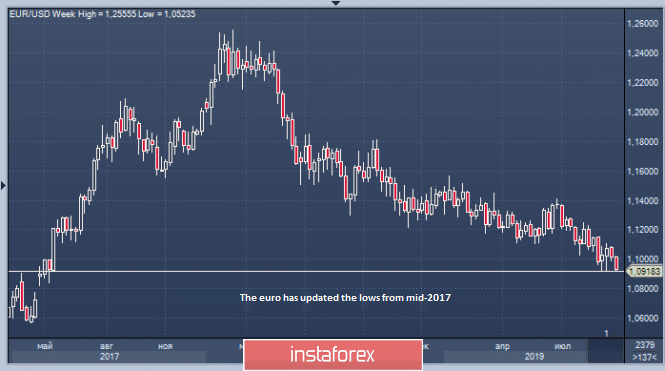
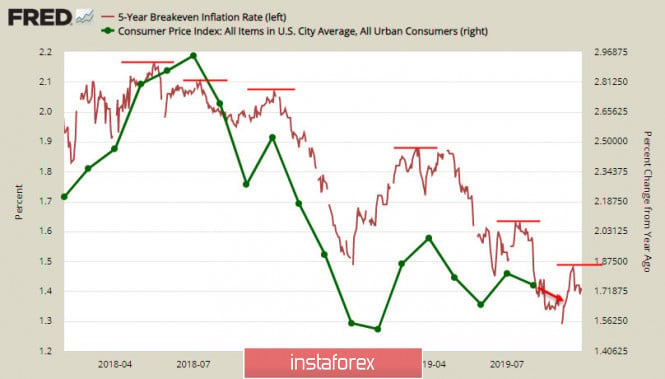
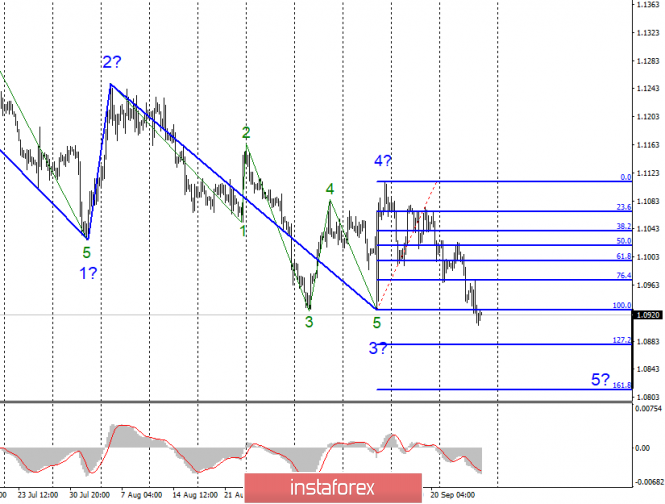
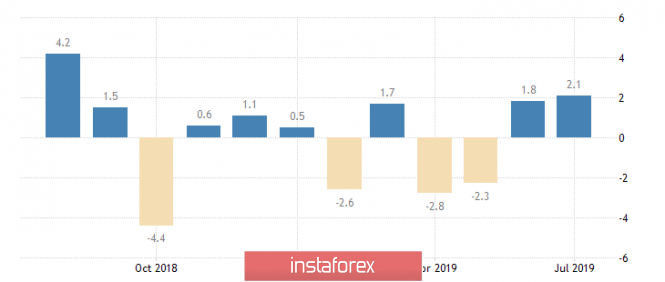
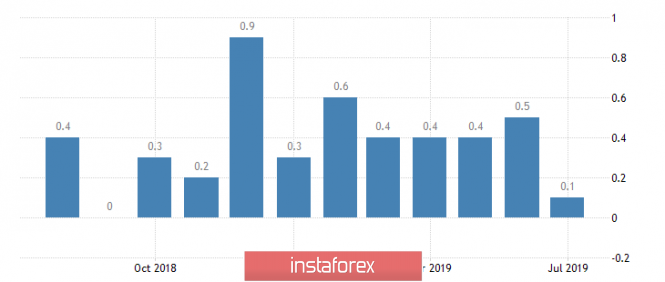
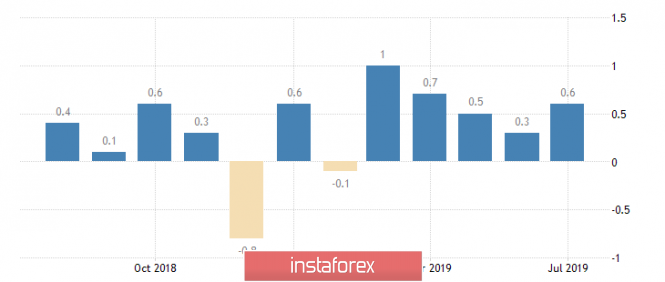
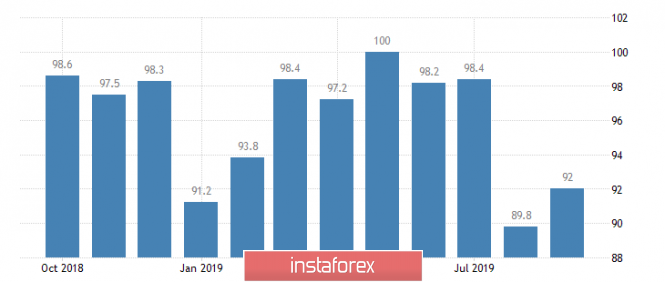
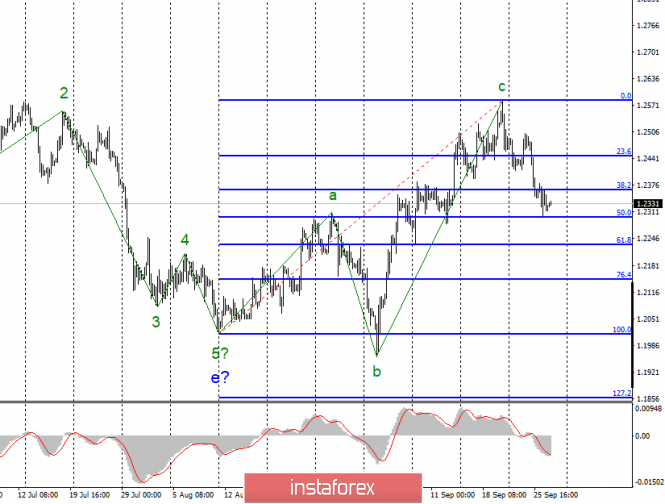
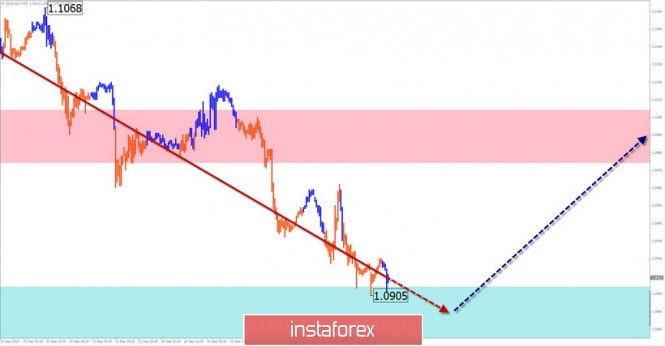
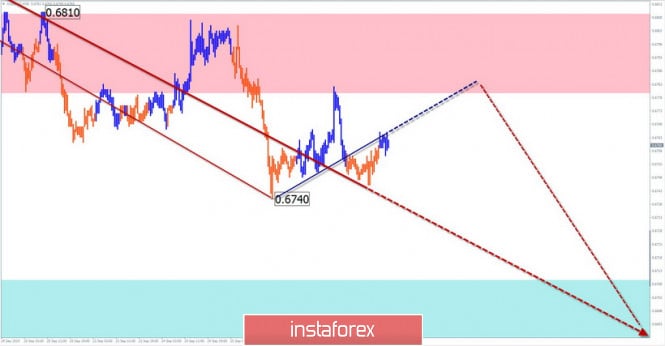
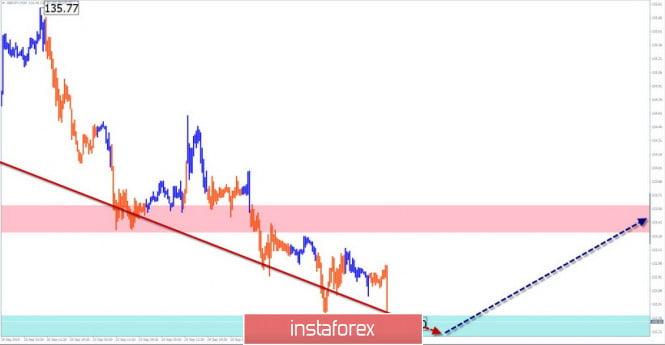
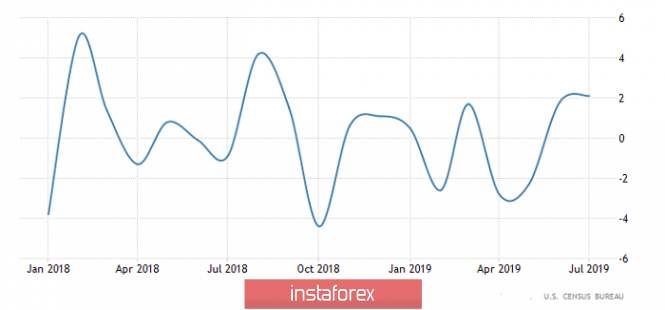

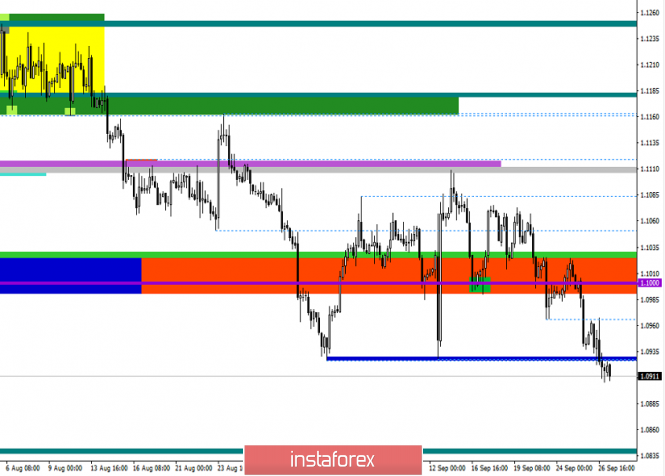
| You are subscribed to email updates from Forex analysis review. To stop receiving these emails, you may unsubscribe now. | Email delivery powered by Google |
| Google, 1600 Amphitheatre Parkway, Mountain View, CA 94043, United States | |
No comments:
Post a Comment