
Forex analysis review |
- Forecast for GBP/USD on November 14, 2019
- Forecast for AUD/USD on November 14, 2019
- #USDX vs USD / JPY vs EUR / JPY vs GBP / JPY - H4. Comprehensive analysis of movement options from November 14, 2019 APLs
- Fractal analysis of the main currency pairs on November 14
- Volumetric oil analysis and trading idea
- NZD / USD - change of priority
- GBPUSD and EURUSD: Weak inflation in the UK is not important for traders. The euro ignores reports on industrial production
- Pound was given hope and it almost immediately got taken away
- Gold has lost its luster
- Dollar has not heard anything new from Trump and awaits Powell's speech
- Kiwi in flight: the main point is not to fall
- Evening review of EURUSD 11/13/2019
- Gold could increase to $1,700 an ounce, even if Washington and Beijing go global
- EUR/USD, November 13. Results of the day. US inflation could not get traders out of hibernation
- EURUSD. Predictable Powell, controversial Trump and U.S. inflation
- November 13, 2019 : EUR/USD technical outlook predicts further bearish decline below 1.1000.
- November 13, 2019 : As Successive descending tops are demonstrated, the GBPUSD is expected to demonstrate further bearish
- GBPUSD in a sideways trading range
- USDJPY bullish trend since 104.70 could come to an end
- EURUSD approaches major Fibonacci support
- Gold price bounces as expected towards $1,466
- EUR/USD for November 13,2019 - Daily Ichimoku analysis
- Gold 11.13.2019 - First upward target reached, next upward target set at $1.473
- BTC 11.13.2019 -BTC did break the Ichimoku cloud to the downside, watch for selling opportunities
- GBP/USD: plan for the American session on November 13th. Weak inflation keeps the probability of a further decline in the
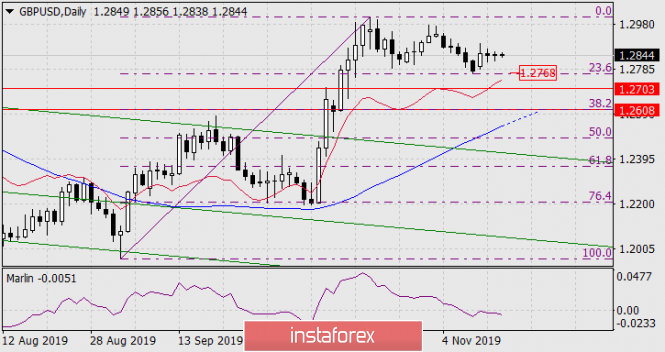
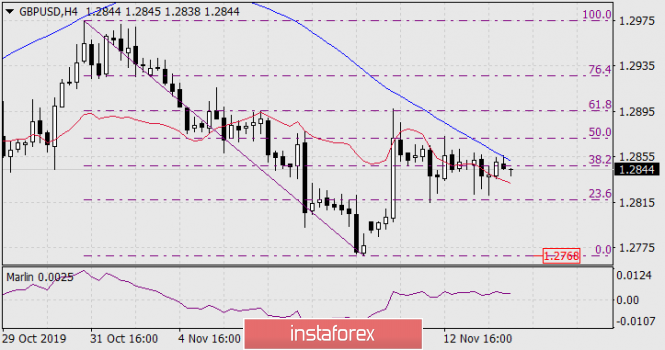
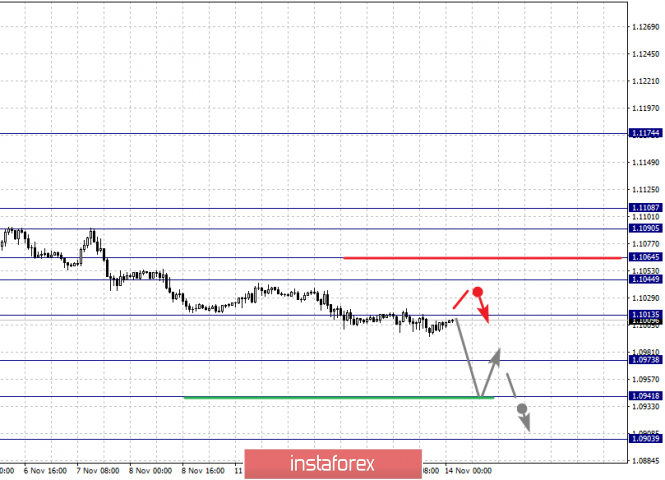
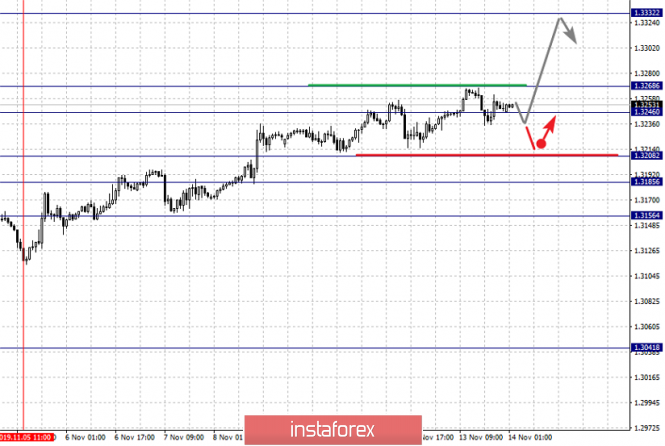
| Forecast for GBP/USD on November 14, 2019 Posted: 13 Nov 2019 07:51 PM PST GBP/USD The British pound is trading in a narrow range for the third session, which weakens the growth potential and enhances the potential for decline. The signal line of the Marlin oscillator on the daily chart is going deeper into the negative trend zone. The immediate goal of the price is the November 8 low at 1.2768. Overcoming the level opens the second target at 1.2703 - October 11 high, then 1.2608 - Fibonacci level of 38.2%. The MACD line moves to this level, which in due time will strengthen support and, as a result, a subsequent correction is likely from it. On a four-hour chart, the price worked out the resistance of the MACD line in the region of the Fibonacci level of 38.2%. The signal line of the Marlin oscillator is weakening, the pound will soon accelerate the fall. |
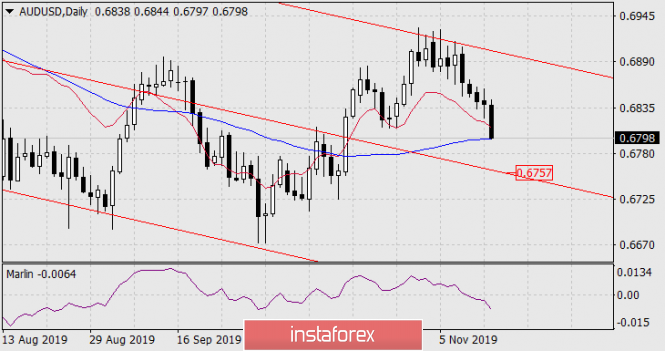
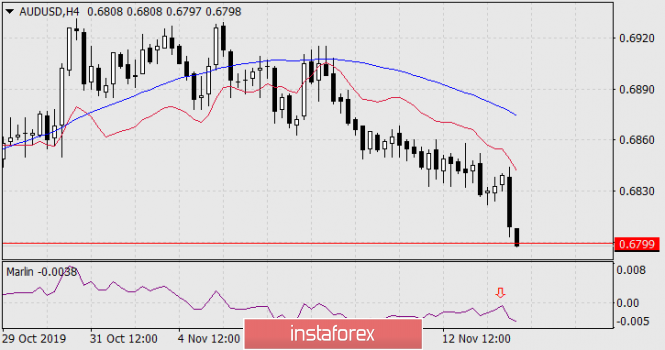
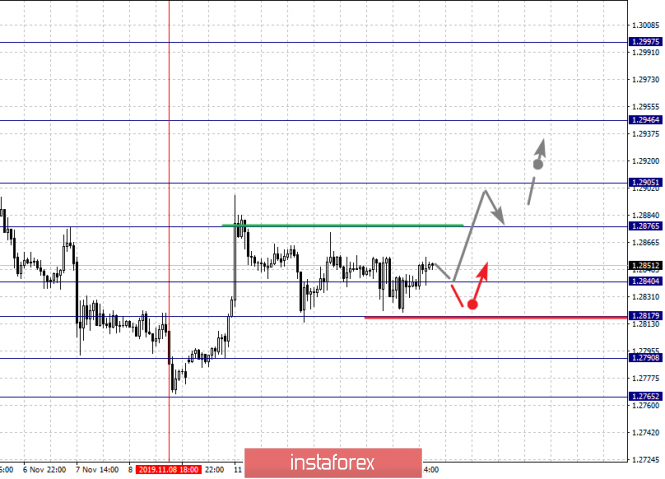
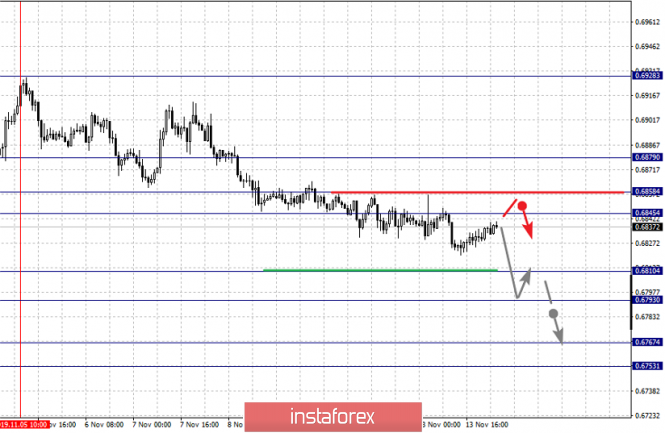
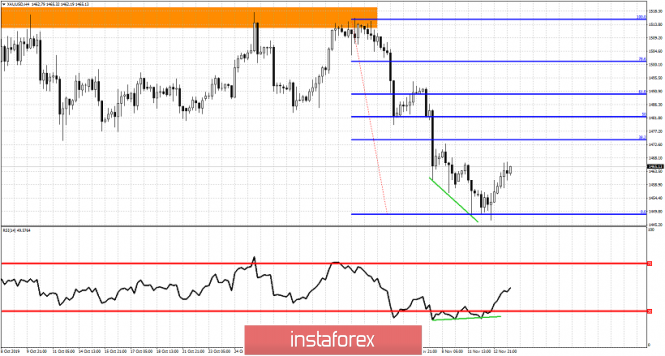
| Forecast for AUD/USD on November 14, 2019 Posted: 13 Nov 2019 07:42 PM PST AUD/USD Weak data on employment in Australia was released this morning, which accelerated the aussie's fall to the intended bearish goals. Against the expectation of a 15 thousand increase in new jobs in October, the number of unemployed grew by 19 thousand. The unemployment rate increased from 5.2% to 5.3% with the share of the economically active population dropping from 66.1% to 66.0%. Weak data also came out in China, which put additional pressure on the Australian currency. China's industrial production in October slowed down to 4.7% YOY from 5.8% YOY in September, retail sales decreased from 7.8% YOY to 7.2% YOY, fixed capital investment tightened from 5.4% YOY to 5.2% YOY. Even in Japan, GDP for the third quarter was only 0.1% against the expectations of 0.2% and 0.4% in the previous period. So, the price on the daily chart has reached the MACD line, overcoming it (0.6799) opens the way to the embedded line of the price channel in the area of 0.6757, then we are waiting to overcome this support with movement to lower goals. On the four-hour chart, the signal line of the Marlin oscillator has turned down from the boundary with the growth territory. We are waiting for the further development of the downward scenario. The material has been provided by InstaForex Company - www.instaforex.com |
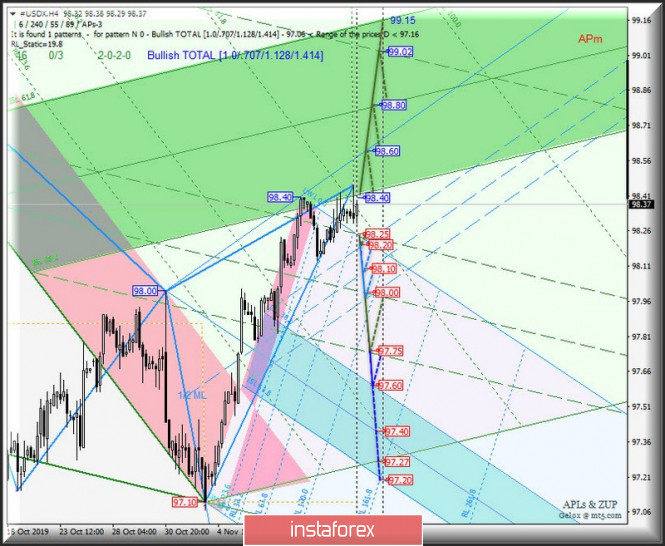
| Posted: 13 Nov 2019 04:55 PM PST Let's see how the movement of the cross-instruments EUR / JPY and GBP / JPY, as well as the dollar index #USDX and the currency of the "land of the rising sun" USD / JPY will begin from November 14, 2019. Minuette (H4 timeframe) ____________________ US dollar Index The movement of the dollar index #USDX from November 14, 2019 will be due to the development and direction of the breakdown range :
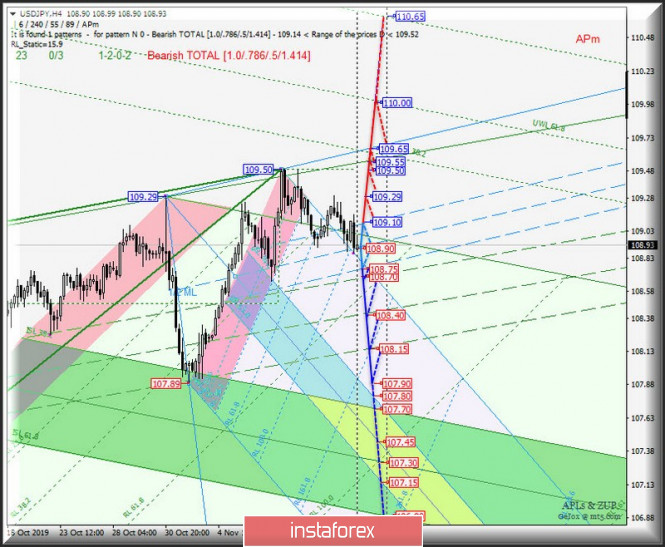
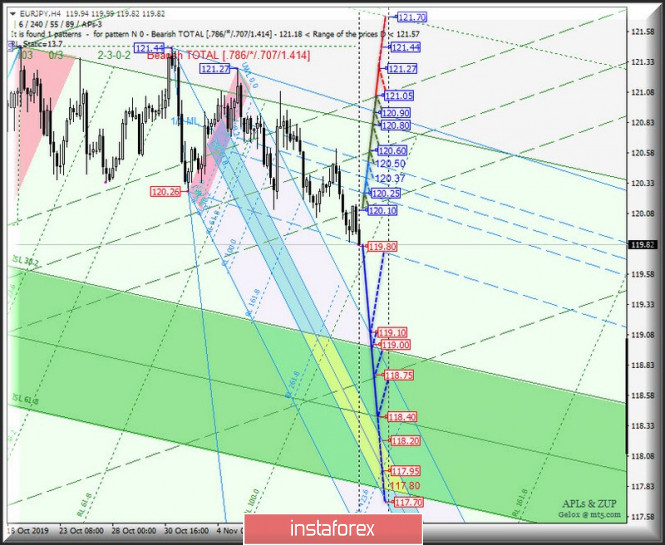
During the breakdown of ISL38.2 Minuette (resistance level of 98.40), the movement of the dollar index will continue in the equilibrium zone (98.40 - 98.80 - 99.15) of the Minuette operational scale fork. On the contrary, the breakdown of support level 98.30 (the initial SSL line of the Minuette operational scale fork) is the option of developing the #USDX movement within 1/2 channels of the Median Minuette operational scale fork (98.25 - 98.00 - 97.75) and Minuette (98.20 - 98.10 - 98.00) with the prospect of reaching the upper boundary of ISL38.2 (97.60) the equilibrium zone of the Minuette operational scale fork The marking options for the movement #USDX from November 14, 2019 is shown in the animated chart. ____________________ US dollar vs Japanese yen The currency of the "country of the rising sun" in the 1/2 Median Line channel of the Minuette operational scale forks, respectively, the further development of the USD / JPY movement from November 14, 2019 will be due to the development and direction of the breakdown of border levels (109.10 - 108.90 108.75) of this channel. We look at the details on the animated chart. In case of breakdown of the upper boundary of the 1/2 Median Line of the Minuette channel (resistance level of 109.10) of the Minuette operational scale fork, the upward movement of USD / JPY will develop to the goals: maximums (109.29 - 109.50) - control lines - UTL Minuette (109.55) - UTL Minuette (109.65) with the prospect of reaching the warning line UWL61.8 (110.00) of the Minuette operational scale fork. Combined breakdown of support levels : - 108.75 on the lower boundary of the 1/2 Median Line channel of the Minuette; - 108.70 on the upper boundary of the 1/2 Median Line channel of the Minuette; will determine the development of the currency movement of the "land of the rising sun" within the 1/2 Median Line channel (108.70 - 108.40 - 108.15) of the Minuette operational scale fork with the prospect of updating the local minimum107.90. The details of the USD/JPY movement, depending on the breakdown direction of the above 1/2 Median Line Minuette channel, are shown on the animated chart. ____________________ Euro vs Japanese yen The development of the cross-instrument movement EUR / JPY from October 14, 2019 will continue in accordance with the development and direction of the breakdown of the range :
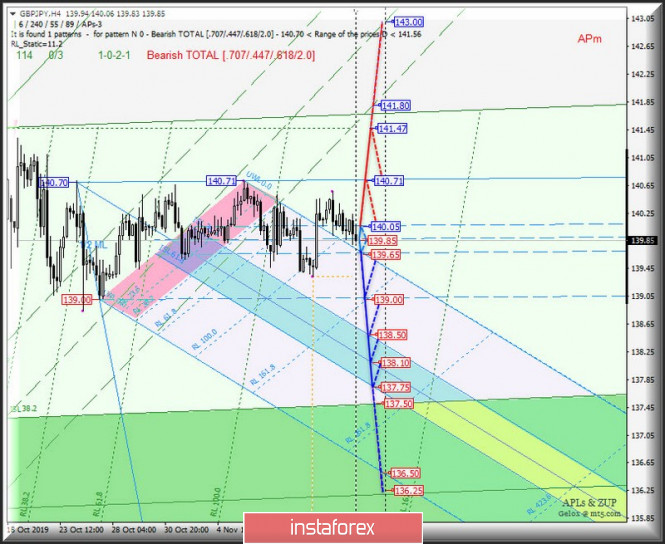
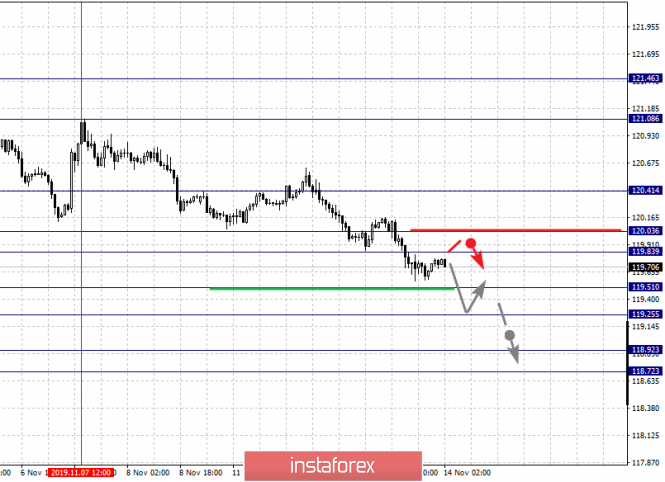
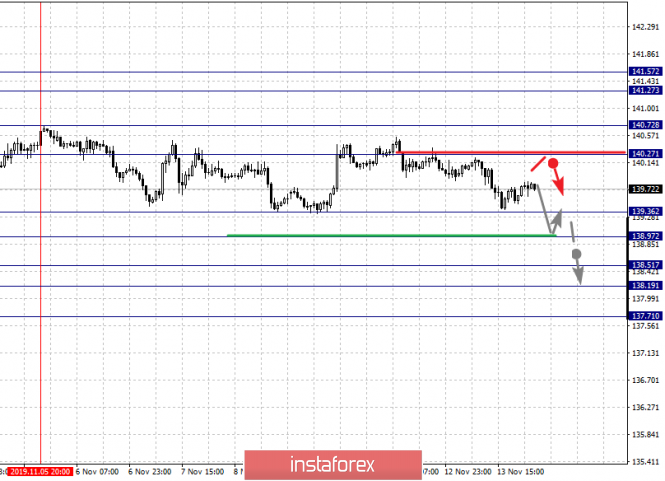
The breakdown of the final Schiff Line Minuette (support level of 119.80) will direct the EUR / JPY movement to the starting SSL line Minuette (119.10) with the prospect of reaching the boundaries of the equilibrium zones of the Minuette operational scale fork (119.00 - 118.40 - 117.80) and Minuette (118.20 - 117.95 - 117.70) . On the contrary, in case of breakdown of the resistance level of 120.10, the development of the movement of this cross-instrument can be continued in the 1/2 Median Line Minuette channel (120.10 - 120.60 - 121.05) taking into account the working out of the 1/2 median line channel of the Minuette (120.25 - 120.37 - 120.50). The details of the EUR / JPY movement, depending on the development of the above range, are presented on the animated chart. ____________________ Great Britain pound vs Japanese yen The movement of the GBP / JPY cross-instrument from November 14, 2019 will be determined by the development and direction of the breakdown of the boundary levels of the 1/2 Median Line channel (140.05 - 139.85 - 139.65) of the Minuette operational scale fork. Look at the animate chart for details. In case of breakdown of the upper boundary of the 1/2 Median Line Minuette channel (resistance level of 140.05) of the Minuette operational scale fork, the upward movement of GBP / JPY will develop towards the goals: UTL Minuette control line (140.71) - local maximum 141.47. The breakdown of the support level of 106.55 at the lower boundary of the 1/2 Median Line Minuette channel will determine the development of the downward movement of this cross-instrument to the final Schiff Line Minuette (139.00), during the breakdown of which it will be possible to reach the GBP / JPY boundaries of the equilibrium zones (138.50 - 138.10 - 137.75) of the Minuette operational scale fork. The details of the GBP / JPY movement, depending on the breakdown direction of the 1/ 2 Median Line Minuette channel mentioned above, are shown on the animated chart. ____________________ The review is made without taking into account the news background. Thus, the opening of trading sessions of the main financial centers does not serve as a guide to action (placing orders "sell" or "buy"). The formula for calculating the dollar index: USDX = 50.14348112 * USDEUR0.576 * USDJPY0.136 * USDGBP0.119 * USDCAD0.091 * USDSEK0.042 * USDCHF0.036. where the power coefficients correspond to the weights of the currencies in the basket: Euro - 57.6%; Yen - 13.6% ; Pound Sterling - 11.9%; Canadian dollar - 9.1%; Swedish Krona - 4.2%; Swiss franc - 3.6%. The first coefficient in the formula leads the index to 100 at the start date of the countdown - March 1973, when the main currencies began to be freely quoted relative to each other. The material has been provided by InstaForex Company - www.instaforex.com |
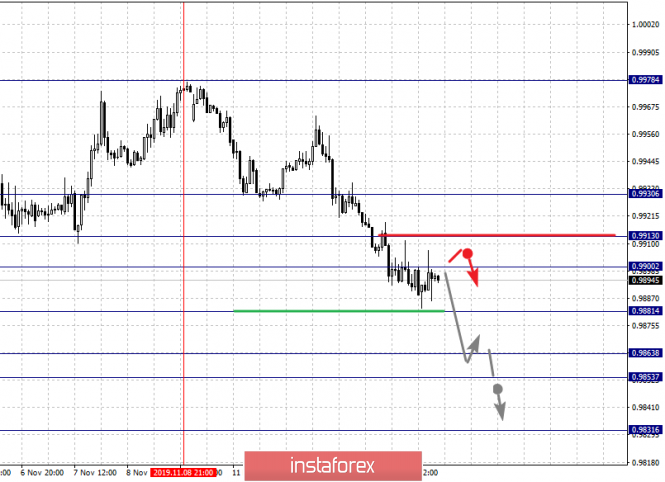
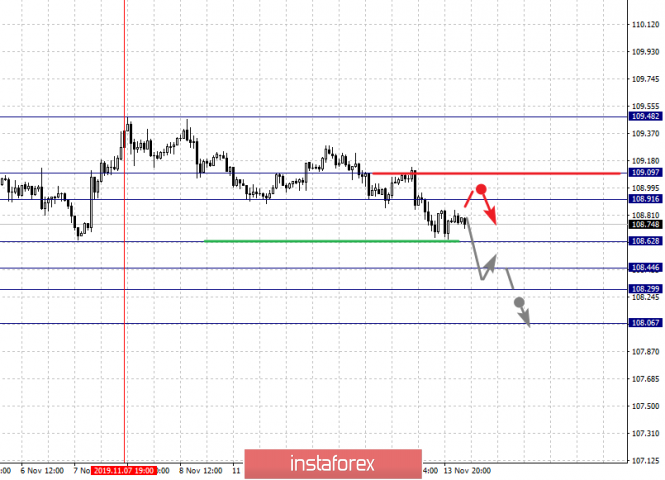
| Fractal analysis of the main currency pairs on November 14 Posted: 13 Nov 2019 04:55 PM PST Forecast for November 14: Analytical review of currency pairs on the scale of H1: For the euro / dollar pair, the key levels on the H1 scale are: 1.1108, 1.1090, 1.1064, 1.1044, 1.1013, 1.0973, 1.0941 and 1.0903. Here, we are following the development of the downward cycle of November 4. At the moment, we expect a movement to the level of 1.0973. Price consolidation is near this level. Short-term downward movement, as well as consolidation is in the range of 1.0973 - 1.0941. For the potential value for the bottom, we consider the level of 1.0903. Upon reaching this value, we expect a rollback to the correction. Short-term upward movement is expected in the range 1.1044 - 1.1064. The breakdown of the latter value will lead to an in-depth correction. Here, the goal is 1.1090. The range of 1.1090 - 1.1108 is a key support for the descending structure, before it, we expect the initial conditions for the upward cycle to be formed. The main trend is the downward structure of November 4. Trading recommendations: Buy: 1.1045 Take profit: 1.1062 Buy: 1.1065 Take profit: 1.1090 Sell: 1.1012 Take profit: 1.0975 Sell: 1.0971 Take profit: 1.0941 For the pound / dollar pair, the key levels on the H1 scale are: 1.3032, 1.2997, 1.2946, 1.2905, 1.2876, 1.2840, 1.2817, 1.2790 and 1.2765. Here, the price forms the expressed initial conditions for the top of November 8. Short-term upward movement is expected in the range 1.2876 - 1.2905. The breakdown of the latter value will lead to movement to the level of 1.2946. Price consolidation is near this level. The breakdown of the level of 1.2946 should be accompanied by a pronounced upward movement. Here, the target is 1.2997. We consider the level 1.3032 to be a potential value for the top; upon reaching this level, we expect a pullback to the bottom. A short-term downward movement is possibly in the range of 1.2840 - 1.2817. The breakdown of the last value will lead to an in-depth correction. Here, the target is 1.2790. This level is a key support for the top, its passage at the price will lead to the formation of a local descending structure. Here, the first goal is 1.2765. The main trend is building potential for the top of November 8. Trading recommendations: Buy: 1.2876 Take profit: 1.2905 Buy: 1.2907 Take profit: 1.2944 Sell: 1.2840 Take profit: 1.2818 Sell: 1.2815 Take profit: 1.2792 For the dollar / franc pair, the key levels on the H1 scale are: 0.9930, 0.9913, 0.9900, 0.9881, 0.9863, 0.9853 and 0.9831. Here, we are following the development of the downward cycle of November 8. The continuation of the movement to the bottom is expected after the breakdown of the level of 0.9881. In this case, the target is 0.9863. Price consolidation is in the range of 0.9863 - 0.9853. For the potential value for the bottom, we consider the level of 0.9831. The expressed movement to which is expected after the breakdown of the level of 0.9851. Short-term upward movement is possibly in the range of 0.9900 - 0.9913. The breakdown of the last value will lead to an in-depth correction. Here, the goal is 0.9930. This level is a key support for the downward structure. The main trend is the downward cycle of November 8. Trading recommendations: Buy : 0.9900 Take profit: 0.9911 Buy : 0.9914 Take profit: 0.9930 Sell: 0.9880 Take profit: 0.9865 Sell: 0.9852 Take profit: 0.9831 For the dollar / yen pair, the key levels on the scale are : 109.09, 108.91, 108.62, 108.44, 108.29 and 108.06. Here, the price has canceled the development of the local upward structure and at the moment, we are watching the downward potential of November 7. The continuation of the movement to the bottom is expected after the breakdown of the level of 108.62. In this case, the target is 108.44. Price consolidation is in the range of 108.44 - 108.29. We consider the level of 108.06 to be a potential value for the downward structure. Upon reaching which, we expect a pullback to the top. Short-term upward movement is expected in the range of 108.91 - 109.09. The breakdown of the last value will have the formation of an ascending structure. In this case, the potential target is 109.48. Main trend: The downward trend of November 7. Trading recommendations: Buy: 108.91 Take profit: 109.07 Buy : 109.11 Take profit: 109.45 Sell: 108.62 Take profit: 108.45 Sell: 108.28 Take profit: 108.06 For the Canadian dollar / US dollar pair, the key levels on the H1 scale are: 1.3332, 1.3268, 1.3246, 1.3208, 1.3185 and 1.3156. Here, we are following the medium-term upward structure from October 29, as well as the local structure for the top from November 5. Short-term movement to the top is expected in the range of 1.3246 - 1.3268. The breakdown of the last value will lead to a pronounced movement. Here, the potential target is 1.3332, and upon reaching this level, we expect a pullback to the bottom. Short-term downward movement is possibly in the range of 1.3208 - 1.3185. The breakdown of the last value will lead to an in-depth correction. Here, the target is 1.3156. This level is a key support for the upward structure. The main trend is the medium-term initial conditions for the upward movement of November 29. Trading recommendations: Buy: 1.3246 Take profit: 1.3266 Buy : 1.3270 Take profit: 1.3332 Sell: 1.3208 Take profit: 1.3187 Sell: 1.3183 Take profit: 1.3156 For the Australian dollar / US dollar pair, the key levels on the H1 scale are : 0.6879, 0.6858, 0.6845, 0.6810, 0.6793, 0.6767, 0.6753 and 0.6722. Here, we are following the development of the downward cycle of November 5. Short-term downward movement is expected in the range of 0.6810 - 0.6793. The breakdown of the latter value should be accompanied by a pronounced downward movement to the level of 0.6767. Price consolidation is in the range of 0.6767 - 0.6753. For the potential value for the bottom, we consider the level of 0.6722, upon reaching this value, we expect a rollback to the top. Short-term upward movement is possibly in the range of 0.6845 - 0.6858. The breakdown of the latter value will lead to an in-depth correction. Here, the target is 0.6879. This level is a key support for the downward structure of November 5. The main trend is the downward structure of November 5. Trading recommendations: Buy: 0.6845 Take profit: 0.6856 Buy: 0.6859 Take profit: 0.6877 Sell : 0.6808 Take profit : 0.6793 Sell: 0.6790 Take profit: 0.6768 For the euro / yen pair, the key levels on the H1 scale are: 120.41, 120.03, 119.83, 119.51, 119.25, 118.92 and 118.72. Here, the subsequent targets for the downward movement is determined from the local structure on November 7. Short-term downward movement is expected in the range of 119.51 - 119.25. The breakdown of the last value should be accompanied by a pronounced downward movement. Here, the potential target is 118.72, and upon reaching this level, we expect a consolidated movement in the range of 118.92 - 118.72. Short-term upward movement is expected in the range of 119.83 - 120.03. The breakdown of the latter value will lead to an in-depth correction. Here, the goal is 120.41. This level is a key support for the downward trend. The main trend is the local structure for the bottom of November 7. Trading recommendations: Buy: 119.83 Take profit: 120.01 Buy: 120.06 Take profit: 120.40 Sell: 119.50 Take profit: 119.27 Sell: 119.24 Take profit: 118.92 For the pound / yen pair, the key levels on the H1 scale are :141.57, 141.27, 140.72, 140.27, 139.36, 138.97, 138.51, 138.19 and 137.71. Here, we consider the descending of November 5 as the main structure. Short-term downward movement is expected in the range 139.36 - 138.97. The breakdown of the last value will lead to a pronounced movement to the level of 138.51. Price consolidation is in the range of 138.51 - 138.19. For the potential value for the bottom, we consider the level of 137.71. Upon reaching which, we expect a pullback in the correction. Short-term upward movement is possibly in the range of 140.27 - 140.72. The level of 140.72 is a key support for the initial conditions of November 5. Its passage at a price will lead to the development of the upward structure of November 11. Here, the first potential target is 141.27. Price consolidation is in the range of 141.27 - 141.57. The main trend is the downward structure of November 5. Trading recommendations: Buy: 140.72 Take profit: 141.27 Buy: 140.27 Take profit: 140.70 Sell: 139.36 Take profit: 138.98 Sell: 138.95 Take profit: 138.51 The material has been provided by InstaForex Company - www.instaforex.com |
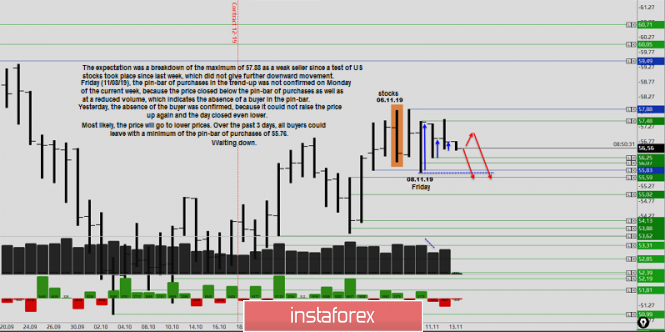
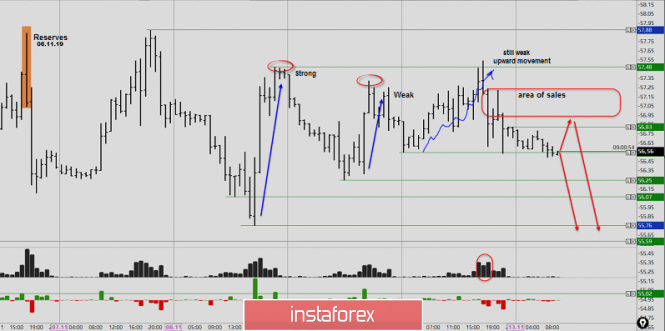
| Volumetric oil analysis and trading idea Posted: 13 Nov 2019 03:49 PM PST Greetings, dear traders, I present to your attention a volume analysis of oil futures, which you can easily implement. The expectation was a breakdown of the maximum of 57.88 as a weak seller since a test of US stocks took place since last week, which did not give further downward movement. Last Friday (11/08/19), the pin-bar of purchases in the trend-up was not confirmed on Monday of the current week, because the price closed below the pin-bar of purchases as well as at a reduced volume, which indicates the absence of a buyer in the pin-bar. Yesterday, the absence of the buyer was confirmed, because it could not raise the price up again and the day closed even lower. On the other hand, the decline in oil took place during Trump's evening speech and took place at good volumes. Most likely, the price will go to lower prices. Over the past 3 days, all buyers could leave with a minimum of the pin-bar of purchases of 55.76. Waiting down. Price levels are presented with the futures of American oil. Now, moving to the levels relative to the bodies of the candles should be considered. Good luck in trading! The material has been provided by InstaForex Company - www.instaforex.com |
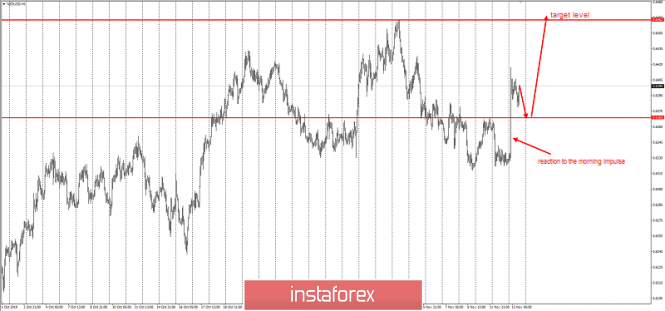
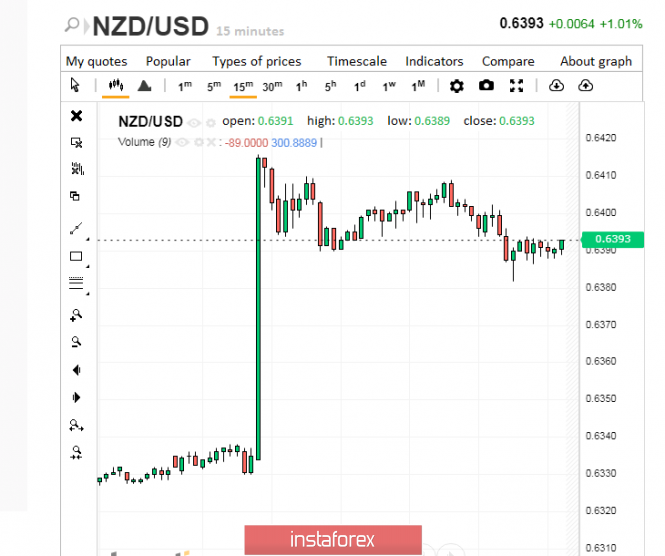
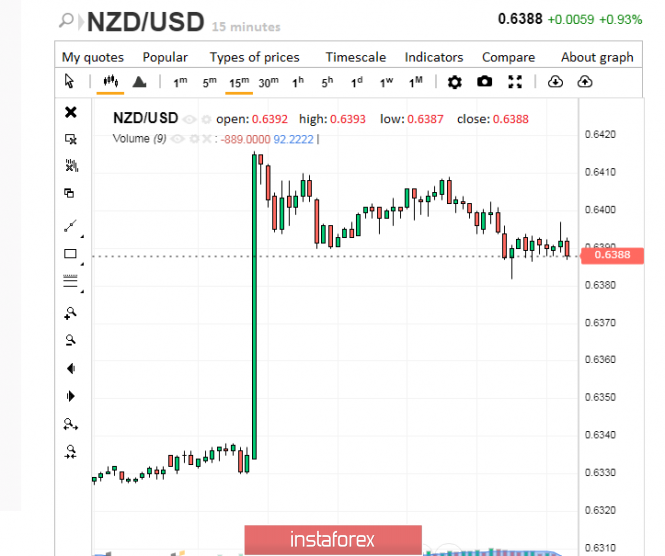
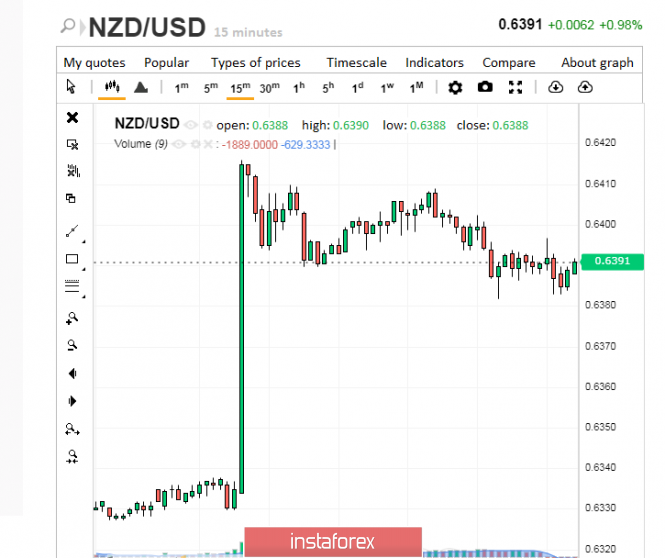
| NZD / USD - change of priority Posted: 13 Nov 2019 03:49 PM PST Good evening, dear traders! A rather rare event has occurred today: the NZD rate has not been lowered, although all the data and forecasts have indicated otherwise. The market expected a rate cut by 0.25 basis points, and as a result, the RBNZ decided to leave it at the same level. Of course, the event was unexpected at the moment, and the market reacted bullish: the NZD/USD currency pair will end the current day with strong growth. Therefore, the recommendation for this instrument is attempts to take a long position (buy), but only from a pullback. Thus, I believe that on such a "positive" for the New Zealand currency, growth can be expected to continue from the morning impulse and the level of 0.6442 can be considered a possible target for growth - this is an important level for sellers who believe in this level as a resistance level. Now, after today's news, a very real prospect opens up to see at least a false breakdown of this level. The level of 0.6369 is considered to be an intermediate level for the pullback - it would be interesting to see the pullback as such in its area. I wish you all success in trading and great profits! The material has been provided by InstaForex Company - www.instaforex.com |
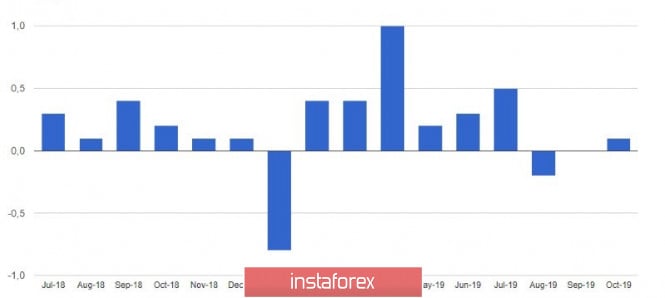
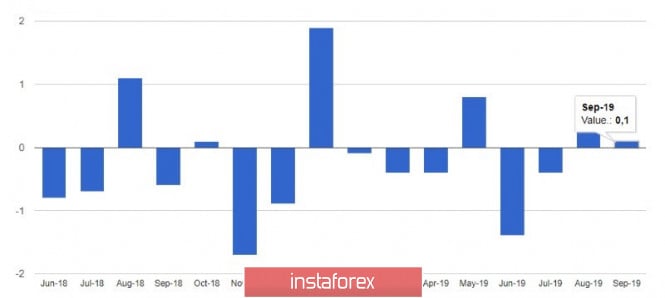
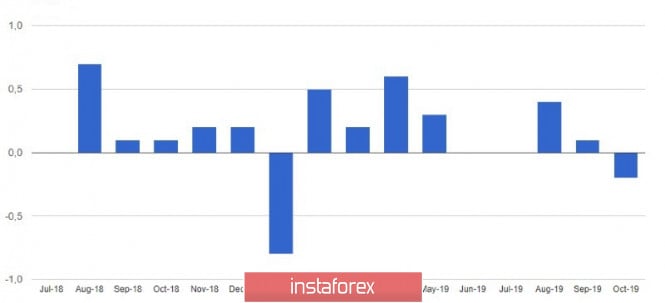
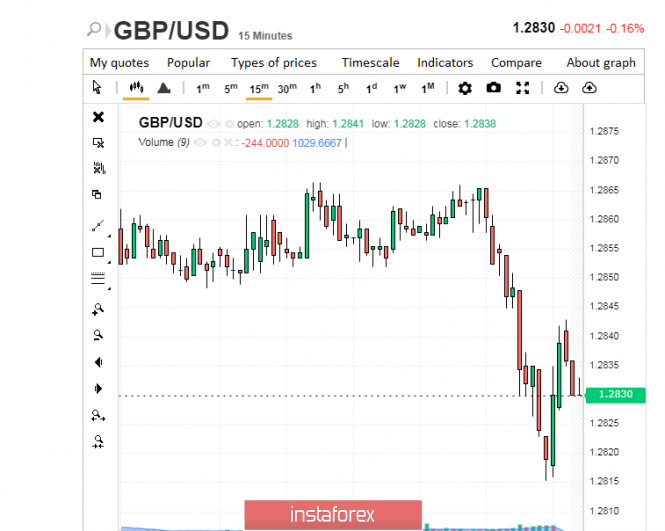
| Posted: 13 Nov 2019 03:01 PM PST The euro ignored inflation data in Germany, as well as the report on industrial production in the eurozone. Low rates once again confirmed the existence of inflation-related problems, even despite all the efforts of the European Central Bank to promote growth. The industrial sector also does not feel well, amid low activity due to trade duties and reduced exports. The British pound managed to maintain its position after a slowdown in annual inflation in October this year. EURUSD According to the statistics agency, the final CPI of Germany grew by only 0.1% in October this year, which fully coincided with the forecasts of economists. On an annualized basis, the index increased by only 1.1%, which is quite far from the target level. Germany's harmonized CPI by EU standards also showed an increase of 0.1% in October and only 0.9% year-on-year, which fully coincided with economists ' forecasts. Weak inflation in Germany allows the European regulator to lower deposit rates even lower than the current negative level, as well as to make negative and the key interest rate, which is now in the zero mark. As I noted above, eurozone industrial production showed low growth in September this year, however, compared to last year, it seriously fell due to the general slowdown in global economic growth and trade conflicts, which continue due to the actions of the White House administration and their protectionist policies. According to the statistics agency, the industrial production of the eurozone grew by only 0.1% in September this year compared with August and immediately decreased by 1.7% compared to September 2018. Economists predicted a decline in production by 0.3% and 2.1%, respectively. As for the current technical picture of the EURUSD pair, it remained unchanged compared to the morning forecast. Bears are clearly waiting for the update of the lows in the areas of 1.0990 and 1.0960, which will increase pressure on risky assets and maintain the current downward trend, which has been observed since November 4 this year. Much will depend on today's US consumer price index data. A strong report will put pressure on the trading instrument, however, if the bulls manage to regain the resistance of 1.1030, the situation may dramatically change, which will lead to an upward correction of risky assets in the area of 1.1055 and 1.1090. GBPUSD I have repeatedly noted that major players are focused on the upcoming general election in the UK, and macroeconomic statistics, not very different from forecasts, will not have a major impact on the market. This happened today after the release of the report, which indicated that inflation in the UK continues to fall below the target level of the Bank of England. According to the National Bureau of Statistics, the annual rate of inflation of consumer prices in the UK slowed down in October, which is directly related to the fall in energy prices. So, consumer prices on an annualized basis increased by only 1.5% in October this year compared with October last year after rising by 1.7% in September. Compared with September of this year, in October inflation fell by 0.2% at all, while the forecast was a drop of 0.1%. The report indicated that the slowdown in overall price increases was due to a decrease in regulated energy prices. The basic consumer price index, which does not take into account volatile categories, including the price of energy, rose by 0.1% and 1.7%, respectively in October. As I noted above, now all attention is tied to the publication of opinion polls. According to recent polls, the separation of Conservatives from the opposition Labour Party is quite substantial. Most conservatives in Parliament will allow current British Prime Minister Boris Johnson to break the legislative impasse and pull Britain out of the EU by the agreement reached at the end of this summer. As for the technical picture of the GBPUSD pair, a break of the support level of 1.2820 will increase pressure on the pound and push it into the region of this month's lows in the areas of 1.2800 and 1.2770. It will be possible to talk about the continuation of the upward correction only after the trading instrument consolidates above the resistance of 1.2870, which will open real prospects for updating the highs of 1.2900 and 1.2940. The material has been provided by InstaForex Company - www.instaforex.com |
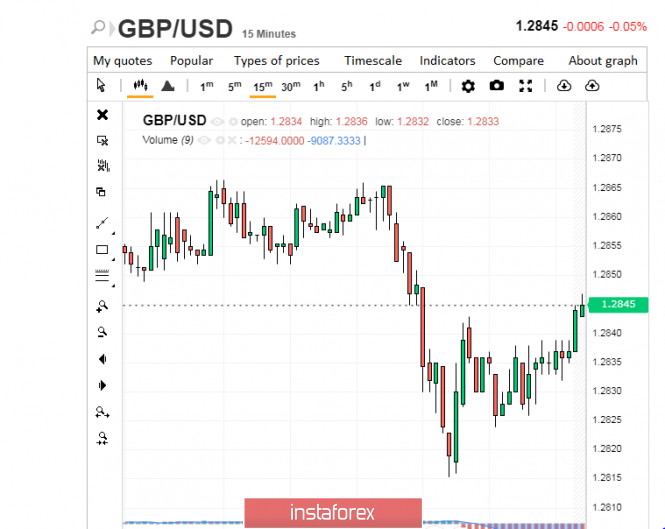
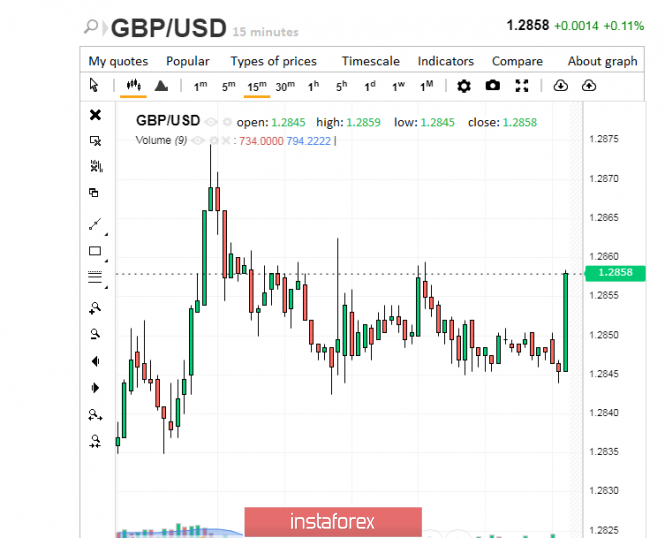
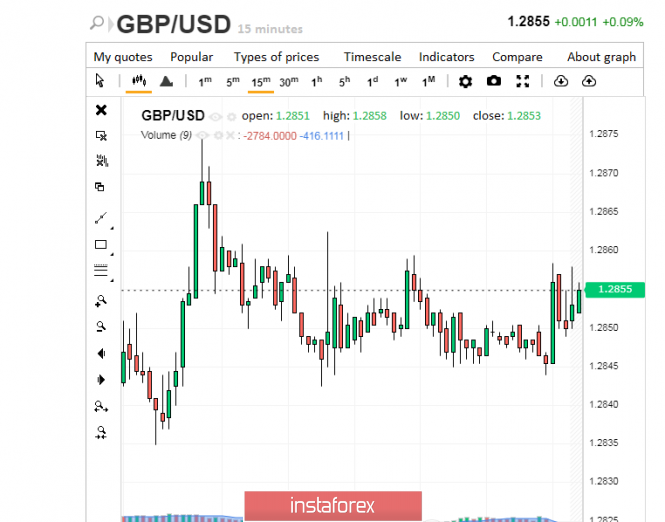
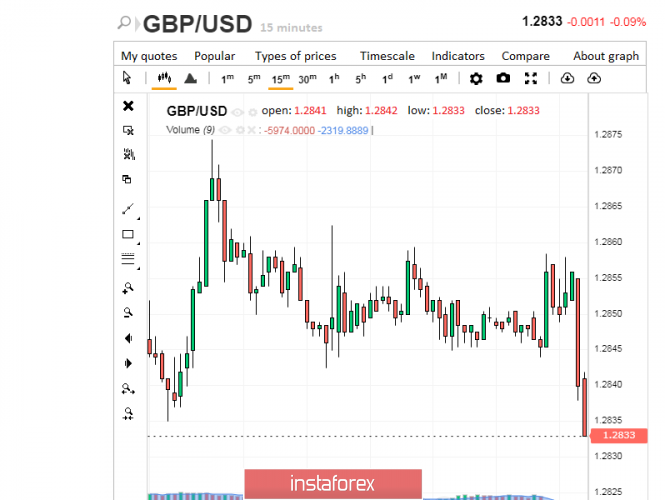
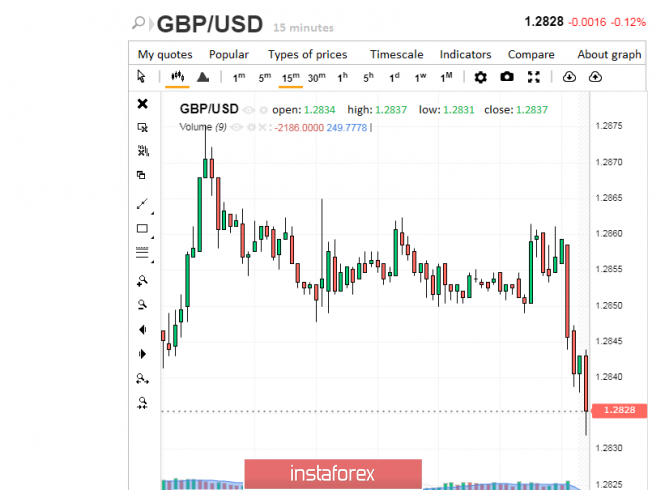
| Pound was given hope and it almost immediately got taken away Posted: 13 Nov 2019 02:55 PM PST The British currency continues to be in a state of price swing. In the wake of positive news, such as Nigel Faraj's refusal to fight for seats in the British Parliament, the pound sharply rose, and then began to fall no less rapidly. According to analysts, the sterling's hopes for growth were in vain. At the very beginning of this week, the pound felt excellent, strengthening its position amid the growth of the British economy and after the news about the general election. These factors have significantly increased the likelihood of a Brexit deal at the end of this year, analysts said. The statements of Brexit Party leader Nigel Faraj provided powerful support to the sterling. Recall, he refused to fight for seats in the British Parliament, which is claimed by the Conservative Party. Analysts believe that the refusal of Faraj will allow the Conservative Party to receive a majority of votes. According to the party leader on Brexit issues, his candidates will only claim the places for which the Labour Party and the party opposing the country's exit from the EU are fighting for. The good news for the pound was also strong data on the growth of the British economy. UK GDP increased by 0.3% in the third quarter of 2019 compared to the previous quarter, and in annual terms, the growth was 1.2%. This was facilitated not only by high consumer spending, but also by active foreign trade. The economic growth in the country was not prevented even by uncertainty about Brexit and a slowdown in the global economy, analysts said. However, the positive news for the sterling ended there. The sharply rising pound began a downward movement on Tuesday, November 12. Some currency strategists, analyzing the situation with Faraj's refusal, came to the conclusion that this move in the political game can checkmate the pound and the British economy. Of course, now Prime Minister Boris Johnson can claim the majority of votes in Parliament, but it is not known whether he will be able to get the right amount. Recall that if the prime minister wins, the UK can leave the EU without a deal, and this will not benefit the pound or the country's economy. The British currency, which soared by almost 1% to the level of 1.2898 after Faraj's refusal, began to fall. Analysts consider this the most powerful jerk of the pound since the middle of last month. The sterling experienced serious volatility yesterday, dropping to the support level of 1.2830 at some point. By Tuesday evening, the British currency had leveled off a bit. The GBP/USD pair began to trade in the range of 1.2844-1.2845. The pound eventually tried to win back the lost positions, but it only managed to succeed the next day, and it was not to the full extent. The GBP/USD pair began with a positive on Wednesday morning, November 13, finding itself at around 1.2858. However, the pound could not hold it for a long time. Subsequently, the pair fell to the level of 1.2854–1.2855, but could not resist it either. Analysts have recorded a rapid subsidence of the GBP/USD pair and an increase in the downward trend. The downward movement intensified, confirming the worst forecasts of analysts. At the moment, the pair reached a critical rate of 1.2833. The pound, which weakened after the peak of euphoria caused by Faraj's statements, continued to slide into attempts to find the bottom. Fuel was added to the fire yesterday by the publication of weak data on the UK labor market. Disappointing statistics returned the British currency to the support level of 1.2828–1.2830, which buyers of the pound tried to keep in vain. At the moment, the GBP/USD pair runs at extremely low levels of 1.2827–1.2828, having lost the entire safety margin accumulated earlier. Analysts were seriously worried about the pound's pullback to the level of 1.2827 and lower, which may lead to a further fall of the GBP/USD pair and a return to the support level of 1.2799. They remind that there will be a storm for the pound in the future. The sterling will experience serious volatility on Brexit election news and further voting. The pound turned out to be a litmus test, sensitively responding to all the vicissitudes of the difficult path of Britain's exit from the European Union. The pound has always followed political events, and this time his vector is directed towards the upcoming elections. The dynamics of the British currency will depend on their results, which determine the future fate of Brexit. The material has been provided by InstaForex Company - www.instaforex.com |
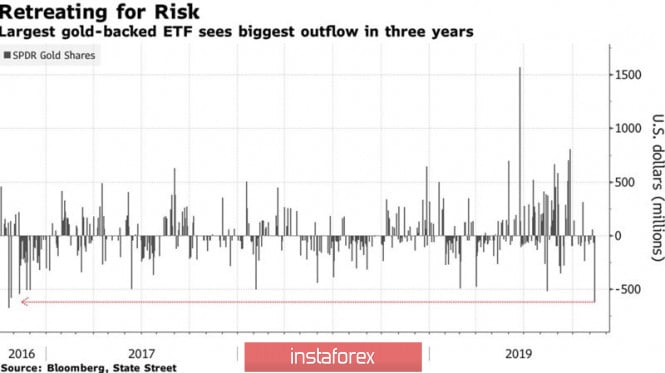
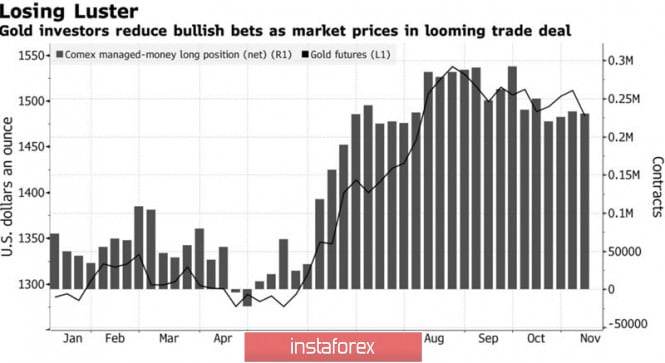
| Posted: 13 Nov 2019 02:55 PM PST Strong dollar, S&P at record highs, yield on 10-year US Treasury bonds approaching 2%. What could be worse for gold? The stars came together for the "bears on XAU/USD amid the de-escalation of the Washington-Beijing trade conflict and investor belief that disordered Brexit could be avoided. The decrease in geopolitical tensions, the synchronization of the process of monetary expansion and the signs of a cyclical rise in global GDP make JP Morgan get rid of precious metals. This bank is not alone. Citigroup told its customers that it was stepping out of long positions, and TD Securities believes that the correction may continue up to $1438 per ounce. The week of November 8 was the worst for gold since 2017. It lost about 3.6% of its value on reports that the US and China are going to roll back tariffs in order to sign the deal under Phase 1. Investor sentiment dramatically improved, risk appetite increased. This has led to massive sales of safe haven assets. At the November 8 auction, the outflow of capital from the largest specialized exchange fund SPDR Gold Shares amounted to $620.7 million, which is the most serious indicator since October 2016. Capital Flow Dynamics at SPDR Gold Shares Sensing the smell of getting fried, they dump gold off of their hands. In the week of November 5, they increased their short positions in precious metals by 15% to more than 31 thousand contracts, the highest level since the beginning of June. Net longs fell to a two-week low. The dynamics of speculative positions and gold prices Donald Trump managed to suspend the correction. At a meeting of the Economic Club in New York, the US president threatened China with substantially higher tariffs than now if it does not sign the agreement. Uncertainty in the relations between Washington and Beijing remains, but whether it will become a saving straw for the bulls at XAU/USD. So far it looks doubtful. Stock indices firmly believe in ending the trade war and ignore impeachment news. The yield on Treasury bonds is growing due to a decrease in the likelihood of a recession, and the pause in the process of easing the monetary policy of the Federal Reserve supports the dollar. Jerome Powell's rhetoric during his speech to the US Congress is unlikely to significantly change since the October FOMC meeting. Since then, employment and the trade balance have added optimism to dollar fans, and hawkish speeches are increasingly being heard from Fed officials. The presidents of the Federal Reserve Bank of Atlanta and Philadelphia, Rafael Bostic and Patrick Harker, would increase the number of dissidents in the matter of reducing the federal funds rate to 1.75%, if not for rotation. Boston Fed Chairman Eric Rosengren and Fed Vice Chairman Richard Clarida talk about the central bank's limited capacity to deal with a potential recession. Technically, the exit of gold quotes beyond the lower limit of the consolidation range of $1475-1515 per ounce naturally led to the development of a correction to an upward trend. The $1,475 retest may end with the formation of the Expanding Wedge pattern or a new wave of sales in the direction of the target by 78.6% according to the Gartley pattern. The material has been provided by InstaForex Company - www.instaforex.com |
| Dollar has not heard anything new from Trump and awaits Powell's speech Posted: 13 Nov 2019 02:55 PM PST Although yesterday's speech by US President Donald Trump at the Economic Club in New York did not cause strong market volatility, he supported the greenback. Market participants expected to hear details from the American leader about the course of trade negotiations between Washington and Beijing, but he did not provide them. The head of the White House said that he expects an early conclusion of a trade deal with China, however, if it does not take place, then duties on imported Chinese products will be significantly increased. At the same time, Trump noted that in some aspects the European Union is even worse behaving towards the United States than China. This is a bad sign for the German auto industry, which has already become a victim of the trade conflict between Washington and Beijing. However, while it is expected that the US president will announce this or next week that the decision on European car tariffs will be delayed for another six months. Statements of Trump put pressure on the euro. On Tuesday, the EUR/USD pair approached the psychological mark of 1.1000 and is slightly consolidating above this level today. However, the fundamental background has not significantly changed. Investors almost ignored the publication of indexes from the ZEW Institute in Germany. Despite growth, indicators remain in the negative zone, which indicates the prevalence of negative expectations of German business. The single European currency is actually deprived of any support factors. Meanwhile, demand for the dollar remains high amid good US macroeconomic performance and continued uncertainty around Washington-Beijing trade negotiations. Today, the focus is on the speech of Federal Reserve Chairman Powell before the United States Congress Joint Economic Committee. Given the fact that US stock indices are trading near record highs, the head of the Fed when evaluating the US economy is likely to be of the opinion that the glass is more than half full than half empty. At the October meeting, the Fed lowered the interest rate, but made it clear that this is just "insurance" against risks associated with a slowdown in the global economy. Global growth is still suppressed, and the trade issue remains unresolved. The market is waiting for Powell to confirm the strength of the US labor market and moderate economic growth. Earlier, the Fed chairman noted that further easing of the monetary policy is unlikely, since it is appropriate for the situation, but the rate hike is also not worth the wait. Further dynamics of EUR/USD will depend on whether Powell declares that the Fed's monetary policy will not soften in the near future, or advises to prepare for a long period of low rates. If the Fed chief continues to operate on the old terms and focuses on the strength of the US economy, as well as on completing the cycle of preventive easing of monetary policy, the main currency pair may fall below the bottom of the 10th figure. The material has been provided by InstaForex Company - www.instaforex.com |
| Kiwi in flight: the main point is not to fall Posted: 13 Nov 2019 02:55 PM PST The Reserve Bank of New Zealand (RBNZ) turned out to be a surprise box for the market. Its decision not to change the current rate raised the national currency to an unprecedented height. Analysts fear that the kiwi's flight will not be interrupted again, since falling from heights is a rather painful process. The New Zealand regulator overturned market expectations, refusing to cut the rate by another 25 basis points (bp). The financial institution left it at the same level - 1.00%. This decision triggered a wave of growth in the yield of short bonds of the country. As a result, New Zealand's two-year bonds soared by 15 bp, analysts said. Such a decision from the RBNZ is explained by the fact that it wants to get the effect of the reductions that were already carried out before conducting another easing of the monetary policy. The bank emphasized that they were not going to shock the market, on the contrary, in early 2020, the agency intends to publish a document where it will present an alternative monetary policy plan. However, the market took this statement as a sign of the regulator's rejection of the zero-rate policy. The news that RBNZ had retained its previous key rate immediately sent the NZD/USD pair to highs. The pair's quotes jumped 1.3% in a matter of minutes. The NZD/USD pair gained momentum on Wednesday, November 13, moving to an area above 0.6400. Subsequently, the pair slightly fell, being in the range of 0.6393–0.6394. The NZD/USD pair did not stay long within this framework, unable to resist a fall. A decrease in the pair to the levels of 0.6387–0.6388 turned out to be short-term. The euphoria from the RNBZ's decision began to decline, and after the flight of the kiwi after it. The most difficult thing was for sellers of the New Zealand dollar. According to analysts, the NZD/USD pair showed the Inverse Head and Shoulders pattern. However, fortune soon turned its back on the bears, who were trapped in the sudden refusal of the RBNZ to further mitigate. If the New Zealand dollar continues to rally, the area of 0.6425-0.6450 will be important for the further rise of the NZD/USD pair. At the moment, the pair is trading within 0.6390-0.6391, however, analysts do not exclude a further decline in the NZD/USD pair. Analysts believe that the global economy is at the beginning of a new trend, which involves either maintaining the same rates or gradually increasing them. For example, recently the Federal Reserve made it clear that it intends to take a break in reducing rates. The RBNZ picked up the baton, declaring its unwillingness to rush in matters of easing monetary policy. In the event of such a reversal, world markets may lose their key growth driver, analysts said. This raises concerns among economists and investors. The current situation is favorable for the New Zealand dollar, but experts allow its change in the near future. The material has been provided by InstaForex Company - www.instaforex.com |
| Evening review of EURUSD 11/13/2019 Posted: 13 Nov 2019 02:54 PM PST US retail inflation report was released - October CPI: + 0.4%, higher than forecast However, the core CPI remains low +0.2% Fans of the US dollar are trying to push the euro below 1.1000 right now - but the successes so far are not too great. We continue to sell from 1.1070. However, they are ready to buy from 1.1045. Moreover, this is the high of the current week ... The material has been provided by InstaForex Company - www.instaforex.com |
| Gold could increase to $1,700 an ounce, even if Washington and Beijing go global Posted: 13 Nov 2019 02:54 PM PST It is no secret to anyone that over the past few months, the dynamics of the gold exchange rate depends on news from the "advanced" trade confrontation between the United States and China. When it became known that the parties were ready to conclude a "peace" agreement, the yellow precious metal fell sharply in price, falling from $1,514 to $1,448 per ounce. According to analysts, gold managed to stay within the stable range of $1,440-$1,570 only due to the fact that investors are still not completely convinced of the possibility of a truce. However, if obvious progress is evident in the trade negotiations between Washington and Beijing, the precious metal will again come under serious pressure. Morgan Stanley analysts believe that in the case of the signing of an interim agreement between the United States and China, as well as the cancellation of their previously introduced trade duties, gold in the first quarter of 2020 could fall in price to $1,394 per ounce. Meanwhile, Saxo Bank analysts remain optimistic about the prospects for precious metals. "It will take quite a while before the global economy recovers again and growth continues again. Therefore, gold has a good chance to become a sought-after asset for a long time while the global economy will recover," they believe. According to the bank's forecast, next year the precious metal may grow by 10-15%, to the level of $1,700 per ounce. The material has been provided by InstaForex Company - www.instaforex.com |
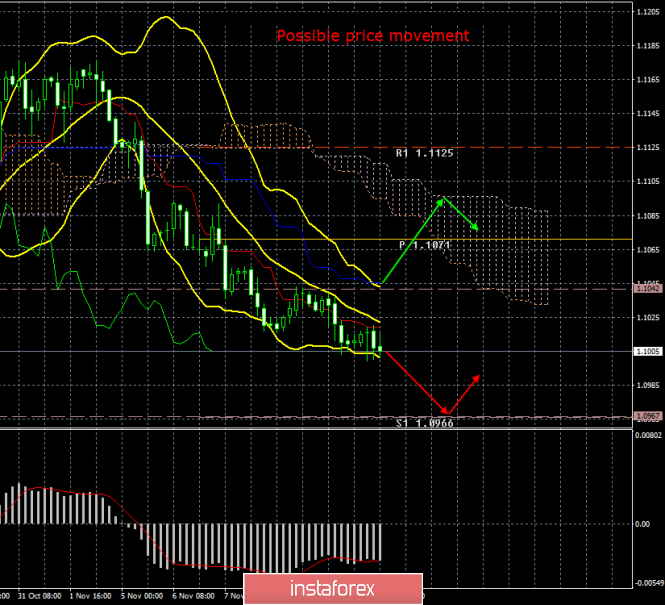
| EUR/USD, November 13. Results of the day. US inflation could not get traders out of hibernation Posted: 13 Nov 2019 02:54 PM PST 4-hour timeframe Amplitude of the last 5 days (high-low): 28p - 56p - 38p - 27p - 36p. Average volatility over the past 5 days: 37p (low). One of the most important indicators of the state of the foreign exchange market now is an indicator of volatility. For the EUR/USD pair, for example, it plunged to the low area and currently stands at 37 points a day. In the first two trading days of the week, such volatility was completely justified, since there were no important macroeconomic events during these days in either the United States or the European Union. Everything is logical. But today, when the calendar of macroeconomic publications was quite complete, traders showed the same disinterest in opening any positions. It is with this issue that we should deal with this article. Why is the market worth it? First, a very brief look at all the publications of today and what they could provide to market participants. The first inflation to be published was in Germany. At the end of October, the consumer price index was +1.1% in annual terms and +0.1% in monthly terms. These were the predicted values and the previous values. Thus, the lack of reaction to this publication was not only because German inflation itself has a low degree of influence on the euro, but also because it did not surprise traders. In addition, industrial production in the eurozone for September was published, and here, at first glance, a surprise was even presented to traders, production increased by 0.1% as compared to the previous month, while experts predicted a decrease of 0.3% . In annual terms, the decrease was 1.7% with a forecast of -2.3%. However, if you look at the picture from the side, then such an "improvement" is simply a correction and nothing else. Industrial production consecutively fell for several months, now it is time for a correction. Thus, the downward trend in that indicator is not completely broken, and we can witness a new reduction in volumes already by the end of October. This was followed by the publication of the US consumer price index, and here the traders really had a reason to rejoice as inflation rose by 1.8% YOY in October, and again, thus, approaches the Federal Reserve's target level of 2.0% Most importantly, now we can assume that all the actions of the Fed lead to positive results in the form of accelerating inflation. Thus, this is an excellent "bell" for the US dollar, since now the Fed has even less reason for a new reduction in the key rate. This publication was somewhat overshadowed by the index of the consumer price index excluding food products and energy, which reached +2.3% YOY instead of the forecast +2.4% YOY. And after all these macroeconomic reports, the euro/dollar pair, in principle, remained at the same positions as it had before. Today, Jerome Powell is set to appear before the US Congress, however, given the current activity of market participants, it is unlikely that it will be able to move the pair from the place by more than 20-30 points. The most interesting thing is that the pair does not stand in one place in the literal sense of the word. The downward trend is visible to the naked eye. But volatility does not exceed 40 points a day. That is, the bears sell the euro little by little and buy dollars, but they do it with extremely small volumes, and the bulls cannot even oppose anything against such small volumes, since they are completely absent on the market. I believe that there is no need to explain why there are no bulls. There are no fundamental and technical reasons for the growth of the euro now. But why are bears so shy and what to expect in this regard from the currency pair? We believe that the pair has again come close to the lowest levels for two years, near which more good reasons are needed for new sales of the pair than weak inflation in Germany or accelerated in the US. Thus, a paradoxical situation arises when there seems to be nothing left but to sell the euro, but the market does not have sufficient reason to actively sell the pair near its two-year lows. What can Jerome Powell say tonight? Is the US economy "showing signs of recovery" or "in good condition"? That in the near future the Fed will not need to intervene in monetary policy? All this is already understandable. Thus, we believe that in the evening the situation for the pair will not change, and the downward movement, weakening in recent days, can completely "cool down" and be replaced by an upward correction. The technical picture shows that the downward movement is weakening. This moment is clearly visible on the Bollinger Bands indicator, which is narrowing. Nevertheless, the downward trend persists as long as the price falls below the Kijun-sen critical line. Trading recommendations: EUR/USD pair resumed the downward trend. Thus, now it is still recommended to sell the currency pair with the goal of the first support level of 1.0966. The MACD indicator now often turns up, but in most cases it is discharged, since the downward movement is extremely weak. It is recommended to return to purchases of the euro currency no earlier than the bulls crossing the Kijun-sen line, which is not expected in the near future. Explanation of the illustration: Ichimoku indicator: Tenkan-sen is the red line. Kijun-sen is the blue line. Senkou Span A - light brown dotted line. Senkou Span B - light purple dashed line. Chikou Span - green line. Bollinger Bands Indicator: 3 yellow lines. MACD indicator: Red line and bar graph with white bars in the indicator window. Support / Resistance Classic Levels: Red and gray dotted lines with price symbols. Pivot Level: Yellow solid line. Volatility Support / Resistance Levels: Gray dotted lines without price designations. Possible price movement options: Red and green arrows. The material has been provided by InstaForex Company - www.instaforex.com |
| EURUSD. Predictable Powell, controversial Trump and U.S. inflation Posted: 13 Nov 2019 02:54 PM PST The US dollar ignored inflation data, focusing entirely on Fed Chairman Jerome Powell's speech, who spoke in Congress during the US session on Wednesday. In general, Powell's statement was in favor of the US currency. The head of the Fed repeated his main points that he had already voiced following a recent meeting of the central bank. At the same time, he outlined in more detail the prospects for the monetary policy of the Federal Reserve. The essence of his rhetoric boiled down to the fact that the regulator pauses the issue of lowering the interest rate. Contrary to the fears of some investors regarding further steps in this direction at the beginning of 2020, Powell assured Congressmen that he would not adjust interest rates "in the near future". He clarified that the measures taken by the Fed, as a rule, act belatedly - which means that the effect of three rounds of easing monetary policy will be felt in full only with time. It is difficult to say what kind of timeframes we are talking about. According to some experts, the US regulator will take a wait-and-see attitude at least until the spring of next year, evaluating during this time the dynamics of GDP growth, inflation, the labor market and industrial production. According to other analysts, the Fed will take a longer pause - until the end of 2020 or the beginning of 2021 (especially considering the presidential election in the United States in November next year). Here it must be emphasized that the "pause" in this context concerns not only the issue of reducing the rate - but also raising it. Powell reiterated his thesis that inflation should demonstrate "substantial and sustainable growth" before the regulator only thinks about tightening monetary policy. The head of the Fed also outlined the conditions under which the regulator decides to further reduce the rate. Among the main risks, Powell noted the weakening global economic growth and the ongoing trade conflict. He quite veiledly pointed out the relationship of the trade war with the prospects of monetary policy, but at the same time the hint sounded very transparent. According to him, the Fed will "appropriately" react to those events that provoke "a significant reassessment of our worldview". In other words, if the United States and China decide to intensify the trade conflict, the issue of rate cuts will again be on the agenda: with a high degree of probability, the regulator will mitigate the monetary policy for preventive purposes. Speaking at the Economic Club in New York yesterday, Donald Trump in his usual manner voiced conflicting comments on the prospects for relations between Washington and Beijing. On the one hand, he threatened China with new duties if the parties do not sign the deal. On the other hand, he assured those present that the countries were "very close to achieving it." At the same time, Trump said that he would agree to a deal only if it would be beneficial for the United States. Contrary to expectations, the US president did not talk about a new likely place for signing the agreement. This suggests that the negotiation process is still in full swing, and is far from the final stage. Although last week, rumors circulated in the press that US and China leaders would meet in London in early December. Now this question has again hung in the air. Thus, Powell's fears are well founded, given the counterclaims of the Chinese (according to rumors, they demanded to abolish the September duties and not introduce December). A possible escalation of the trade war could hit US bull a lot - this is the only factor that can "remove the pause" on the process of lowering rates. Returning to US inflation, it is worth noting that the figures published today turned out to be quite good, although core inflation did not reach forecast values (in annual terms). Instead of projected growth of up to 2.4%, the core index remained at around 2.3%. In monthly terms, the indicator reached expectations, that is, at around 0.2%. But the general consumer price index pleasantly surprised dollar bulls: in both monthly and annual terms, the indicator came out in the green zone, exceeding forecast values (0.4% MOM and 1.8% YOY). This dynamics is primarily due to the increase in energy tariffs (prices rose by 2.7% in September). In addition, medical services and food prices went up. Commenting on today's release, Powell noted that "inflation is currently moving sideways." Thus, Jerome Powell provided little support to dollar bulls: the greenback to one degree or another strengthened throughout the market, also against the euro. The Fed will not cut interest rates in the foreseeable future, but on one condition: if the trade conflict is not exacerbated by new barrage duties. This remark kept the dollar from large-scale growth, especially against the background of conflicting statements by unpredictable Trump. As a result of Wednesday, the EUR/USD bears could not even approach the support level of 1.0970 (the lower boundary of the Kumo cloud on the daily chart), which indicates the precarious positions of the US currency. The material has been provided by InstaForex Company - www.instaforex.com |
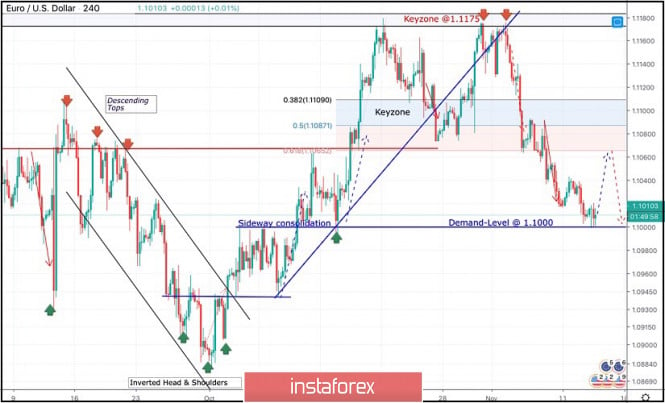
| November 13, 2019 : EUR/USD technical outlook predicts further bearish decline below 1.1000. Posted: 13 Nov 2019 08:31 AM PST
On October 2, a bullish breakout above 1.0940 confirmed the depicted Inverted Head & Shoulders reversal Pattern which enabled further bullish advancement towards (1.1000 -1.1020) This bullish movement has been maintained above the depicted bullish trend. On October 7, temporary sideway consolidation range was demonstrated around the price zone of (1.1000 -1.1020) before further bullish movement was resumed towards 1.1175 where significant bearish rejection was originated. The price zone around (1.1175 - 1.1190) stood as a significant SUPPLY-Zone that demonstrated bearish rejection for two consecutive times in a short-period. Moreover, the short-term technical outlook has turned into bearish after breakdown below 1.1090 was achieved (the depicted uptrend line and 50% Fibonacci Retracement Level). On the other hand, a long-term Double-Top pattern was demonstrated with neckline located around 1.1075-1.1090 which offered valid bearish positions upon last week's retesting. As anticipated, further bearish decline was executed towards 1.1025 and 1.0995 where temporary bullish rejection is being demonstrated. Currently, signs of bullish recovery manifested in a short-term double bottom pattern may be demonstrated around 1.1000 with a bullish target projected towards 1.1085. Any bullish pullback towards 1.1065-1.1085 should be watched for early bearish rejection and another valid SELL entry. On the other hand, earlier bearish breakout below 1.1000 will probably enable quick bearish decline towards 1.0945 where a prominent demand level was previously located. The material has been provided by InstaForex Company - www.instaforex.com |
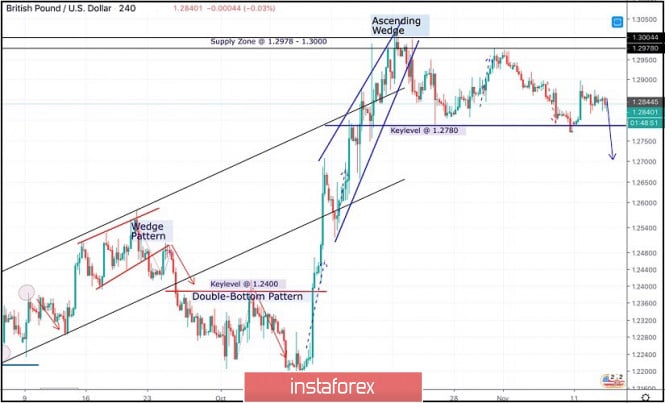
| Posted: 13 Nov 2019 08:21 AM PST
Few weeks ago, Further Bullish advancement was demonstrated towards 1.2800 then 1.3000 after the neckline of the depicted Double-Bottom pattern (1.2400-1.2415) was breached to the upside. Since October 21, the GBP/USD pair has failed to achieve a persistent bullish breakout above the depicted SUPPLY-zone (1.2980-1.3000) which corresponds to a previous Prominent-TOP that goes back to May 2019. Moreover, the depicted ascending wedge reversal pattern has been confirmed on October 22. This indicated a high probability of bearish reversal around the price-zone of 1.2950-1.2970. Hence, a quick bearish movement was anticipated towards 1.2780 (Key-Level) where some bullish recovery was recently demonstrated on October 24. The recent Bullish rejection around the price levels of 1.2780, indicated another temporary bullish movement towards 1.2980-1.3000 where another long-term bearish swing towards 1.2780 was initiated as expected. Since last week, signs of bullish recovery have been demonstrated around 1.2780. However, The short-term outlook remains bearish as long as consolidations are maintained below 1.2900. On the other hand, a quick bearish breakout below 1.2780 is needed to enable further bearish decline towards 1.2600-1.2650 where some bullish recovery should be anticipated. Trade Recommendations: Intraday traders should wait for bearish breakout below 1.2780 as a valid SELL entry. Expected Bearish target is projected towards 1.2650 then probably 1.2560. The material has been provided by InstaForex Company - www.instaforex.com |
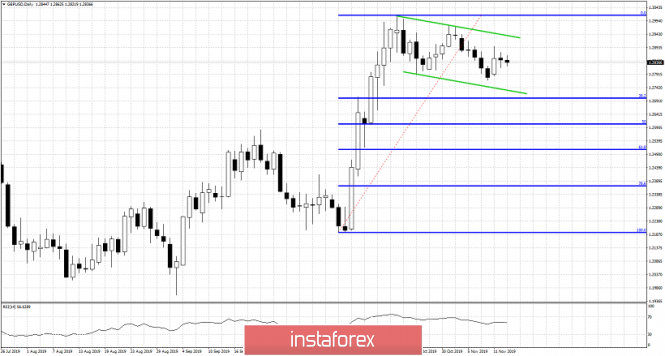
| GBPUSD in a sideways trading range Posted: 13 Nov 2019 08:20 AM PST GBPUSD is mostly moving sideways in a trading range between 1.2740 and 1.2940. Price is most probably forming a bullish flag pattern after the big rally from 1.22 in early October, to 1.2950-1.30.
Our expectation is for GBPUSD to move lower towards the 38% Fibonacci retracement level before resuming its up trend. Price is range trading and I expect another leg higher above 1.30 to start over the next few weeks. Support is at 1.27 and resistance at 1.29. Breaking above 1.29 will increase dramatically the chances of a move above 1.31. The material has been provided by InstaForex Company - www.instaforex.com |
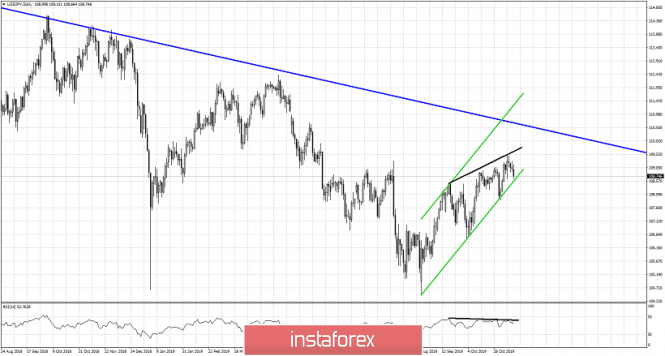
| USDJPY bullish trend since 104.70 could come to an end Posted: 13 Nov 2019 08:09 AM PST USDJPY is challenging the lower channel boundary of the up trend that it started back in August. Price has been making higher highs and higher lows but on a daily basis we see some bearish divergence warning signs by the RSI.
Green lines - bullish channel Black line- bearish divergence USDJPY is challenging the lower channel boundary. Combined with the fact we have bearish divergence signs on a daily basis, a break below 108.50-108 on a weekly basis would be a bearish sign. Support is found at 108.50 but on a weekly basis 108 is more important. With RSI getting rejected once again at the black resistance trend line, the chances for a move lower have increased.
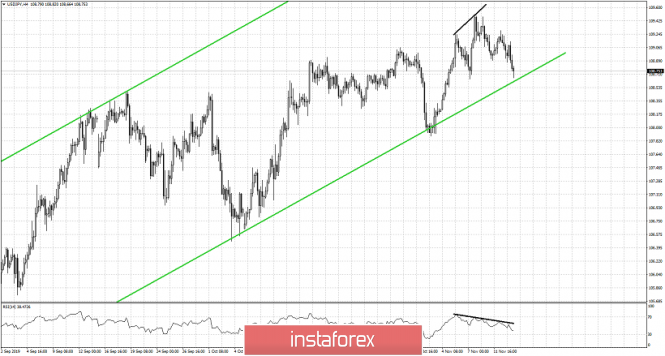
Black line- bearish divergence Bearish divergence signs we have also in the 4 hour chart confirming our expectations for a pull back. Support is at 108.50 and next at 108. Resistance is at 109.15-109.30. As long as price is below that level i prefer to be bearish. Breaking above this level will open the way for a move above 110. The material has been provided by InstaForex Company - www.instaforex.com |
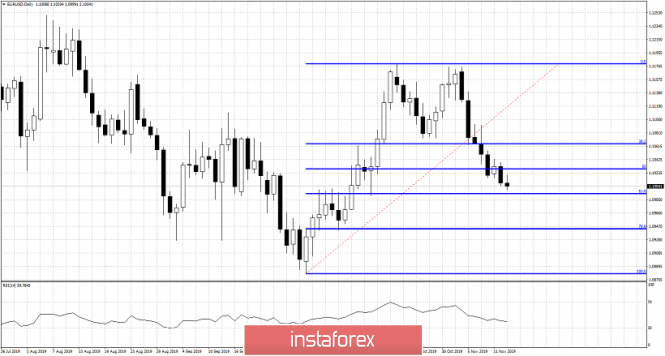
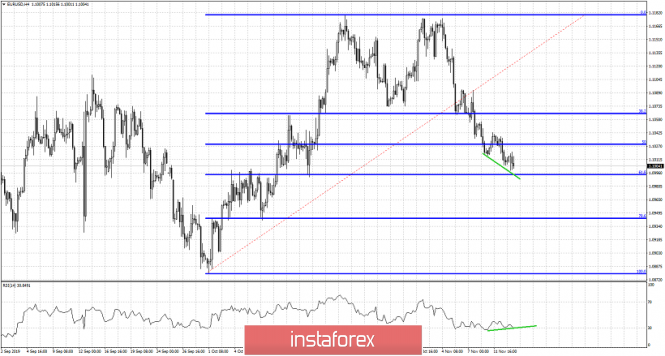
| EURUSD approaches major Fibonacci support Posted: 13 Nov 2019 07:59 AM PST EURUSD remains in a bearish trend making lower lows and lower highs. Since breaking below 1.1130 we mentioned that the next support level was 1.1060 and next at 1.10. Price has been breaking each support level and has reached the 61.8% Fibonacci retracement support at 1.10.
EURUSD is showing some early signs of bullish divergence. With RSI turning upwards above 30, this could lead to a bounce towards 1.1060-1.1070 and why not higher. So bears should be very cautious. If EURUSD is forming a major higher low relative to the October low, then we could see the start of a new up trend that will eventually bring price towards 1.12-1.13. The material has been provided by InstaForex Company - www.instaforex.com |
| Gold price bounces as expected towards $1,466 Posted: 13 Nov 2019 07:43 AM PST When Gold price was trading around $1,450, we noted the bullish divergence signs in the 4 hour chart and we mentioned that it was time for at least a short-term bounce towards the 38% Fibonacci retracement resistance at $1,474, while the first important resistance and target was $1,466.
Green lines - bullish divergence The 4 hour RSI is turning upwards from oversold levels and after providing us with a warning for bears with the bullish divergence. Gold price is moving higher and has reached the $1,466 resistance area. Important Fibonacci resistance is found at $1,474 and breaking above it would open the way for a move towards $1,490 which is the 61.8% Fibonacci retracement and the medium-term previous support now resistance.
|
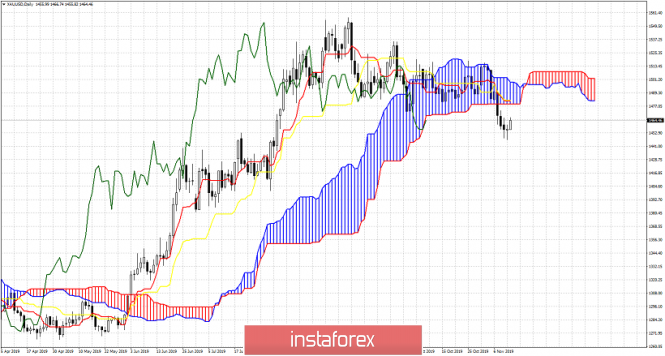
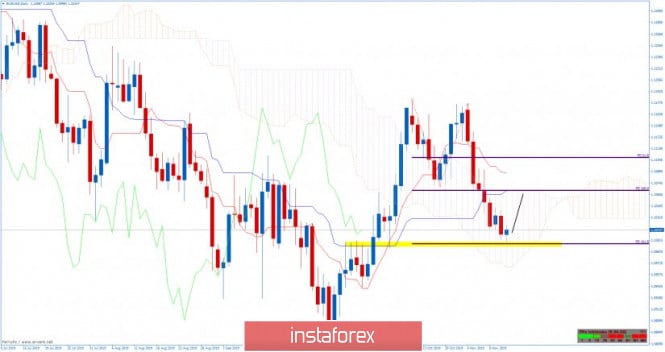
| EUR/USD for November 13,2019 - Daily Ichimoku analysis Posted: 13 Nov 2019 07:13 AM PST EUR/USD got rejection of the main support at the price of 1.1000. which is sign that selling looks very risky at this stage. My advice is to watch for potential buying opportunities as long as the support at 1.1000 is holding. Ichimoku Indicator analysis:
Based on the daily time-frame, I found that EUR is trading inside of the Ichimoku cloud, which is indication that EUR is in neutral phase. Anyway, the Ichimoku cloud is still bullish and the Tenkan-sen is trading above the Kijun-sen, which is another indication that bulls are still present. Watch for buying opportunities and potential test of 1.1067. The material has been provided by InstaForex Company - www.instaforex.com |
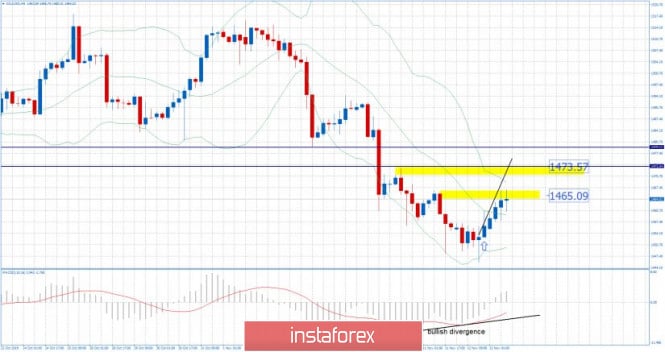
| Gold 11.13.2019 - First upward target reached, next upward target set at $1.473 Posted: 13 Nov 2019 07:01 AM PST Gold reached my first upward target from yesterday at the price of $1.465. I still expect rise on the Gold and potential test of my second upward target at the price of $1.473. Watch for buying opportunities on the pullbacks on lower frames 15/30 minutes.
Main reason for the most recent rise on the Gold is because lack of supply nears the important support at $1.448. Bullish divergence on the MACD did a nice job. MACD finally managed to turn positive above the zero after spending days in negative territory. Watch for long opportunities... The material has been provided by InstaForex Company - www.instaforex.com |
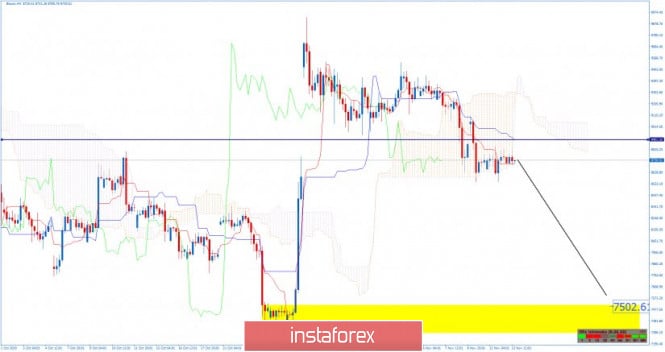
| BTC 11.13.2019 -BTC did break the Ichimoku cloud to the downside, watch for selling opportunities Posted: 13 Nov 2019 06:44 AM PST Bitcoin has been trading sideways at the price of $8.737. Watch for selling opportunities due to the current downward trend. Main downward target is set at the price of $7.500. Ichimoku analysis:
Multi frame Ichimoku sitation: H1 - Inside of the Cloud H4 - Below the cloud Daily - Inside of the Cloud Currently, BTC is testing the support (Tenkan-sen) at the price of 8.690. The potential breakout of the support would confirm further downside movement and testing of $8.543 and potential test of $7.500. Resistance is set at the price of $8.900 (Kijun-sen).BTC did the breakout of the Ichimoku cloud to the downside and I see more downside in the next period. The material has been provided by InstaForex Company - www.instaforex.com |
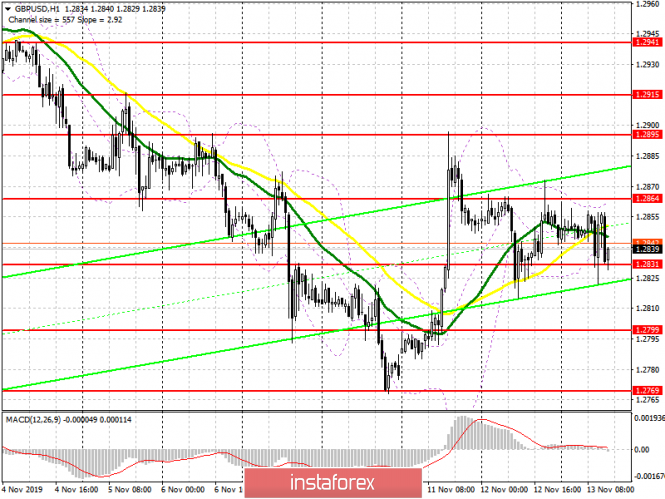
| Posted: 13 Nov 2019 04:54 AM PST To open long positions on GBP/USD, you need: In the first half of the day, there was a report on inflation in the UK, which fell sharply in October this year by 0.2% compared to September, being even worse than economists' forecasts. Against this background, the pound tried to sink against the US dollar, but the bulls held the level of 1.2825. While trading is above this range, it is best to wait for the inflation report in the US and only then focus on the return and breakthrough of the resistance of 1.2864, the consolidation of which will be the first signal to buy the pound in order to update the weekly highs of 1.2895 and 1.2915, where I recommend taking the profit. In the case of a breakthrough of the support of 1.2825 in the second half of the day, it is best to count on new purchases from the monthly lows in the area of 1.2799 and 1.2769. To open short positions on GBP/USD, you need: Sellers managed to keep the pair below the resistance of 1.2864, but this did not lead to the formation of a false breakdown. In the second half of the day, we should focus on the US inflation report, and only after a failed attempt to consolidate above the level of 1.2864, I recommend opening new short positions. The more important goal of the bears remains a breakthrough and consolidation below the support of 1.2825, which in the first half of the day could not be done even against the background of bad inflation data in the UK. Only in this scenario, you can expect the continuation of the downward trend in the area of lows of 1.2799 and 1.2769, where I recommend taking the profit. If the bulls manage to break above the resistance of 1.2864, you can open short positions on the rebound from the weekly high of 1.2895, as well as from the larger resistance of 1.2915. Indicator signals: Moving Averages Trading is around the 30 and 50 daily averages, indicating some market uncertainty. Bollinger Bands A break of the lower border of the indicator at 1.2831 will lead to a sell-off of the pound. The upward movement will be limited to the upper level of the indicator at 1.2865.
Description of indicators
|


| You are subscribed to email updates from Forex analysis review. To stop receiving these emails, you may unsubscribe now. | Email delivery powered by Google |
| Google, 1600 Amphitheatre Parkway, Mountain View, CA 94043, United States | |
No comments:
Post a Comment