
Forex analysis review |
- Control zones AUDUSD 11/18/19
- Control zones USDJPY 11/18/19
- Fractal analysis of the main currency pairs for November 18
- Bitcoin still sliding down the trend line
- Technical analysis of Gold for November 18, 2019
- EURUSD bounce is underway as expected
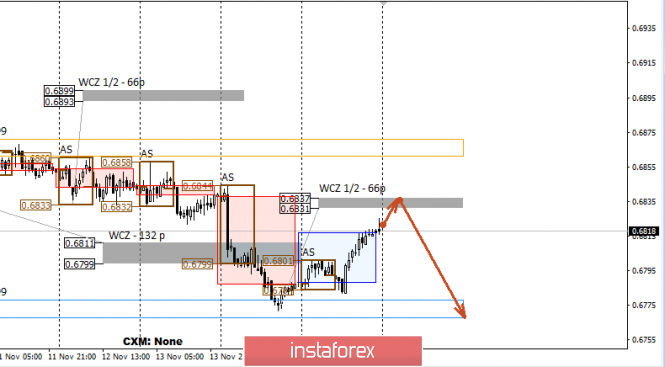
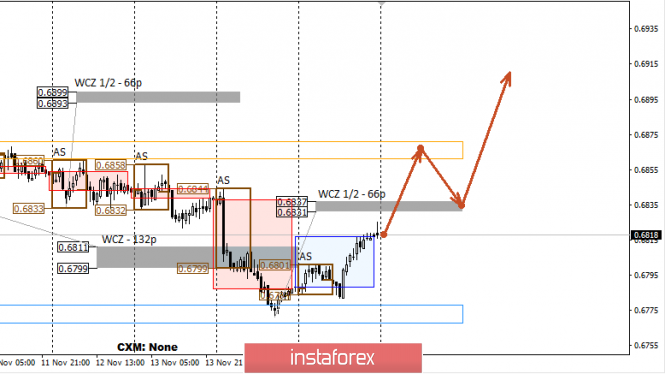
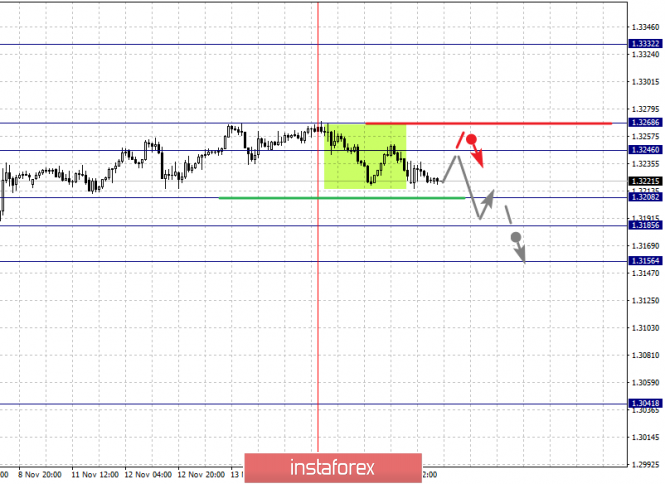
| Posted: 17 Nov 2019 06:04 PM PST The pair grew last Friday, which was triggered by achieving the average weekly move zone. The WCZ 1/2 0.6837-0.6831 will act on the growth path. If the zone test leads to a sharp reaction and the formation of the absorption pattern, then it will be necessary to re-enter the sales. The downward movement remains a medium-term impulse, so keeping the price below the WCZ 1/2 will make it possible to keep the sale to the low of the previous week, where partial consolidation will be required. An alternative model will be developed if the closing of trading on Monday occurs above the WCZ 1/2. This will indicate a change in priority. Purchasing will come to the fore, and the new goal will be the high of last week. Daily CZ - daily control zone. The area formed by important data from the futures market, which change several times a year. Weekly CZ - weekly control zone. The zone formed by important marks of the futures market, which change several times a year. Monthly CZ - monthly control zone. The zone, which is a reflection of the average volatility over the past year. The material has been provided by InstaForex Company - www.instaforex.com |
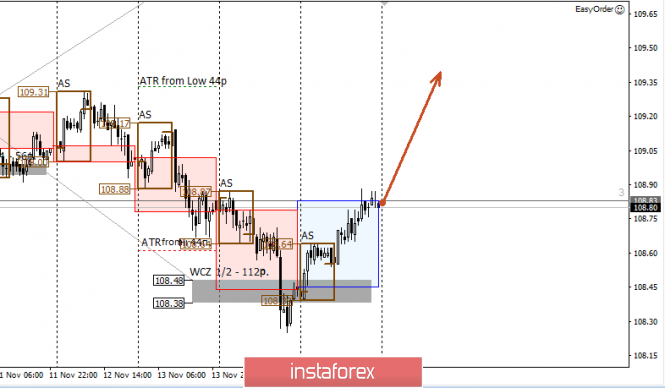
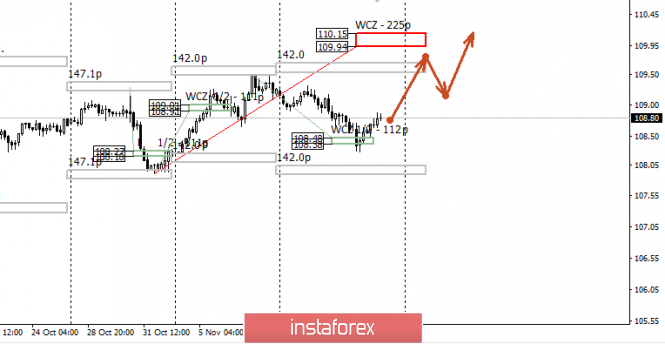
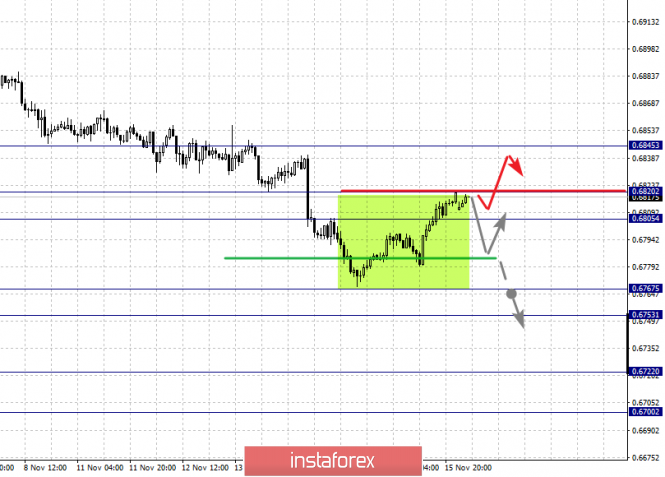
| Posted: 17 Nov 2019 06:02 PM PST The pair tested the WCZ 1/2 108.48-108.38 last Thursday. Consolidation below the zone did not occur, therefore, the upward medium-term impulse remains a priority. The first growth target is the November high. Its achievement will make it possible to close part of the purchases and transfer the rest to breakeven. Closing Friday trades made it possible to form an absorption pattern of the daily level, which confirms the bullish momentum. Re-absorption of Friday purchases will be required to implement an alternative option. The probability of this is below 30%, which does not make it possible to consider sales. The main goal of the bullish impulse is the weekly control zone 110.15-109.94, which gives a favorable risk-to-profit ratio for any purchase made from current levels and below. Therefore, it is necessary to consider the possibility of adding to a long position. Daily CZ - daily control zone. The area formed by important data from the futures market, which change several times a year. Weekly CZ - weekly control zone. The zone formed by important marks of the futures market, which change several times a year. Monthly CZ - monthly control zone. The zone, which is a reflection of the average volatility over the past year. The material has been provided by InstaForex Company - www.instaforex.com |
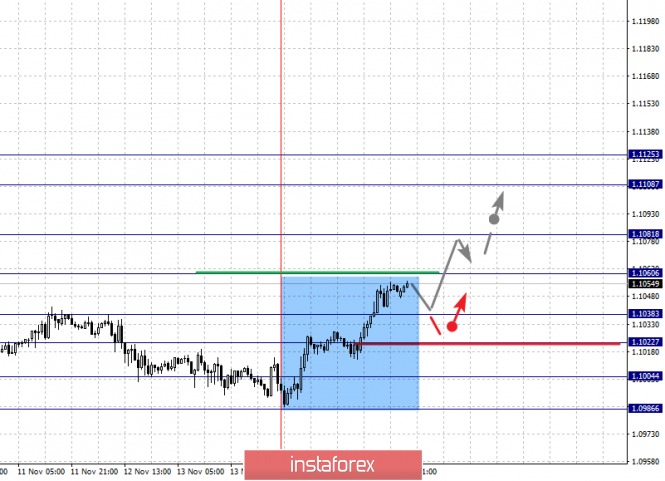
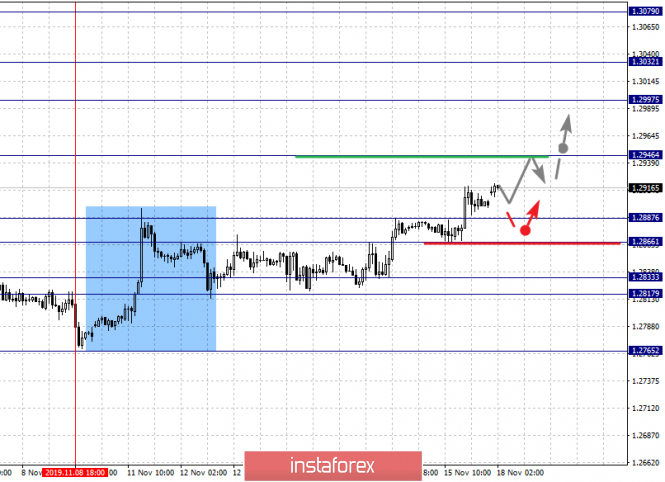
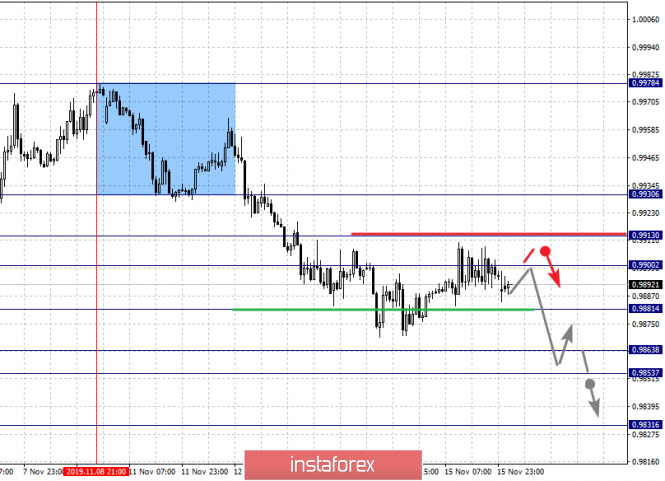
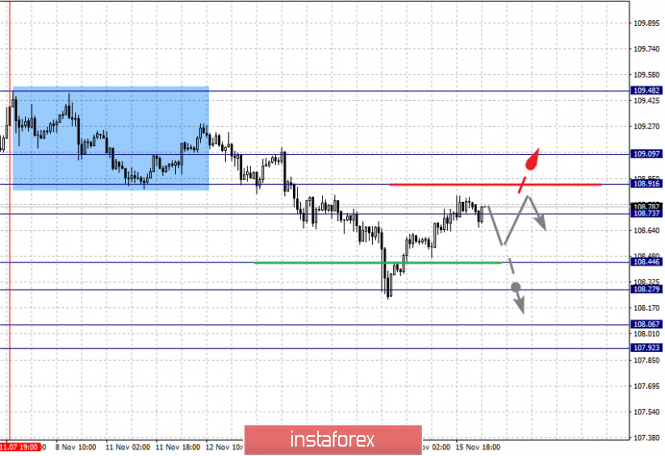
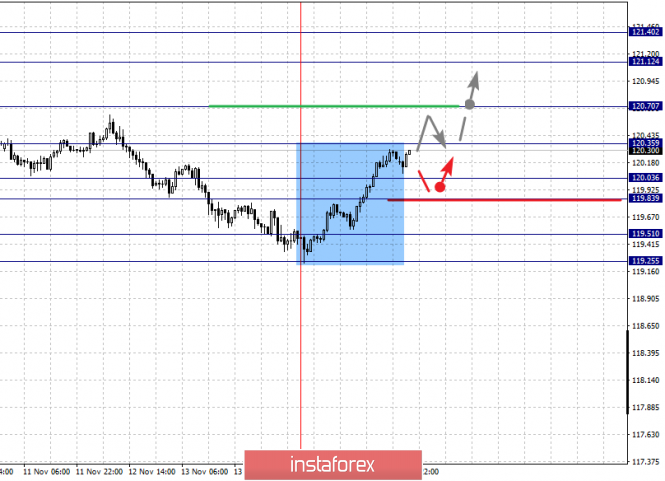
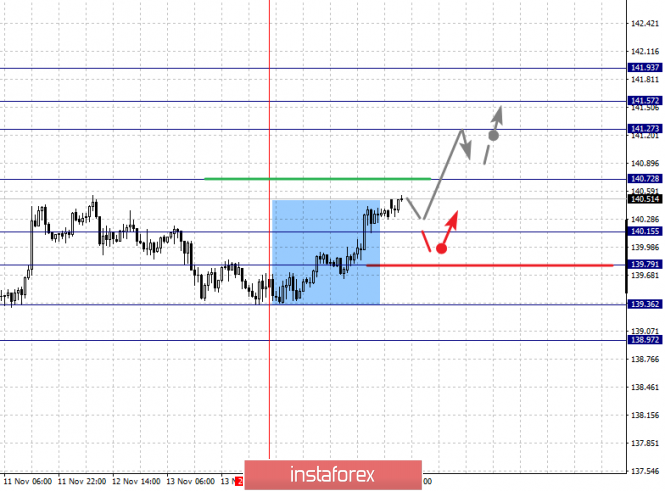
| Fractal analysis of the main currency pairs for November 18 Posted: 17 Nov 2019 05:37 PM PST Forecast for November 18: Analytical review of currency pairs on the scale of H1: For the euro / dollar pair, the key levels on the H1 scale are: 1.1125, 1.1108, 1.1081, 1.1060, 1.1038, 1.1022, 1.1004 and 1.0986. Here, the price forms the potential initial conditions for the upward cycle of November 14. The continuation of the movement to the top is expected after the breakdown of the level of 1.1060. In this case, the target is 1.1081. Price consolidation is near this level. The breakdown of the level of 1.1081 should be accompanied by a pronounced upward movement. Here, the goal is 1.1108. For the potential value for the top, we consider the level of 1.1125. Upon reaching which, we expect consolidation, as well as a pullback to the bottom. Short-term downward movement is expected in the range of 1.1038 - 1.1022. The breakdown of the last value will lead to an in-depth correction. Here, the target is 1.1004. This level is a key support for the upward structure. Its breakdown will allow us to count on movement to the first potential target - 1.0986. The main trend is building potential for the top of November 14. Trading recommendations: Buy: 1.1060 Take profit: 1.1080 Buy: 1.1083 Take profit: 1.1106 Sell: 1.1036 Take profit: 1.1024 Sell: 1.1021 Take profit: 1.1005 For the pound / dollar pair, the key levels on the H1 scale are: 1.3079, 1.3032, 1.2997, 1.2946, 1.2887, 1.2866, 1.2833, 1.2817 and 1.2765. Here, we continue to monitor the development of the upward cycle of November 8. The continuation of the movement to the top is expected after the breakdown of the level of 1.2946. In this case, the target is 1.2997. Short-term upward movement, as well as consolidation is in the range of 1.2997 - 1.3032. For the potential value for the top, we consider the level of 1.3079. Upon reaching which, we expect a pullback to the bottom. A short-term downward movement is possibly in the range of 1.2887 - 1.2866. The breakdown of the latter value will lead to an in-depth correction. Here, the target is 1.2833. The range of 1.2833 - 1.2817 is the key support for the upward structure from November 8. Its passage in price will lead to the development of a downward trend. Here, the first target is 1.2765. The main trend is the upward cycle of November 8. Trading recommendations: Buy: 1.2946 Take profit: 1.2995 Buy: 1.2998 Take profit: 1.3030 Sell: 1.2887 Take profit: 1.2867 Sell: 1.2864 Take profit: 1.2838 For the dollar / franc pair, the key levels on the H1 scale are: 0.9930, 0.9913, 0.9900, 0.9881, 0.9863, 0.9853 and 0.9831. Here, we are following the development of the downward cycle of November 8. At the moment, the price is in correction. The continuation of the movement to the bottom is expected after the breakdown of the level of 0.9881. In this case, the target is 0.9863. Price consolidation is in the range of 0.9863 - 0.9853. For the potential value for the bottom, we consider the level of 0.9831. The expressed movement to which is expected after the breakdown of the level of 0.9851. Short-term upward movement is possibly in the range of 0.9900 - 0.9913. The breakdown of the last value will lead to an in-depth correction. Here, the goal is 0.9930. This level is a key support for the downward structure. The main trend is the downward cycle of November 8, the correction stage Trading recommendations: Buy : 0.9900 Take profit: 0.9911 Buy : 0.9914 Take profit: 0.9930 Sell: 0.9880 Take profit: 0.9865 Sell: 0.9852 Take profit: 0.9831 For the dollar / yen pair, the key levels on the scale are : 109.09, 108.91, 108.73, 108.44, 108.27, 108.06 and 107.92. Here, we continue to monitor the development of the downward cycle of November 7. At the moment, the price is in the correction zone from this structure. Short-term downward movement is expected in the range of 108.44 - 108.27. The breakdown of the last value should be accompanied by a pronounced downward movement. Here, the target is 108.06. We consider the level of 107.92 to be a potential value for the bottom. Upon reaching this value, we expect consolidation in the range of 108.06 - 107.92, as well as a rollback to correction. Short-term upward movement, as well as consolidation, are expected in the range of 108.73 - 108.91. We consider the level of 109.09 to be a potential value for the top. We expect the initial conditions for an ascending cycle to be formed to this level. The main trend: the downward structure of November 7, the correction stage Trading recommendations: Buy: 108.73 Take profit: 108.90 Buy : 108.94 Take profit: 109.07 Sell: 108.44 Take profit: 108.29 Sell: 108.25 Take profit: 108.06 For the Canadian dollar / US dollar pair, the key levels on the H1 scale are: 1.3332, 1.3268, 1.3246, 1.3208, 1.3185 and 1.3156. Here, the price is in the correction zone from the upward trend and has developed the potential for the bottom of November 14. A short-term upward movement, as well as consolidation, is expected in the range of 1.3246 - 1.3268. The breakdown of the latter value will lead to a pronounced movement. Here, the potential target is 1.3332, and upon reaching this level, we expect a pullback to the bottom. Short-term downward movement is possibly in the range of 1.3208 - 1.3185. The breakdown of the last value will lead to an in-depth correction. Here, the target is 1.3156. This level is a key support for the upward structure. The main trend is the formation of potential for the downward movement of November 14. Trading recommendations: Buy: 1.3246 Take profit: 1.3266 Buy : 1.3270 Take profit: 1.3332 Sell: 1.3208 Take profit: 1.3187 Sell: 1.3183 Take profit: 1.3156 For the Australian dollar / US dollar pair, the key levels on the H1 scale are : 0.6845, 0.6820, 0.6805, 0.6767, 0.6753, 0.6722 and 0.6700. Here, we are following the development of the downward cycle of November 5. At the moment, the price is in correction. Short-term downward movement is expected in the range of 0.6767 - 0.6753. The breakdown of the last value should be accompanied by a pronounced downward movement to the level of 0.6722. Price consolidation is near this level. For the potential value for the bottom, we consider the level of 0.6700. Upon reaching this value, we expect a rollback to the top. Consolidated movement is expected in the range of 0.6805 - 0.6820. The breakdown of the latter value will lead to an in-depth correction. Here, the target is 0.6845. This level is the key support for the downward structure from November 5. The main trend is the downward structure of November 5, the correction stage. Trading recommendations: Buy: 0.6805 Take profit: 0.6820 Buy: 0.6823 Take profit: 0.6842 Sell : 0.6767 Take profit : 0.6754 Sell: 0.6751 Take profit: 0.6724 For the euro / yen pair, the key levels on the H1 scale are: 121.40, 121.12, 120.70, 120.35, 120.03, 119.83, 119.51 and 119.25. Here, the price forms a pronounced potential for the upward movement of November 14. The continuation of the movement to the top is expected after the breakdown of the level of 120.35. Here, the goal is 120.70. Price consolidation is near this level. The breakdown of the level of 120.70 should be accompanied by a pronounced upward movement. Here, the goal is 121.12. For the potential value for the top, we consider the level of 121.40. Upon reaching this level, we expect a pullback to the bottom. Short-term downward movement is expected in the range of 120.03 - 119.83. The breakdown of the last value will lead to an in-depth correction. Here, the goal is 119.51. This level is a key support for the upward structure. The main trend is the formation of a pronounced potential for the top of November 14. Trading recommendations: Buy: 120.35 Take profit: 120.68 Buy: 120.72 Take profit: 121.10 Sell: 120.03 Take profit: 119.83 Sell: 119.80 Take profit: 119.51 For the pound / yen pair, the key levels on the H1 scale are : 141.93, 141.57, 141.27, 140.72, 140.15, 139.79, 139.36 and 138.97. Here, we are following the formation of the ascending structure of November 14. The continuation of the movement to the top is expected after the breakdown of the level of 140.72. In this case, the goal is 141.27. Short-term movement to the top, as well as consolidation is in the range of 141.27 - 141.57. We consider the level of 141.93 to be a potential value for the upward trend; upon reaching this level, we expect a pullback in correction. Short-term downward movement is possibly in the range 140.15 - 139.79. The breakdown of the latter value will favor the formation of a downward structure. Here, the target is 139.36. For the potential value for the bottom, we consider the level of 138.97, to which the design of the local structure is expected. The main trend is the formation of potential for the upward cycle of November 14. Trading recommendations: Buy: 140.72 Take profit: 141.25 Buy: 141.28 Take profit: 141.55 Sell: 140.15 Take profit: 139.83 Sell: 139.76 Take profit: 139.40 The material has been provided by InstaForex Company - www.instaforex.com |
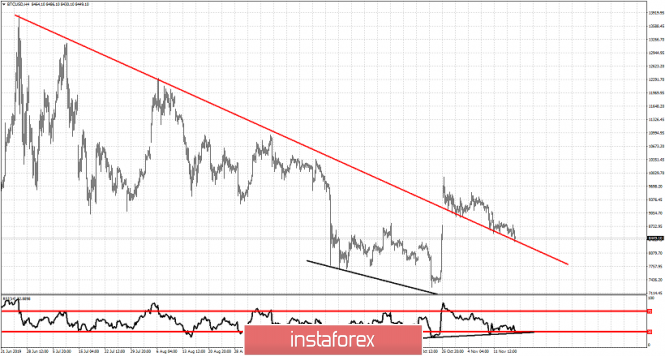
| Bitcoin still sliding down the trend line Posted: 17 Nov 2019 02:17 PM PST Bitcoin is sliding lower making lower lows and lower highs. Price is still above the downward sloping trend line resistance that was broken, but there is no sign of an upward reversal. However we keep a close eye to the RSI that provides us with some bullish clues.
Black line - bullish divergence and RSI support Bitcoin vs USD is sliding lower after the big spike back at the end of October. Price moved above $9,000 but is now moving below $8,600 again. However the RSI tells a different story. The RSI is not making new lows. The RSI has just reached its support trend line. What happens now?Usually we see a move higher. So I'm a expecting a rally in BTCUSD and to at least break above the first important short-term resistance at $8,840. Next important resistance is at $9,560. Breaking above this level will most probably push prices towards $11,000. Support is strong around $8,500 and I'm bullish here looking for a move higher. The material has been provided by InstaForex Company - www.instaforex.com |
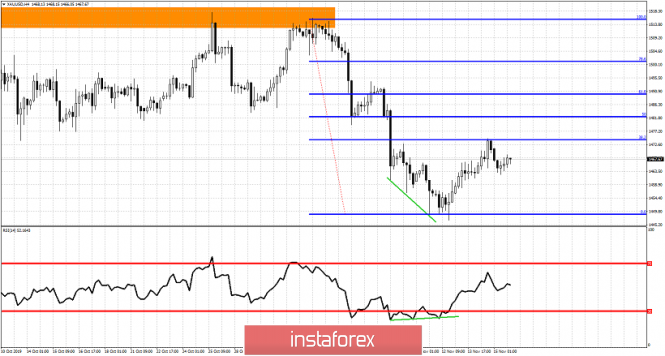
| Technical analysis of Gold for November 18, 2019 Posted: 17 Nov 2019 02:03 PM PST Gold price has bounced towards our first target at the 38% Fibonacci retracement after warning bears of the bullish divergence signs. This short-term relief bounce is still considered a selling opportunity as long as Gold price is below $1,525.
Green lines - bullish divergence Gold price has stopped its rise at $1,474 where the 38% retracement of the latest leg down is found.Short-term support is found at $1,462 and next at $1,446. Resistance is found at $1,475 and if broken I expect Gold to push higher towards $1.490 which is also an important Fibonacci resistance and a previously major support level, now resistance. I believe there are a lot of chances of seeing $1,490 again. The material has been provided by InstaForex Company - www.instaforex.com |
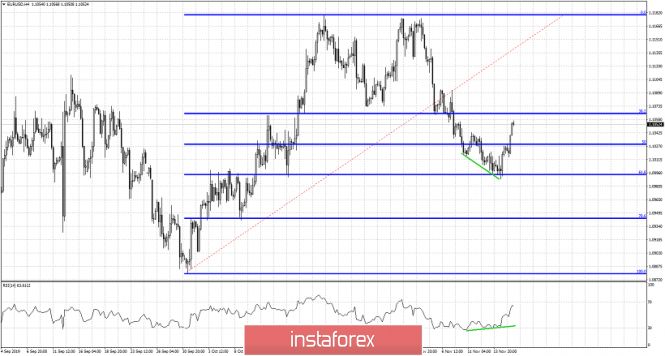
| EURUSD bounce is underway as expected Posted: 17 Nov 2019 01:58 PM PST In previous we mentioned the increased probability of a bounce in EURUSD from the major Fibonacci retracement support level around 1.10. Price has bounced from 1.0988 low and the 61.8% Fibonacci retracement level.
EURUSD ended the week at 1.1052 having bounced off the important Fibonacci support level we mentioned. Additionally we also noted that bullish divergence signs were evident in the 4 hour RSI and that was a warning for bears. This warning was a sign of increased chances of a bounce....The bounce came and it is now very important to see how this week unfolds. Has EURUSD made an equally important higher low relative to the October low of 1.0880. Is this the level where we see the start of a new upward wave that will eventually push price above 1.12?There are many chances of this happening.
|
| You are subscribed to email updates from Forex analysis review. To stop receiving these emails, you may unsubscribe now. | Email delivery powered by Google |
| Google, 1600 Amphitheatre Parkway, Mountain View, CA 94043, United States | |
No comments:
Post a Comment