
Forex analysis review |
- Forecast for EUR/USD on December 2, 2019
- Forecast for GBP/USD on December 2, 2019
- Forecast for AUD/USD on December 2, 2019
- Control zones for AUD/USD on 12/02/19
- Control zones EURUSD 12/2/2019
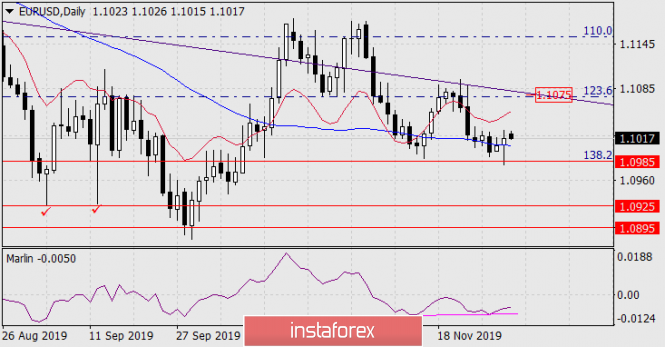
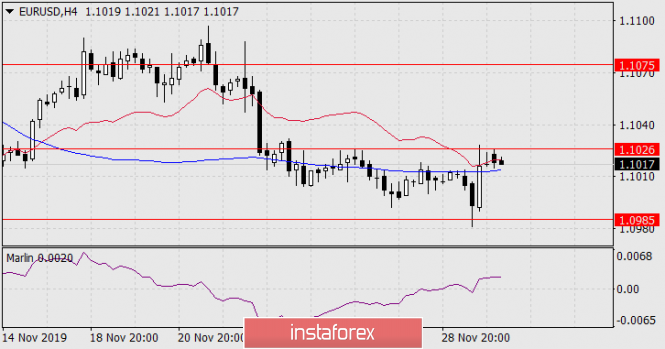
| Forecast for EUR/USD on December 2, 2019 Posted: 01 Dec 2019 07:38 PM PST EUR/USD The euro worked out the entire range of the previously noted consolidation of 1.0985-1.1026 onFriday. Today, in the Asian session, the price expects the arrival of new impulses for further movement. On the daily chart, the situation is rising - the price is above the MACD line and the Marlin oscillator formed a weak convergence. Growth prospect - the area of convergence of the Fibonacci level of 123.6% with the embedded line of the price channel at the price of 1.1075. Despite the unambiguous testimony of technical indicators, this scenario is by no means unambiguous. Oil slumped 4.63% (WTI) on Friday, natural gas fell 7.60%, copper dropped 1.30%. Such a movement in the commodity sector cannot but pull the currency market, especially since the closest target for WTI crude oil is seen at 50.60 (June 5 low, which is -8.7%). According to ISM, the November manufacturing activity index for the US manufacturing sector, released today, is expected to rise from 48.3 to 49.2. All these factors can turn the euro down even from current levels, especially since the price has not yet fixed itself above the MACD line, for this you need to close the daily session above this line. On the four-hour chart, the price is also above the MACD line, it has already consolidated here, but the exit may turn out to be false - during periods of consolidation, especially when the MACD line is horizontal, the price can wind up on it without stress. In addition, the signal line of the Marlin oscillator did not penetrate deep into the growth zone and can return back to the territory of negative numbers. So, we are waiting for the completion of correctional growth and, with the price going below 1.0985, a further decline in the euro to target levels of 1.0925, 1.0895. The material has been provided by InstaForex Company - www.instaforex.com |
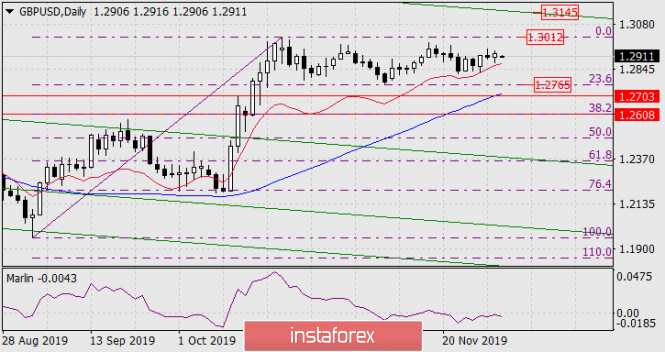
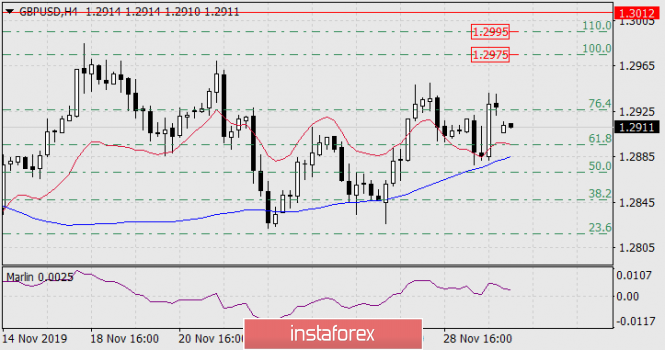
| Forecast for GBP/USD on December 2, 2019 Posted: 01 Dec 2019 07:38 PM PST GBP/USD The British pound continues to form a kind of fourth peak on the daily chart. To do this, it still needs to grow by 70-90 points and also return to the bottom of the formation in the region of 1.2790. The growth may last slightly higher, to the high of the first peak on October 21 at the price of 1.3012. The signal line of the Marlin Oscillator is in the declining trend zone, but this does not prevent the price from growing short-term. In the main version, the growth may end in the range of Fibonacci levels of 100.0-110.0% on a four-hour chart (1.2975/95). The option of price growth in the short term is strengthened by today's gap, which has not yet been closed. The Marlin Oscillator on H4 in the growth zone. |
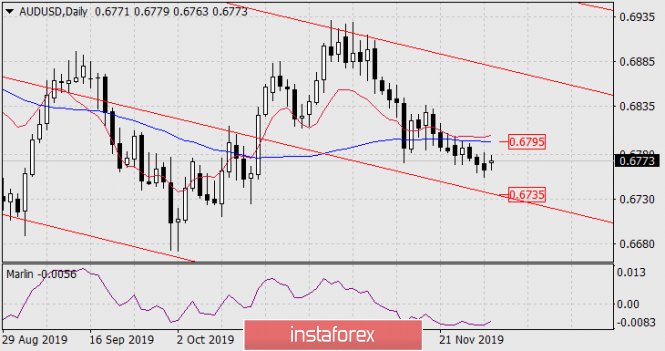
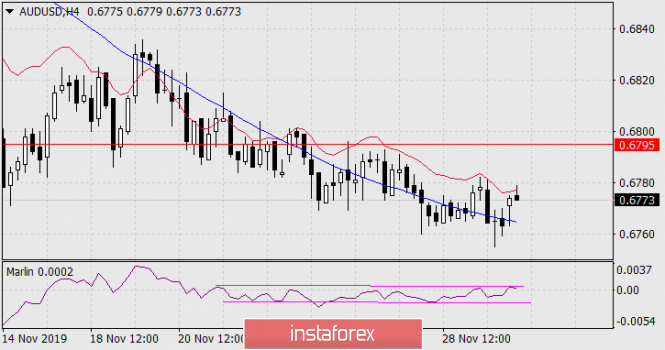
| Forecast for AUD/USD on December 2, 2019 Posted: 01 Dec 2019 07:38 PM PST AUD/USD The Australian dollar began to show signs of a reversal in the upward correction without testing the support of the embedded price channel line on the daily chart. Such a sign is the reversal of the signal line of the Marlin oscillator. The closest target is the resistance of the MACD line (0.6795). On a four-hour chart, the price is between the lines of MACD and balance, the signal line of the Marlin oscillator develops in its own range. The standard scenario assumes a downward turn of the line and a corresponding price fall, but the range should be broken sometime, and taking into account the Marlin readings on the daily chart, it can be broken today by the exit of the signal line and price up. Oil collapsed 4.63% (WTI) on Friday, natural gas fell 7.60%, copper -1.30%. We are waiting for the completion of the correction and the aussie to further fall under pressure from the US dollar and related markets. The material has been provided by InstaForex Company - www.instaforex.com |
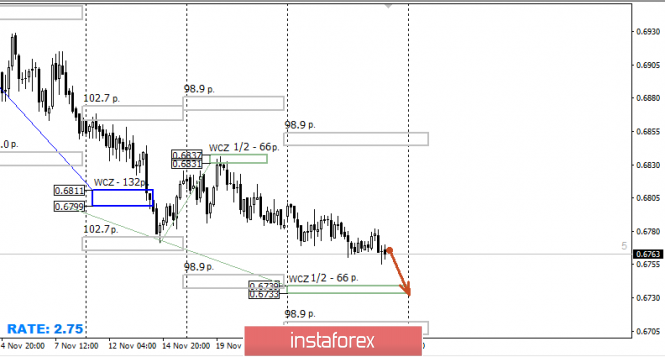
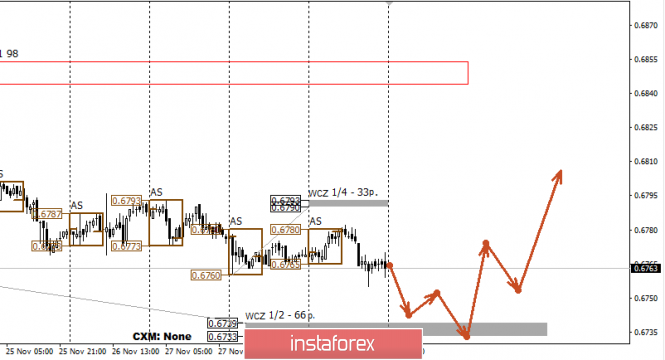
| Control zones for AUD/USD on 12/02/19 Posted: 01 Dec 2019 04:19 PM PST The downward movement of the pair remains a medium-term impulse, and thus, holding a short position is the main plan. On the other hand, closing of trading in November occurred at almost the minimum of the month. This indicates a high interest of market sellers who make trading at less favorable prices. Working in the downward direction will be the main plan in the first week of December. The goal of the reduction is the Weekly Control Zone of 1/2 0.6739-0.6733. Now, reaching the zone will close most of the sales. The proximity of the target zone Weekly Control Zone 1/2 suggests the need to consider the formation of a correctional model. If the zone test leads to an increase in demand and the pattern of "absorption" or "false breakdown" is formed, then purchases from the Weekly Control Zone 1/2 will come forward. Daily CZ - daily control zone. The zone formed by important data from the futures market that changes several times a year. Weekly CZ - weekly control zone. The zone formed by the important marks of the futures market, which change several times a year. Monthly CZ - monthly control zone. The zone that reflects the average volatility over the past year. The material has been provided by InstaForex Company - www.instaforex.com |
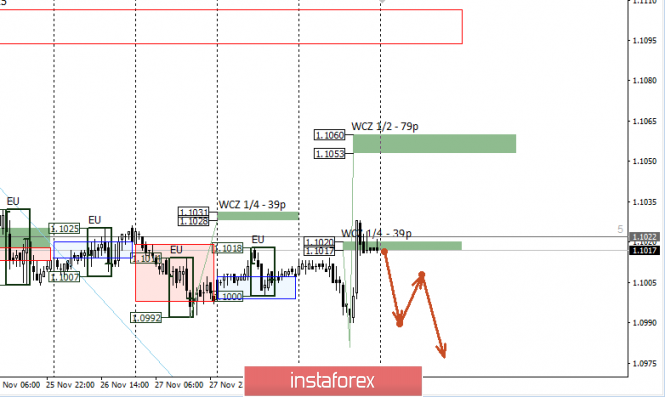
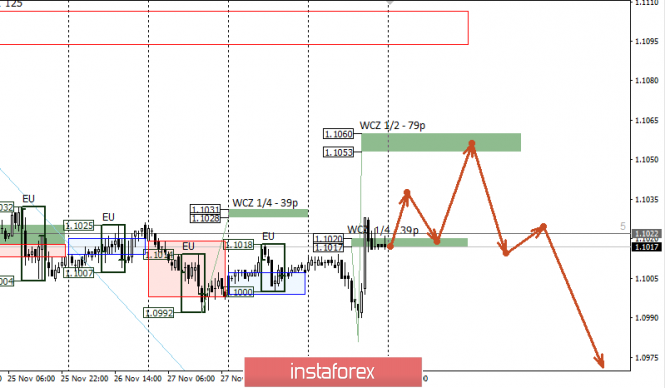
| Control zones EURUSD 12/2/2019 Posted: 01 Dec 2019 02:58 PM PST A sharp increase in demand at the US session on Friday made it possible for us to test the first resistance zone of the WCZ 1/4 1.1020-1.1017. If consolidation above this zone does not occur, then the fall will resume on Monday. The first goal of the decline will be the low of the previous week. Work in the downward direction remains a priority. The main purpose of the fall is the weekly control zone 1.0953-1.0939, the probability of reaching which is at 75%. An alternative model will be developed if the pair consolidates above the WCZ 1/4 at the US session on Monday. This will make it possible for you to consider growth to WCZ 1/2 1.1060-1.1053. The test of this zone will be decisive for the entire downward movement of November. Daily CZ - daily control zone. The area formed by important data from the futures market, which change several times a year. Weekly CZ - weekly control zone. The zone formed by important marks of the futures market, which change several times a year. Monthly CZ - monthly control zone. The zone, which is a reflection of the average volatility over the past year. The material has been provided by InstaForex Company - www.instaforex.com |
| You are subscribed to email updates from Forex analysis review. To stop receiving these emails, you may unsubscribe now. | Email delivery powered by Google |
| Google, 1600 Amphitheatre Parkway, Mountain View, CA 94043, United States | |
No comments:
Post a Comment