Forex analysis review |
- Forecast for EUR/USD on December 11, 2019
- Forecast for GBP/USD on December 11, 2019
- Forecast for USD/JPY on December 11, 2019
- Fractal analysis for major currency pairs on December 11
- EUR/USD. Euro grows on ZEW reports, dollar falls ahead of Fed meeting
- GBP/USD. December 10. Results of the day. Will Boris Johnson get a "ruling majority" government?
- EUR/USD. December 10. Results of the day. The Fed meeting may be passing. There could be surprises at the ECB meeting
- Euro could surprise investors in 2020
- Oil bends the line
- Euro's enormous efforts: course for recovery
- GBP/USD: pound still has room for growth before the election, and then everything is not so simple
- Pound summersaults: outrageous volatility and Death Cross
- Short-term technical analysis on Gold
- Short-term Elliott wave analysis on EURUSD
- BTC 12.10.2019 - Down cycle in the play, downward target set at the price of $6.570
- Gold 12.10.2019 - Potential for the upward cycle
- EUR/USD for December 10,2019 - EUR is heading towards our first target at 1.1116, potential for furter upside
- December 10, 2019 : EUR/USD Intraday technical analysis and trade recommendations.
- December 10, 2019 : GBP/USD Intraday technical analysis and trade recommendations.
- Trading idea for gold for the American session
- Evening review for EURUSD for 12/10/2019
- EURUSD and GBPUSD: The euro clings to any good data. The UK economy paused the reduction, showing zero growth
- Crude Oil 10/12 trading levels before inventories data
- GBP/USD: plan for the US session on December 10. A weak economy does not care about the buyers of the British pound
- EUR/USD: plan for the US session on December 10. The next data on the eurozone force bulls to buy the euro, but this is not
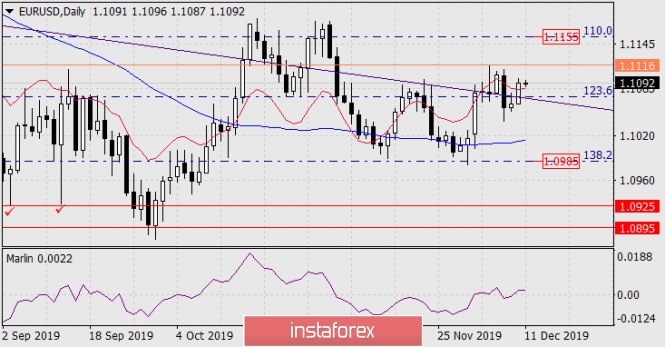
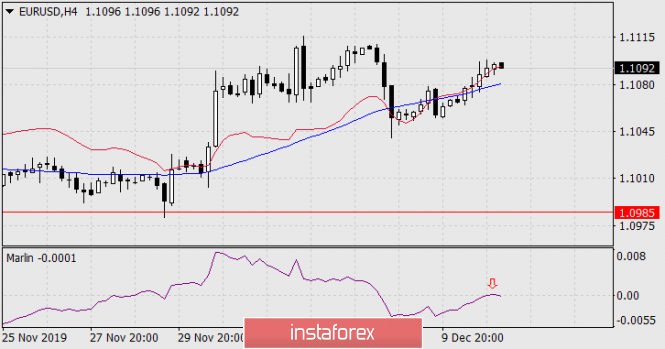
| Forecast for EUR/USD on December 11, 2019 Posted: 10 Dec 2019 07:07 PM PST EUR/USD Yesterday's indicators on sentiment in business circles of the eurozone greatly exceeded expectations and the single currency closed the day with an increase of 28 points. The Eurozone ZEW Economic Sentiment index for December jumped from -1.0 to 11.2 points while expecting growth to 2.2 points, the German index grew from -2.1 to 10.7 while expecting 1.1 points. On the daily chart, the price exceeded strong resistance of the Fibonacci level of 123.6% and the embedded line of the price channel. The price exit above the signal level of 1.1116 (December 4 high) opens the way for further growth to the Fibonacci level of 110.0%. Today, the main news of the day will be the US central bank's decision on monetary policy, followed by a press conference by Federal Reserve Chairman Jerome Powell. We do not expect strong movements in the euro until the evening, as it was yesterday. What will be the Fed's forecasts on the economy and forecasts of the FOMC members on rates? The most obvious answer lies on the surface - economic forecasts will be moderately optimistic, rate forecasts will shift towards holding the current 1.75% almost until the fall-winter of next year. And if it turns out that way, then investors can count on maintaining the rate almost until the spring of 2021, until the new president takes office. A financial crisis may hinder this situation, the chances of the deployment of which are great next year, but so far this factor has not been taken into account. In general, we expect the euro to return under the newfound support from the Fibonacci lines and the price channel and a further decrease in the price to the Fibonacci level of 138.2% at the price of 1.0985. On the four-hour chart, the signal line of the Marlin oscillator reached the boundary with the growth territory, from which the indicator can turn down, followed by a price drop. The material has been provided by InstaForex Company - www.instaforex.com |
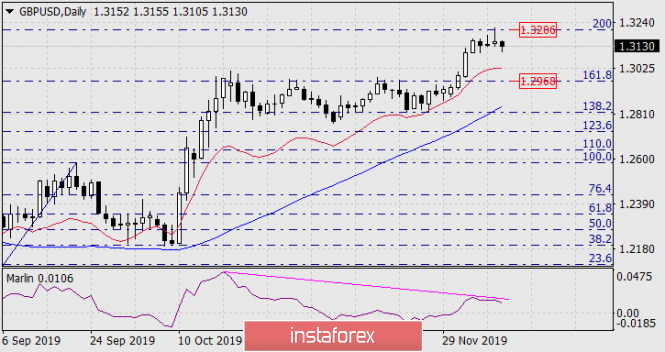
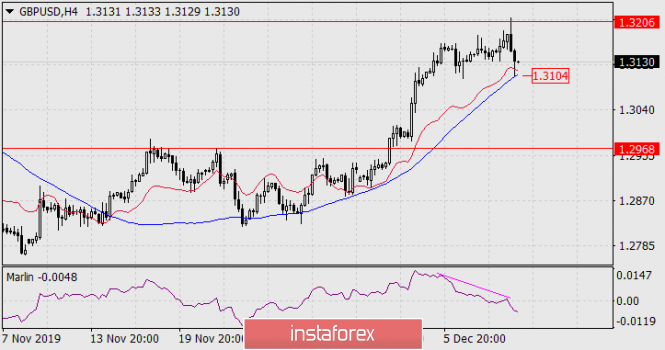
| Forecast for GBP/USD on December 11, 2019 Posted: 10 Dec 2019 07:03 PM PST GBP/USD The pound reached the target of 1.3206 at the Fibonacci level of 200.0% on Tuesday and sharply turned down from it. The convergence on the Marlin oscillator is almost ready, it remains only to wait for its confirmation. Formally, such a confirmation will be a price drop below the Fibonacci level of 161.8% (1.2968). On the four-hour chart, the expected convergence formed in a strongly inclined form, after the signal line went into the negative zone. This is a strong reversal pattern. The stop of the price reduction occurred on the MACD line. Here the price may be delayed until the news from the Federal Reserve meeting. Price fall below the MACD line (1.3104) opens the target at 1.2968. Consolidating the price at 1.2968 tomorrow will indicate that the pound is overestimated at current levels, in anticipation of the outcome of parliamentary elections in the UK and the results will be known on Friday morning. So, we anticipate the British pound at the price of 1.2968 tomorrow. The material has been provided by InstaForex Company - www.instaforex.com |
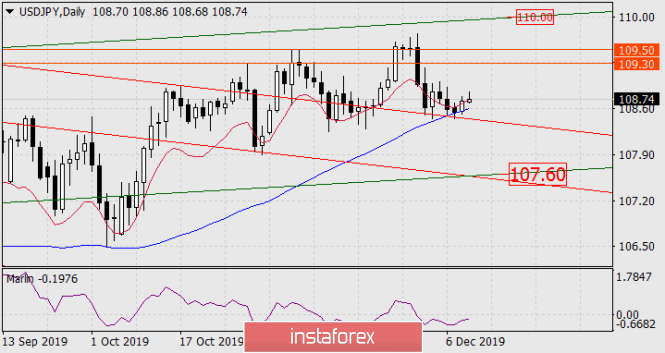
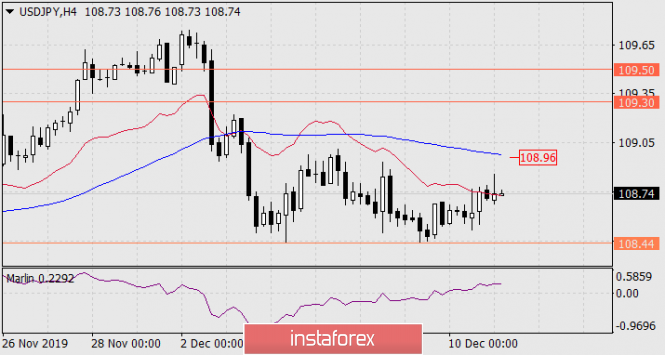
| Forecast for USD/JPY on December 11, 2019 Posted: 10 Dec 2019 06:58 PM PST USD/JPY The dollar slightly grew on Tuesday relative to the yen due to media reports that the US will not introduce new duties on Chinese goods from December 15th as "negotiations continue in an optimistic manner." But stock indexes are not in a hurry with such optimism; Yesterday, the S&P 500 fell 0.11%, while the Nikkei225 is losing 0.24% today. Chinese stock indexes hover near zero. On the daily chart, the current growth began after the price touched the trend line of the red price channel on Monday, and the MACD line connected on Tuesday. But the Marlin indicator line remains in the negative trend zone. Investors are in no hurry to take further action before today's Federal Reserve meeting and tomorrow's election to the British Parliament. At the same time, the Tankan indices are expected to deteriorate on Friday - quarterly indicators of business activity in the manufacturing and non-manufacturing sectors: Tankan Manufacturing may fall from 5 to 3 in the 4-1 quarter, Tankan Non-Manufacturing is expected to be 16 points versus 21 in the previous period. The signal line of the Marlin oscillator in the growth zone on the H4 chart. This factor makes it possible to sustain growth, and overcoming the resistance of the MACD line (108.96) can extend the growth in the range of 109.30/50. Price fall below the signal level of 108.44 - the low of December 9 and 4, opens the target of 107.60 - support of the green price channel embedded line. The down option is still the main one. The material has been provided by InstaForex Company - www.instaforex.com |
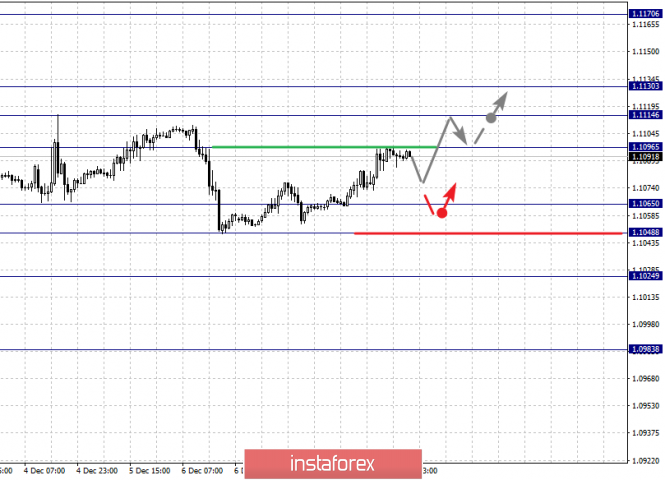
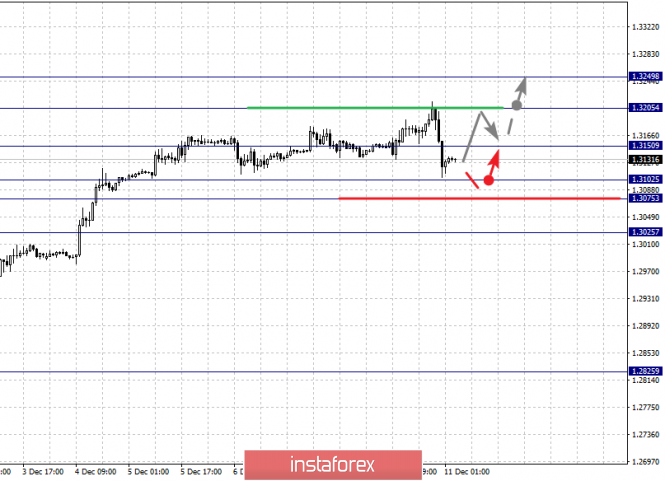
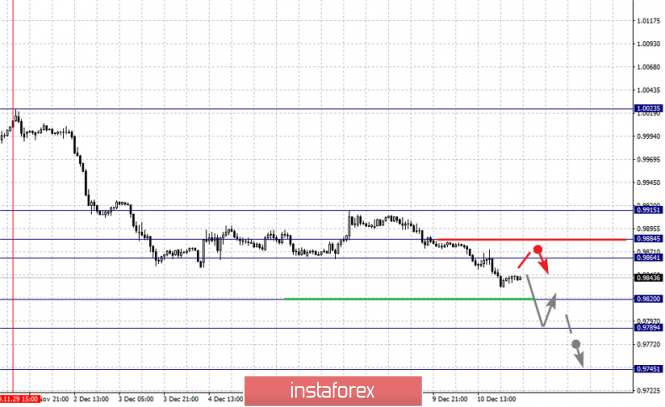
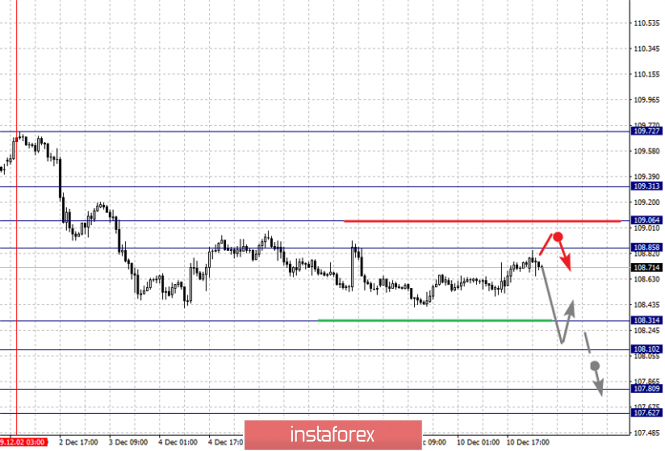
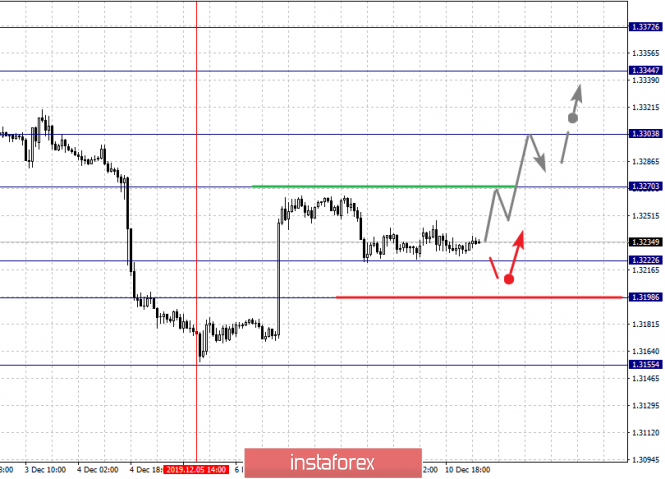
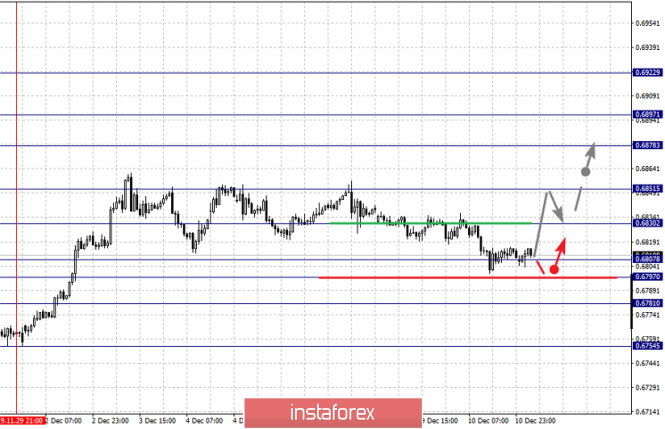
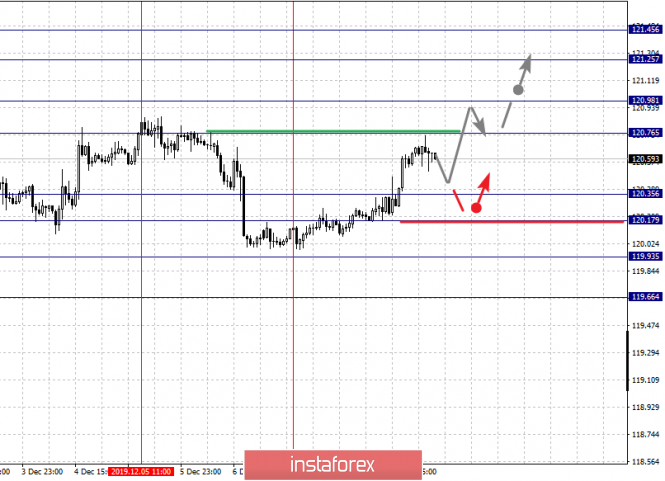
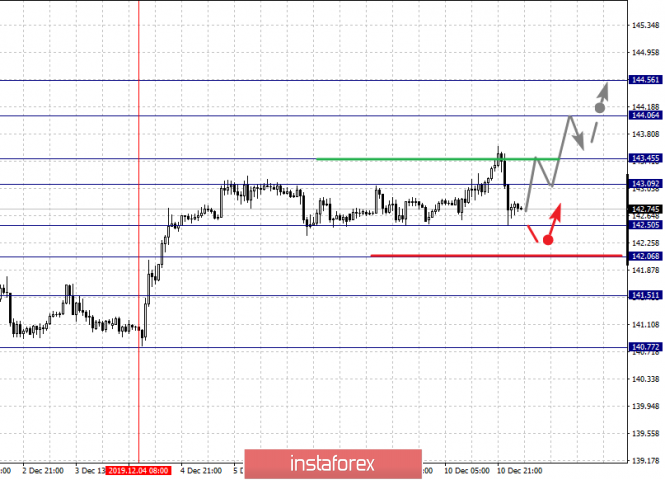
| Fractal analysis for major currency pairs on December 11 Posted: 10 Dec 2019 06:56 PM PST Forecast for December 11: Analytical review of currency pairs on the scale of H1: For the euro / dollar pair, the key levels on the H1 scale are: 1.1170, 1.1130, 1.1114, 1.1096, 1.1065, 1.1048 and 1.1024. Here, we are following the development of the upward cycle of November 29. We expect a short-term upward movement, as well as consolidation in the range of 1.1096 - 1.1114. The breakdown of the level of 1.1114 will lead to a movement to 1.1130. Price consolidation is near this level. For the potential value for the top, we consider the level of 1.1170. The movement to which is expected after the breakdown of the level of 1.1130. Short-term downward movement is expected in the range of 1.1065 - 1.1048. The breakdown of the last value will lead to an in-depth correction. Here, the goal is 1.1024. This level is a key support for the upward structure. The main trend is the formation of initial conditions for the top of November 29, the correction stage Trading recommendations: Buy: 1.1096 Take profit: 1.1114 Buy: 1.1114 Take profit: 1.1130 Sell: 1.1065 Take profit: 1.1050 Sell: 1.1046 Take profit: 1.1026 For the pound / dollar pair, the key levels on the H1 scale are: 1.3249, 1.3205, 1.3150, 1.3102, 1.3075 and 1.3025. Here, we are following the development of the upward cycle of November 27. The continuation of the movement to the top is expected after the breakdown of the level of 1.3150. In this case, the target is 1.3205. Price consolidation is near this level. For the potential value for the top, we consider the level of 1.3249. Upon reaching this level, we expect consolidation, as well as a pullback to the bottom. Short-term downward movement is possibly in the range of 1.3102 - 1.3075. The breakdown of the last value will lead to an in-depth correction. Here, the target is 1.3025. This level is a key support for the top. The main trend is the upward cycle of November 27 Trading recommendations: Buy: 1.3150 Take profit: 1.3205 Buy: 1.3207 Take profit: 1.3247 Sell: 1.3102 Take profit: 1.3076 Sell: 1.3073 Take profit: 1.3027 For the dollar / franc pair, the key levels on the H1 scale are: 0.9915, 0.9884, 0.9864, 0.9820, 0.9789 and 0.9745. Here, we are following the development of the downward structure of November 29. The continuation of movement to the bottom is expected after the breakdown of the level of 0.9820. In this case, the target is 0.9789. Price consolidation is near this level. The breakdown of the level of 0.9789 should be accompanied by a pronounced downward movement. In this case, the potential target is 0.9745. We expect a rollback to correction from this level. Short-term upward movement is possibly in the range of 0.9864 - 0.9884. The breakdown of the latter value will lead to in-depth movement. Here, the target is 0.9915. This level is a key support for the downward structure of November 29. The main trend is the downward structure of November 29 Trading recommendations: Buy : 0.9864 Take profit: 0.9883 Buy : 0.9885 Take profit: 0.9913 Sell: 0.9820 Take profit: 0.9791 Sell: 0.9787 Take profit: 0.9745 For the dollar / yen pair, the key levels on the scale are : 109.31, 109.06, 108.85, 108.58, 108.31, 108.10, 107.80 and 107.62. Here, we are following the descending structure of December 2. Short-term movement to the bottom is possibly in the range 108.31 - 108.10. The breakdown of the last value will lead to a pronounced movement. Here, the goal is 107.80. For the potential value for the bottom, we consider the level of 107.62. Upon reaching which, we expect consolidation, as well as a rollback to the top. Short-term upward movement is expected in the range 108.85 - 109.06. The breakdown of the last value will lead to an in-depth correction. Here, the goal is 109.31. This level is a key support for the downward structure. Main trend: descending structure of December 2 Trading recommendations: Buy: 108.85 Take profit: 109.04 Buy : 109.08 Take profit: 109.30 Sell: 108.30 Take profit: 108.12 Sell: 108.08 Take profit: 107.80 For the Canadian dollar / US dollar pair, the key levels on the H1 scale are: 1.3372, 1.3344, 1.3303, 1.3270, 1.3222, 1.3198 and 1.3155. Here, we are following the formation of the ascendant structure of December 5. The continuation of the movement to the top is expected after the breakdown of the level of 1.3270. In this case, the target is 1.3303. Price consolidation is near this level. The breakdown of the level of 1.3306 will lead to a pronounced movement. Here, the target is 1.3344. The potential value for the top is considered to be the level of 1.3372. Upon reaching which, we expect consolidation, also a rollback to correction. Short-term downward movement is possibly in the range of 1.3222 - 1.3198. The breakdown of the latter value will lead to the development of a downward trend. Here, the target is 1.3155. The main trend is the formation of the ascending structure of December 5 Trading recommendations: Buy: 1.3270 Take profit: 1.3303 Buy : 1.3305 Take profit: 1.3344 Sell: 1.3220 Take profit: 1.3200 Sell: 1.3196 Take profit: 1.3160 For the Australian dollar / US dollar pair, the key levels on the H1 scale are : 0.6878, 0.6851, 0.6830, 0.6807, 0.6797 and 0.6781. Here, we are following the formation of expressed initial conditions for the top of November 29. At the moment, the price is in the correction zone from this structure. Short-term upward movement is expected in the range of 0.6830 - 0.6851. The breakdown of the level of 0.6851 will lead to a marked development of the upward trend. Here, the potential target is 0.6878. Price consolidation is near this value. Short-term downward movement is expected in the range of 0.6807 - 0.6797. The breakdown of the last value will lead to an in-depth correction. Here, the target is 0.6781. This level is a key support for the upward structure. The main trend is the formation of expressed initial conditions for the top of November 29, the correction stage Trading recommendations: Buy: 0.6830 Take profit: 0.6848 Buy: 0.6853 Take profit: 0.6878 Sell : 0.6807 Take profit : 0.6797 Sell: 0.6795 Take profit: 0.6783 For the euro / yen pair, the key levels on the H1 scale are: 121.45, 121.25, 120.98, 120.76, 120.35, 120.17, 119.93 and 119.66. Here, the price is in equilibrium: the descending structure of December 5, as well as the ascending structure of December 9. The development of the upward trend is expected after the breakdown of the level of 120.76. In this case, the target is 120.98. Price consolidation is near this level. The breakdown of the level of 121.00 should be accompanied by a pronounced upward movement. Here, the goal is 121.25. For the potential value for the top, we consider the level of 121.45. Upon reaching which, we expect a rollback to the correction. Short-term downward movement is possibly in the range of 120.35 - 120.17. The breakdown of the latter value will have the downward structure development from December 5, and in this case, the first goal is 119.93. For the potential value for the bottom, we consider the level of 119.66. The main trend is the equilibrium situation. Trading recommendations: Buy: 120.76 Take profit: 120.96 Buy: 121.00 Take profit: 121.25 Sell: 120.35 Take profit: 120.20 Sell: 120.15 Take profit: 119.95 For the pound / yen pair, the key levels on the H1 scale are : 144.56, 144.06, 143.45, 143.09, 142.50, 142.06 and 141.51. Here, we are following the ascending structure of December 4. Short-term movement to the top is expected in the range of 143.09 - 143.45. The breakdown of the last value will lead to a pronounced movement. Here, the goal is 144.06. For the potential value for the top, we consider the level of 144.56. Upon reaching this value, we expect consolidation, as well as a pullback to the bottom. Short-term downward movement is possibly in the range of 142.50 - 142.06. The breakdown of the last value will lead to an in-depth correction. Here, the goal is 141.51. This level is a key support for the top. The main trend is the local ascending structure of December 4 Trading recommendations: Buy: 143.10 Take profit: 143.44 Buy: 143.50 Take profit: 144.06 Sell: 142.50 Take profit: 142.10 Sell: 142.04 Take profit: 141.54 The material has been provided by InstaForex Company - www.instaforex.com |
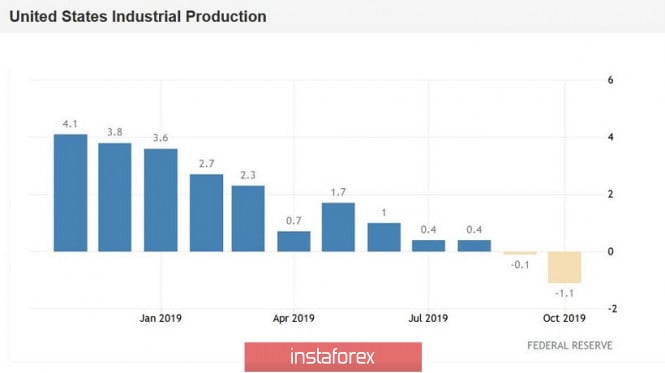
| EUR/USD. Euro grows on ZEW reports, dollar falls ahead of Fed meeting Posted: 10 Dec 2019 02:50 PM PST Following the release of the unexpectedly strong Nonfarms, bears of the euro-dollar pair got a chance to fall to the area of the 9th figure, namely under the support level of 1.0970. However, sellers did not seize the opportunity - primarily because of the vulnerability of the US currency, which is waiting for important environmental events. Tomorrow we will find out data on inflation in the US, and also listen to Jerome Powell, who will summarize not only the results of the December meeting of the Federal Reserve, but also outline the prospects for further steps next year. Of course, the US labor market has provided significant support to dollar bulls - for example, thanks to this release, the EUR/USD pair suspended its growth and retreated by nearly a 100 points. But, as it turned out, even the strong Nonfarms are unable to radically turn the tide over the pair. Traders are accustomed to the positive dynamics in the labor market - the bearish reaction was mainly due to the previous ADP report, which showed an extremely low result (69 thousand). The contrast with the official numbers (+266 thousand) made it possible for EUR/USD bears to return the pair to the framework of the 10th figure. But sellers need stronger arguments to develop a full-blown downward trend. Meanwhile, bulls are not wasting time. The business sentiment indices published today by the ZEW Institute in Germany and throughout the eurozone helped the European currency regain its position not only in tandem with the dollar, but throughout the market. The German indicator in December showed the strongest growth over the past two years. For the first time since April, the indicator was above zero and reached 10.7 points - this is the best result since February 2018. By the way, the recently published index of business activity in the manufacturing sector in Germany (PMI) also appeared in the green zone: instead of the projected decline, it has slightly increased, and growth has been recorded for the second straight month. And although this indicator remained below the key 50-point level, the trend itself provided background support for the euro. However, despite a slight correctional growth, the EUR/USD pair still remains within the price range of 1.0970-1.1090, the boundaries of which it cannot leave for the second month. Traders are waiting for the key events of this week, and most of them will happen tomorrow. Key data on inflation in the United States will be released at the beginning of the US session. According to the consensus forecast, the general consumer price index will show contradictory dynamics - the indicator should slightly increase (up to 2.0%) in annual terms, while it should slightly decrease on a monthly basis up to 0.2%. Core inflation should completely repeat the trajectory of October: 0.2% MOM, 2.3% YOY. It is important for dollar bulls that these indicators come out at least at the forecast level. Otherwise, representatives of the dovish wing of the Fed will again focus on the weak growth of inflation indicators. Let me remind you that the index of personal consumption expenditures published at the end of November (which measures the core level of expenditures and indirectly affects the dynamics of inflation in the United States) came out worse than forecasts: it fell to 0.1% in monthly terms, continuing the negative trend. On an annualized basis, the indicator also decreased (to 1.6%), although experts expected it to remain at the previous level (1.7%). The level of population spending showed a slight increase (0.3%), although a consensus forecast indicated an increase to 0.5%. It is worth noting here that Fed Chairman Jerome Powell said a few months ago that the regulator would not even think about tightening monetary policy until key inflation indicators return to sustainable growth. I believe that he will repeat this thesis tomorrow - in one interpretation or another. With a high degree of probability, the Fed will hint a wait-and-see attitude tomorrow, even if the November inflation fails or vice versa - it will pleasantly surprise you. The fact is that the Fed is now caught in the grip of conflicting fundamental factors. On the one hand, the growth of US GDP (the indicator for the third quarter was revised upwards), strong Nonfarms, a decrease in unemployment to a 50-year low and a slowdown in the rate of decrease in investment in fixed assets. On the other hand, there are problems in the manufacturing and export sectors. The ISM manufacturing index slumped to 48.1 points, contrary to analysts' forecasts, who expected its growth in November. The ISM composite index for the non-manufacturing sector also came out in the red zone, not reaching forecast values: instead of rising to 54.5, it fell to 53.9 points. The producer price index and industrial production also showed a downward trend. All these are the negative consequences of a trade war, which may continue in the near future. The United States could impose additional duties on Chinese imports ($160 billion) on December 15, forcing China to resort to retaliatory measures. According to the Wall Street Journal, the White House is currently discussing an option to postpone this decision (presumably until mid-January or February). However, there is no official confirmation of this. Given the continuing uncertainty regarding the prospects for global conflict, the Fed is unlikely to voice too hawkish or dovish intentions - Powell will adhere to expectant tactics, maintaining the appropriate balance in his statements. Traders will have to decide on their own - "the glass is half empty or half full." If the regulator nevertheless admits the probability of a rate cut in 2020, the dollar will fall under a sell-off, and the EUR/USD pair will again be consolidated within the 11th figure. In other cases, the market reaction will be either restrained or briefly bearish. As with the Nonfarm release, bears can pull the price to the bottom of the 10th figure, with the further intention of testing the support level of 1.0970. But given the upcoming meeting of the ECB (which will take place on Thursday) to open major positions tomorrow is impractical, regardless of the outcome of the meeting of Fed members. Indeed, Christine Lagarde can radically redraw the fundamental background for the EUR/USD pair on Thursday. The material has been provided by InstaForex Company - www.instaforex.com |
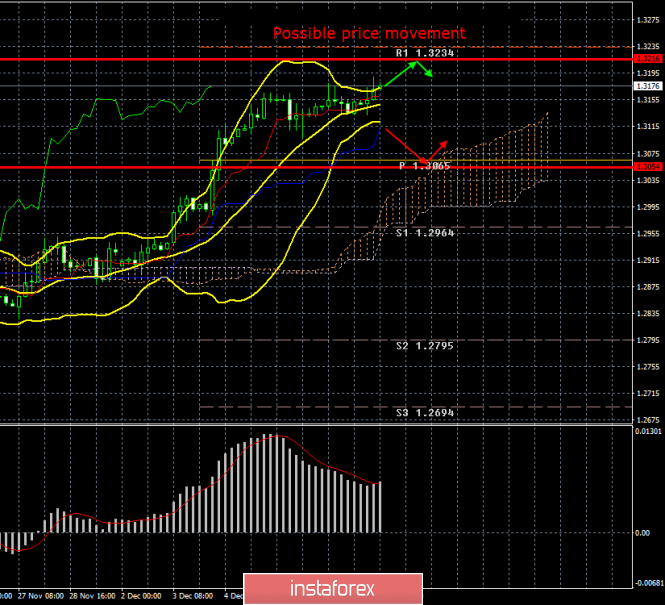
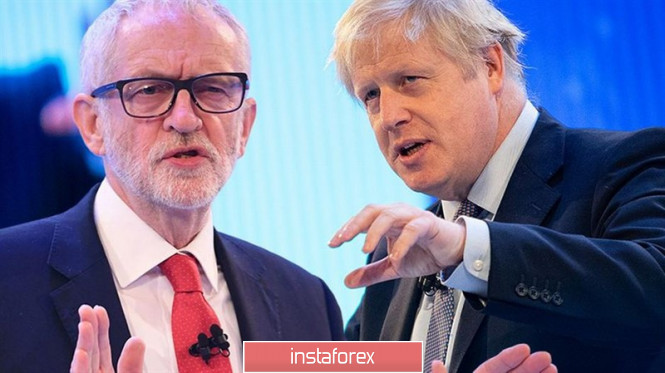
| GBP/USD. December 10. Results of the day. Will Boris Johnson get a "ruling majority" government? Posted: 10 Dec 2019 02:50 PM PST 4-hour timeframe Amplitude of the last 5 days (high-low): 82p - 138p - 65p - 66p - 50p. Average volatility over the past 5 days: 81p (average). The GBP/USD currency pair continues its upward movement, not paying attention to anything. There has not been a significant strengthening of the pound today, however, no correction has begun. This is despite the fact that two more important macroeconomic indicators came out in the UK today. However, market participants once again, out of habit, ignored them, and we can only ask ourselves questions: "When will all the failed macroeconomic reports from the UK be worked out" and "where will the pound go when the traders pay attention to the failed statistics on Great Britain?" "As you might guess, both Tuesday's publications failed, as did virtually all of the statistics from the UK over the past two months. In monthly terms, GDP showed zero growth, a month earlier a value of -0.1% MOM was recorded, and a month earlier there were even losses of -0.2% MOM. Industrial production grew by a meager 0.1% in October, while expert forecasts predicted an increase of at least 0.2% MOM. In annual terms, industrial production lost 1.3%. However, traders are not interested in this information right now. Market participants continue to see a bright future with Boris Johnson at the head of the country, at the head of Parliament and outside the European Union. We will not discuss now whether it is really good for Britain to leave the EU. Three years after the referendum, such a question should not be raised at all. However, from time to time he still appears on the front of the stage. And with it, discussions begin, how all of Johnson's plans can end. The prime minister's plans, who still has not won more than one significant victory at the helm of the country. Only two days left before the fateful parliamentary elections. All sociological polls say the same thing: Conservatives are leading and their leadership is +9-14% over Labour. The rest of the parties, according to polls, are far behind. According to the calculations of The Times newspaper, in this alignment of forces, Conservatives can get more than half of the parliamentary mandates, which will allow them to form a majority government and, accordingly, freely implement Brexit. However, this may not happen, some experts say. The biggest danger for the Conservative Party now is the so-called "tactical vote." Voting, in which a vote will not be given for a particular party, because the British citizen is suited by the political principles and the program of this particular party and deputy, but in which the vote will be "for" Brexit or "against" Brexit. Incidentally, we have repeatedly talked about this long before the election. Despite the strong position of the Conservatives, we recall that 48% of the British population were against Brexit back in 2016 and, accordingly, can vote for anyone other than the Conservatives. Moreover, now that the regions that support the Labour Party, which support the Conservatives, are approximately known, according to the organization "Best for Britain", clearly coordinated actions of only 40,000 people can be enough for the Conservatives not to get the majority of seats in Parliament. For example, it is possible to determine regions where the distribution of votes between Conservatives and Labour may be approximately the same and then every thousand or one hundred votes for one or another deputy will matter. In such regions, actions can be held aimed at preventing the Conservatives from winning and preventing Brexit from taking place. Therefore, the pound continues to show its favorite form of strengthening in the last three years - "growth on expectations." Expectations for a brighter future and the implementation of Brexit. However, if suddenly the election results show that the Conservatives can not form a ruling, then a wave of disappointment can overwhelm traders, and the pound will go back to its multi-year lows. Then traders will remember all the failed macroeconomic statistics at once. If Johnson's party nevertheless wins by the necessary margin from the pursuers, then two options are possible for the pound sterling. The first is no reaction from traders, since the current pound sterling rate has already taken into account the victory of Boris Johnson three times. The second is that if a wave of optimism engulfs markets even more, then British currency purchases will continue. However, even in this situation, sooner or later, traders will begin to pay attention to the weak macroeconomic statistics of Great Britain. Trading recommendations: GBP/USD resumed a slight upward movement. Thus, it is now recommended to trade for an increase while aiming for 1.3216 and 1.33234. It is not recommended to consider selling the pound now, since the pair is far from the Kijun-sen critical line, traders ignore any macroeconomic data, and the pound rises in price solely on expectations of the Conservative party winning the election. The consumer price index in the United States will be published tomorrow, as well as the Fed meeting, but these events can also be ignored by market participants. Explanation of the illustration: Ichimoku indicator: Tenkan-sen is the red line. Kijun-sen is the blue line. Senkou Span A - light brown dotted line. Senkou Span B - light purple dashed line. Chikou Span - green line. Bollinger Bands Indicator: 3 yellow lines. MACD indicator: Red line and bar graph with white bars in the indicator window. Support / Resistance Classic Levels: Red and gray dotted lines with price symbols. Pivot Level: Yellow solid line. Volatility Support / Resistance Levels: Gray dotted lines without price designations. Possible price movement options: Red and green arrows. The material has been provided by InstaForex Company - www.instaforex.com |
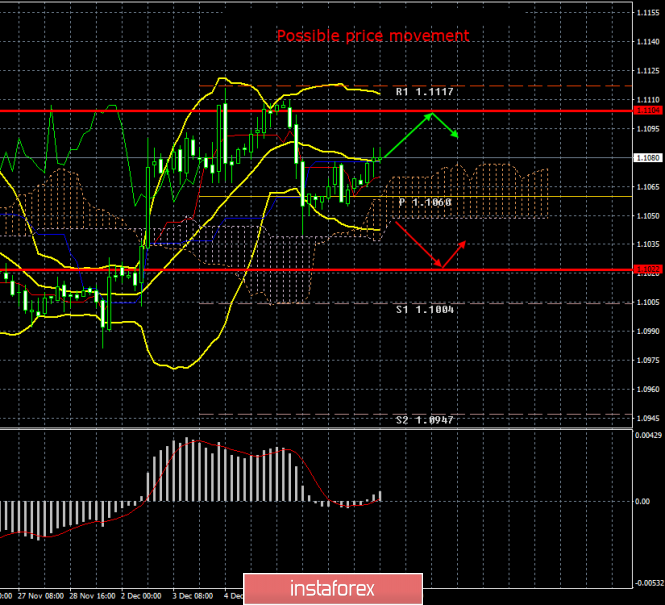
| Posted: 10 Dec 2019 02:50 PM PST 4-hour timeframe Amplitude of the last 5 days (high-low): 27p - 49p - 31p - 70p - 25p. Average volatility over the past 5 days: 41p (average). On Tuesday, December 10, the EUR/USD currency pair continues to trade near the critical Kijun-sen line and can even overcome it in the near future. However, until this happens, certain chances remain for the resumption, after the correction, of the downward movement. "Certain" - because the pair again shows weak volatility. Because it is not known how the meetings of the European Central Bank and the Federal Reserve will end, which traders are openly waiting for. Because it is not known whether Donald Trump will introduce a new package of duties against China on December 15 worth $160 billion. It is not known whether the euro/dollar pair will return to the paradoxical situation that we described a few weeks ago. Indeed, in fact, the situation for the EUR/USD pair has not really changed much over the past few weeks. Quotes are still close to two-year lows. Bulls are still weak. Bears still can not find enough good reasons to continue trading on the decline. Based on this, the pair may even return to a flat now and ignore the meetings of the Fed and the ECB. Moreover, any adopted changes in monetary policies are not expected in the meetings. However, at the moment, traders should still focus on the two next important events, the Fed and the ECB. From our point of view, the Fed meeting, which will be held tomorrow (more precisely, its results will be summed up tomorrow), will not present any surprises or any interesting information to traders. It is no secret that Jerome Powell and the company have already decided that a pause of at least a few months should be taken in the US monetary policy easing cycle. In the future, if the geopolitical situation in the world continues to increase, if the United States and China fail to find a common language and end the trade war, if Trump continues to unleash trade wars left and right in the last year of his presidency, then monetary policy may be softened again. This will be a necessary step of the Fed. But the decision to lower the key rate will be made explicitly on the basis of macroeconomic statistics, which will best respond to all of the above factors. Even Donald Trump himself is unlikely to be able to influence the Fed now, since Powell lowered the key rate three times in a row, partly going to a meeting with the US president. No one will ever know if Powell's decisions included the "Trump factor", which mercilessly criticized the Fed chairman for a year (and still continues to criticize him now). However, Donald Trump definitely also influenced the threefold easing of monetary policy. But a further rate cut is unlikely to happen because Trump needs to win a trade war with China, and this is difficult to achieve when Beijing has power over its central bank and, accordingly, over monetary policy and the national currency, and the US president does not have such power. Trump needs ultra low rates so that the trade balance begins to equalize in favor of the United States, that the dollar becomes cheaper, and accordingly, it becomes easier for foreign consumers to buy American goods. However, Jerome Powell is not obliged to follow Trump and his organization clearly has its own goals and strategies. Thus, we do not expect any special changes in the monetary policy of the Fed. As for the ECB meeting, everything is much more interesting as the debriefing of which will take place on Thursday. Firstly, this will be the first meeting led by Christine Lagarde. Secondly, the mood of the new president of the ECB could be called dovish, since Lagarde has focused on the weaknesses of the eurozone economy, urged the governments of the EU countries to invest more in their own economies, saying that "strategic changes are needed". Thus, we are fully entitled to rely on the fact that the European regulator will go for a new rate cut or for expanding the QE program, and possibly both. In any case, such steps by the ECB do not bode well for the euro. These actions by the ECB may well be enough for the bears to start selling the euro again and put pressure on the EUR/USD pair in the medium and long term. It remains only to find out when Lagarde is going to cut rates and what strategic changes will be made? All this we can find out from Lagarde's press conference on Thursday. It is unlikely that the ECB rate will be reduced in the first months of the work of the new chairman. Consequently, one should keep a close eye on Lagarde's allusions to future actions. The technical picture of the EUR/USD pair is now such that lateral movement may well resume. Moreover, it may not end tomorrow, but, for example, on Thursday, or even persist all week. As we have already figured out, the Fed meeting may become a passing one, the inflation report in the States (scheduled for tomorrow) may turn out to be neutral and not cause traders' reactions. Thus, formally, there is now a short-term downward trend, but the "dead cross" is weak, and the price is threatening to consolidate back above the Kijun-sen line. The technical picture of the EUR/USD pair is now such that sideways movement may well resume. And it can end not tomorrow, but, for example, on Thursday, or it might even persist all week. As we have already seen, the Fed meeting could become a walk-through, the report on inflation in the United States (scheduled for tomorrow) may turn out to be neutral and not cause a reaction of traders. Thus, formally, there is now a short-term downward trend, but the Death cross is weak, and the price threatens to consolidate back above the Kijun-sen line. Trading recommendations: The EUR/USD pair has taken a big step towards a new downward trend. However, in order to be able to buy the US dollar, you need to wait for the Ichimoku cloud to be overcome, which will strengthen the sell signal. In this case, the bears will be able to sell the euro/dollar pair while aiming for 1.1022 and 1.1004. It is recommended to resume purchases of the euro in the event that traders regress above the critical line, but even in this case, you should be extremely careful when buying, since the pair still does not have significant fundamental growth factors. Explanation of the illustration: Ichimoku indicator: Tenkan-sen is the red line. Kijun-sen is the blue line. Senkou Span A - light brown dotted line. Senkou Span B - light purple dashed line. Chikou Span - green line. Bollinger Bands Indicator: 3 yellow lines. MACD indicator: Red line and bar graph with white bars in the indicator window. Support / Resistance Classic Levels: Red and gray dotted lines with price symbols. Pivot Level: Yellow solid line. Volatility Support / Resistance Levels: Gray dotted lines without price designations. Possible price movement options: Red and green arrows. The material has been provided by InstaForex Company - www.instaforex.com |
| Euro could surprise investors in 2020 Posted: 10 Dec 2019 02:50 PM PST According to a number of experts, the euro could surprise traders next year, having demonstrated rather strong dynamics. Experts cite fiscal stimulus in the European Union, increasing criticism of the European Central Bank's negative interest rate policy and potential growth in volatility, which cast doubt on the effectiveness of using EUR as a financing currency for carry trade operations as factors that will strengthen the euro. According to the consensus forecast of economists recently surveyed by Bloomberg, the euro will rise in price against the US dollar to $1.12 by the end of March, and to $ 1.16 by the end of 2020. In particular, Morgan Stanley expects EUR/USD to rise to 1.16 in the first quarter. ABN Amro Bank and Commerzbank expect the euro to rise to $1.14 by the end of March, given the stabilization of the European economy and the disappearance of uncertainty around Brexit. The single European currency will decrease against the US dollar to $1.10 in the next three months, but then will strengthen to $1.15 within 12 months, according to Goldman Sachs. "In the near future, the euro may continue to fall, even if the subsequent main movement involves its strengthening," said Zak Pandl, bank strategist. "The fundamental picture should become more positive for the euro before we see the growth of its exchange rate, but this statistical data has not yet shown. However, given the position, the single currency's next long-term movement is likely to be growth," he added. The expert also noted the significance of the forecast for improving global growth. "If such a forecast turns out to be true, then the strengthening of the euro in relation to its competitors in the Big Ten will be the highlight of next year," said Pandl. Regarding short-term prospects, according to John Hardy, a strategist at Saxo Bank, for the EUR/USD pair, which recently showed antirecords of expected volatility, the outcome of trade negotiations between the US and China may be much more important than the upcoming Federal Reserve and ECB meetings. "The entry into force of US duties on Chinese imports on December 15 will be a negative moment for the euro, since the EU is most dependent on exports to China. From a technical point of view, the first sign of a transition to decline will be a failure below 1.1000, while the bulls really need a confident exit above 1.1180," says J. Hardy. The material has been provided by InstaForex Company - www.instaforex.com |
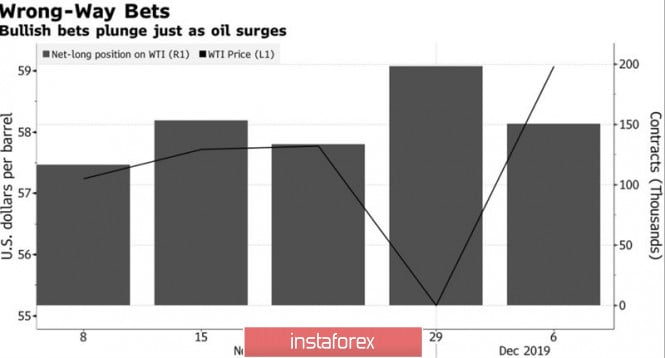
| Posted: 10 Dec 2019 02:50 PM PST The market knows how to punish self-confidence. According to the results of the week, by December 3, speculators reduced their long positions in WTI by 12%, while shorts increased by 46%. Brent net longitude fell 5.3%. Apparently, players expected that OPEC would not be able to give the market what it wants. They were mistaken. Saudi Arabia managed to convince other oil producers of a deeper section than 1.2 million bpd. The cartel and Russia were able to prolong the Vienna agreement in the amount of 1.7 million bpd. Considering the fact that Riyadh is ready to expand it by another 400 thousand bpd individually, the final scale is approaching 2.1 million bpd. This is serious. Oil increased, and speculators realized that they were in a hurry. Dynamics of oil prices and speculative positions by WTI According to Bloomberg's insider, Saudi Arabia has planned its budget for 2020 based on the cost of the North Sea grade at $66 per barrel and is making huge efforts to balance the oil market. Moreover, on the nose of the initial placement of equity securities of the local company Aramco. Riyadh plans to sell a 1.5% stake and raise about $25.6 billion. If everything works out, this IPO will become the largest in the world. The current record holder, the Chinese company Alibaba, which operates in the field of Internet commerce, managed to place $25 billion worth of securities in 2014. 2.1 million bpd is a pretty decent figure in order to balance the market. Shale production in the United States increases by approximately the same amount in 2019, and its growth rate is likely to decline in 2020, which increases the chances of Brent and WTI rallies. Moreover, next year, due to the termination of the trade war between the US and China and the orderly Brexit, global demand may provide support to the bulls on black gold. While Washington and Beijing are trying to create the impression that the negotiations are moving in the right direction, however, whether this is so or not, it will be possible to say on December 15. An agreement is already close if the United States does not raise tariffs by $156 billion in Chinese imports. On the contrary, the increase in duties will raise the likelihood of an escalation of the conflict, which will negatively affect oil. The US dollar should also contribute to determining the future dynamics of Brent and WTI. In 2019, it found support in the inflow of capital to the United States and in the growth of US stock indexes due to a strong economy, the weakening of the Federal Reserve's monetary policy and belief in the end of the trade war. In 2020, political risks will increase in connection with the presidential election in the United States, which will increase the volatility of the S&P 500 and raise the chances of capital outflow from the United States. As a result, the US currency will not feel as confident as it did in 2018-2019, which will support black gold. Technically, Brent quotes going beyond the descending trading channel and the upper boundary of the green triangle creates the prerequisites for continuing the upward campaign in the direction of the target by 88.6% according to the Double Peak pattern. It is located near the mark of $73 per barrel. To implement this scenario, the bulls must hold quotes of the North Sea variety above support by $64.4-64.8. The material has been provided by InstaForex Company - www.instaforex.com |
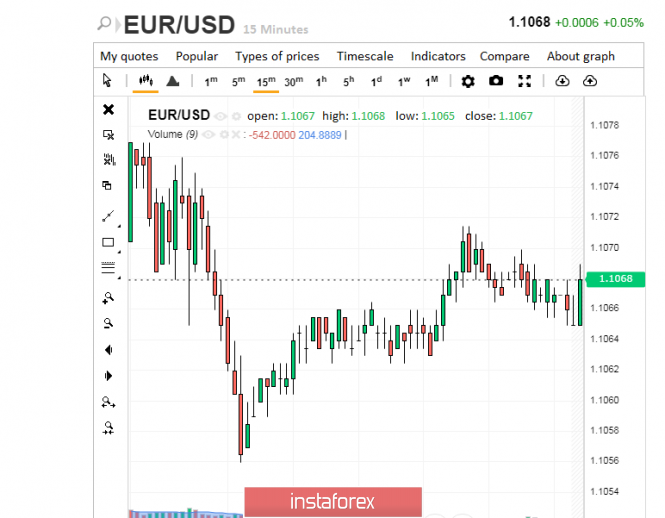
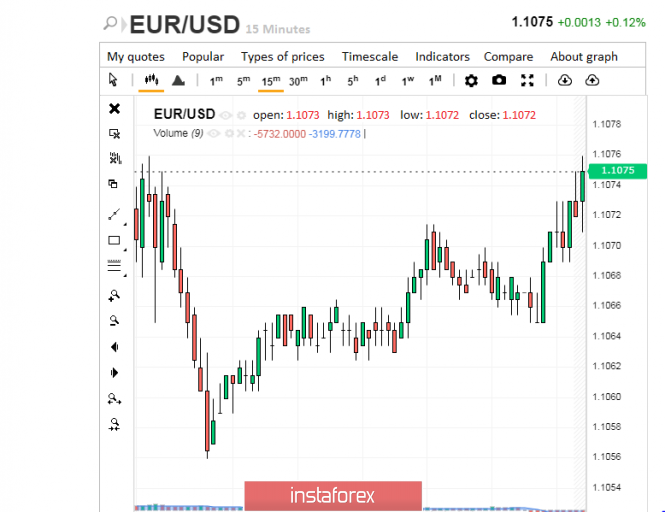
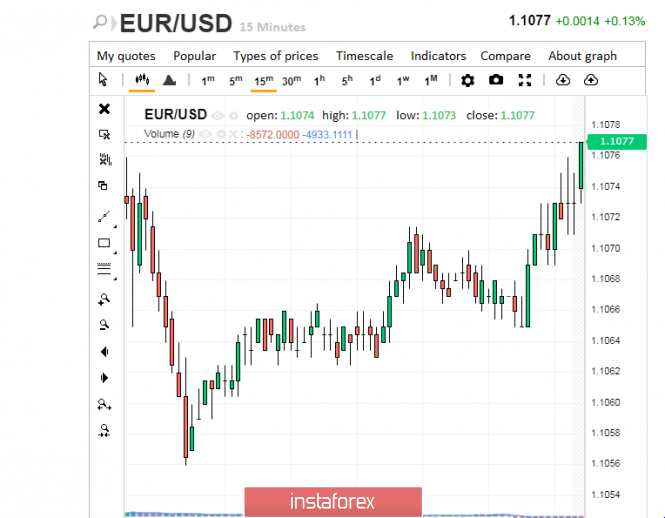
| Euro's enormous efforts: course for recovery Posted: 10 Dec 2019 02:50 PM PST Sometimes, in order to move faster and conquer new peaks, it is necessary to make incredible efforts. According to experts, this thesis is quite relevant with regard to the European currency. The euro has to spend a lot of energy to stay afloat, but the reward is a well-deserved success. Recently, the European currency has lost the lion's share of its victories, but is still trying to maintain its gained position. Pressure on the euro has a high probability of a recession in the German economy, analysts say. Note that Germany is considered the economic locomotive of the eurozone, so its impact on the dynamics of the euro is difficult to overestimate. The German authorities are not able to take drastic measures to improve the situation, so the European currency is experiencing significant difficulties. The dynamics of the single currency has been in a downward trend since June 2018. Experts draw attention to the high risk of a further decline, which could lead to the renewal of the October lows of 2019. Recall that two months ago, the euro fell to 1.0900, the lowest level since the first half of 2017. Currently, the euro is a little perked up and began the morning of Tuesday, December 10, on the positive. The EUR/USD pair reached the level of 1.1068 and moved up. After a while, the pair rose to 1.1075, showing an upward trend. The EUR/USD pair still runs in the range of 1.1074–1.1075, trying to overcome these boundaries. The pair rose to the level of 1.1077, but retreated afterwards. It proved to be difficult for the pair to gain a foothold at these lines. Analysts are focusing on a number of factors that could support the euro. These include the recovery of the eurozone economy, the high likelihood of the implementation of the "soft" Brexit, as well as the weakening of trade tension between the US and China. Another important incentive for the euro can be the status of a key funding currency. This was facilitated by the drop in the volatility of the euro to extremely low levels, due to which it can be used for carry trade operations. Most large banks, including ABN Amro, Commerzbank and Morgan Stanley, forecast a rise in the euro to $1.1400– $1.1600 in 2020. Despite the current decline and incredible pressure, the euro seeks to strengthen its position. Experts predict that the euro will collapse, but do not discount its strength and stability. The market expects an early recovery of the second global currency, and it seeks to meet these expectations. The material has been provided by InstaForex Company - www.instaforex.com |
| GBP/USD: pound still has room for growth before the election, and then everything is not so simple Posted: 10 Dec 2019 02:50 PM PST GBP/USD rose to seven-month highs amid increasing chances of the Conservative Party winning early Parliament elections in the UK on December 12. According to recent polls, Tory's separation from Labour rose by more than 10% compared with 9% a week ago. "The bullish movement of quotes shows: market participants are more and more confident that Conservatives can get a majority on Thursday. However, as soon as the initial euphoria disappears, it will be more difficult for the pound to continue its growth in 2020," MUFG experts say. They do not exclude the possibility that British Prime Minister Boris Johnson will need an extension of the Brexit transition period, which expires at the end of next year, which will open the door for the country to leave the EU without a trade agreement. "The current pound exchange rate implies the belief that Brexit will really happen and some kind of trade deal will be closed in 2020. However, uncertain times may still come, even if Thursday's result brings some temporary relief from the majority of the ruling Conservative Party (as polls show)," said Michael Metcalfe of State Street Global Markets. The GBP/USD pair reached its highest level since May, rising to 1.3180 on Monday. "The pound may continue to rise against the US dollar on Tuesday if the Conservatives strengthen their leadership over the Labour Party following the publication of a YouGov poll," BMO Capital Markets believes. Today, YouGov will unveil its second and final multilevel regression and post-stratification survey, which successfully predicted the 2017 election results. "If the gap between Conservatives and Labour is 11% or more, we expect continued growth of GBP/USD," said BMO strategist Stephen Gallo. "The pound is now trading with a clear preference for Conservative victory in the upcoming elections, but this outcome is far from certain," RBC Capital Markets warned. "There are several serious uncertainties, namely: voter turnout (especially among younger voters), potential tactical voting, and a large proportion of voters who are still undecided in the polls that polls still reveal. The pound's last jump, which would entail the victory of the Conservatives, is likely to mark the British reaching a local peak, as markets will move on to other Brexit risks," said RBC expert Adam Cole. According to Matthew Cady of Brooks Macdonald, any rebound in the pound, stocks and UK government bond yields amid the Conservative Party gaining most seats in the House of Commons in the December 12 elections will only be a short-term relief. "The attention of the markets will quickly return to uncertainty regarding the ability of Great Britain to agree on new trade relations with the EU. They will be allotted only 11 months after the expiration of the Brexit deadline on January 31, when the transition agreement agreed by Johnson and the EU comes into force," the analyst said. "The United Kingdom may face another deadline, now December 31, 2020, and there is a risk of a return to WTO rules with the EU if by the end of next year the issue of maintaining the country's membership in the trade union is not resolved or new trade agreements appear" - he added. The material has been provided by InstaForex Company - www.instaforex.com |
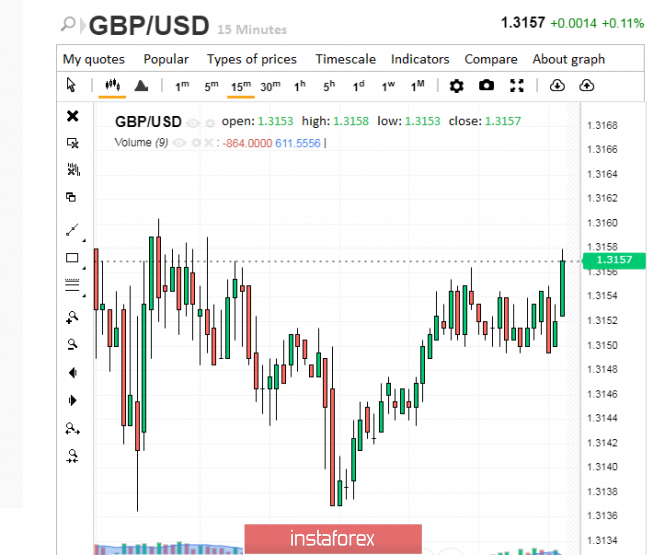
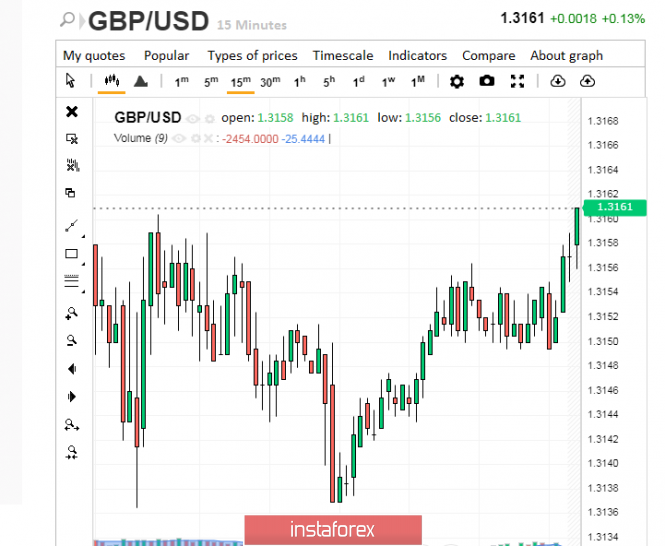
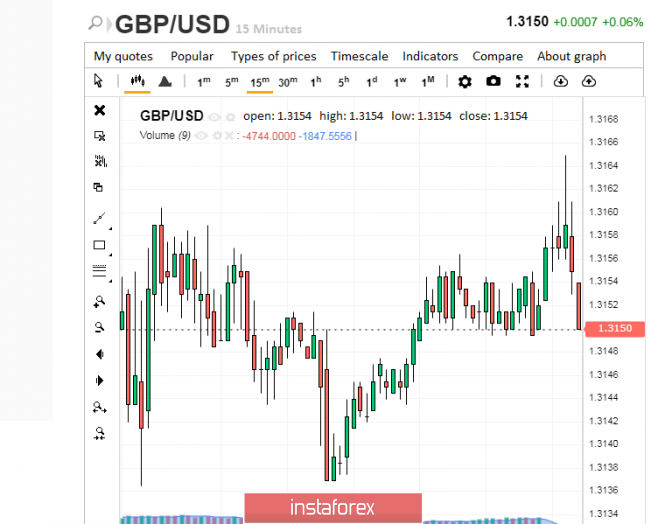
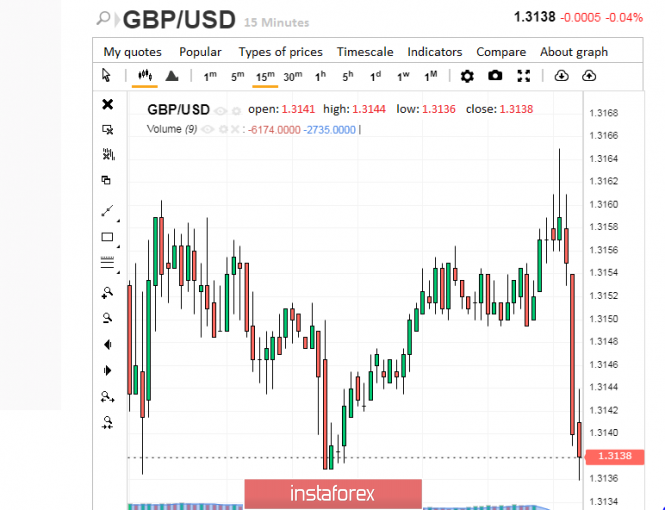
| Pound summersaults: outrageous volatility and Death Cross Posted: 10 Dec 2019 02:50 PM PST This week promises the British currency with strong price fluctuations associated with the upcoming elections. Analysts estimate the pound as the most volatile instrument of the month, but after the end of the election in the UK its dynamics will return to a calmer course. The market is closely monitoring both the political background of the Great Britain and the sterling's balance. Recall that this Thursday, December 12, early parliamentary elections will be held in the UK, which will decide the fate of the pound and determine the vector of movement of the country. According to recent polls, the Conservative Party, led by Prime Minister Boris Johnson, still has a significant advantage. Experts are certain that the victory of the ruling party will put an end to the three-year confrontation regarding the conditions for Britain to leave the European Union. The lion's share of the votes cast for the Conservative Party will help form a parliamentary majority. If this scenario is realized, the UK will be able to leave the euro bloc on January 31, 2020. If Labour won, the question with Brexit will remain open. Experts do not rule out a new referendum in this situation, as well as increased uncertainty in the country. Nevertheless, many market participants believe in the victory of Conservatives. The positive mood is facilitated by the recovery dynamics of the British stock market and the national currency. A fly in the ointment can only be found when a Death Cross is formed in relation to the GBP/EUR pair. Experts do not exclude that in the next three months, sterling will rise in price by 2% against the euro. Recall that on Monday, December 9, the British currency in the GBP/EUR pair significantly strengthened, updating highs over the last 2.5 years. However, sterling later went negative. As a result, the Death Cross was formed. According to experts, this happened for the fourth time in ten years. However, the main attention of analysts is focused on the current bullish rally of the GBP/USD pair, which may last up to the resistance level of 1.3370. Note that yesterday the British currency rose in relation to the greenback by 0.3%, to 1.3181. Over the current month, the pound strengthened by 3% against the greenback amid confidence in Johnson's victory in the upcoming elections. The GBP/USD pair started at 1.3157 on Tuesday, December 10, showing a tendency to increase. The pair increased after a while, near the levels of 1.3159–1.3161. Subsequently, the GBP/USD pair tried to get out of this range, but these efforts did not lead to anything. The pair then slumped to the next lows. The GBP/USD pair traded at low positions, in the range of 1.3150–1.3151. At the same time, it seeks to get out of this range, however, these attempts have not yet been crowned with success. Moreover, the GBP/USD pair went to an extraordinary depth, almost feeling the bottom. The pair has fallen to levels 1.3136-1.3138, and is now trying to recover. The pound's position remains unstable this week, but is trying hard to stay afloat. The fluctuation of the British currency is demonstrated by various somersaults, which confuses the market. Experts believe that the sterling will be able to overcome the attraction of volatility by gathering strength before the start of the election campaign. Analysts count on its stability even in the event that election results are not that positive. The material has been provided by InstaForex Company - www.instaforex.com |
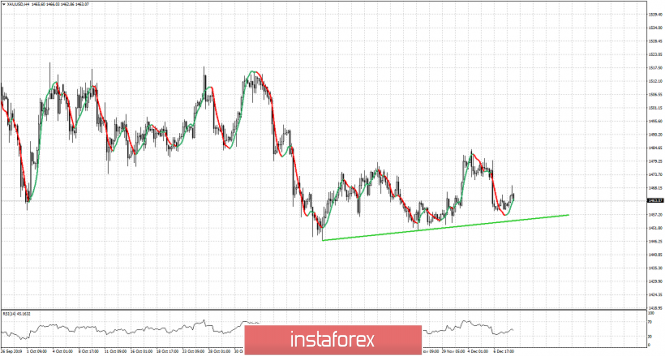
| Short-term technical analysis on Gold Posted: 10 Dec 2019 09:08 AM PST Gold price has pulled back towards $1,460 after reaching the major resistance area around $1,490. Gold is now testing for the third time the important support area of $1,450-60. It is very important for bulls to hold this level otherwise the road to $1,410 will be open wide.
Gold price so far has respected the $1,450-60 support area. Price has visited this level more than two times since early November and none has lead to a break down. It is important for bulls to respect this level and hold above it. However holding above this level is not enough. Gold bulls will need to recapture $1,490-$1,500. The longer it takes to recapture $1,490-$1,500 the higher the chances to break below $1,450-60 support. Next downside target would be around $1,410 if support fails to hold. So keep a close eye on this. The material has been provided by InstaForex Company - www.instaforex.com |
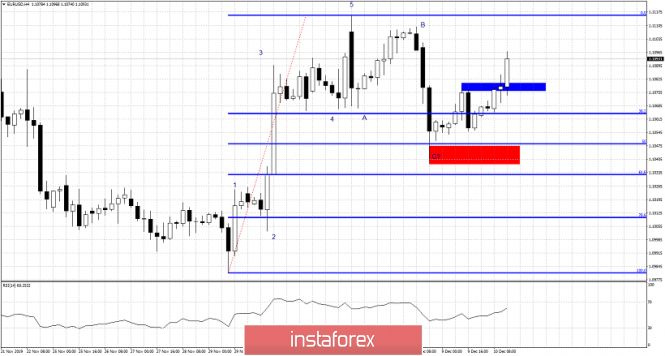
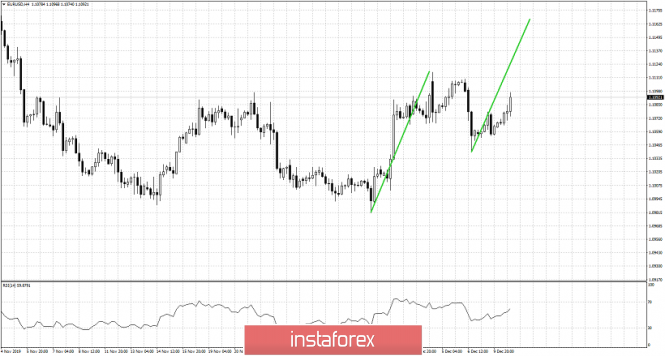
| Short-term Elliott wave analysis on EURUSD Posted: 10 Dec 2019 08:58 AM PST EURUSD has most probably finished its pull back and corrective move at the 1.1039 where we expected wave C to end. Price is now bouncing higher breaking short-term resistance. Recapturing 1.11 is key for moving higher towards our next target of 1.1160.
Red rectangle- short-term support EURUSD is trading near 1.11 as price has broken short-term resistance. After a 5 wave upward movement and a three wave pull back, we expect price to start another 5 wave impulsive move higher breaking above recent highs.
Green lines - equal size upward move EURUSD is expected to move towards 1.1160 as long as price is above 1.1055. We expect price to move in equal size to the first leg higher targeting 1.1160 area. Short-term trend remains bullish as price continues to make higher highs and higher lows. The material has been provided by InstaForex Company - www.instaforex.com |
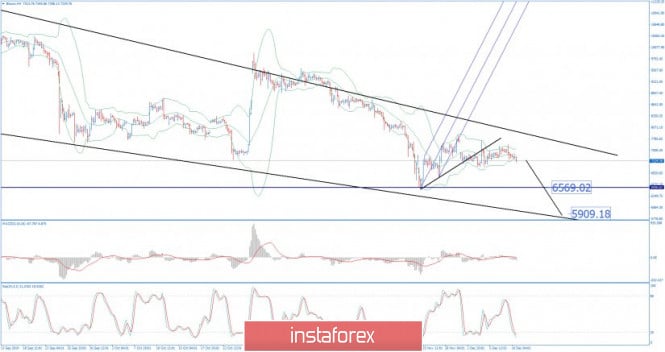
| BTC 12.10.2019 - Down cycle in the play, downward target set at the price of $6.570 Posted: 10 Dec 2019 08:36 AM PST Industry news: China's inflation rate has jumped to 4.5 percent for the month of November — highlighting the value proposition of deflationary currencies, like Bitcoin. China is notoriously hostile to cryptocurrencies, despite its government's commitment to blockchain. However, it's recent runaway inflation rate might force those in the country to see the other side of things. As market analyst Mati Greenspan recently tweeted, China's inflation rate has been steadily rising. In the month of November, it saw a spike of 4.5 percent — with no indication that it will cease. Considering that China is the world's second-largest economy, this is cause for worry. Technical analysis:
BTC is trading in consolidation at the price of $7.227 Anyway, there is chance for further downside and I expect down cycle with potential for test of $6.570 and $5.900. MACD and Stochastic oscillators are showing increase on the downside, which is confirmation for the sellers in control. Resistance levels are seen at $7.622 and $8.000. Main support level is set $6.570 and $5.900. The material has been provided by InstaForex Company - www.instaforex.com |
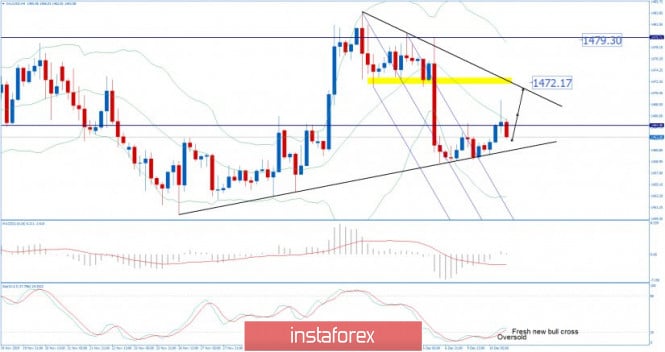
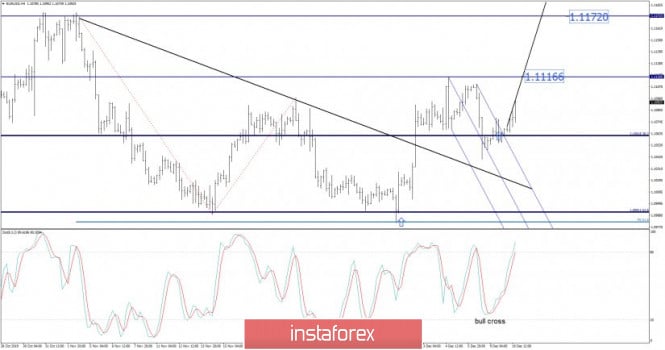
| Gold 12.10.2019 - Potential for the upward cycle Posted: 10 Dec 2019 08:24 AM PST EUR/USD has been trading upwards, exactly what I expected yesterday . EUR/USD is heading towards our first upward target at the price of 1.1116 and potential second upward target at 1.1172.
Stochastic oscillator is showing increase on the upside momentum, which is good sign that buyers are in control and that buying on the dips is preferable strategy for today Resistance levels are seen at 1.1116 and 1.1172. Main support level is set at the price of 1.1041. The material has been provided by InstaForex Company - www.instaforex.com |
| Posted: 10 Dec 2019 08:19 AM PST EUR/USD has been trading upwards, exactly what I expected yesterday . EUR/USD is heading towards our first upward target at the price of 1.1116 and potential second upward target at 1.1172.
Stochastic oscillator is showing increase on the upside momentum, which is good sign that buyers are in control and that buying on the dips is preferable strategy for today Resistance levels are seen at 1.1116 and 1.1172. Main support level is set at the price of 1.1041. The material has been provided by InstaForex Company - www.instaforex.com |
| December 10, 2019 : EUR/USD Intraday technical analysis and trade recommendations. Posted: 10 Dec 2019 07:38 AM PST
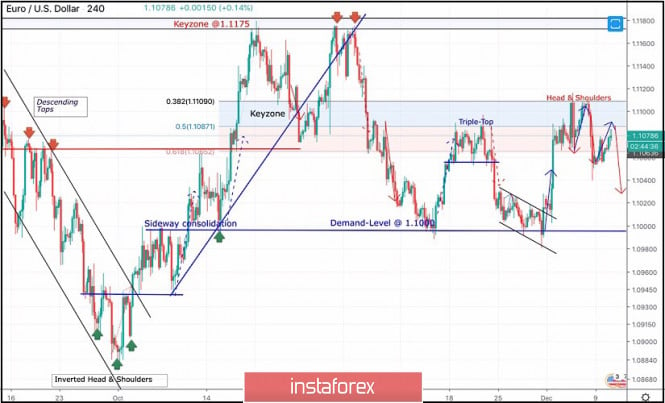
Since October 2, the EURUSD pair has been trending-up until October 21 when the pair hit the price level of 1.1175. The price zone of (1.1175 - 1.1190) stood as a significant SUPPLY-Zone that demonstrated bearish rejection for two consecutive times in a short-period. Hence, a long-term Double-Top pattern was demonstrated with neckline located around 1.1075-1.1090 offering valid bearish positions few weeks ago. Shortly After, two consecutive bearish movements were executed towards 1.1000-1.0995 where another two episodes of bullish rejection were demonstrated. That's why, the price zone of 1.1065-1.1085 where a cluster of supply levels were located (61.8% Fibo - 50% Fibo levels) prevented further bullish advancement. Thus, the EUR/USD Pair has been trapped between the price levels of 1.1000 and 1.1085 (where a cluster of supply levels is located) until Wednesday when a bullish spike was demonstrated above 1.1085 (towards 1.1110). Initial bearish rejection was anticipated around 1.1110 to bring bearish decline towards 1.1065. Moreover, atypical Head & Shoulders reversal pattern is being demonstrated with neckline located around 1.1065. That's why, bearish persistence below 1.1065 is needed to validate this reversal pattern. Bearish projection target to be located around 1.1010. On the other hand, Earlier this week, recent signs of bullish recovery were manifested around 1.1040 allowing the current bullish pullback to occur towards 1.1085 once again. Trade recommendations : The current bullish pullback towards the price zone around (1.1085) should be considered for a valid SELL entry. Initial T/P levels to be projected towards 1.1045 and 1.1000, while S/L should be placed above 1.1115. Any bullish breakout above 1.1110 will probably bring further bullish advancement towards 1.1140 and 1.1175. The material has been provided by InstaForex Company - www.instaforex.com |
| December 10, 2019 : GBP/USD Intraday technical analysis and trade recommendations. Posted: 10 Dec 2019 07:36 AM PST
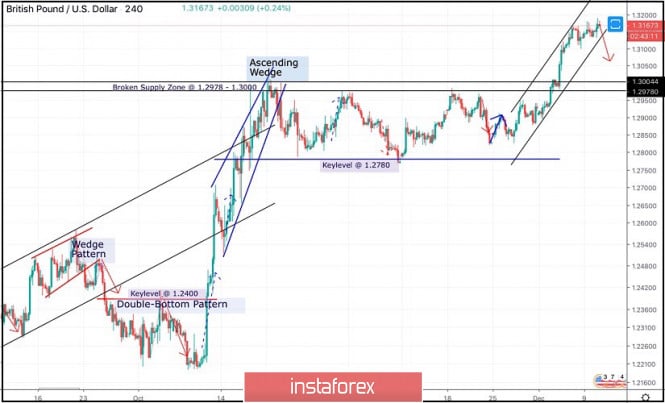
On October 21, the GBP/USD pair was demonstrating an ascending wedge reversal pattern while approaching the depicted SUPPLY-zone (1.2980-1.3000). Since Then, the GBP/USD pair has failed to achieve a persistent bullish breakout above the depicted SUPPLY-zone (1.2980-1.3000) which corresponds to a previous Prominent-TOP that goes back to May 2019. This indicated a high probability of bearish reversal around the mentioned price zone. Hence, a quick bearish movement was initiated towards 1.2780 (Key-Level) where bullish recovery was demonstrated on two consecutive visits. That's why, the GBP/USD pair has been trapped between the mentioned price levels (1.2780-1.3000) until Wednesday when bullish breakout above 1.3000 was achieved. Short-term technical outlook remains bullish as long as consolidations are maintained above 1.3000 on the H4 chart. On the other hand, the pair was recently testing the upper limit of the newly-established depicted short-term bullish channel around 1.3165. Moreover, a triple-top pattern is being established around the same price level with neckline located around 1.3100. That's why, high probability of bearish reversal exists around the current price levels. Bearish closure below 1.3100 (neckline) is needed to enhance further bearish decline towards 1.2980 where bullish recovery may be anticipated. Trade Recommendations: Risky traders can have a valid SELL entry upon bearish closure below 1.3100. T/P level to be located around 1.2980. On the other hand, conservative traders should wait for a bearish pullback towards 1.2980-1.3000 for a valid BUY signal with bullish target around 1.3120 and 1.3150. The material has been provided by InstaForex Company - www.instaforex.com |
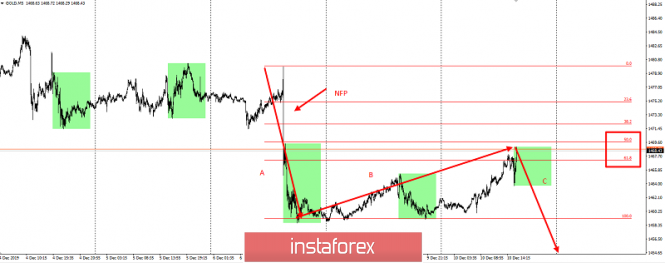
| Trading idea for gold for the American session Posted: 10 Dec 2019 06:23 AM PST Good day, dear traders! I present to your attention a trading idea for gold. So, as I wrote, trading on the eve of strong news is a very dangerous occupation. But I know that many traders are already in positions and I have some recommendations for them. Gold, as you know, is a very volatile instrument, and to catch a good move on gold is a great success. But after the good news on the dollar, gold is quite "obedient" and it can be traded. If we rely on the initiative of "Non-farms", now gold is at the end of the formation of the second - rollback wave "B" of the classical structure "ABC". The pullback from wave "A" has already amounted to almost 50% - the ideal pullback level for correction In this regard, I recommend to look closely at the sales, but it is better to do it with confirming signals of small timeframes within your vehicle.
The potential for reduction is more than 1000p for 5 digits, with risks of 200-300 - this is quite worthy of attention. The material has been provided by InstaForex Company - www.instaforex.com |
| Evening review for EURUSD for 12/10/2019 Posted: 10 Dec 2019 05:55 AM PST
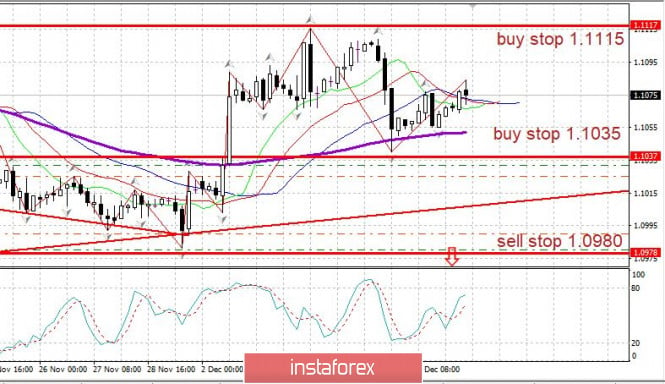
The market is tired of waiting and now there was a day left until the main days of December 11 and 12. The first big event is the Fed tomorrow, December 11th. Fed Chairman Powell is rumored to be more inclined toward another Fed rate cut. At the last meeting, the Fed clearly said that it believes monetary policy is balanced, thus, the rate cut should be stopped. However, Donald Trump harshly attacked the Fed again, demanding policy easing and rate cuts. The US dollar is quite expensive at the moment and this negates all of Trump's efforts in a trade war with China. Therefore, rumors say that the Fed may still cut the rate by 0.25%. Inflation in the US remains very moderate. Apart from high stock prices, there are no other signs of an overheating economy. EURUSD: We keep purchases from 1.1035, stop at 1.0990. In the case of a full reversal down, we sell from 1.0980. The material has been provided by InstaForex Company - www.instaforex.com |
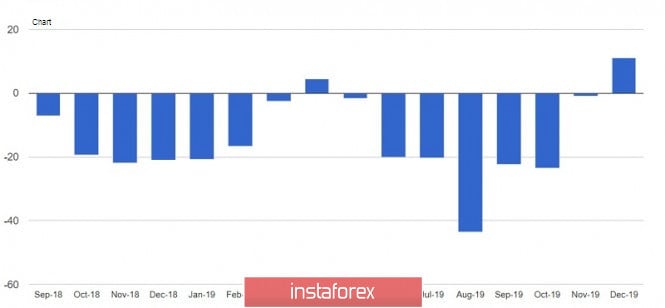
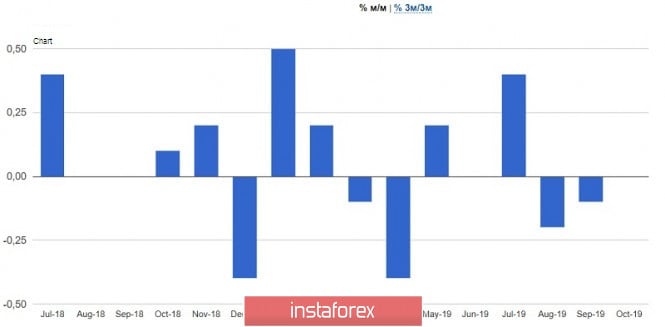
| Posted: 10 Dec 2019 05:13 AM PST The euro managed to strengthen some positions against the US dollar after the release of reports indicating a small growth in the European economy. Especially pleased with the data on industrial production in France, which showed the recovery of the industry after the recession in the 3rd quarter. According to a report by Insee, National Bureau of Statistics of France, industrial production in October this year increased by 0.4% compared to the previous month. However, it is not necessary to say that the growth may continue in the coming months, as recent data on surveys of companies give a lot of conflicting signals. Data on the index of economic expectations in Germany also managed to please buyers of risky assets. According to a report by the ZEW research center, the index of economic expectations in December 2019 rose to 10.7 points from -2.1 points in November of this year, while economists predicted that the index will be -0.1 points in December. ZEW economists note that such a strong increase in the index is directly related to the expectation of an increase in exports and growth in personal consumption in Germany. The current economic conditions index also rose to -19.9 points against -24.7 points in November, with an economist forecast of -22.3 points. As for the index of sentiment in the business environment of the eurozone from the ZEW Institute, it also showed growth, indicating the restoration of confidence in the company. According to the report, sentiment in the business environment rose to 11.2 points in December against -1.0 points in November this year, with the forecast growth to 2.2 points. Data on the US economy in the sphere of small business also indicated an increase in optimism, but this did not lead to significant demand for the US dollar. The report indicated that the index of small business optimism in the United States in November of this year rose because the investment of companies remained at a high level, as well as the growth of hiring new workers and wages. According to the National Federation of Independent Business, the NFIB small business optimism index rose to 104.7 points in November from 102.4 points in October. As for the technical picture of the EURUSD pair, the bulls continue to struggle for the resistance of 1.1070. Only the breakdown of this range will strengthen the demand for risky assets and return the trading instrument to the highs of last week in the area of 1.1115 and 1.1160. If the pressure on risk assets continues, the breakout of 1.1050 support will lead to a further downward correction in the area of 1.1000 and 1.0960 lows. GBPUSD The pound completely ignored the data on the UK economy, focusing on the new results of opinion polls and elections, which will begin in just a few days. According to the data, the UK GDP in October this year did not change compared to September, while the previous two months saw a contraction of the economy. Given these figures, we can say that the UK is close to a technical recession, although this month it was avoided. From August to October this year, compared to the same period in 2018, growth was also zero, and on an annual basis, the economy grew by only 0.2%. All attention is now shifted to the elections that will be held this Thursday and as a result of which a new government will be formed. Most likely, Boris Johnson will retain the post of Prime Minister and lead a conservative government, however, for a real solution to the impasse with Brexit, conservatives need a majority in parliament. As for the technical picture of the GBPUSD pair, the situation before the elections in the UK is unlikely to change significantly. The bulls all stormed the level of 1.3175, but each time they are met with active resistance by the sellers. There is also profit-taking on long positions with each unsuccessful growth above the range of 1.3170. It is likely that before the election itself, there may be a downward correction in GBPUSD, which will be stopped by the large support levels of 1.3090 and 1.3000. The material has been provided by InstaForex Company - www.instaforex.com |
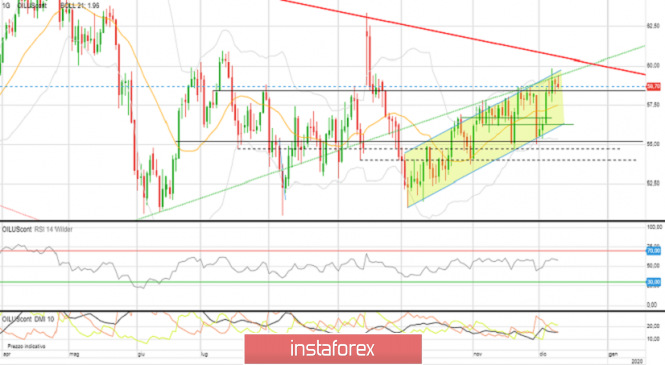
| Crude Oil 10/12 trading levels before inventories data Posted: 10 Dec 2019 04:39 AM PST Crude Oil completely recovered from the November 29th hard drop and is now trading at 2-month highs that is $58.70 right now. The rising channel proved to be still a valid risk level provider and the price has once again gone to test the upper border (6th Dec) at the level that happens to be also the retest of an older trendline starting in Dec 2018. Chart LT
WATCH OUT carefully the area between 58.10 / 58.50: if clearly broken, we have room for the 1st target at 57.50, than 56.70; finally the lower bound of the channel, 56.20 Risk to the upside is the retest of the broken black line at 59, than eventually 59.50 and highs close to 59.80 Trading Oil with tight stops is not always a good idea, manage your volumes instead. Stay safe The material has been provided by InstaForex Company - www.instaforex.com |
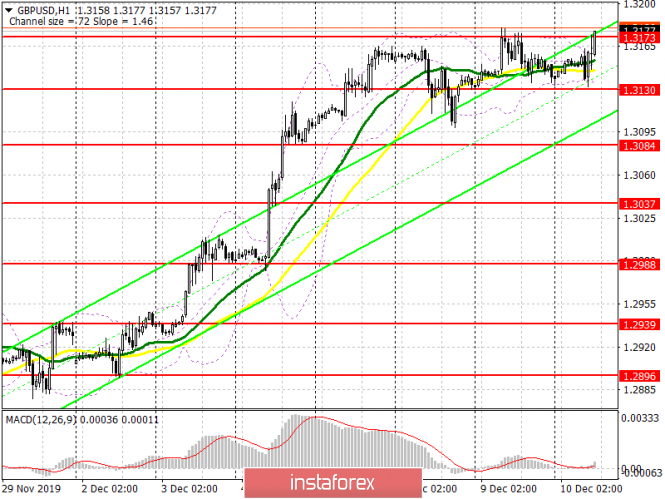
| Posted: 10 Dec 2019 03:45 AM PST To open long positions on GBPUSD, you need: In the first half of the day, there were reports on the state of the UK economy, which showed no changes in October this year compared to September, where there was a growth of only 0.1%. The lack of growth points to problems primarily related to Brexit. However, the buyers of the pound were almost embarrassed. As noted in the morning forecast, the formation of a false breakout at 1.3130 led to new purchases, and now the bulls are trying to break above the resistance of 1.3173, which may trigger a new wave of purchases before the important elections in the UK, which will be held later this week. Consolidation above 1.3173 will open a direct road to the area of highs of 1.3227 and 1.3265, where I recommend taking the profits. Important opinion polls may also be published today. If they point to a decline in the leadership of the UK Conservative Party, the pressure on the pound could intensify. In this case, it is best to open new long positions only after the decline to the lows of 1.3084 and 1.3037. To open short positions on GBPUSD, you need: In the first half of the day, the bears coped with the morning task and reached the support of 1.3130, but they did not have enough strength to continue the downward correction. At the moment, it is necessary to keep the resistance at 1.3173, as its breakdown will lead to the demolition of stop orders and the continuation of the bullish trend. In this scenario, it is best to open short positions only after the highs of 1.3227 and 1.3265 have been updated. If the bears manage to regain the market's location after weak opinion polls, or after good data on the American economy, only a breakthrough in support of 1.3130 will increase the pressure on GBP/USD, which will lead to a downward correction in the area of lows of 1.3084 and 1.3037, where I recommend taking the profits. Indicator signals: Moving Averages Trading is above the 30 and 50 daily averages, indicating an upward trend. Bollinger Bands If the pound falls, the lower border of the indicator around 1.3130 will provide support. Breaking the upper limit of the indicator in the area of 1.3175 will strengthen the demand for the pound.
Description of indicators
|
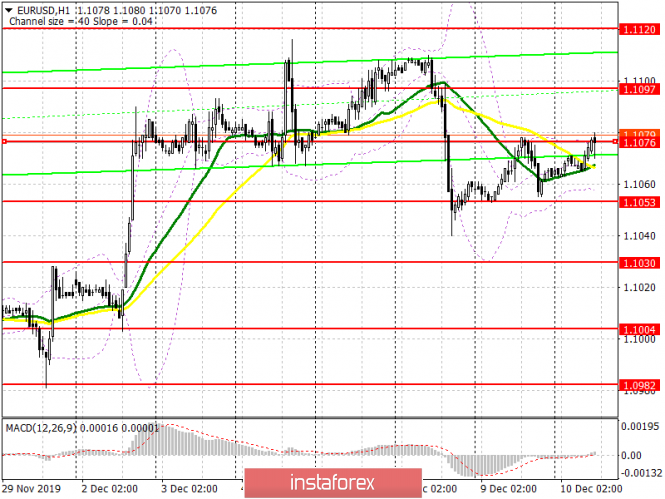
| Posted: 10 Dec 2019 03:26 AM PST To open long positions on EURUSD, you need: In the first half of the day, there was a good report on the index of sentiment in the business environment of the eurozone, which grew and was much higher than economists' forecasts, which supported the European currency, which still cannot break above the resistance of 1.1076. The task of buyers for the second half of the day is still the same return to the resistance level of 1.1076 since it depends on it whether the upward movement will continue or not. If the bulls fail to do this in the afternoon, and the calculation will be made on weak macroeconomic statistics on the American economy, then it is best to postpone purchases until a false breakdown is formed in the support area of 1.1053, but buying EUR/USD for a rebound is better only from a minimum of 1.1030. The breakout and consolidation of the euro above the resistance of 1.1076 will lead to a larger upward correction and the return of the pair to the highs of 1.1097 and 1.1120, where I recommend taking the profits. To open short positions on EURUSD, you need: Bears formed a false breakout in the resistance area of 1.1076, but this did not lead to a major sell-off of the euro. Perhaps, as yesterday, sellers are waiting for statistics on the American economy and will act based on the new reports. While trading is below the range of 1.1076, you can expect a further decline in EUR/USD to the support area of 1.1053. However, only its breakdown will increase the pressure on the pair and allow sellers to reach the lows of 1.1030 and 1.1004, where I recommend fixing the profits. If the bears miss the level of 1.1076 in the second half of the day, and this will happen only if the weak fundamental statistics for the United States are released, it is best to open short positions only after the resistance update of 1.1097 or sell the euro from there immediately to rebound from the maximum of 1.1114. Indicator signals: Moving Averages Trading is conducted around 30 and 50 moving averages, which indicates the persistence of market uncertainty. Bollinger Bands In the case of a downward correction in the second half of the day, the lower border of the indicator around 1.1053 will provide support.
Description of indicators
|
| You are subscribed to email updates from Forex analysis review. To stop receiving these emails, you may unsubscribe now. | Email delivery powered by Google |
| Google, 1600 Amphitheatre Parkway, Mountain View, CA 94043, United States | |





No comments:
Post a Comment