Forex analysis review |
- Comprehensive analysis of movement options of #USDX vs EUR/USD vs GBP/USD vs USD/JPY for December 4
- GBP/USD. December 3. Results of the day. Trump: I'm a major Brexit fan. Tories walk along the blade of a knife ahead of elections
- EUR/USD. December 3. Results of the day. Donald Trump continues to bluff in negotiations over a deal with Beijing
- Oil kings can do everything?
- Euro: growth did not last long, the fall is already looming
- Foreign exchange markets are becoming a battleground, while the race for monetary easing is not over
- Australian dollar is back on the line
- GBPUSD weekly bullish flag
- EURUSD is consolidating
- USDJPY bearish pattern is being activated
- Gold reaches second upside target of $1,480.
- GBP/USD: policy still keeps the pound in good shape
- BTC 12.03.2019 - Broken bearish flag in the overall downward trend
- GBP/USD 12.03.2019 - The breakout of the 1-month long symmetrical triangle to the upside, strong potential for test 1.3167
- GBP/USD: plan for the US session on December 3. Pound expected continued growth
- EUR/USD: plan for the US session on December 3. Bulls take their time in the market, as inflation in the eurozone is not
- Gold 12.03.2019 - Gold is near my upward target at $1.479, bullish movementum still present
- Evening review of EURUSD on 12/03/2019
- December 3, 2019 : GBP/USD Intraday technical analysis and trade recommendations.
- December 3, 2019 : EUR/USD is testing a cluster of supply levels around 1.1085 where bearish rejection is anticipated.
- Analysis and forecast for EUR/USD on December 3, 2019
- Technical analysis of EUR/USD for December 03, 2019
- EUR/USD. December 3. Market focus on Christine Lagarde's "fundamental valuation" and Donald Trump's duties
- GBP/USD. December 3. The visit of Donald Trump to the UK could harm the conservatives
- Ford - the company of cars of the future!
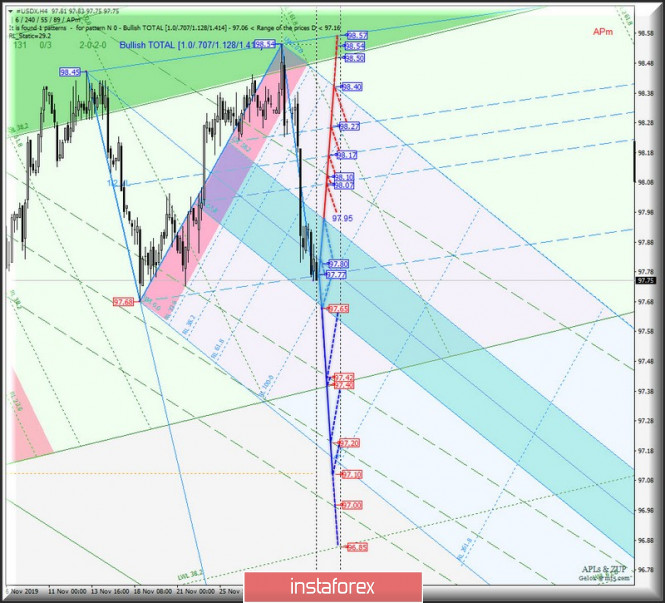
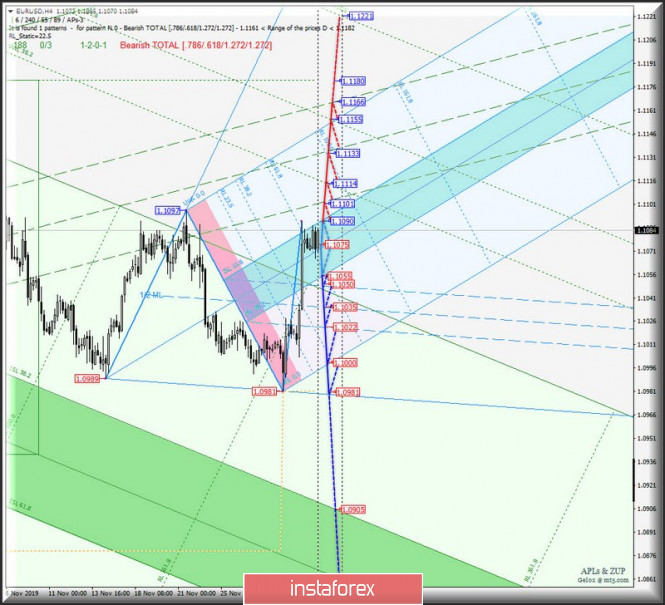
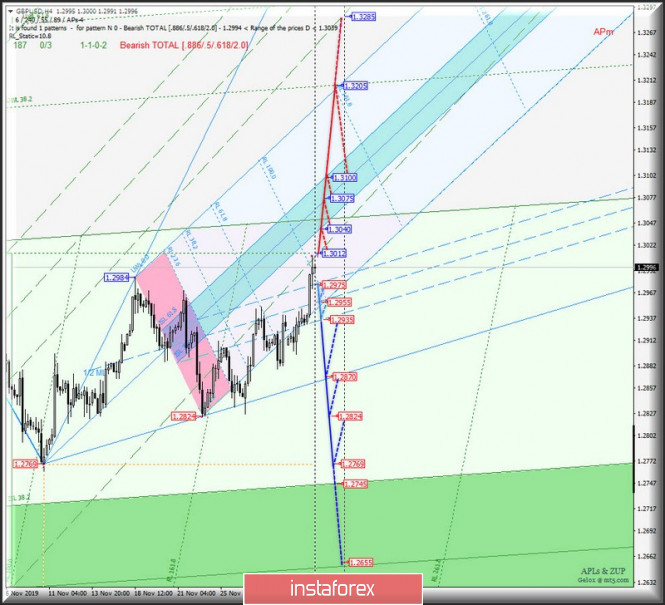
| Comprehensive analysis of movement options of #USDX vs EUR/USD vs GBP/USD vs USD/JPY for December 4 Posted: 03 Dec 2019 06:46 PM PST Minuette operational scale forks (H4) The movement of instruments required a correction in the markup. Now, we are looking at the updated comprehensive analysis of #USDX, EUR/USD, GBP/USD and USD/JPY for December 04, 2019. ____________________ US dollar index From December 04, 2019, the development of the movement of the dollar index #USDX will be determined by the development and direction of the breakdown of the boundaries of the equilibrium zone (97.95 - 97.80 - 97.65) of the Minuette operational scale forks. The markup of the options for this movement is presented on the animated chart. The breakdown of the lower boundary of ISL61.8 of the equilibrium zone of the Minuette operational scale forks (support level of 97.65) - will determine the continuation of the downward movement of #USDX to the boundaries of the 1/2 Median Line channel (97.42 - 97.20 - 97.00) of the Minuette operational scale forks. On the contrary, the breakdown of the resistance level of 97.95 at the upper boundary of the ISL38.2 equilibrium zone of the Minuette operational scale forks is an option for the development of the movement of the dollar index to the boundaries of 1/2 Median Line Minuette channel (98.07 - 98.17 - 98.27). The details of the #USDX movement are presented on the animated chart. ____________________ Euro vs US dollar Starting from December 4, 2019, the movement of the single European currency/US dollar (EUR/USD) will also be determined by the development and direction of the breakdown of the equilibrium zone (1.1090 - 1.1075 - 1.1055) of the Minuette operational scale forks. Details of the movement of the indicated levels are presented on the animated chart. The breakdown of the upper boundary of ISL61.8 of the equilibrium zone of the Minuette operational scale forks (resistance level of 1.1090) will direct the movement of EUR / USD to the boundaries of the 1/2 Median Line channel (1.1101 - 1.1133 - 1.1166) of the Minuette operational scale forks. Alternatively, the breakdown of the lower boundary ISL38.2 (support level of 1.1055) of the equilibrium zone of the Minuette operational scale forks together with the breakdown of the support level of 1.1050, will determine the development of the movement of the single European currency in the 1/2 Median Line Minuette channel (1.1050 - 1.1035 - 1.1022) with the prospect of reaching the SSL start line Minuette (1.1000) and updating the local minimum 1.0981. The details of the EUR/USD movement options are shown on the animated chart. ____________________ Great Britain pound vs US dollar On the other hand, the development of Great Britain pound/US dollar (GBP/USD) currency movement from December 4, 2019 will depend on the development and direction of the breakdown of the range :
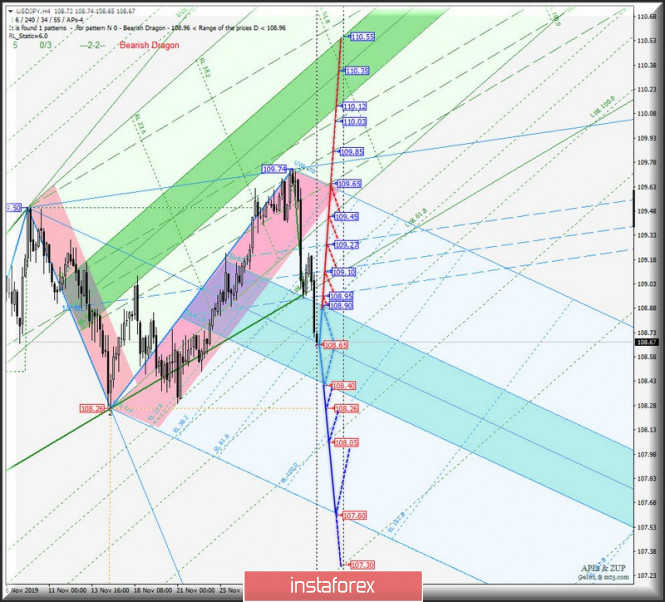
The breakdown of the final Schiff Line (resistance level of 1.3012) of the Minuette operational scale forks will make it possible for Her Majesty's currency to reach the boundaries of the equilibrium zone (1.3040 - 1.3075 - 1.3100) of the Minuette operational scale forks with the prospect of reaching the FSL Minuette final line (1.3205). Meanwhile, the breakdown of the support level of 1.2975 will return the development of the GBP / USD movement to the 1/2 Median Line channel (1.2975 - 1.2955 - 1.2935) of the Minuette operational scale forks, and if the lower boundary of 1.2935 of this channel is broken, then the downward movement of this currency instrument can continue to the targets: control line LTL Minuette (1.2870) - minimums (1.2824 - 1.2759). The details of the GBP / USD movement options are shown on the animated chart. ____________________ US Dollar vs Japanese Yen Similarly, the movement of the currency of the "land of the rising sun" USD / JPY from December 4, 2019 will be determined by the development and direction of the breakdown of the boundaries of the channel of the equilibrium zone (108.90 - 108.65 - 108.40)of the Minuette operational scale forks. We look at the options for working out these levels animated chart. The breakdown of the lower boundary ISL61.8 (support level of 108.90) of the equilibrium zone of the Minuette operational scale forks, will lead to the continuation of the downward movement of USD / JPY to the local minimum of 108.26, and when it is updated, it will become possible to reach the price of the warning line tool LWL161.8 (108.05) of the Minuette operational scale forks and the end line of the FSL Minuette (107.60). In contrast, the breakdown of the upper boundary of ISL38.2 (resistance level of 108.90) of the equilibrium zone of the Minuette operational scale forks with subsequent breakdown of the resistance level 108.95 will determine the development of the currency movement of the "land of the rising sun" in 1/2 Median Line Minuette channel (108.95 - 109.10 - 109.27) with the prospect of reaching the initial SSL line (109.45) and the lower boundary of the 1/2 Median Line channel (109.65) of the Minuette operational scale forks, after the breakdown of the upper boundary of 1/2 ML Minuette channel - 109.27. We look at the details of the USD / JPY movement on the animated chart. ____________________ The review is made without taking into account the news background. Thus, the opening of trading sessions of the main financial centers does not serve as a guide to action (placing orders "sell" or "buy"). The formula for calculating the dollar index : USDX = 50.14348112 * USDEUR0.576 * USDJPY0.136 * USDGBP0.119 * USDCAD0.091 * USDSEK0.042 * USDCHF0.036. where the power coefficients correspond to the weights of the currencies in the basket: Euro - 57.6% ; Yen - 13.6% ; Pound Sterling - 11.9% ; Canadian dollar - 9.1%; Swedish Krona - 4.2%; Swiss franc - 3.6%. The first coefficient in the formula leads the index to 100 at the start date of the countdown - March 1973, when the main currencies began to be freely quoted relative to each other. The material has been provided by InstaForex Company - www.instaforex.com |
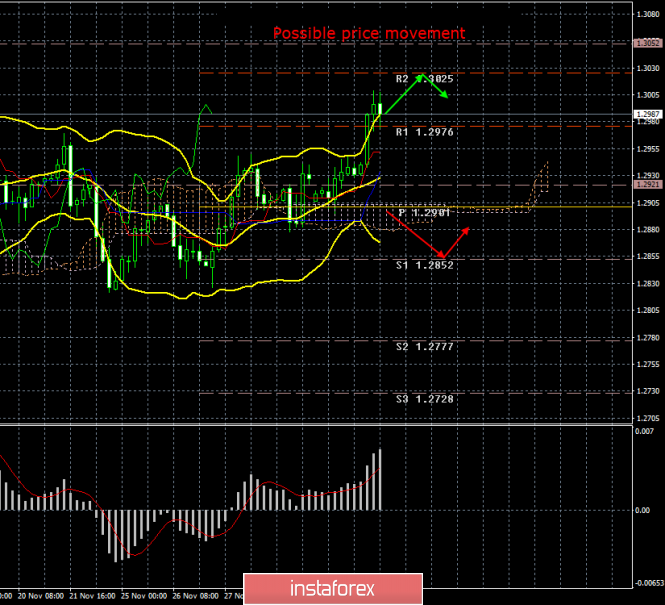
| Posted: 03 Dec 2019 02:40 PM PST 4-hour timeframe Amplitude of the last 5 days (high-low): 69p - 89p - 52p - 63p - 53p. Average volatility over the past 5 days: 65p (average). The GBP/USD currency pair followed the example of the European currency today and made an impressive jump, reaching a psychological mark of 1.3000. It seems that after a lull for a month and a half, traders began to return to the market. However, the time has not yet come for such conclusions. First, market participants continue to ignore any macroeconomic statistics from the United States and the United Kingdom. Secondly, the resistance area of 1.2970–1.3010, from which the pair has bounced several times in the last two months, has not been overcome, which means there may be another rebound from it. Thirdly, it is not clear why a tangible upward movement began today? An index of business activity in the UK construction sector was released today, which showed a slight improvement (45.3 against 44.2 a month earlier). However, as in the case of business activity in the industrial sector, the construction industry is still experiencing a decline, so the "improvement" is quite formal. There were no more macroeconomic publications today, and we believe that the rise of the pound is completely unrelated to the publication of the business activity index. But, of course, this takeoff may be connected with the arrival of Donald Trump to London, who manages to "light up" absolutely everywhere, comment on absolutely all the events in the world, ignite several trade wars, criticize Jerome Powell and the Federal Reserve while also supporting "his friend" Boris Johnson . It was the support of Johnson and Brexit that Trump took on his arrival in London. "Boris Johnson is very capable, and I think that he will do an excellent job," Trump said and expressed confidence that it was Johnson's party who would win a landslide election. But French President Emanuel Macron fell under a flurry of criticism: "France needs NATO more than other countries, and the United States needs this alliance the least. A very dangerous statement from France. And it's very strange - they've got everything wrong with the economy, and for some reason they have such phrases about NATO," Trump said in response to Macron's words about " NATO's dead brain." Thus, the pound could react to Trump's support of Johnson in the election. Or the rising ratings of the Conservative party... According to recent studies, the advantage of Conservatives over Labour has increased to 12%. Again, we would like to note that any opinion polls always have an error, and the opinion of the UK population may change. It is not at all surprising that the Conservatives took the lead even more after Johnson criticized the Labour Party for the law it adopted in 2003, which gives criminals convicted of terrorist activity the right to early release. According to Johnson, it was this law that caused the tragedy on the London Bridge. The prime minister did not cover the fact that the murdered terrorist is not the only terrorist in the world. There is also the fact that this law could be repealed under the ruling Conservative Party even before the tragedy. The Labour Party was put in a disadvantageous light, which affected their political ranking. However, hopes that Johnson's party will not succeed in forming a ruling majority still remains. According to many experts, if the advantage of Conservatives drops to 7%, then the Tories will not be able to take the majority of seats in Parliament. In this case, it will be necessary to consider how many votes the Conservatives + deputies of the Brexit party and the Labour Party + Scots + Social Democrats will collect. Such coalitions could be formed to continue the Brexit war in the new Parliament. Thus, Tory's advantage remains, but it is very shaky, and Trump's visit to London can be used by Labour to cast a shadow over Conservatives, whose leader does not hide his friendship with the American president, who is not very loved in the UK. Well, the prospects for the pound, for the reasons that we covered in the morning article, remain extremely vague. There are a sufficient number of reasons for this and all are connected with Brexit and with the UK's life after Brexit. From a technical point of view, the pound/dollar pair has overcome the resistance level of 1.2976 and can now continue to move up, but we believe that correction will begin tomorrow, and the pair will not be able to overcome the area of 1.2970 - 1.3001. Trading recommendations: GBP/USD continues to move upward as part of a sideways trend. However, it is not advised to buy the pound at the moment, since quotes have not yet been able to leave the area above 1.2970 - 1.3010. If the bulls still manage to break higher, then it will be possible to consider buying the pound/dollar pair while aiming for 1.3025 and 1.3052. Selling the pair is now impractical, from the point of view of technical analysis, since the price is located above all the lines of the Ichimoku indicator. Explanation of the illustration: Ichimoku indicator: Tenkan-sen is the red line. Kijun-sen is the blue line. Senkou Span A - light brown dotted line. Senkou Span B - light purple dashed line. Chikou Span - green line. Bollinger Bands Indicator: 3 yellow lines. MACD indicator: Red line and bar graph with white bars in the indicator window. Support / Resistance Classic Levels: Red and gray dotted lines with price symbols. Pivot Level: Yellow solid line. Volatility Support / Resistance Levels: Gray dotted lines without price designations. Possible price movement options: Red and green arrows. The material has been provided by InstaForex Company - www.instaforex.com |
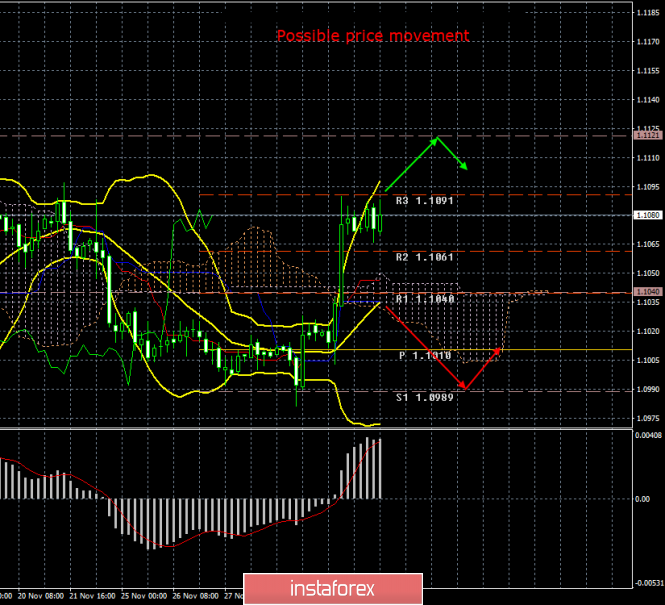
| Posted: 03 Dec 2019 02:40 PM PST 4-hour timeframe Amplitude of the last 5 days (high-low): 19p - 33p - 20p - 47p - 87p. Average volatility over the past 5 days: 41p (low). The EUR/USD currency pair, which made an impressive growth on the first trading day of the week, completed it as expected on Tuesday, December 3, and the pair's volatility again fell to its lowest values. Thus, as we have already said in the morning review, there are no special reasons for bulls to continue buying the euro, whether there were any or not. Yesterday, the upward momentum of the euro/dollar pair, from our point of view, was a mere coincidence of a whole group of factors that pushed the euro currency up. So? And then traders again refuse to buy the euro due to the fact that the European fundamental background remains extremely weak. Yes, business activity in industry showed some signs of recovery, as did inflation, which grew to 1.0% YOY. However, a recession is still observed in the production sector, not weak growth rates, and inflation is at extremely weak values that do not allow us to talk about the recovery of the EU economy. Thus, we believe that several indicators that showed a slight increase are still not the basis for large-scale purchases of the euro. It is this mood today that the participants in the forex market have demonstrated the lack of desire to buy the pair further. Not a single macroeconomic report has been published in the US or the European Union to date. But the next batch of news came from the main newsmaker of recent years - Donald Trump. This time, the US leader said that he could quite easily wait for the signing of an agreement with China before the presidential election, or even more. That is, Trump with all his appearance shows that, firstly, he does not doubt his victory in the elections, secondly, he is not in a hurry to sign an agreement with Beijing, and thirdly, he does not worry about the absence of a deal, the escalation of the trade war with China could adversely affect its political ratings and therefore prevent it from winning the 2020 election. China has long realized that the Americans are not happy with the increase in prices for Chinese goods, are not pleased with Trump's policy of "we will fight (thank God we are talking only about trade wars so far) with everyone who does not want to fulfill our conditions" and, therefore, any escalation of the trade conflict (or the beginning of a new one) will not be in the hands of the US president. We have long believed that China deliberately delays time, quite reasonably assuming that it's better to be content with a slowdown in its own economy and a drop in GDP growth during the year, but then agree with a more loyal president than suffer losses and a bad deal for many years or maybe even decades. There is no doubt that the deal proposed by Trump will be unprofitable for China. In turn, Trump also understands that China is taking time, but cannot openly declare this and blame Beijing for this "mortal sin". Otherwise, the Americans and the whole world will understand that Trump is really afraid that there will be no re-election for a second term and, accordingly, China will receive an advantage in the negotiations. Thus, it seems that Trump has chosen the strategy of "standing your ground and going all the way." Will this have a positive effect on negotiations with China? We think that is unlikely. Trump will have to decide on December 15 whether or not to impose duties for another 160 billion dollars worth of goods from China, which in total can block all imports from it. Earlier, in the framework of trade negotiations, Trump postponed the decision on additional duties to December 15. Thus, most likely, duties will be introduced, once negotiations have stalled again, and China will probably also respond by imposing its sanctions and duties. Until the end of 2019, we will more likely witness an escalation of the conflict than a reconciliation of the parties. All this is bad for the global economy, and for the US, and for the Chinese, and for the European. There is every reason to believe that in such a situation, the US and European economies may continue to slow down, which again will bring more negative to the European currency, because the EU economy continues to look much weaker than the US. From a technical point of view, the euro/dollar pair has worked out the resistance level of 1.1091 and could not continue to move up. Thus, a downward correction is now very likely. We would also like to note that traders were not able to overcome the previous local peak, which also speaks in favor of a downward correction or the resumption of a downward trend. Thus, we believe that turning the MACD indicator down could imply the beginning of a new trip down, but it is recommended to consider shorts only after traders overcome the critical line. Trading recommendations: The EUR/USD pair maintains the prospects for the upward movement, and the volatility in today's trading again declined. Thus, for those who are already in longs, it is recommended to take profits near the level of 1.1091, and consider new purchases only after overcoming the first target. Selling the euro, which has more fundamental grounds, will be better after overcoming the critical line of Kijun-sen. Explanation of the illustration: Ichimoku indicator: Tenkan-sen is the red line. Kijun-sen is the blue line. Senkou Span A - light brown dotted line. Senkou Span B - light purple dashed line. Chikou Span - green line. Bollinger Bands Indicator: 3 yellow lines. MACD indicator: Red line and bar graph with white bars in the indicator window. Support / Resistance Classic Levels: Red and gray dotted lines with price symbols. Pivot Level: Yellow solid line. Volatility Support / Resistance Levels: Gray dotted lines without price designations. Possible price movement options: Red and green arrows. The material has been provided by InstaForex Company - www.instaforex.com |
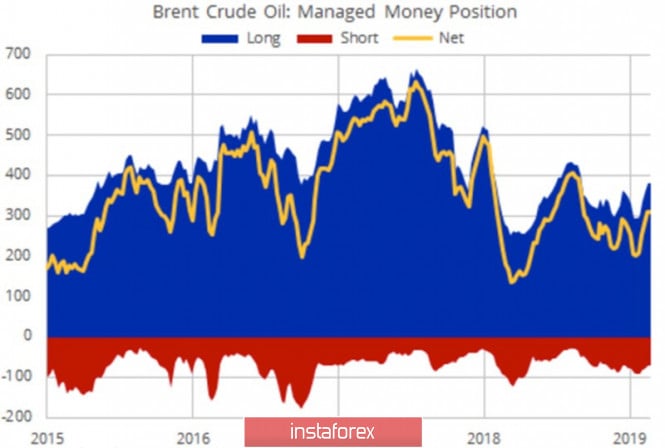
| Posted: 03 Dec 2019 02:40 PM PST Oil is slowly recovering from a major sell-off on the last day of autumn. Taking advantage of the thin market after Thanksgiving, speculators decided to get rid of their long positions ahead of the December OPEC+ meeting. The simplest thing that the cartel and Russia can do is to prolong the agreement to reduce production by several months after March 2020. However, how will the market react to this? Isn't it better to avoid a massive sell-off before the results of the meeting are known? If speculators sold oil at the November 29 auction, before that, on the contrary, they were actively building up long positions. By the end of the week, November 26, WTI net-longs increased by 15%, gross longs increased by 12%, while shorts fell by 14%. Approximately the same numbers could be seen on Brent. Brent Speculative Dynamics It is peculiar that black gold was not moving in unison with US stocks at the turn of autumn and winter. The latter were marked by a serious collapse after the White House introduced duties on imports of steel and aluminum from Brazil and Argentina, while oil grew in response to rumors of Saudi Arabia's desire to expand production cuts from 1.2 million bpd to 1.6 million bpd, at least until June 2020. Riyadh needs to carry out an initial public offering of shares in the state-owned company Aramco, the scale of which is estimated at approximately $25 billion. If Brent is listed below $60 per barrel, it is unlikely that buyers will grab paper of the oil company like hotcakes. However, according to Goldman Sachs, even if OPEC+ expands its obligations by 400 thousand bpd by the end of June 2020, this is unlikely to lead to a serious increase in prices. The bank predicts that North Sea-grade quotes will dangle around $60 per barrel for most of next year. Oil support is provided by the first growth above the critical level of 50 in business activity in China's manufacturing sector since April. China is the largest consumer of black gold in the world, and an increase in demand of 64 thousand bpd in the third quarter is good news for Brent bulls and WTI. Moreover, the IEA predicts that the figure will reach a record high of 13.6 million bpd in 2020. I have no doubt that this will be so if the trade war between Washington and Beijing does not become history. Otherwise, weak global demand will continue to put downward pressure on black gold prices. At the same time, the growth of shale production in the United States significantly affects the market balance. In September, the United States closed a full month as a net exporter of black gold for the first time since 1940. Its deliveries abroad exceeded imports by 89 thousand bpd. It is Interesting that the last time the value of net imports exceeded 12 million was ten years ago. Technically, without leaving Brent quotes beyond the downward trading channel, the implementation of the Double Bottom pattern can be forgotten. On the contrary, a breakthrough of support at $56 per barrel, which corresponds to the lower boundary of the triangle, the risks of a downward trend recovery will increase. The material has been provided by InstaForex Company - www.instaforex.com |
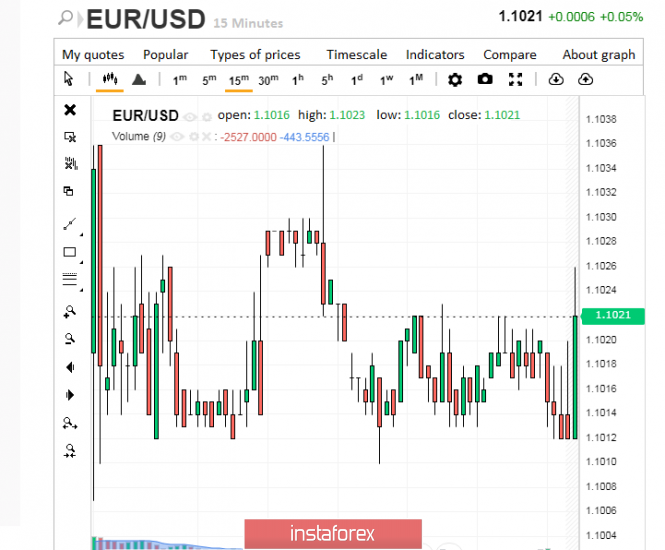
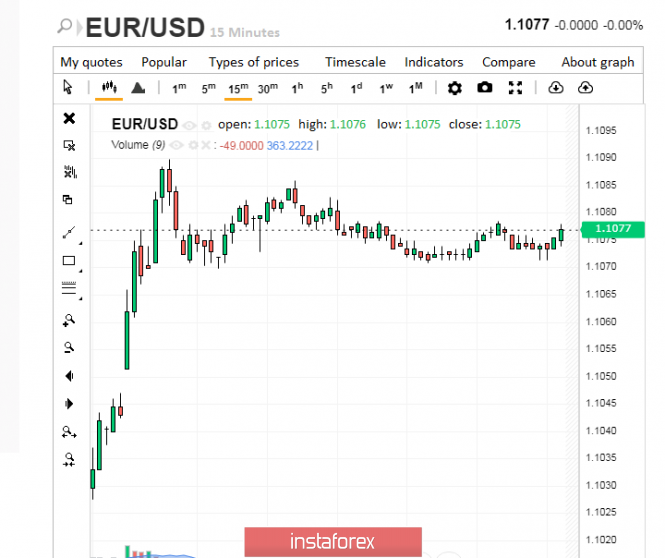
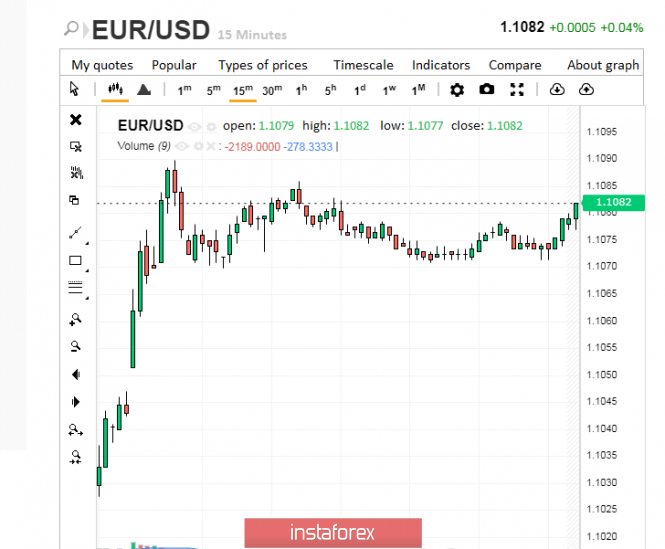
| Euro: growth did not last long, the fall is already looming Posted: 03 Dec 2019 02:40 PM PST The European currency feels uncertain at the beginning of this week. In the EUR/USD pair, the euro is always the one being driven, giving the dollar the reins. Nevertheless, analysts believe that the euro will be able to recover in the medium term. The political situation in Germany is rendering the European currency a disservice, experts say. The euro is doomed to failure if the current government resigns. The first bell was the defeat of Olaf Scholz and Klara Geyvits, candidates for leaders of the Social Democratic Party of Germany (SPD). Analysts fear that a change of leadership in one of the largest parties in Germany will lead to the collapse of the ruling coalition. This, in turn, will have an extremely negative impact on the euro, experts say. Weak data on the manufacturing sector of the eurozone added fuel to the fire. On the one hand, many economic indicators increased, but business activity in almost all countries was very low. These factors also negatively affect the dynamics of the European currency. Pressure is also exerted on the signing of the Hong Kong bill by US President Donald Trump. Such a decision gave odds to the US currency, and the euro again had to defend its position, trying not to plunge to the bottom. The EUR/USD pair was trading near the levels of 1.1020–1.1021 on Monday, December 2. Subsequently, after exceeding the 1.1030 mark, a reversal in favor of the greenback was recorded. Demand for the European currency remained extremely low at the beginning of the week, while it was high for the greenback. According to experts, in the event of a breakout of the resistance line of 1.1050, the EUR/USD pair may reach the level of 1.1100. At the moment, such a scenario is quite relevant, analysts believe, focusing attention on the upward movement of the pair. The EUR/USD pair started on a positive note by rising to 1.1077 on Tuesday morning, December 3. The confident rise of the pair inspired market participants. Currently, the EUR/USD pair is trading within the range of 1.1081–1.1082, showing vigorous attempts to overcome the current range. Analysts are not disillusioned regarding the short-term and medium-term prospects for the euro, but the overall picture is moderately positive. They do not expect a 180-degree turn for the European currency in the near future, although changes in the German government can have an extremely negative impact on its dynamics. However, experts are counting on the stabilization of the euro, who is actively fighting for a place under the financial sun, which is most noticeable in the EUR/USD pair. The material has been provided by InstaForex Company - www.instaforex.com |
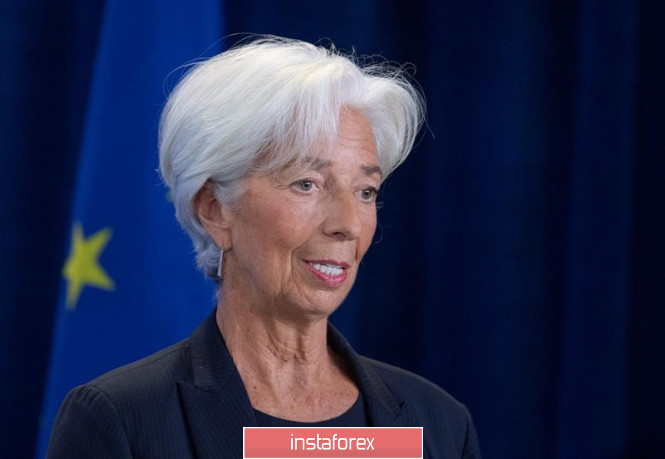
| Foreign exchange markets are becoming a battleground, while the race for monetary easing is not over Posted: 03 Dec 2019 02:40 PM PST The USD index slipped to two-week lows after the data released the day before showed that the US manufacturing sector contracted for the fourth consecutive month in November and construction costs in the country unexpectedly dropped, fueling fears that the world's largest economy could enter a recession. However, the dollar began to fall even before the release of weak data. The starting point for this was US President Donald Trump's tweet. First, the head of the White House again levied duties on imports of steel and aluminum from Brazil and Argentina, citing excessive devaluation of their currencies to the detriment of American farmers. Secondly, Trump demanded that the Federal Reserve do something with the dollar, because it is overpriced. "The Federal Reserve should act so that countries, of which there are many, no longer take advantage of our strong dollar by further devaluing their currencies. This makes it very hard for our manufacturers and farmers to fairly export their goods. Lower Rates & Loosen - Fed!", said the American leader. According to some experts, the fact that Trump for the first time directly linked the introduction of tariffs with currency movements may indicate the beginning of a new phase in trade wars, where currency markets are already becoming a battleground. Recent statements by the head of the White House have revived talk about a possible currency intervention against the greenback. Capital Economics believes that the US president is likely to fail in his attempts to weaken the dollar. Speaking to European MPs on Monday, Christine Lagarde asked for time to study the aspects of her new work and the factors on the basis of which a decision should be made on changing monetary policy. "The EUR/USD pair still has a slight potential of a reduction if the ECB keeps interest rates next week, but hints at a weakening monetary policy in the future," Wells Fargo said. However, there is another point of view. "If US macro statistics continue to disappoint, next year we can see another Fed rate cut. The regulator may also need additional monetary incentives - as a result, competitors of the greenback will grow," Cambridge Global Payments strategists believe. This year, the US central bank reduced interest rates three times and at its last meeting made it clear that in the future, it will make decisions depending on the incoming data. The euro could strengthen against the US dollar in 2020, since the Fed has more opportunities than the ECB to act in the field of monetary policy, Commerzbank economists said. "The Fed is more likely than the ECB to introduce additional stimulus measures in 2020 in response to weaker US economic growth. That is, the Fed can do more damage to the dollar than the ECB to the euro, because it has more opportunities to weaken the policy," they said. The material has been provided by InstaForex Company - www.instaforex.com |
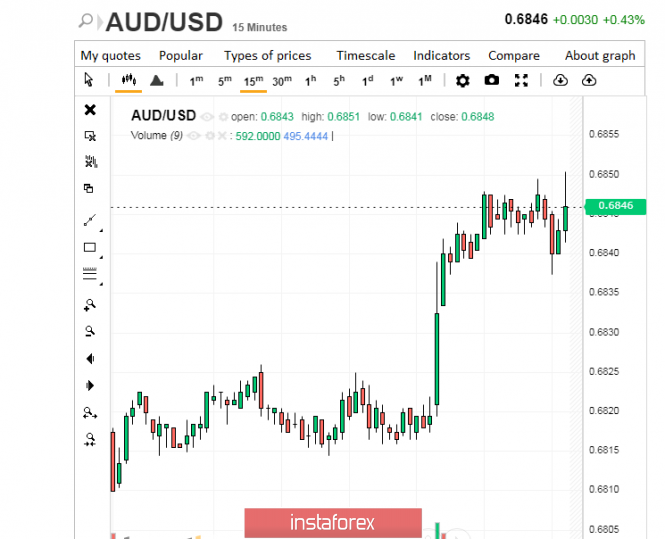
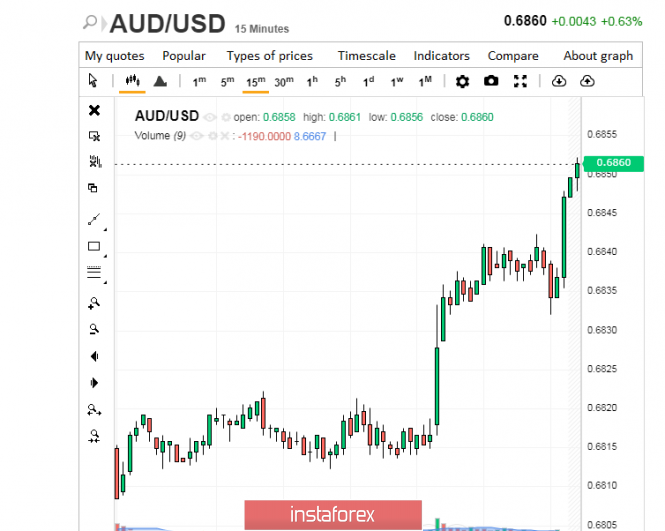
| Australian dollar is back on the line Posted: 03 Dec 2019 02:40 PM PST The new week was saturated for the Australian dollar: experts ranked it among the favorites of the market. The aussie is again showing an upward trend, not intending to give up its positions. The Australian dollar set a positive tone in the financial market on Monday, December 2, by gaining 1% against the US currency and updating its two-week high. However, analysts are alarmed by weak data on the Australian economy, and therefore the possibility of a rally of the national currency is in doubt. According to current reports, activity in the country's manufacturing sector has significantly slowed in the past month, inflation has dropped sharply, as has employment. Experts have recorded a slowdown in the Australian economy. The aussie's current growth contributed to the improvement of economic data for China. Despite tensions amid a long trade conflict between the US and China, manufacturing activity in Australia has grown at a record pace over the past three years. According to current reports, this indicator is still up to par. Another factor in strengthening the Australian currency was the decision of the Reserve Bank of Australia (RBA) to keep the interest rate at the current level. This conclusion was made by central bank chief Philip Lowe, having analyzed the current economic situation. He drew attention to a slowdown in employment growth and easing inflationary pressures. Currently, the RBA does not see the need for easing monetary policy, although a month ago the regulator considered this option. The rise of the AUD/USD pair was also facilitated by criticism of US President Donald Trump about the strengthening of the US dollar and his appeal to the Federal Reserve to lower rates. Thanks to a number of positive factors, the pair managed to overcome the 0.6840 mark. On the morning of Tuesday, December 3, the AUD/USD pair was trading in the range of 0.6845–0.6846, demonstrating upbeat moods. Subsequently, the pair reached the level of 0.6860, trying to go beyond this range. Currently, the AUD/USD pair runs within this framework, trying to expand them. At present, the Australian currency feels confident, but such a global factor as a hitch in the US and China trade negotiations can interrupt its flight. In the event of a disagreement between Washington and Beijing, the Australian currency will fall, plunging to the bottom. Negotiations between the two powers significantly affect its dynamics, since Australia is the main supplier of raw materials to China. However, experts expect a continuation of the upward trend of the aussie in the short term. The material has been provided by InstaForex Company - www.instaforex.com |
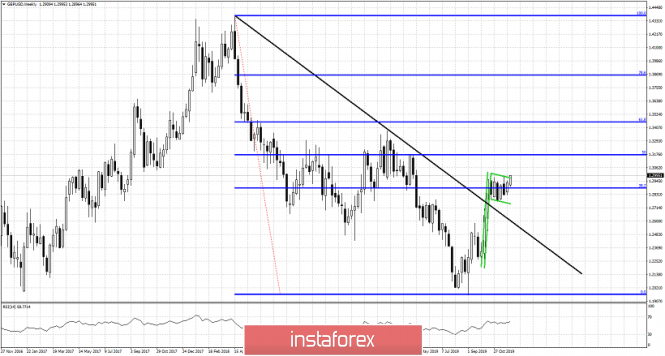
| Posted: 03 Dec 2019 07:46 AM PST GBPUSD is consolidating around 1.30 while it has formed a bullish flag pattern. A weekly close above 1.30 will be a bullish signal and this could lead to more upside in GBPUSD. Next upside target should be around 1.3170 and 1.3455.
Black line -resistance trend line GBPUSD is breaking both the 38% Fibonacci retracement resistance level and the bullish flag pattern upwards. Our next target is at 1.3170. As long as price is above the black downward sloping resistance trend line, we remain bullish. Support is at 1.2770. Bulls do not want to see this level broken downwards as this will decrease the chances of reaching 1.3170. The material has been provided by InstaForex Company - www.instaforex.com |
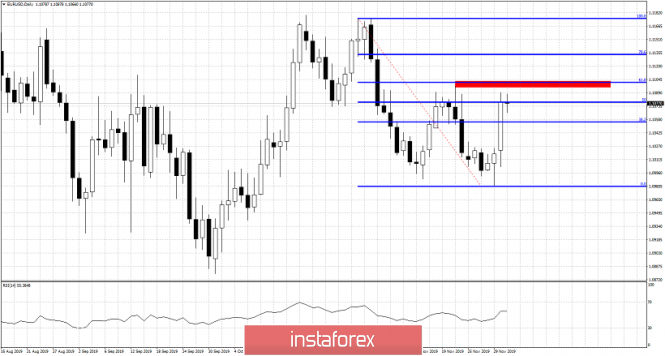
| Posted: 03 Dec 2019 07:40 AM PST After a strong day yesterday where price broke above short-term resistance of 1.1030 and topped around 1.1090, EURUSD is now consolidating near its highs. This consolidation can also be seen as a bullish flag pattern. So more upside should be expected.
EURUSD has made no real progress today. Price is right below important horizontal and Fibonacci resistance at 1.11. Support remains at 1.1030 and a pull back below this level would be a bearish sign. Short-term trend remains bullish. If bulls manage to recapture 1.11 then we could see another leg higher towards 1.12. Failure to hold above 1,10 will lead to price falling towards 1.09 and lower. The material has been provided by InstaForex Company - www.instaforex.com |
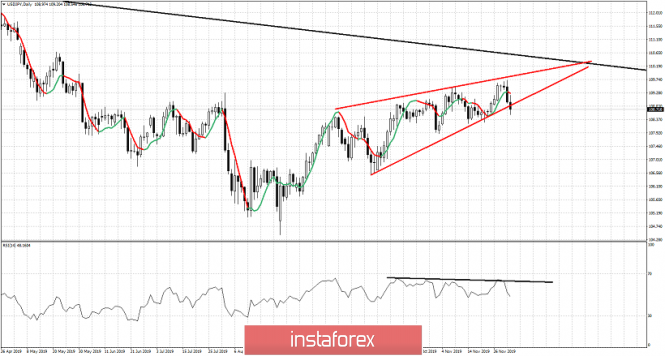
| USDJPY bearish pattern is being activated Posted: 03 Dec 2019 07:35 AM PST In our previous posts I mentioned that USDJPY price has formed a bearish wedge pattern. We also noted that resistance is at 109.60-110.30 area, where price got rejected yesterday. Now price is moving below and out of the wedge pattern. This is a sign of weakness.
Red lines - wedge pattern Black line - bearish divergence USDJPY is breaking support at the lower wedge boundary. Next support is at 108.20-108.30. If price breaks below 108.20-108.30 then we have confirmation of the wedge break down. Resistance remains at 109.90 now while longer-term resistance is at the 110.30 level. The sequence of higher highs and higher lows remains intact, as long as price is above 108.20. If this sequence gets canceled then we have confirmation of the break down and we should expect price to at least move towards 106.55. The material has been provided by InstaForex Company - www.instaforex.com |
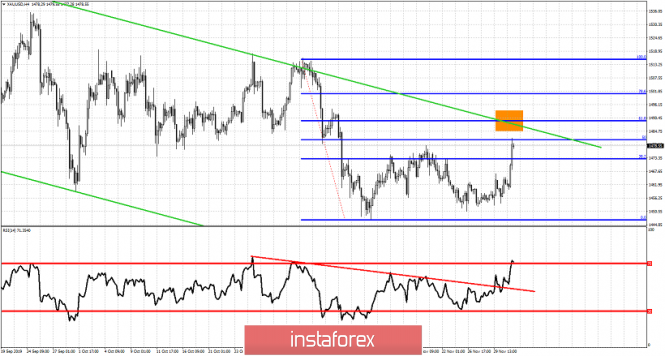
| Gold reaches second upside target of $1,480. Posted: 03 Dec 2019 07:29 AM PST Gold price has reached $1,480 which was our target since we saw that the key support at $1,450-60 was respected. We noted on time the bullish divergence before the first leg up towards $1,478 and since respecting the recent lows we warned again of another leg higher towards $1,480-90.
Red line - RSI resistance Orange rectangle - target Gold price is moving higher today towards the upper channel boundary and major Fibonacci resistance at $1,490. From the end of last week and early this week we noted that we changed our view to short-term bullish and that the risk reward favored bullish positions. Now Gold is approaching important resistance area. If bulls manage to recapture $1,490-$1,500 then we could see Gold price move much higher. Until then we need to keep a close eye on the resistance as a rejection at $1,490-$1,500 would be a bearish sign. The material has been provided by InstaForex Company - www.instaforex.com |
| GBP/USD: policy still keeps the pound in good shape Posted: 03 Dec 2019 06:40 AM PST The GBP/USD pair jumped to a six-week highs, testing the 1.30 mark. According to experts, it will be possible to talk about the development of an upward trend in the British currency only if it consolidates above the level of $1.30, however, it has not been able to do this since October. In anticipation of early parliamentary elections in the UK, the pound is more responsive to opinion polls and, to a lesser extent, the country's macroeconomic indicators. According to the latest Kantar poll, voters' support for the Conservative Party grew by 1% to 44%. This helped the Tories to increase the gap between the Labour Party to 32%, and now it is 12% against 11% recorded in the previous week. A Conservative victory by the markets is expected to reduce uncertainty around Brexit's future prospects, and this inspires the pound. "Expectations for Conservatives to gain a majority in Parliament in a general election will mean that the pound will retain its recent gains," the MUFG believes. "At this stage, we suspect that it is too late for the Labour Party, and the average number of polls that the Conservatives will receive is likely to support the pound this week," said MUFG analyst Fritz Louw. "Nevertheless, the pound's growth potential is limited due to uncertainties around Brexit and recent economic data indicating a weakening British economy," he added. According to the final data of IHS Markit, the index of business activity in the manufacturing sector of the UK fell to 48.9 points in November against 49.6 points recorded in October. Despite the fact that the value of the indicator was higher than the preliminary estimate (48.3 points), in general, the data are weak and suggest that activity in the country's manufacturing sector continues to decline. "British manufacturers are reducing the number of jobs at the fastest pace since 2012. This is another indication that the global slowdown, along with the uncertainty surrounding Brexit, continues to adversely affect the manufacturing sector," IHS Markit said. The material has been provided by InstaForex Company - www.instaforex.com |
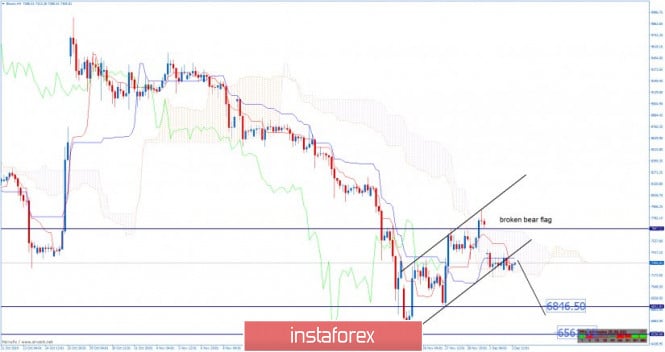
| BTC 12.03.2019 - Broken bearish flag in the overall downward trend Posted: 03 Dec 2019 06:26 AM PST BTC has been trading sideways at the price of $7.292. The overall trend is still bearish and my advice is still to watch for selling opportunities. Downward targets are set at the price of $6.846 and $6.560. Ichimoku Indicator analysis:
There is Kijun-Tenkan bear cross on the 4H time-frame, which is good indication for the further downside. I would watch for potential breakout of mini-support at the price of $7.200 to confirm downside continuiation and eventual test of $6.546 and $6.560. Resistance levels are seen at the price of $7.350 and $7.667. The material has been provided by InstaForex Company - www.instaforex.com |
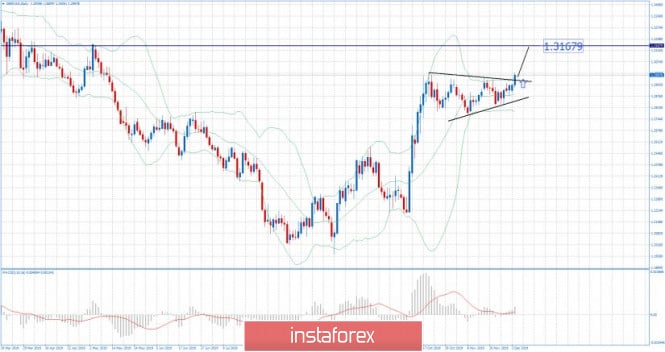
| Posted: 03 Dec 2019 06:14 AM PST GBP/USD did breakout of the 1-month long continuation symmetrical triangle, which is good indication for the further upside movement. Watch for buying opportunities on the dips. Projected target is set at the price of 1.3170.
MACD is showing increase on the upside momentum and new wave up, which is good confirmation for our long bias. Support levels are seen at the price of 1.2947 and 1.2877. Resistance level is seen at the price of 1.3167. The material has been provided by InstaForex Company - www.instaforex.com |
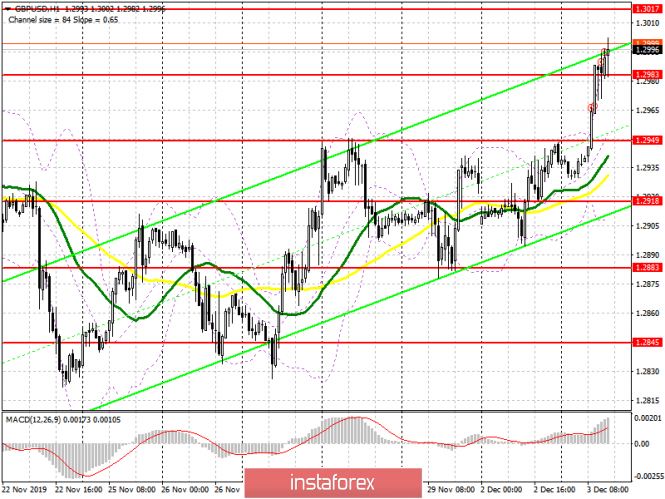
| GBP/USD: plan for the US session on December 3. Pound expected continued growth Posted: 03 Dec 2019 05:51 AM PST To open long positions on GBPUSD, you need: Even in my morning review, I paid attention to the probability of breaking the resistance of 1.2949, which led to such powerful upward momentum. Now, buyers of the pound are trying to gain a foothold above the level of 1.2983, which the bears ignored and decided to concede. The main calculation is for a new maximum of 1.3017, where I recommend fixing the profits. If the pressure on the pound returns in the afternoon, you can expect to buy from the same level of 1.2949. The absence of important fundamental statistics for the US can play into the hands of buyers of the pound, so we cannot exclude the breakout of the maximum of 1.3017, which will lead GBP/USD to the resistance area of 1.3074. To open short positions on GBPUSD, you need: Sellers are in no hurry to return to the market after the demolition of several stop orders. Therefore, it is best to focus on the resistance of 1.3017, the formation of a false breakout on which will be a signal to sell the pound. Otherwise, it is best to sell GBP/USD on a rebound from 1.3074. The more important task of the bears will be the return of the pound under the support of 1.2983, which will precisely limit the upward potential and soon can lead to a decrease in the pair to the area of the minimum of 1.2949, from where the bulls will again begin their active purchases. Indicator signals: Moving Averages Trading is above the 30 and 50 daily averages, indicating an upward trend. Bollinger Bands In the case of a decline in the pound, the average border of the indicator around 1.2949 will provide support.
Description of indicators
|
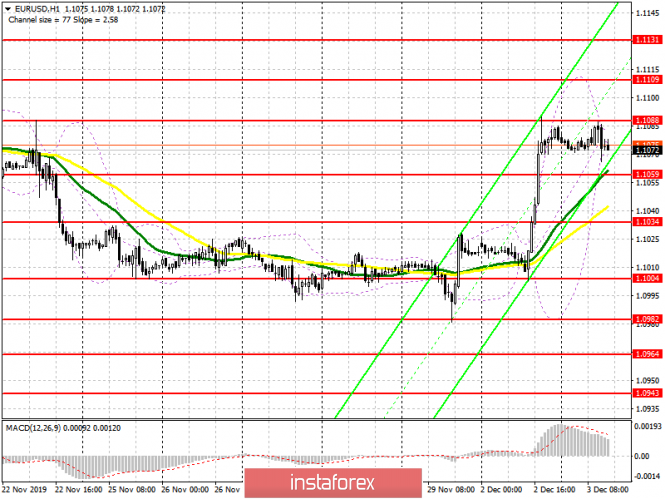
| Posted: 03 Dec 2019 05:47 AM PST To open long positions on EURUSD, you need: From a technical point of view, nothing has changed. Data on eurozone producer prices did not please traders, and weak growth restrained the further advance of the bulls. The chance to continue the upward correction remained, however, it is best to open long positions after the formation of a false breakdown in the support area of 1.1059 or buy EUR/USD immediately on the rebound from 1.1034. A more important task for buyers will be to break and consolidate above the resistance of 1.1088, which was not possible to do in the first half of the day. Given the absence of important fundamental statistics in the second half of the day, we cannot count on active purchases. Only a break of the resistance of 1.1088 will lead to an update of the highs of 1.109 and 1.131, where I recommend taking the profits. To open short positions on EURUSD, you need: Bears acted more actively from the resistance level of 1.1088, which led to a small downward correction in the first half of the day, but the report on producer prices did not scare euro buyers. It is still possible to talk about the formation of divergence, which I paid attention to in the first half of the day. Therefore, the formation of a false breakdown at yesterday's high still leaves a chance for sellers to a larger decline in EUR/USD. It will be important to break the support of 1.1059, which will push the euro down to the area of the minimum of 1.1034, where buyers will try to build the lower boundary of the new upward channel. In the scenario of EUR/USD growth above the resistance of 1.1088 in the second half of the day, it is best to consider short positions after updating the maximum of 1.1109 or sell immediately on a rebound from the resistance of 1.1131. Indicator signals: Moving Averages Trading is conducted above 30 and 50 moving averages, which keeps the chance for growth of the euro. Bollinger Bands Volatility has decreased sharply, which does not give signals to enter the market based on the indicator.
Description of indicators
|
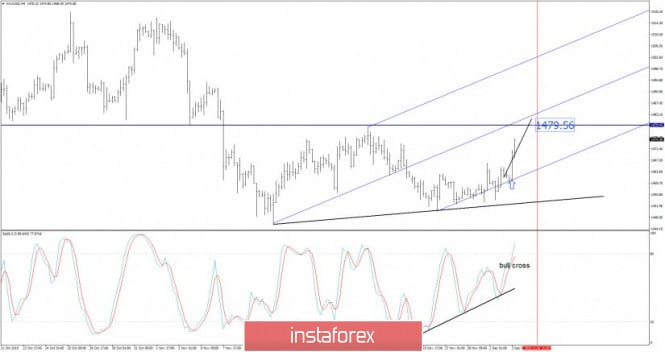
| Gold 12.03.2019 - Gold is near my upward target at $1.479, bullish movementum still present Posted: 03 Dec 2019 05:46 AM PST Gold has been trading upwards, exactly what I expected yesterday. Gold is heading for test of our main upward objective at $1.479 and Pitchfork middle line for the fulfillment of the upward cycle. In case of the stronger breakout of the $1.479, next target would be at $1.494.
Usually, when the price reach the Pitchfork middle line, there would be several smaller swings formed around ML and it is good area to exit long positions. The cause for this upward movement was the oversold condition from sellers and bullish divergence on the Stochastic oscillator that I mentioned yesterday. Support levels are seen at the price of $1.467 and $1.460. Main resistance level is found at $1.479. The material has been provided by InstaForex Company - www.instaforex.com |
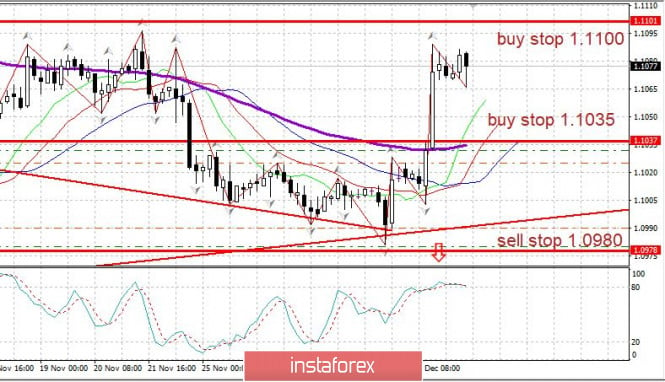
| Evening review of EURUSD on 12/03/2019 Posted: 03 Dec 2019 05:37 AM PST
The euro predictably met resistance below the level of 1.1100. In terms of trading, the range is the best place to get into sales. And sellers have stepped up but buyers are holding on. Let me remind you that the growth of the euro was caused by Trump's call to the Fed to lower the rate. The Fed meeting will be held on December 10-11. The Fed decision on December 11. Conflicting news is coming in on Trump-China trade talks. On the one hand, December 15 is the deadline for an agreement and Trump could impose new duties against China. On the other hand, Trump himself said that there was no specific deadline and that the negotiations could last into 2020. Some experts believe that the new duties against China can have a very painful impact on the entire world economy and can trigger a new big crisis - Trump, who is going to be elected for a second term in November 2020, clearly does not need it. Uncertainty. The important news is not expected on Tuesday. On Wednesday, there will be important reports on employment in the US and on the state of the services sector in November. EURUSD We keep purchases from 1.1035. Stop at 1.0990. The material has been provided by InstaForex Company - www.instaforex.com |
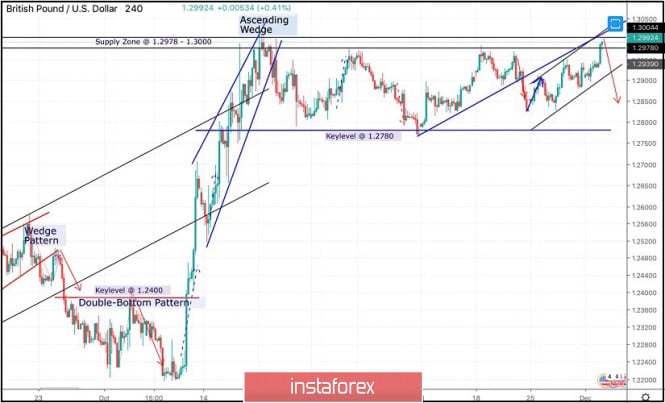
| December 3, 2019 : GBP/USD Intraday technical analysis and trade recommendations. Posted: 03 Dec 2019 05:33 AM PST
Since October 21, the GBP/USD pair has failed to achieve a persistent bullish breakout above the depicted SUPPLY-zone (1.2980-1.3000) which corresponds to a previous Prominent-TOP that goes back to May 2019. Moreover, an ascending wedge reversal pattern was confirmed on October 22. This indicated a high probability of bearish reversal around the mentioned price zone. Hence, a quick bearish movement was anticipated towards 1.2780 (Key-Level) where bullish recovery was recently demonstrated on two consecutive visits. Since then, the GBP/USD pair has been trapped between the mentioned price levels (1.2780-1.3000) until now. Technical outlook remains bearish as long as consolidations are maintained below 1.3000 on the H4 chart. Moreover, negative divergence was being demonstrated on the H4 chart. That's why, high probability of bearish rejection existed around the price levels of (1.2980-1.3000) one week ago. A quick bearish breakout below 1.2875 (short-term uptrend) was needed to enable further bearish decline towards 1.2780. However, early bullish recovery was demonstrated around 1.2825 which brought the pair again towards 1.3000 where a short-term bullish channel is being demonstrated. That's why, the current bullish pullback towards 1.2980-1.3000 (Prominent Supply Zone) should be watched for early bearish rejection and another valid SELL entry. Conservative traders may have to wait for a bearish breakout below 1.2900 for a valid SELL signal. On the other hand, please note that any bullish closure above 1.3000 invalidates the bearish scenario for the short-term. The material has been provided by InstaForex Company - www.instaforex.com |
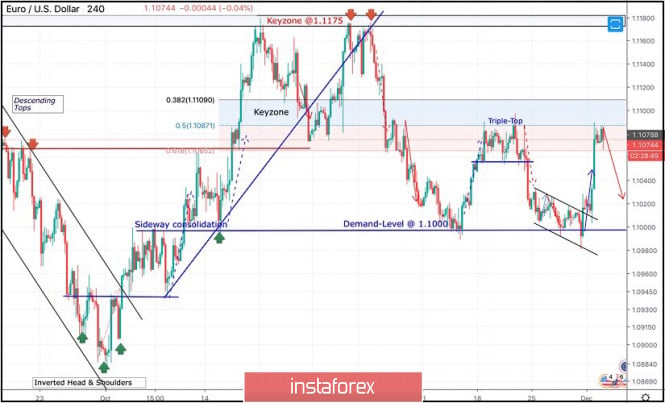
| Posted: 03 Dec 2019 04:58 AM PST
On October 2, the previous bullish movement was initiated after an Inverted Head & Shoulders reversal Pattern was demonstrated around 1.0880. Few days later, bullish breakout above 1.0940 (neckline) confirmed the depicted pattern enabling further bullish advancement towards (1.1000 -1.1020). Since then, the EURUSD pair has trended-up until October 21 when the pair hit the price level of 1.1175. The price zone of (1.1175 - 1.1190) stood as a significant SUPPLY-Zone that demonstrated bearish rejection for two consecutive times in a short-period. Hence, a long-term Double-Top pattern was demonstrated with neckline located around 1.1075-1.1090 offering valid bearish positions few weeks ago. That's why, two consecutive bearish pullbacks were executed towards 1.1025 and 1.0995 where two episodes of bullish rejection were demonstrated. Recent bullish pullback was demonstrated towards 1.1065-1.1085 where a cluster of supply levels were located (61.8% Fibo - 50% Fibo levels). On the other hand, Recent price action suggested a high probability of bullish reversal around 1.1000 that brought the EURUSD pair again towards 1.1065-1.1085 as expected. Thus, the EUR/USD Pair remains trapped between the price levels of 1.1000 and 1.1085 until breakout occurs in either directions. Initial bearish rejection should be anticipated around 1.1085 to bring bearish decline towards 1.1020. However, bullish breakout above 1.1090 will probably bring further bullish advancement towards 1.1120 and 1.1140. The material has been provided by InstaForex Company - www.instaforex.com |
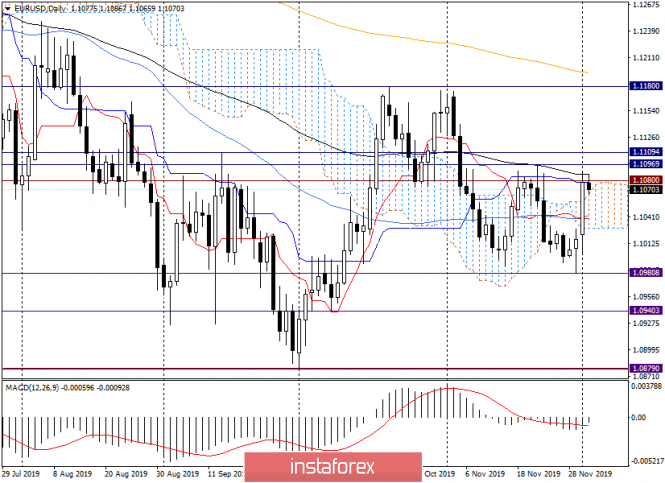
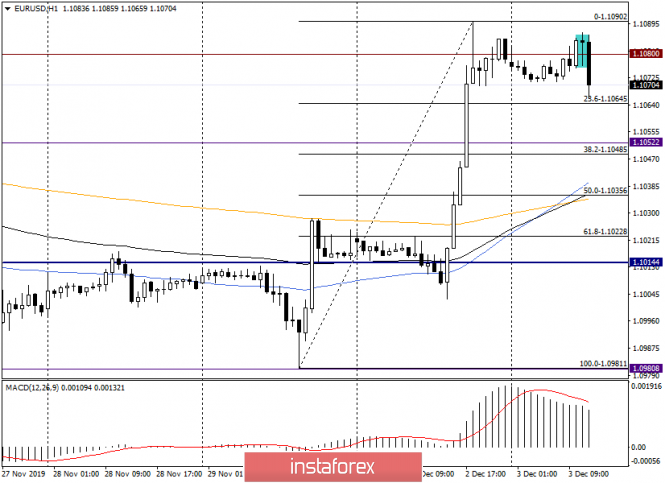
| Analysis and forecast for EUR/USD on December 3, 2019 Posted: 03 Dec 2019 03:30 AM PST Hello, dear colleagues! In yesterday's trading, the euro/dollar currency pair showed truly impressive growth. The beginning of yesterday was quite calm, but then the pair headed in a northerly direction. The reasons for such confident and powerful growth can always be found. These are the risks that the US economy will plunge into recession, and the speech of ECB President Christine Lagarde, and fears of an escalation of the trade conflict between the US and China. In my opinion, the main growth factors are technical. If you recall yesterday's review of the main currency pair, there was an emphasis on the higher timeframes: weekly and daily. At these time intervals, a rising scenario was most likely to be seen. Without delaying the matter, it began to become a reality from the first trading day. However, those who adhere to the bullish sentiment on EUR/USD and is in the purchases, do not fall into euphoria. There are still many important and significant events ahead, which will draw a line under the US labor market data, which will be published on December 6 at 14:30 (London time). Well, it's time to move on to the technical picture for EUR/USD, which has changed. Daily
As a result of strong growth, the pair pierced the Tenkan line of the Ichimoku indicator and opened a simple moving average. Characteristically, the growth was again stopped by a significant technical level of 1.1080. Let me remind you that this mark has repeatedly influenced the price dynamics of the main currency pair of the market. Although the pair confidently went up from the Ichimoku cloud, along with the level of 1.1080, the growth was stopped by the Kijun line and 89 EMA. At the time of writing, the euro/dollar is already trading slightly above the Kijun and is testing the strength of the 89 exponents. If today's trading ends above 1.1086 (89 EMA), higher targets of 1.1100, 1.1120 and 1.1175 can be expected. Near the last mark, a reversal on the course correction is possible, but in the current situation, the upward scenario looks priority and is likely to continue. However, it is always necessary to consider an alternative version of the course of trading. If the pair turns in a southerly direction, the most likely and nearest target will be the area of 1.1060-1.1040. Near 1.1040 50 MA and Tenkan can provide good support to the quote and send EUR/USD up again. H1
As seen on the hourly chart, I stretched the Fibonacci grid to the growth of 1.0981-1.1090. At this point, a bearish candle appeared, after which the pair decreases. After such a rapid growth, which was observed yesterday, at least some correction is simply necessary. In my opinion, the opening of long positions looks good on the hourly chart near 1.1040. Here are the 50th Fibo level and moving averages of 50 MA, 89 EMA, and 200 EMA. It is important that on the daily chart near 1.1040 are 50 MA and Tenkan. Earlier purchases can be tried from 1.1060. As for sales, for them, in my opinion, it is too late. The pair can turn at any time to continue the rise. Today's economic calendar is not full of important and significant events, so the course of trading on EUR/USD will be largely determined by technical factors. Have a nice day! The material has been provided by InstaForex Company - www.instaforex.com |
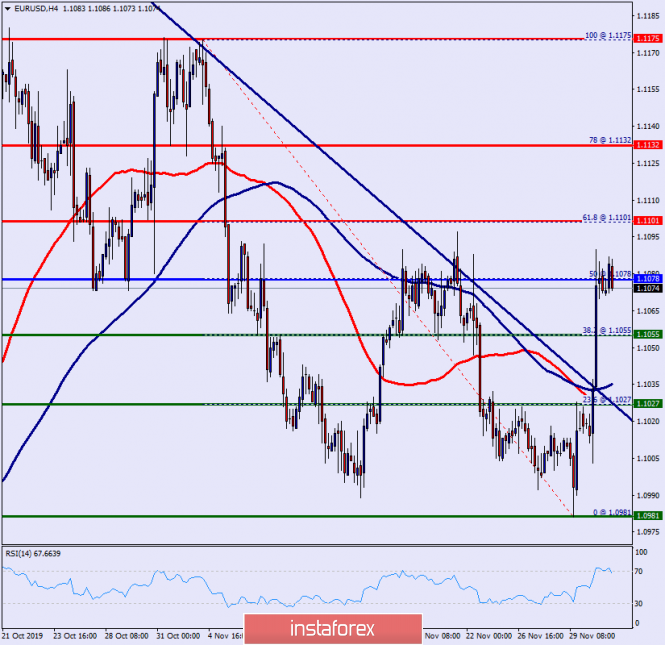
| Technical analysis of EUR/USD for December 03, 2019 Posted: 03 Dec 2019 02:34 AM PST Overview: The EUR/USD pair continues to move upwards from the level of 1.1027. Today, the first support level is currently seen at 1.1027, the price is moving in a bullish channel now. Amid the previous events, the price is still moving between the levels of 1.1027 and 1.1132. The daily resistance and support are seen at the levels of 1.1101 and 1.1132 respectively. In consequence, it is recommended to be cautious while placing orders in this area. Thus, we should wait until the uptrend channel has completed. Furthermore, if the trend is able to break out through the first resistance level at 1.1101, we should see the pair climbing towards the double top (1.1132) to test it. Therefore, buy above the level of 1.1055 with the first target at 1.1101 in order to test the daily resistance 2 and further to 1.1132. Also, it might be noted that the level of 1.1175 ais a good place to take profit because it will form a double top. Moreover, in larger time frames the trend is still bullish as long as the level of 1.1027 is not breached. This support (1.1027) has been rejected two times confirming the validity of an uptrend. However, it would also be sage to consider where to place a stop loss; this should be set below the second support of 1.0981. The material has been provided by InstaForex Company - www.instaforex.com |
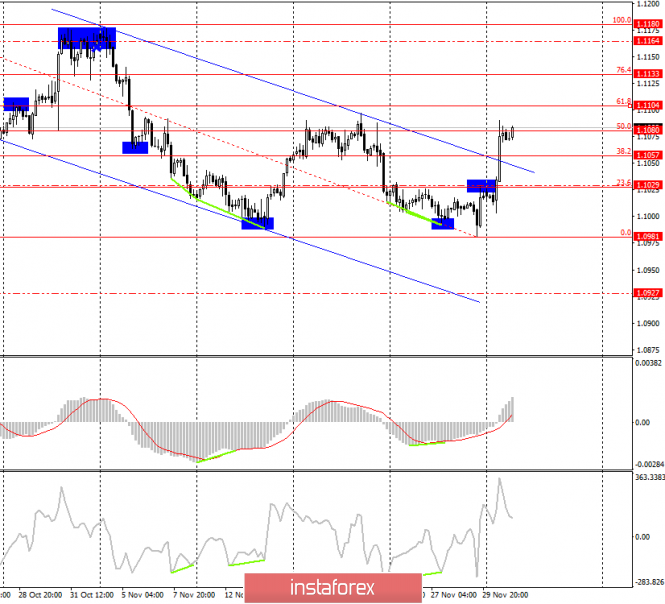
| Posted: 03 Dec 2019 02:29 AM PST EUR/USD - 4H.
On December 3, the EUR/USD pair performed consolidation over the correction levels of 38.2% (1.1057) and 23.6% (1.1029) on the new grid of Fibo levels and performed an increase to the Fibo level of 50.0% (1.1080). Also, the closure was performed over the downward trend corridor, which is no longer working. Based on this, I expect the euro-dollar pair to continue to grow in the coming days, although there are also enough factors in favor of the opposite scenario. For the most part, they are economic. At the same time, it is impossible to deny the ability of the euro currency to grow by 100-200 points. Yesterday had quite a rich background of information. Two key events of the day could and caused a change in the balance of supply and demand for the EUR/USD currency pair. Demand for the euro has grown thanks to the actions of Donald Trump, as well as economic reports on business activity in the European Union and America. It is easy to guess that these events were negative for the US dollar, although the actions of the US president can be interpreted in different ways. I would like to note at once that earlier when Donald Trump imposed duties on imports from China or Turkey, the dollar did not always respond with a fall against European currencies. Thus, yesterday's growth of the euro cannot be unambiguously linked with the introduction of duties on imports of steel and aluminum from Argentina and Brazil by the American President. It is also impossible to say unequivocally that the criticism of Jerome Powell caused the fall of the US currency. Trump once again said that the Fed does not help the American economy and farmers, but only harms them and urged to lower rates as quickly as possible. We cannot even conclude that the economic reports have caused such a reaction of traders because although business activity in the manufacturing sector of the eurozone has grown, it remained in the "red zone". The US ISM business activity report could not cause the US dollar to collapse on all fronts. To top it all off, you can try to link the decline of the US currency with the speech of Christine Lagarde, but after studying her speech in detail, it becomes clear that it is not the cause of the fall of the US currency. The European Central Bank is preparing for a new reduction in interest rates or the use of other measures to stimulate the EU economy. The ECB chairman said that the growth rate of the EU economy remains low, and all monetary policy will undergo a serious "fundamental" assessment and, as a result, may undergo major changes. Thus, Christine Lagarde's rhetoric is more of a "bearish factor" for the euro than a "bullish" one. Based on all this, it becomes clear that the European currency did not have any special growth factors yesterday, at least the factors of such strong growth. But last week, when the EUR/USD pair could show a significant rise or fall more than once, nothing happened. And the general conclusion, therefore, is this: the correlation between the actions of traders and the information background now remains not high; this explains the complete lack of movement of the pair last week and the strong growth on the first day of this week. Forecast for EUR/USD and trading recommendations: On December 3, traders continue the process of growth of the pair. Demand for the euro currency increased significantly on the first day of the week, and the activity of traders increased. So, I recommend buying the pair today with target levels of 61.8% (1.1104) and 76.4% (1.1133). The pair's rebound from the Fibo level of 50.0% (1.1080) may work in favor of the US dollar and the beginning of the fall in the direction of the level of 23.6% (1.1030). However, I do not recommend selling the pair after leaving the trend range. The Fibo grid is based on the extremes of October 21, 2019, and November 29, 2019. The material has been provided by InstaForex Company - www.instaforex.com |
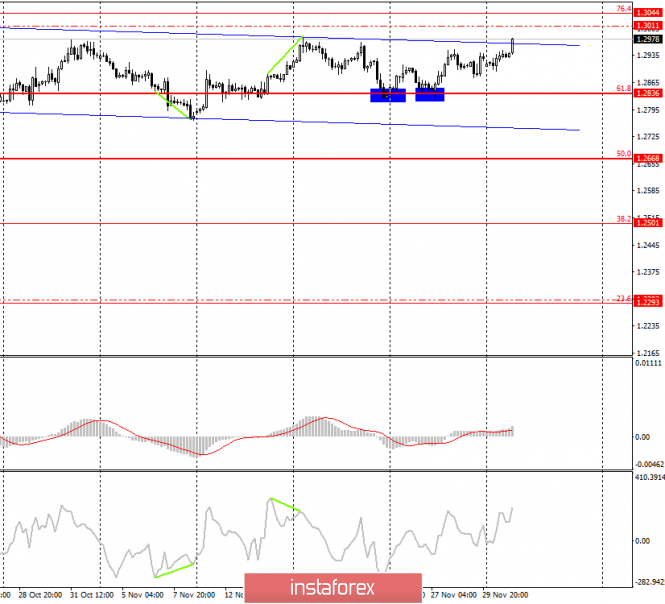
| GBP/USD. December 3. The visit of Donald Trump to the UK could harm the conservatives Posted: 03 Dec 2019 02:29 AM PST GBP/USD - 4H.
As seen on the 4-hour chart, the GBP/USD pair performed an increase to the upper line of the trend range, which has a minimum downward slope. Thus, today, traders will count on fixing the quotes of the pair on this line, followed by continued growth in the direction of the levels of 1.3011 and 76.4% (1.3044), from each of which the possible rebound or bounce off the trend line of the corridor with a turn in favor of the US dollar and start falling towards the correctional level of 61.8% (1.2836). Parliamentary elections in the UK are approaching, and the conservatives and Labor continue to use all available means to increase the attractiveness of their party among the population of the country. Yesterday, December 2, Donald Trump arrived in the UK on a working visit. He will attend the NATO Summit. However, despite the friendship between Boris Johnson and Donald Trump, the number of meetings between the two leaders can be kept to a minimum. It is reported that Boris Johnson wants to protect the influence of Donald Trump on the election campaign. The Prime Minister said earlier: "There are things that we traditionally do, like loving allies and friends, and there are things that we don't do - that's participation in each other's campaigns." Despite the friendship between Johnson and Trump, as well as the leading position of the conservatives in the election race, residents of the UK do not favor the American president, as evidenced by regular anti-Trump marches and sociological research data. Also, many Britons believe that Trump's open support for Boris Johnson is an attempt to interfere in the internal affairs of the country. Many political analysts say that after Boris Johnson's blow to the Labor Party on the London Bridge's terrorist attack, Labor can strike back at Johnson's party, saying the Prime Minister is lobbying for American interests in the UK and has generally "sold out" to America. There is also some danger for the Conservative Party because of Donald Trump's regular proposals to strike a "comprehensive trade deal" with London. However, the US president is under impeachment proceedings, with a low probability of winning the 2020 election, regularly fueling new trade conflicts and is extremely unyielding in negotiations on trade agreements. Thus, both the people of the UK and Boris Johnson himself are well aware that Trump's friendly proposals in practice can result in complex negotiations that can last for many years, as well as duties since this is Trump's favorite tool in putting pressure on countries he does not like. That's why Boris Johnson should distance himself a bit from Trump, at least until the end of the United Kingdom election campaign. Forecast for GBP/USD and trading recommendations: The pound-dollar pair resumed the growth process, which is very difficult for traders to win back. The rebound of quotes from the trend corridor line, the levels of 1.3011 or 1.3044 can be the beginning of a new fall in the pair's rate, which is quite appropriate to win back. But I still do not recommend buying a pound, there are too many obstacles for the pair from above. The Fibo grid is based on the extremes of March 13, 2019, and September 3, 2019. The material has been provided by InstaForex Company - www.instaforex.com |
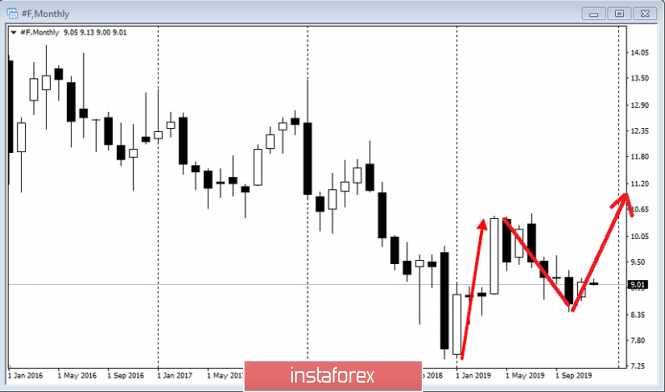
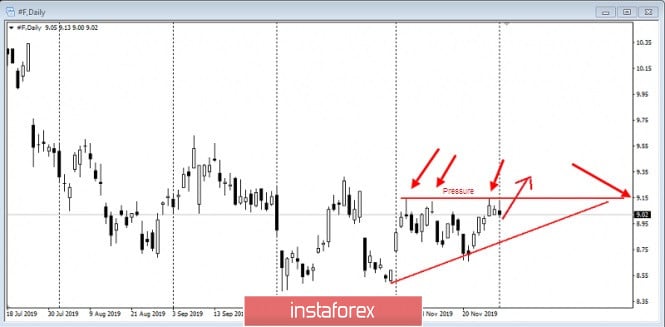
| Ford - the company of cars of the future! Posted: 03 Dec 2019 02:04 AM PST Unveiled at the 2019 Los Angeles auto show, the Mustang Mach-E marked the beginning of Ford's electric cars. The company will confirm its breakthrough in this direction by releasing additional electrically powered models in the coming years. One of its top engineers says it's only a matter of time before the conventional two-door Mustang joins a growing arsenal of zero-emission models. "I think if you look into the future - no one knows for how long, but - the market will eventually move to electric cars," Ron Heiser said, chief engineer at Mach-E Ford. Ford has developed the platform that underpins the Mach-E specifically for electric vehicles. It has a modular design so it can be made longer or shorter, accommodate rear-wheel or all-wheel drive options and accommodate different types of batteries. Ford could use this as the basis for an electric Mustang. The company is focused on launching Mach-E into production by the end of 2020. But that doesn't mean all-electric cars built on the Mach-E platform will carry the legendary nameplate. "It's not necessary to indicate the name Mustang for this, but we chose the first car on this platform, which will be the Mustang," he explained. The rejection of the Mustang nameplate is likely to mean that much more attention will be paid to comfort and practicality than performance. The Mustang Mach-E platform is just part of Ford's puzzle. We know that the company is actively developing an electric truck F-150, in the architecture of which the body will be on the frame. Its Lincoln division is expected to build an electric SUV using technology sourced from startup Rivian. And Ford will borrow the modular architecture developed by Volkswagen to create at least two electric models for the European market. Details of the following Ford electric models remain a secret. Confirmation of this positive news is the technical analysis of the market for Ford shares: Since the shares are trading on the long-term, the monthly chart shows a global breakthrough of a strong bullish momentum at the beginning of 2019, on the weekly and daily chart, technical analysis indicates the pressure of the platform at the price of 9.15. We recommend working on the increase with the first breakthrough target of 9.15 and the second - 10.65. Good luck with trading and control the risks! The material has been provided by InstaForex Company - www.instaforex.com |
| You are subscribed to email updates from Forex analysis review. To stop receiving these emails, you may unsubscribe now. | Email delivery powered by Google |
| Google, 1600 Amphitheatre Parkway, Mountain View, CA 94043, United States | |





No comments:
Post a Comment