Forex analysis review |
- Control zones for GBP/USD on 12/10/19
- Forecast for EUR/USD on December 10, 2019
- Forecast for GBP/USD on December 10, 2019
- Forecast for AUD/USD on December 10, 2019
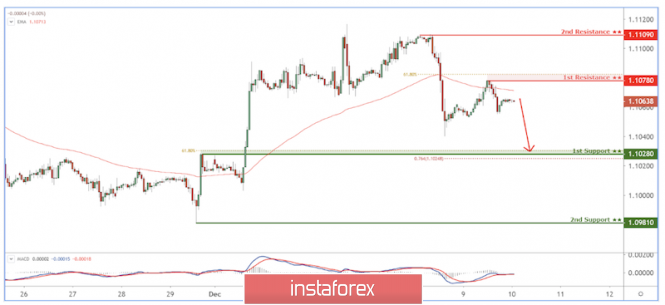
- EUR/USD reacting below resistance, potential drop!
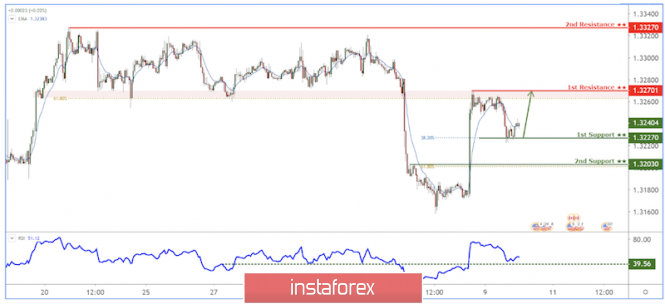
- USD/CAD Bounce above support!
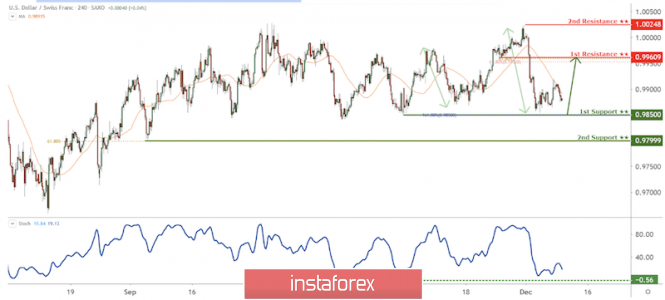
- USD/CHF approaching support, potential bounce!
- USD/CHF approaching support, potential bounce!
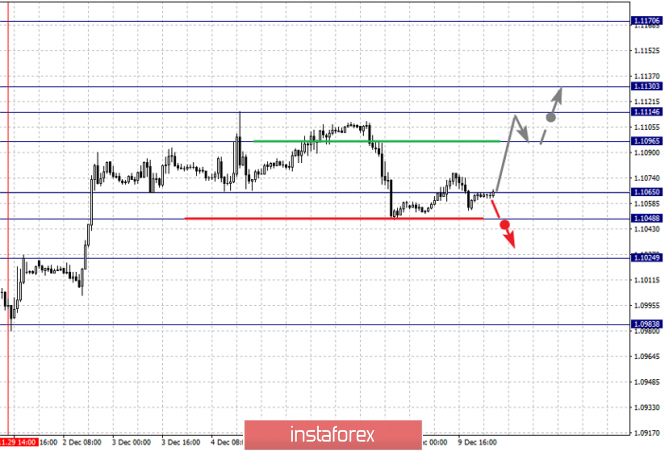
- Fractal analysis for major currency pairs on December 10
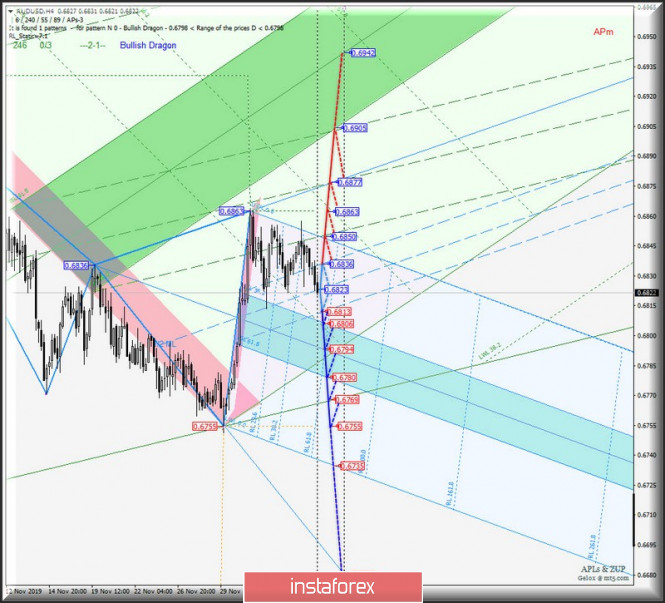
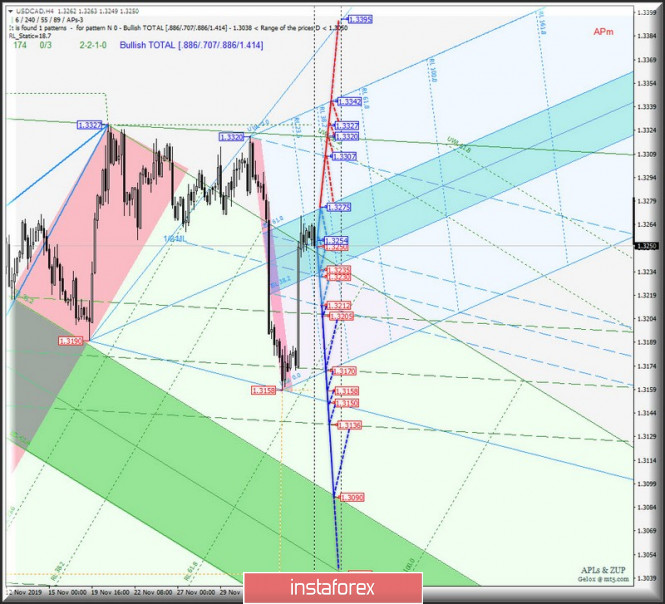
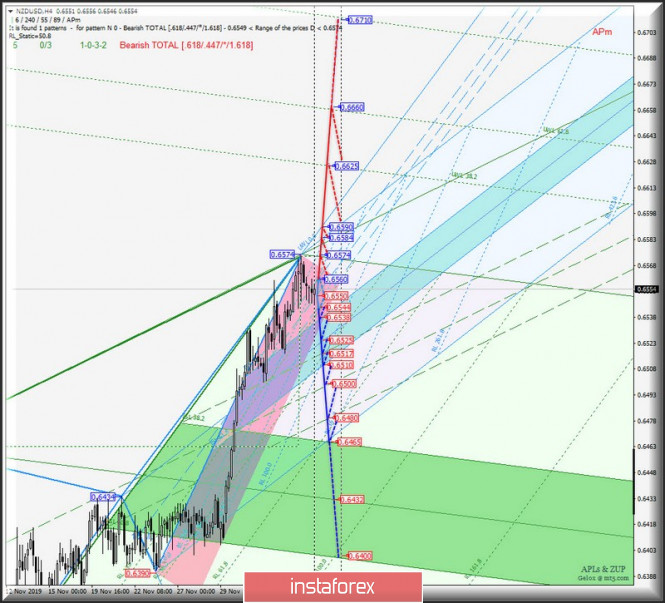
- Comprehensive analysis of movement options of #USDX vs AUD/USD vs USD/CAD vs NZD/USD (H4) for December 10
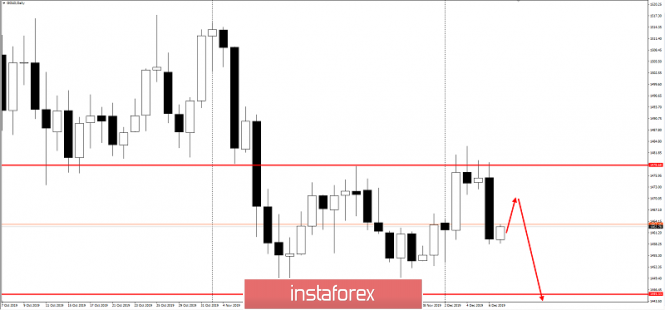
- Plans for gold
- EUR/USD. December 9. Results of the day. China takes a cue from the US and says it is ready to make a deal
- GBP/USD. Pound awaits Britain's GDP and YouGov's final verdict
- EUR/USD: euro bulls don't have significant advantages to confidently move forward, but are in no hurry to raise the white
- Don't put a finger in the pound's mouth
- EURUSD and USDJPY: Germany's foreign trade data surprised. Japanese economic growth better than preliminary estimate
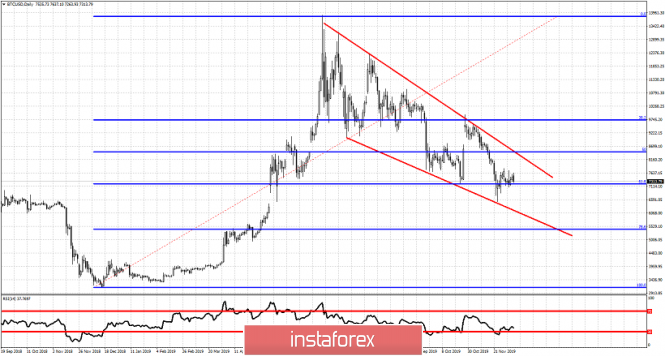
- Bitcoin remains trapped inside the downward sloping wedge pattern.
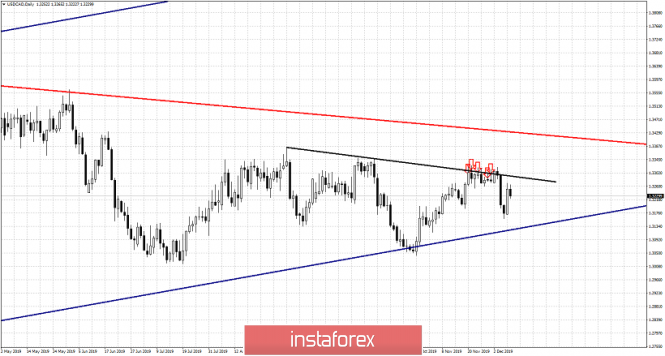
- What now for USDCAD?
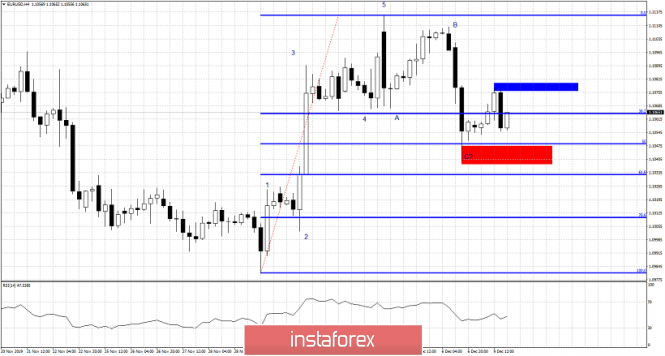
- Is the correction in EURUSD over?
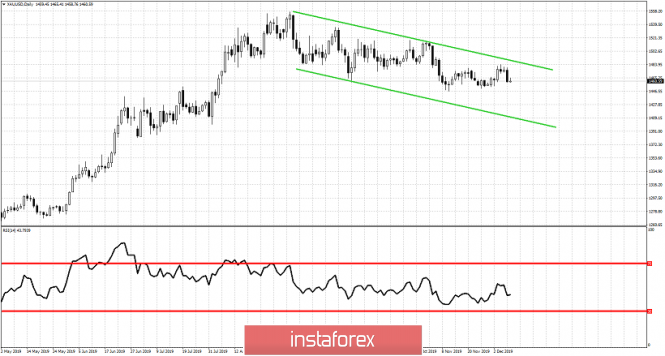
- Directionless start of the week for Gold price
- December 9, 2019 : EUR/USD Intraday technical analysis and trade recommendations.
- December 9, 2019 : GBP/USD Intraday technical analysis and trade recommendations.
- BTC 12.09.2019 - Consolidaiton mode active, potential for upside move
- Gold 12.09.2019 - Broken mini Pitchfork downward channel, potentiaal for more upside
- EUR/USD for December 09,2019 - Mini buy signal after the breakout of downward channel
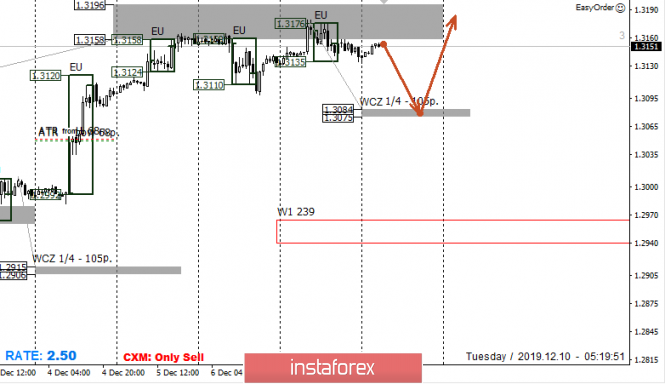
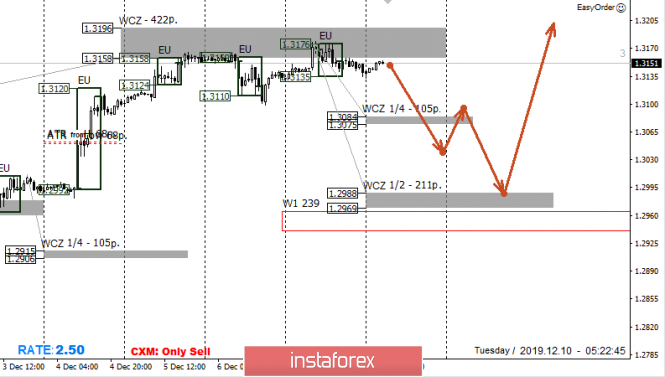
| Control zones for GBP/USD on 12/10/19 Posted: 09 Dec 2019 07:32 PM PST Over the past three days, a local accumulation zone has been formed. Developing within this zone involves buying from the lower boundary and selling from the upper ones. Moreover, it is important to understand that sales will open in the direction of corrective movement, and thus, their potential is estimated below purchases. The first target zone of decline will be the Weekly Control Zone 1/4 1.3084-1.3075. Testing of which will determine the further priority. If the pair continues to trade above the specified zone, then the probability of updating the December maximum remains 75%. An alternative model will be developed if the closing of today's trading occurs below the level of 1.3075. This will open the way for further correctional decline to Weekly Control Zone 1/2 1.2988-1.2969, which will not violate the upward medium-term impulse and will allow us to obtain more favorable purchase prices. Daily CZ - daily control zone. The zone formed by important data from the futures market that changes several times a year. Weekly CZ - weekly control zone. The zone formed by the important marks of the futures market, which change several times a year. Monthly CZ - monthly control zone. The zone that reflects the average volatility over the past year. The material has been provided by InstaForex Company - www.instaforex.com |
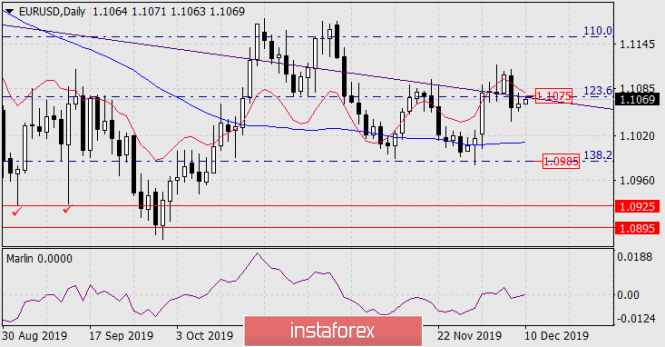
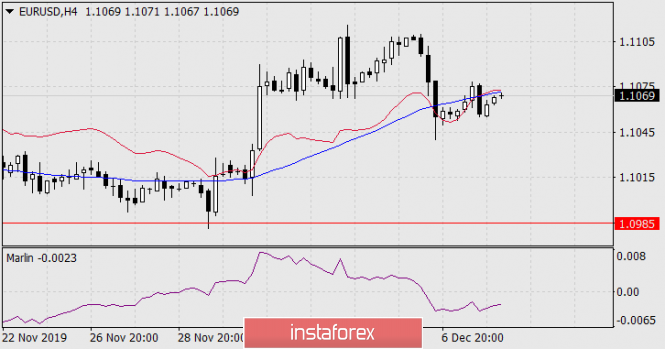
| Forecast for EUR/USD on December 10, 2019 Posted: 09 Dec 2019 06:59 PM PST EUR/USD Yesterday, the euro did not take strong movements, it only became convinced of the strength of resistance from the trend line and the Fibonacci level of 123.6% at the price of 1.1075. The signal line of the Marlin oscillator remains in the negative zone. The immediate goal of the euro is still 1.0985 - the Fibonacci level of 138.2%. The price briefly exceeded the indicator lines of balance (red) and MACD (blue) and returned under these lines with consolidation on the four-hour chart today in the Asian session. The Marlin indicator is developing in the negative trend zone. Today, the ZEW will publish estimates of sentiment in the business community of the eurozone in December, the forecast assumes moderate growth: 2.2 against -1.0 in November. Resistance at 1.1075, strengthened by the MACD line of the four-hour scale, this moderate optimism will be able to withstand. We are waiting for the price to fall further. The material has been provided by InstaForex Company - www.instaforex.com |
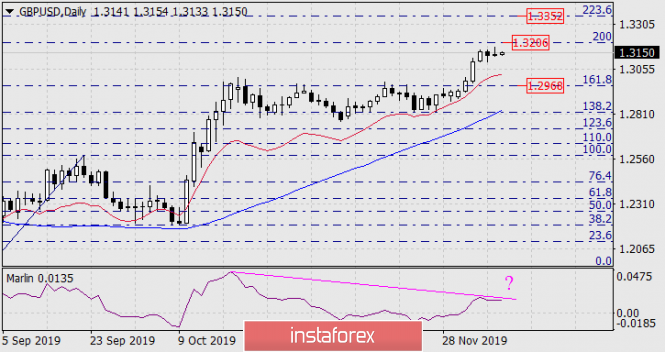
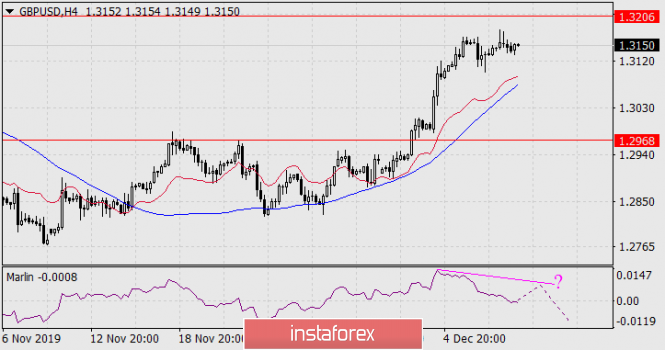
| Forecast for GBP/USD on December 10, 2019 Posted: 09 Dec 2019 06:59 PM PST GBP/USD The situation regarding the pound has not changed over the past Monday. Investors are waiting for the results of the elections to the British Parliament on Thursday, December 12th. According to preliminary surveys, the Conservative Party leads with a 14% advantage. There is still a probability that a reversal convergence by the Marlin oscillator would form on the daily chart. Increasing prices to the nearest target levels of 1.3206 or 1.3352 will not be able to completely offset this risk, the line forming the convergence will only become more gentle. This moment warns of the option of pulling down the price in the event of a short-term growth immediately after the election. But even today, the pound is waiting for good news on the economy: October GDP may show growth of 0.1% versus -0.1% in September, industrial production is expected to increase by 0.2% in October, growth in the trade balance from -12.5 billion pounds to -11.5 billion The Marlin oscillator signal line touched the boundary of the bears' territory on the four-hour chart, the price is growing visually, the 1.3206 target is likely to be reached in speed, but local growth will make it possible for the oscillator to form a full-fledged reversal signal - a divergence. A price break above the level opens the second target of 1.3352. The material has been provided by InstaForex Company - www.instaforex.com |
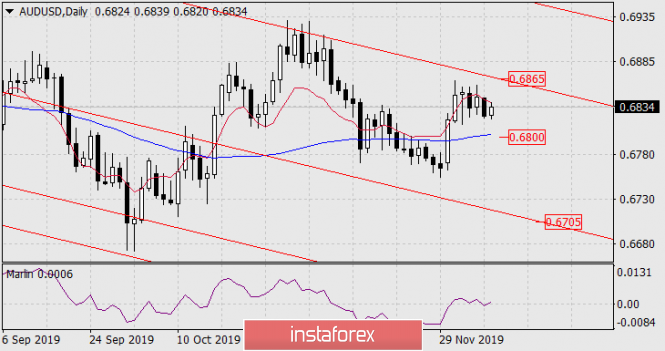
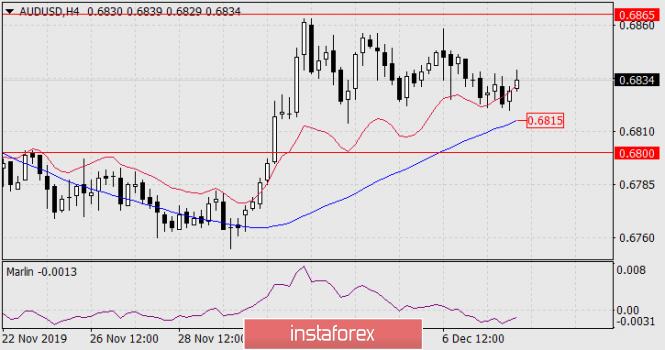
| Forecast for AUD/USD on December 10, 2019 Posted: 09 Dec 2019 06:59 PM PST AUD/USD The Australian dollar fell by 19 points on Monday, below the balance indicator line. The signal line of the Marlin oscillator moves along the boundary with the zone of negative numbers. The situation on the daily chart looks neutral - the aussie can grow to the price channel line at 0.6865 and with the same probability, a fall to the MACD line to the area of 0.6800. Leaving the price under the MACD line opens the target of 0.6705 - supporting the embedded line of the red price channel. The price is above the MACD line on the four-hour chart, but Marlin has already "dived into the water" - a line in the zone of negative numbers. A declining scenario becomes more likely here. The first signal to strengthen it will be the price drift below the MACD line (0.6815). Consolidation at 0.6800 will strengthen the downward local trend. |
| EUR/USD reacting below resistance, potential drop! Posted: 09 Dec 2019 06:51 PM PST
Trading Recommendation Entry: 1.10780 Reason for Entry: 61.8% Fibonacci Retracement Take Profit : 1.10280 Reason for Take Profit: 61.8% Fibonacci retracement, 76.4% Fibonacci extension Stop Loss: 1.11090 Reason for Stop loss: horizontal swing high resistance The material has been provided by InstaForex Company - www.instaforex.com |
| Posted: 09 Dec 2019 06:49 PM PST
Trading Recommendation Entry: 1.32270 Reason for Entry: 38.2% Fibonacci retracement, Graphical Swing low Take Profit : 1.32700 Reason for Take Profit: 61.8% Fibonacci retracement, Horizontal swing high Stop Loss: 1.32030 Reason for Stop loss: 61.8% Fibonacci retracement The material has been provided by InstaForex Company - www.instaforex.com |
| USD/CHF approaching support, potential bounce! Posted: 09 Dec 2019 06:48 PM PST
Trading Recommendation Entry: 0.9850 Reason for Entry: 161% Fibonacci extension, horizontal swing low support Take Profit : 0.9961 Reason for Take Profit: horizontal pullback resistance 61.8% Fibonacci retracement 61.8% Fibonacci extension Stop Loss: 0.9800 Reason for Stop loss: horizontal swing low support 61.8% Fibonacci retracement The material has been provided by InstaForex Company - www.instaforex.com |
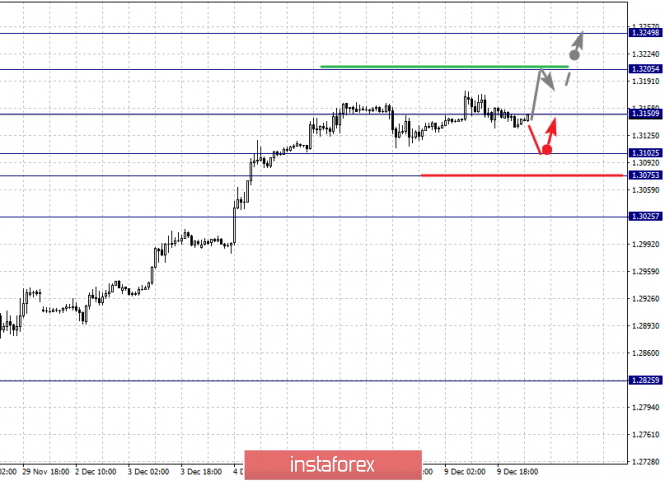
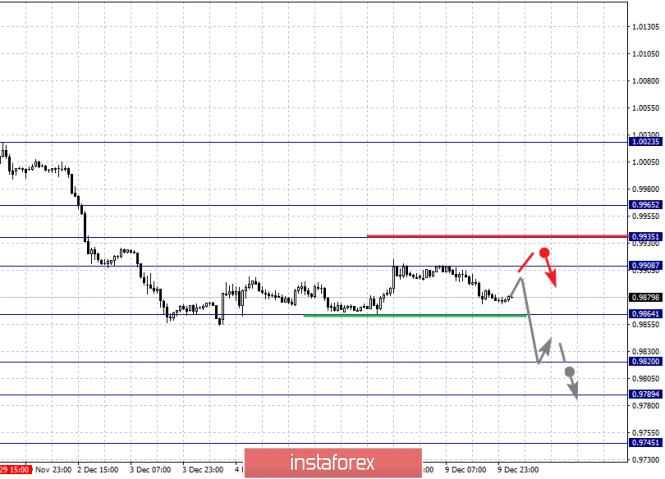
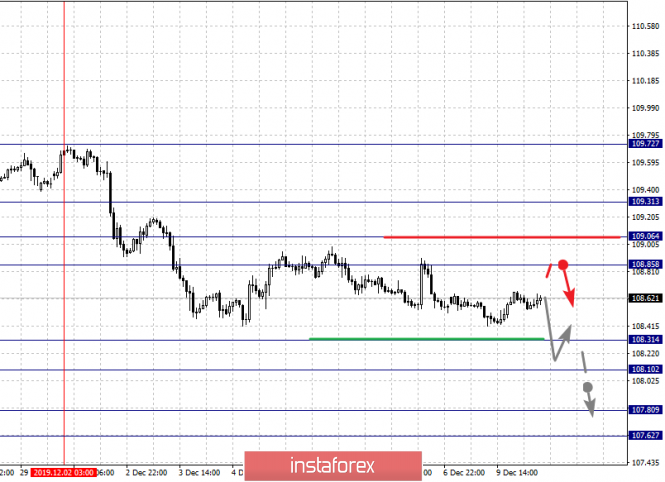
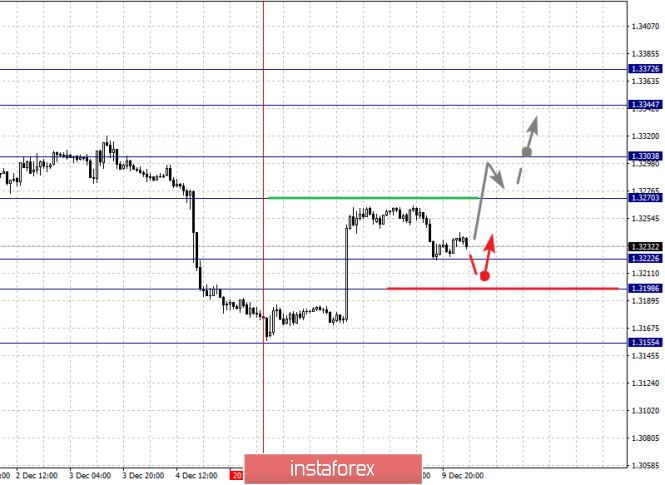
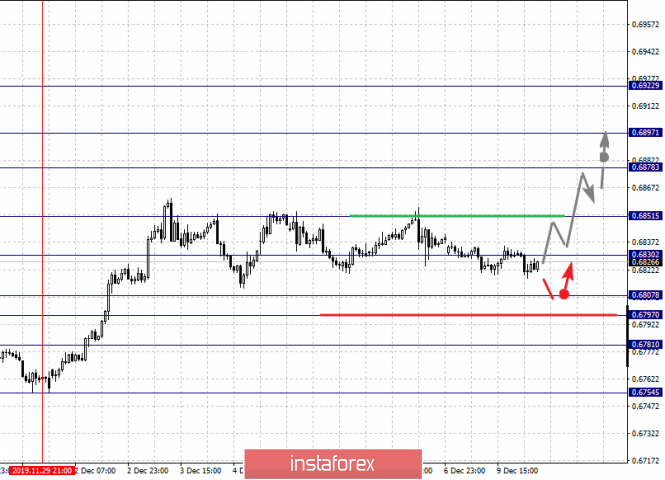
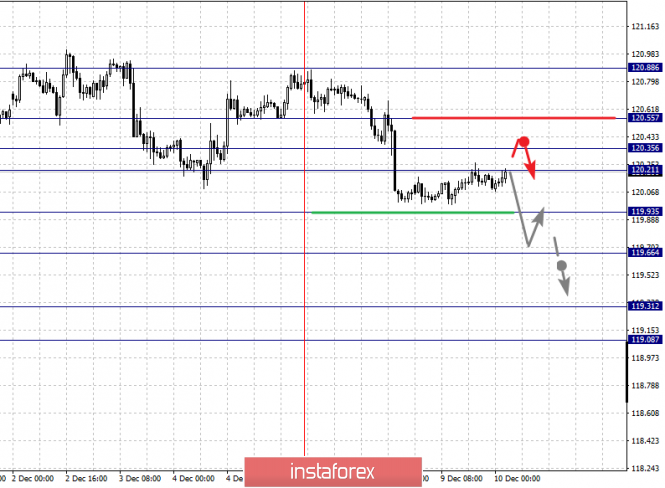
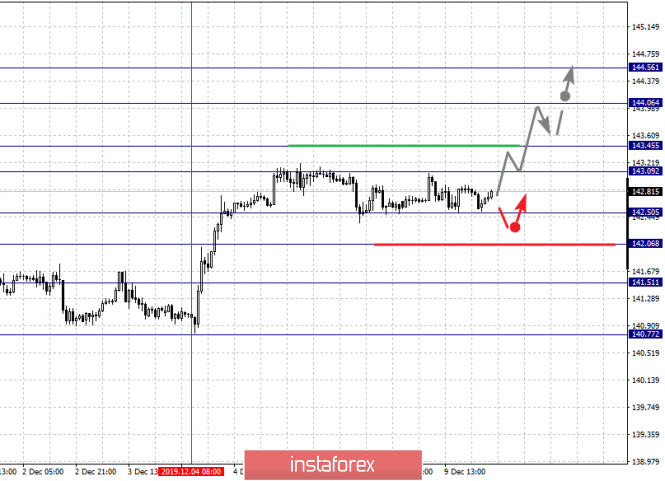
| Fractal analysis for major currency pairs on December 10 Posted: 09 Dec 2019 06:40 PM PST Forecast for December 10: Analytical review of currency pairs on the scale of H1: For the euro / dollar pair, the key levels on the H1 scale are: 1.1170, 1.1130, 1.1114, 1.1096, 1.1065, 1.1048 and 1.1024. Here, we are following the development of the upward cycle of November 29. We expect a short-term upward movement, as well as consolidation in the range of 1.1096 - 1.1114. The breakdown of the level of 1.1114 will lead to a movement to 1.1130. Price consolidation is near this level. For the potential value for the top, we consider the level of 1.1170. The movement to which is expected after the breakdown of the level of 1.1130. Short-term downward movement is expected in the range of 1.1065 - 1.1048. The breakdown of the last value will lead to an in-depth correction. Here, the goal is 1.1024. This level is a key support for the upward structure. The main trend is the formation of initial conditions for the top of November 29, the correction stage Trading recommendations: Buy: 1.1096 Take profit: 1.1114 Buy: 1.1114 Take profit: 1.1130 Sell: 1.1065 Take profit: 1.1050 Sell: 1.1046 Take profit: 1.1026 For the pound / dollar pair, the key levels on the H1 scale are: 1.3249, 1.3205, 1.3150, 1.3102, 1.3075 and 1.3025. Here, we are following the development of the upward cycle of November 27. The continuation of the movement to the top is expected after the breakdown of the level of 1.3150. In this case, the target is 1.3205. Price consolidation is near this level. For the potential value for the top, we consider the level of 1.3249. Upon reaching this level, we expect consolidation, as well as a pullback to the bottom. Short-term downward movement is possibly in the range of 1.3102 - 1.3075. The breakdown of the last value will lead to an in-depth correction. Here, the target is 1.3025. This level is a key support for the top. The main trend is the upward cycle of November 27 Trading recommendations: Buy: 1.3150 Take profit: 1.3205 Buy: 1.3207 Take profit: 1.3247 Sell: 1.3102 Take profit: 1.3076 Sell: 1.3073 Take profit: 1.3027 For the dollar / franc pair, the key levels on the H1 scale are: 0.9965, 0.9935, 0.9908, 0.9864, 0.9820, 0.9789 and 0.9745. Here, we are following the development of the downward structure of November 29. The continuation of movement to the bottom is expected after the breakdown of the level of 0.9864. In this case, the target is 0.9820. Short-term downward movement, as well as consolidation is in the range of 0.9820 - 0.9789. The breakdown of the level of 0.9789 should be accompanied by a pronounced upward movement. In this case, the potential target is 0.9745. We expect a rollback to correction from this level. Short-term upward movement is possibly in the range of 0.9908 - 0.9935. The breakdown of the latter value will lead to in-depth movement. Here, the target is 0.9965. This level is a key support for the downward structure of November 29. The main trend is the formation of initial conditions for the bottom of November 29 Trading recommendations: Buy : 0.9908 Take profit: 0.9933 Buy : 0.9937 Take profit: 0.9965 Sell: 0.9862 Take profit: 0.9825 Sell: 0.9820 Take profit: 0.9790 For the dollar / yen pair, the key levels on the scale are : 109.31, 109.06, 108.85, 108.58, 108.31, 108.10, 107.80 and 107.62. Here, we are following the descending structure of December 2. Short-term movement to the bottom is possibly in the range 108.31 - 108.10. The breakdown of the last value will lead to a pronounced movement. Here, the goal is 107.80. For the potential value for the bottom, we consider the level of 107.62. Upon reaching which, we expect consolidation, as well as a rollback to the top. Short-term upward movement is expected in the range 108.85 - 109.06. The breakdown of the last value will lead to an in-depth correction. Here, the goal is 109.31. This level is a key support for the downward structure. The main trend: the formation of initial conditions for the downward movement of December 2 Trading recommendations: Buy: 108.85 Take profit: 109.04 Buy : 109.08 Take profit: 109.30 Sell: 108.30 Take profit: 108.12 Sell: 108.08 Take profit: 107.80 For the Canadian dollar / US dollar pair, the key levels on the H1 scale are: 1.3372, 1.3344, 1.3303, 1.3270, 1.3222, 1.3198 and 1.3155. Here, we are following the formation of the ascendant structure of December 5. The continuation of the movement to the top is expected after the breakdown of the level of 1.3270. In this case, the target is 1.3303. Price consolidation is near this level. The breakdown of the level of 1.3306 will lead to a pronounced movement. Here, the target is 1.3344. The potential value for the top is considered to be the level of 1.3372. Upon reaching which, we expect consolidation, also a rollback to correction. Short-term downward movement is possibly in the range of 1.3222 - 1.3198. The breakdown of the latter value will lead to the development of a downward trend. Here, the target is 1.3155. The main trend is the formation of the ascending structure of December 5 Trading recommendations: Buy: 1.3270 Take profit: 1.3303 Buy : 1.3305 Take profit: 1.3344 Sell: 1.3220 Take profit: 1.3200 Sell: 1.3196 Take profit: 1.3160 For the Australian dollar / US dollar pair, the key levels on the H1 scale are : 0.6878, 0.6851, 0.6830, 0.6807, 0.6797 and 0.6781. Here, we are following the formation of the expressed initial conditions for the top of November 29. Short-term upward movement is expected in the range of 0.6830 - 0.6851. The breakdown of the level of 0.6851 will lead to a marked development of the upward trend. Here, the potential target is 0.6878. Price consolidation is near this value. Short-term downward movement is expected in the range of 0.6807 - 0.6797. The breakdown of the last value will lead to an in-depth correction. Here, the target is 0.6781. This level is a key support for the upward structure. The main trend is the formation of expressed initial conditions for the top of November 29 Trading recommendations: Buy: 0.6830 Take profit: 0.6848 Buy: 0.6853 Take profit: 0.6878 Sell : 0.6807 Take profit : 0.6797 Sell: 0.6795 Take profit: 0.6783 For the euro / yen pair, the key levels on the H1 scale are: 120.55, 120.35, 120.21, 119.93, 119.66, 119.31 and 119.08. Here, we determined the subsequent targets for the downward movement from the local structure on December 5. The continuation of the movement to the bottom is expected after the breakdown of the level of 119.93. In this case, the target is 119.66. Price consolidation is near this level. The breakdown of the level of 119.64 should be accompanied by a pronounced downward movement. Here, the goal is 119.31. For the potential value for the bottom, we consider the level of 119.08. Upon reaching which, we expect a consolidated movement, as well as a pullback to the top. Short-term upward movement is possibly in the range of 120.21 - 120.35. The breakdown of the last value will lead to an in-depth correction. Here, the goal is 120.55. This level is a key support for the downward structure. iIts passage in price will lead to the formation of ascending initial conditions. In this case, the goal is 120.88. The main trend is the local descending structure of December 5 Trading recommendations: Buy: 120.21 Take profit: 121.35 Buy: 121.37 Take profit: 121.55 Sell: 119.93 Take profit: 119.70 Sell: 119.62 Take profit: 119.33 For the pound / yen pair, the key levels on the H1 scale are : 144.56, 144.06, 143.45, 143.09, 142.50, 142.06 and 141.51. Here, we determined the subsequent goals for the top from the local ascending structure on December 4. Short-term movement to the top is expected in the range of 143.09 - 143.45. The breakdown of the last value will lead to a pronounced movement. Here, the goal is 144.06. For the potential value for the top, we consider the level of 144.56. Upon reaching this value, we expect consolidation, as well as a pullback to the bottom. Short-term downward movement is possibly in the range of 142.50 - 142.06. The breakdown of the last value will lead to an in-depth correction. Here, the goal is 141.51. This level is a key support for the top. The main trend is the local ascending structure of December 4 Trading recommendations: Buy: 143.10 Take profit: 143.44 Buy: 143.50 Take profit: 144.06 Sell: 142.50 Take profit: 142.10 Sell: 142.04 Take profit: 141.54 The material has been provided by InstaForex Company - www.instaforex.com |
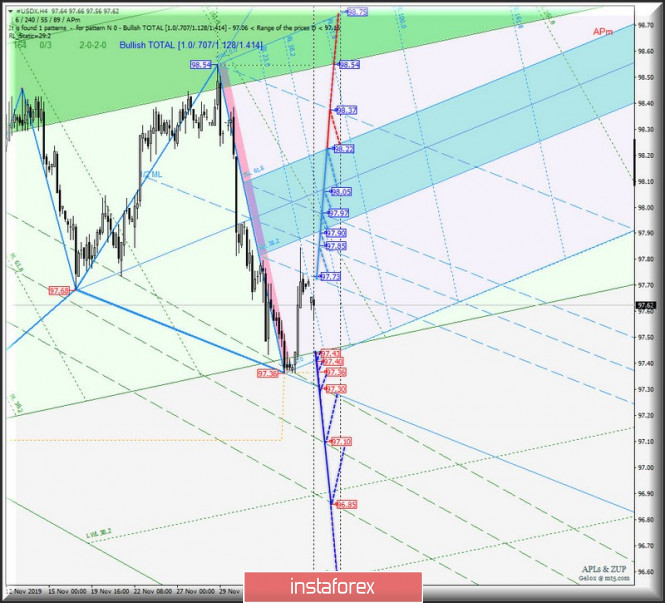
| Posted: 09 Dec 2019 06:39 PM PST Minuette operational scale (H4) "Raw" currencies - What to expect? Here's a comprehensive analysis of the development options for the movement #USDX vs AUD/USD vs USD/CAD vs NZD/USD for December 10, 2019 ____________________ US dollar Index Starting from December 10, 2019, the #USDX dollar index will begin to develop movement depending on the direction of the breakdown of the range :
Serial breakdown of support levels : - 97.43 - the initial SSL line of the Minuette operational scale forks; - 97.40 - start line SSL of the Minuette operational scale forks; - 97.36 - local minimum; - 97.30 - control line LTL Minuette; will confirm the development of the movement of the dollar index in the 1/2 Median Line channel (97.30 - 97.10 - 96.85) of the Minuette operational scale forks. In case of breakdown of the resistance level of 97.73, the #USDX movement will continue within the boundaries of the 1/2 Median Line channel (97.73 - 97.85 - 97.97) and the equilibrium zone (97.90 - 98.05 - 98.22) of the Minuette operational scale forks with the prospect of reaching the final Schiff Line Minuette (98.37). The markup of #USDX movement options from December 10, 2019 is shown on the animated chart. ____________________ Australian dollar vs US dollar Further development of the movement of the Australian dollar AUD / USD from December 10, 2019 will begin to depend on the development and direction of the breakdown of the boundaries of 1/2 Median Line channel (0.6813 - 0.6823 - 0.6836) of the Minuette operational scale forks. We look at the animated chart for the details of the movement inside this channel. In case of breakdown of the upper boundary of the 1/2 Median Line channel (resistance level of 0.6836) of the Minuette operational scale forks, the upward movement of the Australian dollar will continue to the boundaries of the 1/2 Median Line channel (0.6850 - 0.6877 - 0.6905) of the Minuette operational scale forks. On the contrary, in the event of a breakdown of the support level of 0.6813 at the lower boundary of the 1/2 Median Line Minuette channel with a subsequent breakdown of ISL38.2 Minuette ( 0.6806 ), the AUD / USD movement will continue in the equilibrium zone (0.6809 - 0.6794 - 0.6780) of the Minuette operational scale forks with the prospect of reaching the control line LTL (0.6769) of the Minuette operational scale forks and local minimum 0.6755. The markup of AUD/USD movement options from December 10, 2019 is presented on the animated chart. ____________________ US dollar vs Canadian dollar The development of the movement USD / CAD and will be determined by the direction of the development and breakdown of the Canadian dollar within the boundaries of the equilibrium zone (1.3275 - 1.3254 - 1.3235) and the 1/2 Median Line channel (1.3250 - 1.3230 - 1.3212) of the Minuette operational scale forks, respectively, from December 10, 2019. The movement marking inside the 1/2 Median Line channel and the Minuette equilibrium zone is presented on the animated chart. Combined breakdown of support levels : - 1.3212 - the lower boundary of the 1/2 Median Line Minuette channel; - 1.3205 - the upper boundary of the 1/2 Median Line Minuette channel; will determine the development of the movement of the Canadian dollar in the 1/2 Median Line Minuette channel (1.3205 - 1.3170 - 1.3136) with the prospect of reaching the upper boundary of ISL38.2 (1.3090) of the Minuette operational scale forks. The breakdown of the upper boundary of ISL61.8 (resistance level of 1.3275) of the equilibrium zone of the Minuette operational scale forks will make the development of the upward movement of USD / CAD to the goals relevant : the final Schiff Line Minuette (1.3307) - control line UTL Minuette (1.3320) - local maximum 1.3327 - FSL end line Minuette (1.3342). The markup of USD/CAD movement options from December 10, 2019 is presented on the animated chart. ____________________ New Zealand dollar vs US dollar The development and direction of the breakdown of the boundaries of 1/2 Median Line channel (0.6544 - 0.6550 - 0.6560) of the Minuette operational scale forks will determine the further development of the movement of the New Zealand dollar NZD / USD from December 10, 2019. The traffic markings on the 1 /2 Median Line Minuette channel are shown in the animation chart. The breakdown of the resistance level of 0.6560 on the upper boundary of the 1/2 Median Line channel of the Minuette operational scale forks - will lead to the continuation of the development of the upward movement of NZD / USD to the targets: initial SSL line (0.6574) of the Minuette operational scale forks - control line initial SSL Minuette (0.6584) - control line UTL Minuette (0.6590) with the prospect of reaching the warning lines - UWL38.2 Minuette (0.6625) - UWL61.8 Minuette (0.6660). Alternatively, the breakdown of the lower boundary of 1/2 Median Line Minuette channel (support level of 0.6544) together with the breakdown ISL38.2 Minuette (0.6538) will lead to the continuation of the development of the movement of the New Zealand dollar within the equilibrium zone (0.6538 - 0.6525 - 0.6510) of the Minuette operational scale forks and 1/2 Median Line channel (0.6517 - 0.6500 - 0.6480) of the Minuette operational scale forks. The markup of NZD/USD movement options from December 10, 2019 is presented on the animated chart. ____________________ The review was compiled without taking into account the news background. Thus, opening trading sessions of major financial centers does not serve as a guide to action (placing orders "sell" or "buy"). The formula for calculating the dollar index: USDX = 50.14348112 * USDEUR0.576 * USDJPY0.136 * USDGBP0.119 * USDCAD0.091 * USDSEK0.042 * USDCHF0.036. where the power coefficients correspond to the weights of the currencies in the basket: Euro - 57.6%; Yen - 13.6%; Pound Sterling - 11.9%; Canadian dollar - 9.1%; Swedish Krona - 4.2%; Swiss franc - 3.6%. The first coefficient in the formula leads the index to 100 at the start date of the countdown - March 1973, when the main currencies began to be freely quoted relative to each other. The material has been provided by InstaForex Company - www.instaforex.com |
| Posted: 09 Dec 2019 03:02 PM PST Good day, dear traders! It is time to turn to gold, for which there is a possibility of a large medium-term decline. Last week turned out to be very exciting for this instrument: at first, the main driver was the news on China, on which gold showed strong growth, but the week ended with a sheer drop in non-farms and a complete absorption of "Chinese" growth. It is important to note that a false breakout of the level of 1478.68, an important level for November sellers, was shown last week which confirms their strength. Therefore, I believe that in the medium term gold will decline at least to the level of 1445.33. Whether this breakout turns out to be real or false does not matter, its presence is what is of significance to us. It is also necessary to remember that there will be another Federal Reserve meeting and a decision on the interest rate on Wednesday evening, which gold will definitely react strongly to. Therefore, I believe that until Wednesday, the development of a trend for gold is unlikely. I recommend that you wait until the pullback at least half of the Friday fall, after which you can look for the opportunity to take short positions in the medium term in order to update the price mark of 1445.33. If the Friday fall is completely absorbed by buyers, this will mean that the priority has changed and the bearish scenario can be considered unfulfilled. I remind you that the day of increased volatility in gold is on Wednesday evening - the interest rate on USD, as well as the Fed conference. I wish you success in trading and big profits! The material has been provided by InstaForex Company - www.instaforex.com |
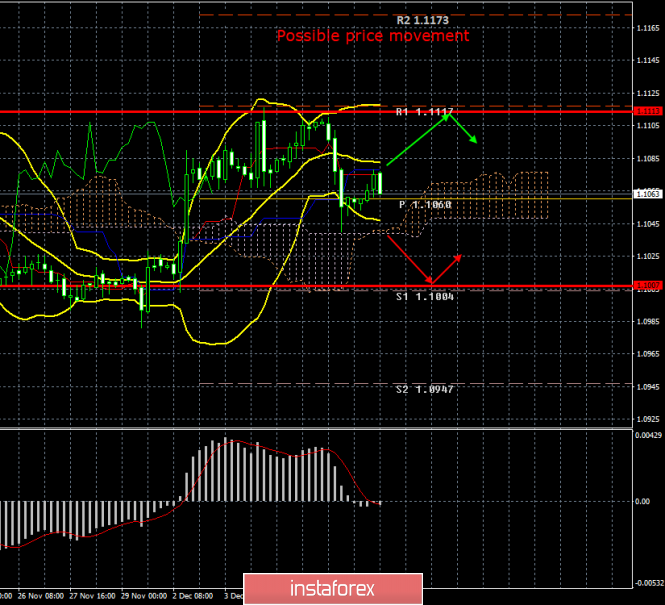
| Posted: 09 Dec 2019 03:01 PM PST 4-hour timeframe Amplitude of the last 5 days (high-low): 87p - 27p - 49p - 31p - 70p. Average volatility over the past 5 days: 53p (average). The EUR/USD currency pair adjusted on Monday, December 9, to the critical Kijun-sen line from below, rebounded from it and can now resume moving down. The pair has already formed a death cross sell pattern, but it is weak, since the price is located above the Ichimoku cloud. There was extremely weak volatility of the euro/dollar pair today, since not a single macroeconomic report was planned for the day. Moreover, there will be several diverse macroeconomic events of the largest caliber this week that traders quite reasonably wait for such events. If you list them briefly, you get the following: ECB meeting, Federal Reserve meeting, report on US inflation, December 15, Donald Trump must decide on additional duties on Chinese imports, and elections to the UK Parliament will be held on December 12. Thus, almost every day this week, traders will be waiting for some important event that could potentially send the pair up or down by 60-80 points. However, there was nothing fundamentally interesting on Monday, therefore, trading was calm. While traders calmly traded the pair in anticipation of interesting events this week, Beijing made an official statement saying that it intends to enter into a trade deal with the United States as soon as possible. It is reported that such a message from China has been associated with recent speculation that Trump may impose another $160 billion on Chinese imports on December 15. And although, in general opinion, the further escalation of the trade conflict is not beneficial for the US president himself, who has been facing impeachment for months, is under investigation in cases of abuse of office and unfair play in the election campaign, nevertheless the odious US leader goes all-in. Assistant Minister of Commerce of China Ren Hongbin said: "We want countries to move forward on the basis of equality and mutual respect, taking into account each other's interests and ultimately come to an agreement that satisfies both sides." In fact, this message from the assistant minister of Commerce causes both tears of laughter and sadness at the same time. It is surprisingly similar to statements by US President Trump when asked about progress in negotiations between the countries. Only Trump can say that the "negotiations are successful" despite the fact that no one is watching any progress. Only Trump can impose duties against China while declaring that the president of this country, Xi Jinping, is his friend and "in general a very smart guy." Only Trump can declare that he "wants to conclude an agreement with Beijing" and immediately pass two laws (Hong Kong law and Uyghur law), which are unambiguously regarded by China as interference in the country's domestic policy. It seems that now China is following the example of the United States and declares to the press that it "really wants a deal", but in practice it is not clear to anyone at what stage the negotiations are, whether the countries will make concessions, whether an agreement will be reached in the first phase before December 15. What actions will Trump take on December 15, what will happen next? This list of questions cannot be answered right now. It can only be noted that the import of goods from China to the United States decreased in November by 12.5% compared with the same month of 2018. US imports to China fell 23.3% in November. The total trade turnover between the countries lost 15.2%. Needless to say, the further escalation of the trade conflict will lead to an even greater drop in these numbers, which will pull other figures of the world economy. As for the prospects for the EUR/USD currency pair, in our opinion, they remain the same, that is, extremely non-optimistic. We still do not see a reason as to why the European currency could be in high demand among traders. Corrections, during which the euro is growing, happen from time to time, but this is not a trend growth, but a correction. Already this week, we will be able to find out what actions the ECB is planning for the coming months, what kind of attitude Christine Lagarde has, who has already stated "the need for structural changes" and pointed to the weakness of the EU economy. By and large, the ECB meeting is the most important and significant event this week. There is nothing to expect from the Fed now. Recent macroeconomic reports from across the ocean should have reassured FOMC members if they were even a little nervous. Recent statements by Jerome Powell clearly indicate that the regulator is taking a break from the monetary easing cycle. Thus, all attention to the ECB meeting and the speech of Christine Lagarde. On the other hand, what positive things can euro buyers hear at the press conference? Trading recommendations: The EUR/USD pair has taken a big step towards a new downward trend. It is advised to wait until the Ichimoku cloud has been overcome before opening short positions. In this case, the death cross will intensify, and bears will be able to sell euro/dollar pair while aiming for 1,1007. It is recommended to resume purchases of the euro in case traders reverse consolidate above the critical line. Explanation of the illustration: Ichimoku indicator: Tenkan-sen is the red line. Kijun-sen is the blue line. Senkou Span A - light brown dotted line. Senkou Span B - light purple dashed line. Chikou Span - green line. Bollinger Bands Indicator: 3 yellow lines. MACD indicator: Red line and bar graph with white bars in the indicator window. Support / Resistance Classic Levels: Red and gray dotted lines with price symbols. Pivot Level: Yellow solid line. Volatility Support / Resistance Levels: Gray dotted lines without price designations. Possible price movement options: Red and green arrows. The material has been provided by InstaForex Company - www.instaforex.com |
| GBP/USD. Pound awaits Britain's GDP and YouGov's final verdict Posted: 09 Dec 2019 03:01 PM PST December 10 is an important day for the pound: release of data on the growth of the British economy, and at the end of the US session, YouGov will publish its latest public opinion poll, conducted by a certain methodology, taking into account the specifics of the national electoral system. In addition, we will find out data on the growth of industrial production in the UK - these figures can also affect the general mood of traders. In other words, traders of the GBP/USD pair will feel the turbulence of increased volatility tomorrow, especially if the real numbers do not match the predicted ones. Let me remind you that at its November meeting, the English regulator lowered its forecasts for the main economic indicators. The GDP growth for the next year was reduced from 1.3% to the lowest level over the past ten years, 1.2%, and in 2021 - from 2.3% immediately to 1.8%. The Bank of England also lowered its inflation forecast - according to its members, its growth will slow by 1.2% by mid-2020, due to lower prices for oil and regulatory restrictions on electricity and water tariffs. The British GDP indicator has been in the negative area (on a monthly basis) for the second consecutive month: the indicator reached -0.2% in August and -0.1% in September. Data for October will be released tomorrow. According to preliminary forecasts, the volume of GDP will grow by 0.1% in monthly terms, and slow down to zero in quarterly terms. If the real numbers coincide with the predicted values, they are unlikely to inspire the GBP/USD bulls to conquer new price heights. Mixed dynamics are also expected for industrial production. Growth is expected (+ 0.2%) on a monthly basis, while a decline is expected (-1.2%) in annual terms. In other words, macroeconomic reports are unlikely to support the British currency tomorrow, even if they come out slightly better than expected. If the numbers are in the red zone, then the GBP/USD pair can update the weekly low by returning to the framework of the 30th figure. However, it is worth recognizing that macroeconomic statistics tomorrow in any case will play a secondary role. Regardless of what the British economy demonstrates, the reaction of the market to published releases will be short-term. After all, a survey from the YouGov research agency will be published tomorrow. This will be the last poll ahead of the early parliamentary elections, which will be held on December 12. I have to mention that the poll from YouGov is important for traders - experts of this agency use a methodology that is more adapted to the British electoral system and has a larger sample of respondent voters. This methodology made it possible to predict the collapse of Theresa May in 2017 (while other sociologists predicted her majority on the results of early elections). YouGov announced that the Conservative Party will receive strong support for the December elections at the end of November. According to preliminary estimates, the Tories will be able to form an independent majority in the House of Commons with a substantial margin of almost 40 votes. In turn, the Labour Party will be able to get no more than 210 seats, while Corbyn currently "owns" 262 votes in the House of Commons. Scottish Nationalists can count on 43 seats, while ardent opponents of Brexit - the Liberal Democrats - are forecasting only 13 seats in Parliament. If YouGov confirms the Conservatives' leadership (not nominal, but actual - according to the number of seats won in Parliament) tomorrow, then the pound will receive strong support throughout the market, including paired with the dollar. The intrigue regarding the results of this survey remains. Moreover, today traders have a cause for concern: the ICM research agency has published its data, according to which Labour support has grown to 36%, while the Conservative Party is still gaining 42% of the vote. In other words, Boris Johnson's main opponents narrowed the gap with the Tories to 6%, thereby putting pressure on the British currency. It is for this reason that the pound suspended growth today against a basket of major currencies. Such a reaction indicates that politics remains the number one priority for GBP/USD traders: if the data from YouGov disappoints, the pound will tumble to the 29th figure, regardless of how much the British economy grew in November. And vice versa - a significant gap between Conservatives and Labour eliminates the negative macroeconomic reports. Thus, by the end of tomorrow, the GBP/USD pair can either test the 32nd figure or return to the bottom of the 30th price level (with a probable entry into the 29th figure, up to 1.2940 (the middle line of the Bollinger Bands indicator on daily chart). The material has been provided by InstaForex Company - www.instaforex.com |
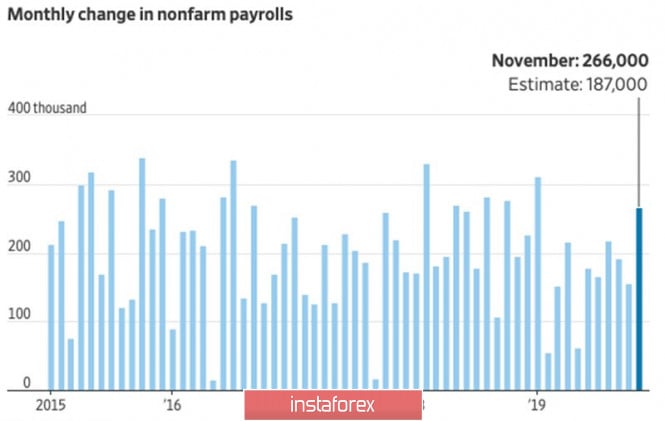
| Posted: 09 Dec 2019 03:01 PM PST Despite a slight improvement in sentiment, fear still rules the ball in the financial market. Amid expectations of the end of the US-China trade conflict, as well as the recovery of the eurozone economy, investors are interested in buying the euro, but the slightest negative forces them to curtail the longs for EUR. In particular, the decline in industrial production in Germany by 5.3% in October in annual terms has raised doubts about the fact that the locomotive of the eurozone will be able to avoid a recession. Bloomberg Economics estimates industry weakness will subtract 0.6% from quarterly GDP. A similar situation exists in relation to the greenback. Investors are ready to sell it due to concerns about a slowdown in the US economy, which will force the Federal Reserve to lower interest rates. The USD index lost almost a figure over the first four days of the past trading week amid disappointing data from the United States, and only a strong report on the US labor market for November published on Friday was able to somewhat offset this decline. Last month, employment in the non-agricultural sector of the United States grew by 266 thousand, due to which the average monthly rate for September-November increased to 205 thousand. Of course, this is slightly lower than in 2018 (223 thousand), but it is still impressive. Unemployment fell to 3.5%, having been at its lowest level since 1969. Hourly average wages rose 3.1% year on year, surpassing forecasts. Skeptics argue that there is no guarantee that low unemployment and rising wages will help boost inflation. They believe that even an increase in employment by 500 thousand is unlikely to force the Fed to talk about increasing interest rates. Meanwhile, a strong report on the state of the US labor market led to a revision of the country's GDP forecasts for the fourth quarter upward. In particular, the leading indicator from the Atlanta Federal Reserve Bank signals that the US economy will expand by 2% in October-December. They were talking about an increase of 1.5% prior to the November release on employment. The euro came under pressure due to a strong report on the US labor market along with weak statistics from Germany. However, fans of the single European currency are in no hurry to raise the white flag. Fed Chairman Jerome Powell is unlikely to tell investors anything new at the end of the last FOMC meeting this year. But ECB President Christine Lagarde may be a much smaller dove than her predecessor, Mario Draghi. It is assumed that the ECB will not yet make adjustments to monetary policy. This, along with the confident victory of Conservatives in the parliamentary elections in the UK, could support the euro. Despite the fact that the bulls on EUR/USD have no serious trump cards to confidently move to 1.1500, they are quite capable of competing for support at 1.1055, 1.1000 and 1.0960. The material has been provided by InstaForex Company - www.instaforex.com |
| Don't put a finger in the pound's mouth Posted: 09 Dec 2019 03:01 PM PST According to experts at Bloomberg, which the popular publication found out in November, the British pound will rise to $1.35 if the Conservative Party wins the election on December 12 and will collapse to $1.27 if Labour takes the majority in the new Parliament. Is it any wonder that GBP/USD soared to its highest level in seven months, the absence of sterling's reaction to the disappointing news from the labor market, inflation and the dovish rhetoric of the Bank of England, if the difference between the Tories and supporters of Jeremy Corbyn increased as X date is approaching? A few days before the election, according to opinion polls, it increased to more than ten percentage points. As a result, turning a blind eye to the bad news, the pound strengthened by 9% from the level of the August low and led the race of the best performers of the year among the G10 currencies, almost bypassing the Canadian dollar on the falling flag. Bulls on GBP/USD were not restrained by strong data on the US labor market in November. Employment outside the US agricultural sector grew by 266 thousand, unemployment fell to 3.5%, and average wages accelerated to 3.1% Y/Y. The S&P 500 index has grown by more than 1%, and its rally has recently served the dollar faithfully. This time the greenback strengthened against most major world currencies, but could not do anything with the pound. Employment dynamics outside the U.S. agricultural sector This looks illogical at first glance. A strong report on the US labor market made it possible to raise the forecast for GDP for the fourth quarter to 2%. At the same time, according to Bloomberg experts, in the second half of the year, the British economy teeters on the brink of recession. CME derivatives believe that the Federal Reserve will lower the rate from 1.75% to 1.5% no earlier than September 2020, while the number of supporters of easing monetary policy of the BoE is growing by leaps and bounds. Divergence in economic growth and monetary policy is a strong argument in favor of GBP/USD sales, but the pair is steadily growing. What is the matter? In my opinion, there was too much negativity in sterling quotes. After ardent Brexiteer Boris Johnson, who promised to take the country out of the EU or die, was given the post of prime minister, investors began to prepare for a no-deal divorce. It only became clear that they were mistaken during the second half of autumn. Sterling rose as a result of the collapse of speculative shorts. We could face the opposite situation in December. It is likely that the principle of "buy by rumors, sell by facts" will be played out, which increases the risks of, if not a serious correction, then the consolidation of GBP/USD. At the same time, the median forecast of more than 60 Reuters experts suggests that after 12 months the pound will nevertheless reach 1.35, so that any pullback will make it possible to form or build up long positions. Technically, the quotation of the analyzed pair beyond the short-term consolidation range of 1.277-1.289 contributed to the rise to 7-month highs. 88.6% and 200% of the Bat and AB = CD patterns are within easy reach. Important pivot levels are within the immediate vicinity, which increases the risk of a rebound. The material has been provided by InstaForex Company - www.instaforex.com |
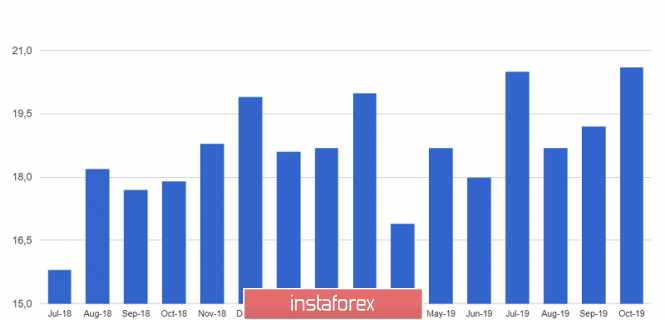
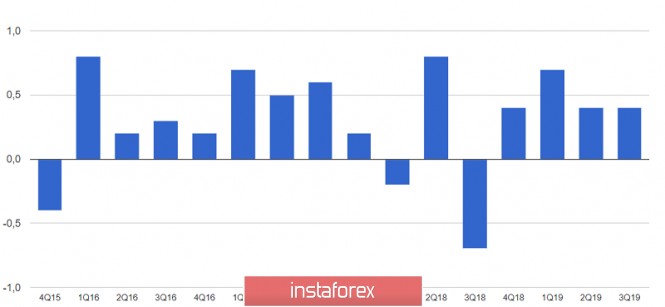
| Posted: 09 Dec 2019 03:01 PM PST The euro slightly strengthened its position against the US dollar, and German export data pleasantly surprised traders and economists, resulting in the likelihood that the country will be able to avoid a recession in the fourth quarter of this year. Positive data on foreign trade can support German economic growth at the end of this year, despite the general slowdown in global GDP. According to the report of the Federal Bureau of Statistics Destatis, the positive balance of foreign trade of Germany in October 2018 amounted to 20.6 billion euros against 19.2 in September this year. Economists had expected that the surplus would decline further and be at the level of 18.9 billion euros. Exports immediately increased by 1.2% compared to September and amounted to 119.5 billion euros, while imports remained unchanged compared to the previous month at 98.0 billion euros. Economists had forecast a decline in exports in October with a correction of 0.3%, which would lead to a drop in the overall balance. Given that important fundamental statistics are no longer expected to be released today, all attention will be shifted to central bank meetings scheduled for this week. Most likely, the Federal Reserve will take a break in the cycle of lowering interest rates, especially given the data on the labor market, which were released at the end of last week, which could increase demand for the US dollar. However, more traders are relying on the European Central Bank meeting, at which ECB Chief Christine Lagarde will announce her monetary policy program. Let me remind you that the leaders of the US Fed will hold a meeting on Wednesday, and their colleagues at the ECB on Thursday. The technical picture of the EURUSD pair remained unchanged compared to the morning forecast. Bulls were unable to show anything today at the resistance level of 1.1070, so only a breakout of this range will increase the demand for risky assets and return the trading instrument to last week's highs in the areas of 1.1115 and 1.1160. If pressure on risky assets continues, a break of support of 1.1040 will lead to a further downward correction to the area of lows 1.1000 and 1.0960. USDJPY The Japanese yen continues to be in demand as a safe-haven asset after the US dollar slightly fell late last week. Today's report that the Japanese economy was growing much faster than previously thought also supported the yen. Growth was better due to larger companies. According to data, in the third quarter of this year, Japan's GDP grew by 1.8% year-on-year, while, according to preliminary estimates, growth was expected to be only 0.2%. However, an increase in company expenses alone was not enough to offset the negative effect of a slowdown in the global economy. Let me remind you that Japan's GDP grew by 2% back in the second quarter of this year. Investment growth increased by 1.8% compared with the previous quarter against growth of 0.9% according to preliminary estimates. The material has been provided by InstaForex Company - www.instaforex.com |
| Bitcoin remains trapped inside the downward sloping wedge pattern. Posted: 09 Dec 2019 01:15 PM PST As per our previous BTCUSD analysis, price remains in a bearish trend, having formed a downward sloping wedge pattern. There were some signs that gave us hope for an upward breakout, but the inability to break above $7,820 has lead price to pull back towards $7,000.
Red lines - wedge pattern Bitcoin is trading inside a downward sloping long-term wedge pattern. Trend is bearish as long as price is below the upper wedge boundary at $8,500. Resistance at $8,500 is key, so bulls will need to break it first. Support is found at $7,075. Inability to hold above it will push price towards $6,000. We are currently at a major Fibonacci reversal area and traders should be very cautious. The material has been provided by InstaForex Company - www.instaforex.com |
| Posted: 09 Dec 2019 01:07 PM PST Last time we warned about a possible bearish reversal in USDCAD, price fell from 1.33 to 1.3160. Price since the 1.3160 low has bounced back towards 1.3270 but now we see new warning signs. Bulls need to be very careful.
Black line -short-term resistance trend line Red arrows - weakness signs Blue line- long-term channel support USDCAD is still below the black trend line resistance. As long as price is below 1.33 we remain short-term bearish looking for another test of the blue channel boundary. Short-term support is at 1.3160. If this level is broken we expect the blue channel boundary at 1.3130 to be tested. If on the other hand resistance at 1.33 is broken, we expect USDCAD to move towards 1.34 at least. The material has been provided by InstaForex Company - www.instaforex.com |
| Is the correction in EURUSD over? Posted: 09 Dec 2019 12:55 PM PST As per our latest Elliott wave analysis of EURUSD, price has most probably completed wave C down and is now ready to resume its up trend. Price is showing reversal signs around the 61.8% Fibonacci retracement of the latest rise in price.
Blue rectangle - short-term resistance EURUSD is trading above 1.1050. Price has pulled back as wave C following our analysis and we are now see a reversal effort by bulls. Support is at recent lows at 1.1039 while resistance is found at 1.1080. Breaking either level will increase the chances of the trend following the bigger direction. If the red rectangle is broken, we expect price to fall towards 1.09...On the contrary if price breaks above 1.1080, we should expect EURUSD to break above early December highs towards 1.12-1.13. This bullish wave scenario as we explained in previous posts, favors the creation of a higher low and then prices to push to new highs towards 1.12. The material has been provided by InstaForex Company - www.instaforex.com |
| Directionless start of the week for Gold price Posted: 09 Dec 2019 12:48 PM PST Gold price traded inside an $8 dollar range on Monday, without a clear direction. Medium-term trend remains bearish as price is still below the major resistance of $1,490-$1,500, while short-term trend is supported by $1,450-55.
Green lines- bearish channel Gold price remains inside the bearish channel. Channel resistance is found at $1.490 while the lower channel boundary is at $1.410-30. The $1,450-55 area is also critical support, because if this level fails to hold, then the chances of seeing $1,410 are going rise dramatically. Breaking above $1,490 will also increase the chances of seeing 2019 highs and maybe manage to produce new ones. The material has been provided by InstaForex Company - www.instaforex.com |
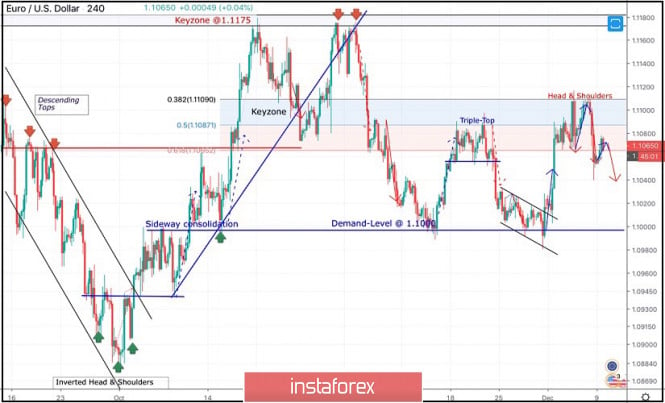
| December 9, 2019 : EUR/USD Intraday technical analysis and trade recommendations. Posted: 09 Dec 2019 09:28 AM PST
Since October 2, the EURUSD pair has been trending-up until October 21 when the pair hit the price level of 1.1175. The price zone of (1.1175 - 1.1190) stood as a significant SUPPLY-Zone that demonstrated bearish rejection for two consecutive times in a short-period. Hence, a long-term Double-Top pattern was demonstrated with neckline located around 1.1075-1.1090 offering valid bearish positions few weeks ago. Shortly After, two consecutive bearish movements were executed towards 1.1000-1.0995 where another two episodes of bullish rejection were demonstrated. That's why, the price zone of 1.1065-1.1085 where a cluster of supply levels were located (61.8% Fibo - 50% Fibo levels) prevented further bullish advancement. Thus, the EUR/USD Pair has been trapped between the price levels of 1.1000 and 1.1085 (where a cluster of supply levels is located) until Wednesday when a bullish spike was demonstrated above 1.1085 (towards 1.1110). Initial bearish rejection was anticipated around 1.1110 to bring bearish decline towards 1.1065. Moreover, atypical Head & Shoulders reversal pattern is being demonstrated with neckline located around 1.1065. Hence, a valid SELL entry was initially offered upon bearish breakout below 1.1065. Initial bearish target would be located around 1.1010. Trade recommendations : The current bullish pullback towards the recent Supply Zone of (1.1065-1.1085) should be considered for a valid SELL entry. Initial T/P levels to be projected towards 1.1045 and 1.1000, while S/L should be placed above 1.1115. The material has been provided by InstaForex Company - www.instaforex.com |
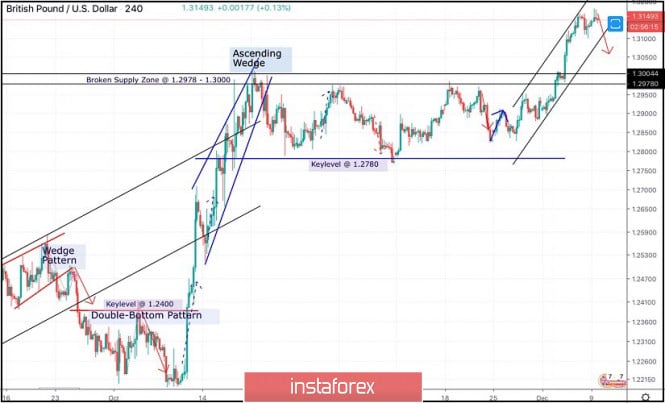
| December 9, 2019 : GBP/USD Intraday technical analysis and trade recommendations. Posted: 09 Dec 2019 07:27 AM PST
On October 21, the GBP/USD pair was demonstrating an ascending wedge reversal pattern while approaching the depicted SUPPLY-zone (1.2980-1.3000). Since Then, the GBP/USD pair has failed to achieve a persistent bullish breakout above the depicted SUPPLY-zone (1.2980-1.3000) which corresponds to a previous Prominent-TOP that goes back to May 2019. This indicated a high probability of bearish reversal around the mentioned price zone. Hence, a quick bearish movement was initiated towards 1.2780 (Key-Level) where bullish recovery was demonstrated on two consecutive visits. That's why, the GBP/USD pair has been trapped between the mentioned price levels (1.2780-1.3000) until Wednesday when bullish breakout above 1.3000 was achieved. Short-term technical outlook remains bullish as long as consolidations are maintained above 1.3000 on the H4 chart. On the other hand, the pair was recently testing the upper limit of the newly-established depicted short-term bullish channel around 1.3165. Moreover, a double-top pattern is being established around the same price level with neckline located around 1.3100. That's why, high probability of bearish reversal exists around the current price levels. Bearish closure below 1.3100 (neckline) enhances further bearish decline towards 1.2980 where bullish recovery may be anticipated. Trade Recommendations: Conservative traders may have to wait for a bearish pullback towards 1.2980-1.3000 for a valid BUY signal. Estimated bullish target would be located around 1.3120 and 1.3150. Any bearish closure below 1.2980 invalidates the bullish scenario for the short-term allowing further bearish decline towards 1.2900 then 1.2850. The material has been provided by InstaForex Company - www.instaforex.com |
| BTC 12.09.2019 - Consolidaiton mode active, potential for upside move Posted: 09 Dec 2019 06:29 AM PST Bitcoin has been trading in consolidation mode at the price of $7.520. There is chance for the upward cycle first and potential test of $7.830-$8.360. Anyway, my advice is to watch for potential selling opportunities
Slow line on the MACD oscillator turned into bull mode, which is indication for potential upside movement in the next period. Support levels are found at the price of $7.128 and $6.500. Resistance levels are found at the price of $7.830 and $8.360. The material has been provided by InstaForex Company - www.instaforex.com |
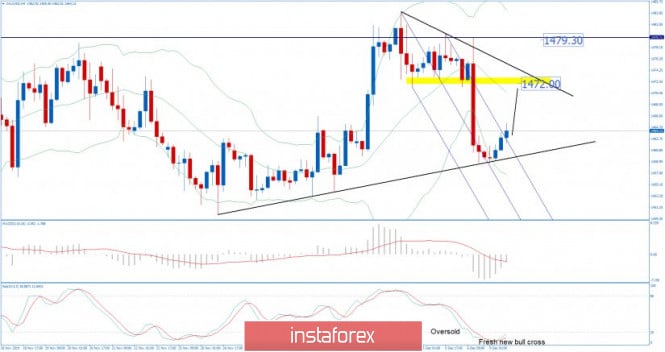
| Gold 12.09.2019 - Broken mini Pitchfork downward channel, potentiaal for more upside Posted: 09 Dec 2019 06:20 AM PST Gold has been trading upside in last 24 hours. I see that there is fresh buy signal on the Gold with potential for test of $1.472 and $1.479. Watch for buying opportunities on the dips on lower frames. Additionally, I found the breakout of the mini Pitchfork downward channel.
Stochastic oscillator is showing oversold condition and fresh new bull cross, which adds more confirmation for our bullish view. Support level is seen at the price of $1.458 The material has been provided by InstaForex Company - www.instaforex.com |
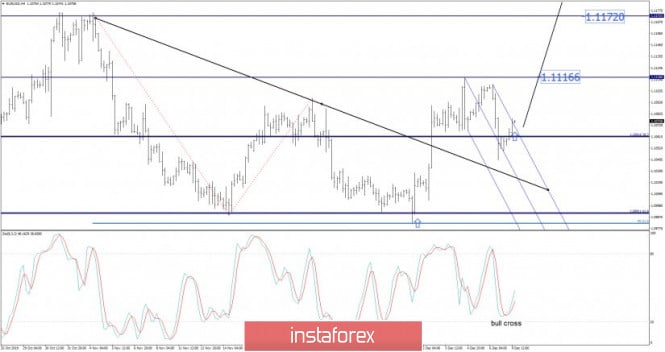
| EUR/USD for December 09,2019 - Mini buy signal after the breakout of downward channel Posted: 09 Dec 2019 06:12 AM PST EUR/USD has been trading upside in last 24 hours. I see that there is fresh buy signal on the EUR with potential for test of 1.1116 and 1.1172. Watch for buying opportunities on the dips on lower frames. Additionally, I found the breakout of the mini Pitchfork downward channel.
Stochastic oscillator is showing oversold condition and fresh new bull cross, which adds more confirmation for our bullish view. Resistance levels are seen at 1.1116 and 1.1172. Support levels are set at 1.1028 The material has been provided by InstaForex Company - www.instaforex.com |
| You are subscribed to email updates from Forex analysis review. To stop receiving these emails, you may unsubscribe now. | Email delivery powered by Google |
| Google, 1600 Amphitheatre Parkway, Mountain View, CA 94043, United States | |





No comments:
Post a Comment