
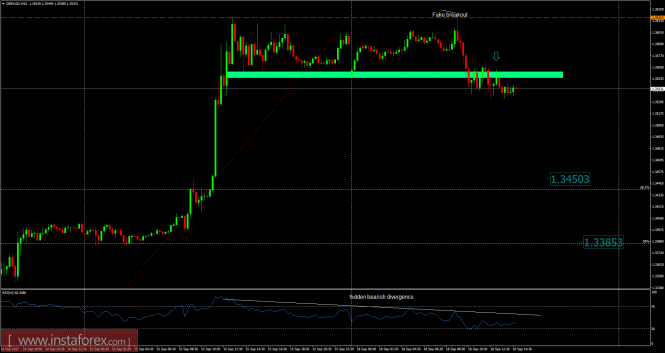
Recently, the GBP/USD pair has been trading upwards. The price tested the level of 1.3618. Anyway, according to the 15M time frame, I found a broken trading range and a fake breakout of Friday's high at the price of 1.3616, which is a sign that buying looks risky.
There is a hidden bearish divergence on the RSI oscilator, which is another sign of weakness. My advice is to watch for potential selling opportunities.
The downward targets are set at the price of 1.3450 and 1.3385.
Resistance levels:
R1: 1.3612
R2: 1.3634
R3: 1.3650
Support levels:
S1: 1.3575
S2: 1.3560
S3: 1.3530
Trading recommendations for today: watch for potential selling opportunities.
The objectives for building the downward wave:
1.3280 - 200.0% of Fibonacci
1.3225 - 161.8% of Fibonacci
Aims for building the upward wave:
1.3599 - 423.6% of Fibonacci
1.3700
General conclusions and trading recommendations:
Wave counting has suffered some changes in connection with the breakdown of the mark of 1.3270. The increase in quotations continues with targets near the estimated mark of 1.3599, which corresponds to 423.6% of Fibonacci and above about 37 figures, within 3, 5, 5, 3 (or C). Within the framework of the correction wave 4, a decline may begin with the targets near the marks of 1.3280 and 1.3225, which corresponds to 200.0% and 161.8% of Fibonacci. An unsuccessful attempt to breach the 1.3599 mark suggests the readiness to construct a corrective wave.
Analysis of wave counting:
In general, it is expected that the trading of the GBP / USD pair started from the continuation of the upward movement, adding more than 200 pp in the price and broke the level of the 36th figure in the middle of the day. It can be assumed that the currency pair remained in the stage of formation of the 5th wave, nearing its completion, the 3rd wave, 5th, 5th, 3rd (or C).
If this is the case, then a strong overbought of the indicators indicate that a re-testing of the level of 1.3600 may lead to a reversal and the beginning of the development of a downward correcting structure in the 4th wave, 5th, 5th, 3rd (or C).
The objectives for building the downward wave:
1.3280 - 200.0% of Fibonacci
1.3225 - 161.8% of Fibonacci
Aims for building the upward wave:
1.3599 - 423.6% of Fibonacci
1.3700
General conclusions and trading recommendations:
Wave counting has suffered some changes in connection with the breakdown of the mark of 1.3270. The increase in quotations continues with targets near the estimated mark of 1.3599, which corresponds to 423.6% of Fibonacci and above about 37 figures, within 3, 5, 5, 3 (or C). Within the framework of the correction wave 4, a decline may begin with the targets near the marks of 1.3280 and 1.3225, which corresponds to 200.0% and 161.8% of Fibonacci. An unsuccessful attempt to breach the 1.3599 mark suggests the readiness to construct a corrective wave.
Get Bonus No Deposite


No comments:
Post a Comment