
Forex analysis review |
- Forecast for GBP/USD on January 13, 2020
- Forecast for AUD/USD on January 13, 2020
- Fractal analysis for major currency pairs on January 13
- GBP/USD. January 11. Results of the week. UK economy continues to lose huge amounts due to Brexit
- EUR/USD. January 11. Results of the week. NonFarm Payrolls disappointed. US introduces new sanctions against Iran
- EUR/USD. Nonfarm disappointed, but the dollar keeps afloat
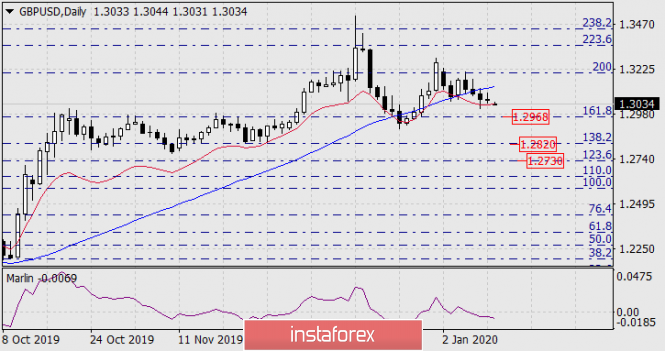
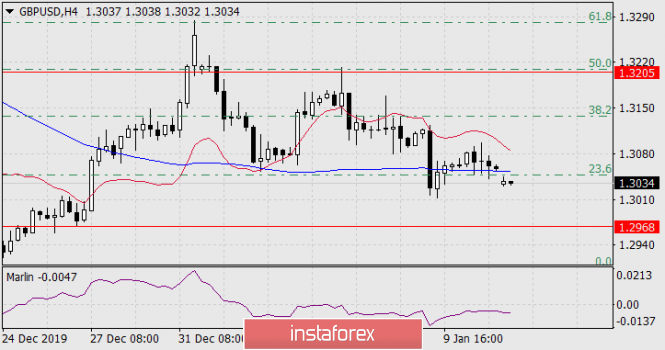
| Forecast for GBP/USD on January 13, 2020 Posted: 12 Jan 2020 07:07 PM PST GBP/USD Quotes of the British pound are held for two days on the indicator line of the balance of the daily scale in red. Overcoming it will allow the price to consistently take the three immediate goals at the Fibonacci levels: 1.2968, 1.2820, 1.2730. The Marlin oscillator is in the decline zone. On the four-hour chart, the price overcame the support of the MACD line, but did so with a gap. In this case, with a general declining trend and in the absence of warning reversal signals, the "window" serves as a harbinger of a further fall in prices, but it is not advisable for it to remain open for a long time. We are waiting for the closure of this gap and a further decline in the British pound. The Marlin oscillator is developing in a declining trend zone. The material has been provided by InstaForex Company - www.instaforex.com |
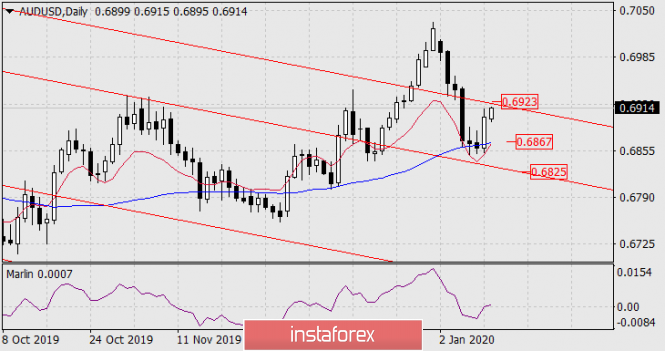
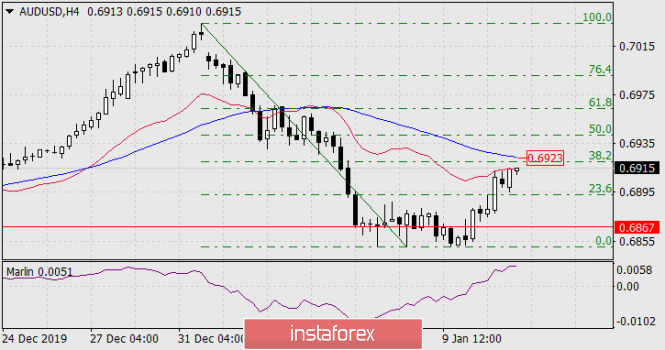
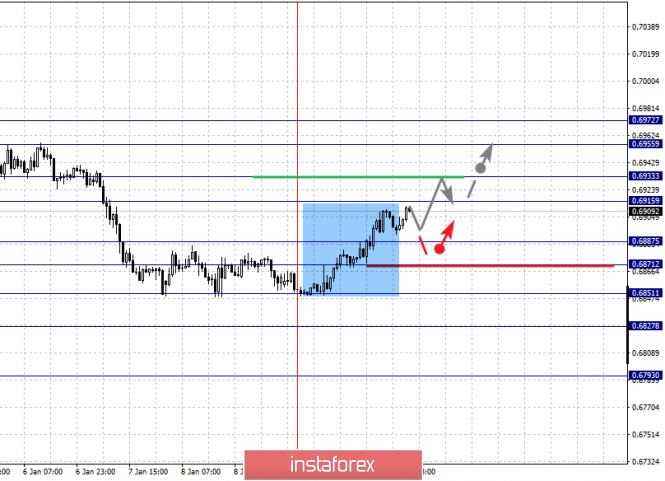
| Forecast for AUD/USD on January 13, 2020 Posted: 12 Jan 2020 07:07 PM PST AUD/USD The Australian dollar took advantage of the temporary weakness of the US dollar and corrects from the fall of January 2-8. Before the resistance of the embedded line of the price channel at around 0.6923, about 10 points remained. We are most likely to expect a downward movement from this resistance, towards 0.6867 targets - towards the MACD line, and towards 0.6825 - towards the price channel line. The signal line of the Marlin oscillator is trying to cross the boundary with the territory of the bulls, in the case of working out the specified goal and the price reversal, the signal line of the oscillator will receive a turn exactly from the boundary. On the four-hour chart, the expected target of 0.6923 coincides with a correction of 38.2% and the MACD line. The resistance is strong. The material has been provided by InstaForex Company - www.instaforex.com |
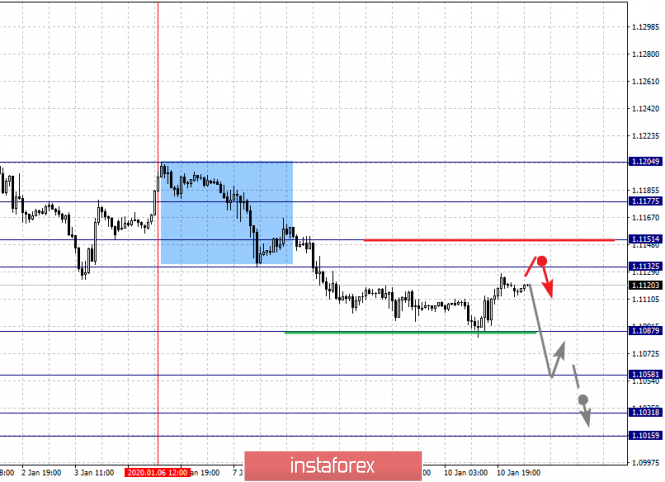
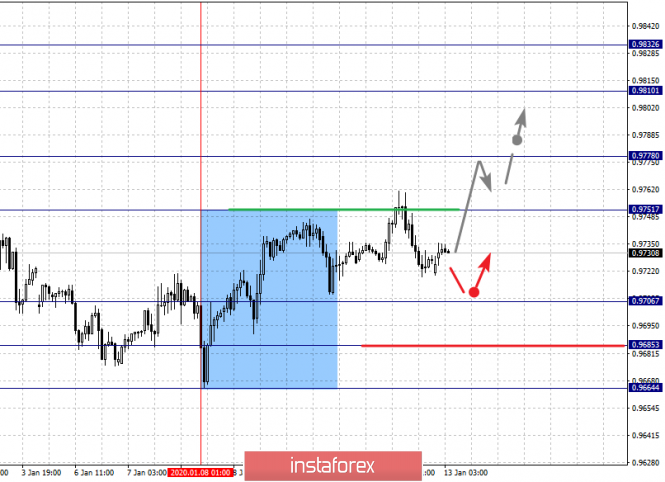
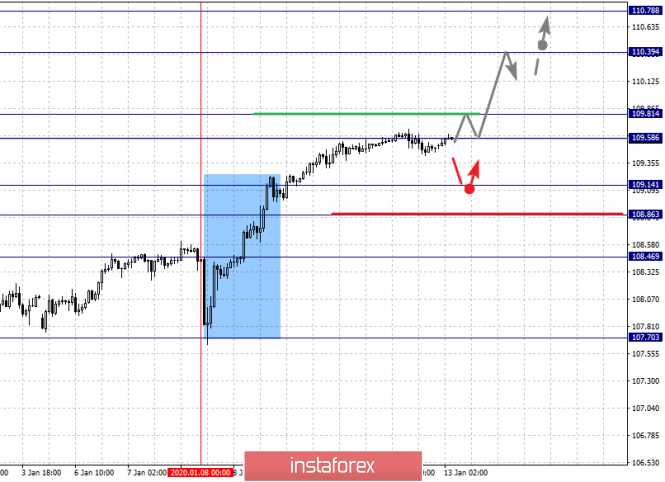
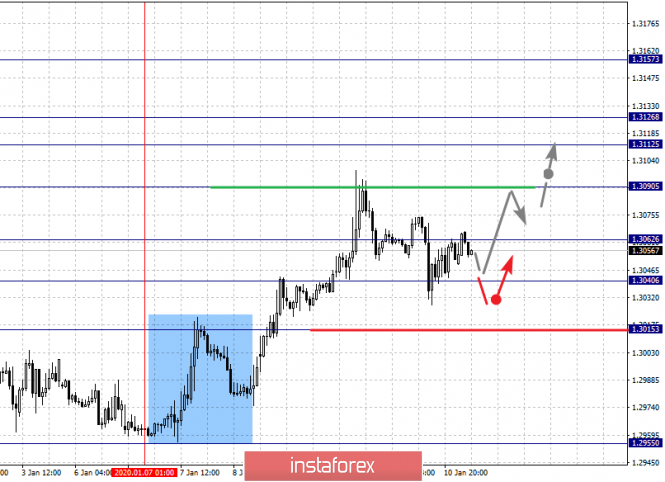
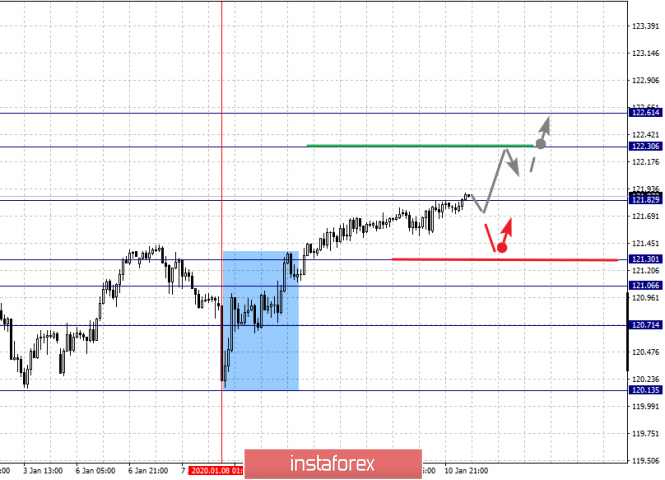
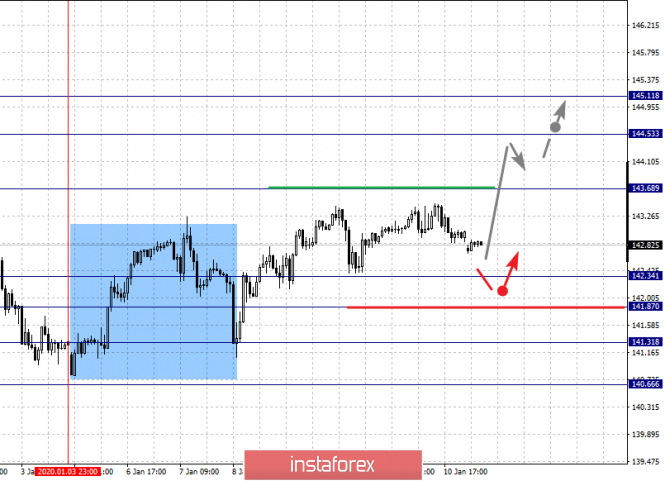
| Fractal analysis for major currency pairs on January 13 Posted: 12 Jan 2020 06:54 PM PST Forecast for January 3: Analytical review of currency pairs on the scale of H1: For the euro / dollar pair, the key levels on the H1 scale are: 1.1177, 1.1151, 1.1132, 1.1087, 1.1058, 1.1031 and 1.1015. Here, we continue to monitor the local descending structure of January 6. The continuation of the downward movement is expected after the breakdown of the level of 1.1087. In this case, the target is 1.1058. Price consolidation is near this level. The breakdown of the level of 1.1056 will lead to movement to a potential target - 1.1015. In turn, price consolidation is in the range of 1.1015 - 1.1031 and from here, we expect a rollback to the top. Short-term upward movement is possible in the range of 1.1132 - 1.1151. The breakdown of the latter value will lead to an in-depth correction. Here, the goal is 1.1177. This level is a key support for the downward structure. The main trend is the local descending structure of January 6 Trading recommendations: Buy: 1.1132 Take profit: 1.1150 Buy: 1.1153 Take profit: 1.1175 Sell: 1.1085 Take profit: 1.1060 Sell: 1.1056 Take profit: 1.1034 For the pound / dollar pair, the key levels on the H1 scale are: 1.3178, 1.3113, 1.3073, 1.3006, 1.2937, 1.2874 and 1.2838. Here, we consider the descending cycle of December 31 as the main structure. We expect further downward movement after a breakdown of the level of 1.3006. In this case, the target is 1.2937. Price consolidation is near this level. Its breakdown will lead to a movement to a potential target - 1.2838. Price consolidation is in the range of 1.2838 - 1.2874 and from here, we expect a correction. Short-term upward movement is possible in the range of 1.3073 - 1.3113. The breakdown of the latter value will lead to an in-depth correction. Here, the target is 1.3178. This level is a key support for the descending structure of December 31. The main trend is the descending structure of December 31 Trading recommendations: Buy: 1.3073 Take profit: 1.3111 Buy: 1.3120 Take profit: 1.3175 Sell: 1.3005 Take profit: 1.2940 Sell: 1.2935 Take profit: 1.2875 For the dollar / franc pair, the key levels on the H1 scale are: 0.9832, 0.9810, 0.9778, 0.9751, 0.9706, 0.9685 and 0.9664. Here, we determine the next goals from the local ascending structure on January 8. The continuation of the movement to the top is expected after the breakdown of the level of 0.9751. In this case, the target is 0.9778. Price consolidation is near this level. The breakdown of the level of 0.9780 will lead to a pronounced movement. Here, the target is 0.9810. For the potential value for the top, we consider the level of 0.9832, upon reaching which, we expect consolidation, as well as a pullback to the bottom. Short-term downward movement is possibly in the range of 0.9706 - 0.9685. There is a high probability of a reversal to the top from this range. The breakdown of the level of 0.9685 will lead to the development of a downward structure. Here, the first potential target is 0.9664. The main trend is the local ascending structure of January 8 Trading recommendations: Buy : 0.9751 Take profit: 0.9775 Buy : 0.9780 Take profit: 0.9810 Sell: 0.9705 Take profit: 0.9688 Sell: 0.9683 Take profit: 0.9664 For the dollar / yen pair, the key levels on the scale are : 110.78, 110.39, 109.81, 109.58, 109.14, 108.86 and 108.46. Here, we are following the formation of a pronounced ascending structure of January 8. Short-term upward movement is expected in the range of 109.58 - 109.81. The breakdown of the last value should be accompanied by an impulsive movement to the level of 110.39. Price consolidation is near this level. For the potential value for the top, we consider the level of 110.78, from which we expect a pullback to the bottom. Short-term downward movement is possible in the range 109.14 - 108.86. The breakdown of the last value will lead to an in-depth correction. Here, the target is 108.46. This level is a key support for the top. The main trend: building potential for the top of January 8. Trading recommendations: Buy: 109.58 Take profit: 109.80 Buy : 109.83 Take profit: 110.30 Sell: 109.14 Take profit: 108.88 Sell: 108.82 Take profit: 108.50 For the Canadian dollar / US dollar pair, the key levels on the H1 scale are: 1.3157, 1.3126, 1.3112, 1.3090, 1.3062, 1.3040 and 1.3015. Here, we are following the development of the upward cycle of January 7. We expect further upward movement after the breakdown of the level of 1.3090. In this case, the target is 1.3112. Price consolidation is in the range of 1.3112 - 1.3126. We consider the level of 1.3157 to be a potential value for the top; upon reaching this level, we expect a pullback to the bottom. Short-term downward movement is possible in the range of 1.3062 - 1.3040. The breakdown of the last value will lead to an in-depth correction. Here, the target is 1.3015. This level is a key support for the top. The main trend is the upward cycle of January 7 Trading recommendations: Buy: 1.3090 Take profit: 1.3112 Buy : 1.3126 Take profit: 1.3155 Sell: 1.3062 Take profit: 1.3042 Sell: 1.3038 Take profit: 1.3015 For the Australian dollar / US dollar pair, the key levels on the H1 scale are : 0.6972, 0.6955, 0.6933, 0.6915, 0.6887, 0.6871, 0.6851, 0.6827 and 0.6793. Here, the price forms the potential for the upward movement of January 9 in the correction of the downward cycle of December 31. Short-term movement to the top is expected in the range of 0.6915 - 0.6933. The breakdown of the last value will lead to a pronounced movement. Here, the target is 0.6955. For the potential value for the top, we consider the level of 0.6972, upon reaching this value we expect consolidation, as well as a pullback to the bottom. Short-term downward movement is expected in the range 0.6887 - 0.6871. The breakdown of the last value will have the subsequent development of the downward structure. Here, the first goal is 0.6851. As a potential value for the bottom, we consider the level of 0.6793. The movement to which is expected after the breakdown of the level of 0.6825. The main trend is the descending structure of December 31, the formation of potential for the top of January 9 Trading recommendations: Buy: 0.6915 Take profit: 0.6930 Buy: 0.6935 Take profit: 0.6955 Sell : 0.6887 Take profit : 0.6873 Sell: 0.6870 Take profit: 0.6852 For the euro / yen pair, the key levels on the H1 scale are: 122.61, 122.30, 121.82, 121.30, 121.06 and 120.71. Here, we are following the formation of the initial conditions for the upward cycle of January 8. We expect the continuation of the upward movement after the breakdown of the level of 121.82. In this case, the target is 122.30. For now, we consider the level of 122.61 to be a potential value for the upward trend; upon reaching this level, we expect consolidation. Short-term downward movement is possible in the range of 121.30 - 121.06. The breakdown of the last value will lead to an in-depth correction. Here, the goal is 120.71. This level is a key support for the upward structure. The main trend is the formation of initial conditions for the top of January 8 Trading recommendations: Buy: 121.82 Take profit: 122.26 Buy: 121.32 Take profit: 122.60 Sell: 121.30 Take profit: 121.08 Sell: 121.04 Take profit: 120.76 For the pound / yen pair, the key levels on the H1 scale are : 145.11, 144.53, 143.68, 142.34, 141.87, 141.31 and 140.66. Here, we are following the development of the upward structure of January 3, after the abolition of the downward trend. We expect further upward movement after the passage at the price level of 143.70. In this case, the target is 144.53. Price consolidation is near this value. For the potential level for the top, we consider level 145.11, from which we expect a pullback to the bottom. Short-term downward movement is possible in the range of 142.34 - 141.87. The breakdown of the latter value will lead to an in-depth correction. Here, the goal is 141.31. This level is a key support for the upward structure. The main trend is the upward structure of January 3 Trading recommendations: Buy: 143.70 Take profit: 144.50 Buy: 144.55 Take profit: 145.10 Sell: 142.34 Take profit: 141.90 Sell: 141.85 Take profit: 141.35 The material has been provided by InstaForex Company - www.instaforex.com |
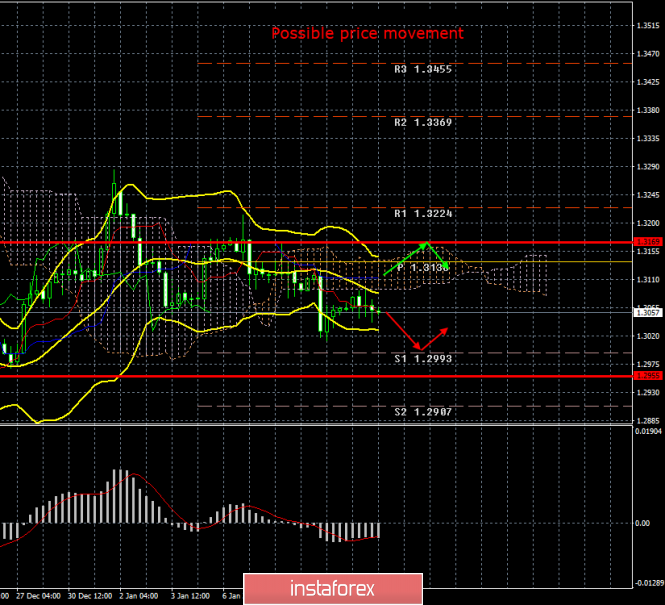
| GBP/USD. January 11. Results of the week. UK economy continues to lose huge amounts due to Brexit Posted: 12 Jan 2020 02:43 PM PST 4-hour timeframe Amplitude of the last 5 days (high-low): 106p - 111p - 118p - 89p - 111p. Average volatility over the past 5 days: 107p (high). The British pound on Friday, January 10, was trading with low (for itself) volatility. It was traded as if there were no macroeconomic publications in the United States, there were no NonFarm Payrolls or data on wages. And although we believe that statistics from across the ocean are completely not a failure, we were counting on some kind of reaction from traders. Everything is logical and reasonable in the EUR/USD pair. The US dollar plummeted, but not too much, which is fully consistent with the nature of the news. There was absolutely no reaction to Friday's news in the GBP/USD pair. Quotes of the pair in the framework of a new weak downward trend were first corrected to the Senkou Span B line, and then rebounded from it and resumed downward movement. Thus, we continue to believe that the British currency has only one path - down. At the same time, we also note the clearly weak desire of the bears to actively sell the pair now. It seems that the markets are waiting for something, perhaps a new, strong fundamental impulse. All macroeconomic statistics on Friday were ignored by traders of the pound/dollar pair. Thus, it is not surprising that the topics with the transfer of the Trump impeachment case to the Senate, with the introduction of a new list of Washington's sanctions against Iran, as well as the willingness of China and the United States to sign the first phase of the agreement at the beginning of next week, also did not affect the pair's movement. In such a situation, firstly, you need to wait for that momentum, and secondly, since there is still a downward trend, you can reject this downward movement, just remember that the bears do not have a big desire to actively sell the pound. As for the prospects of the British pound, they remain the same from our point of view. A large-scale economic study was conducted, within the framework of which it turned out that the UK economy has already lost about 3% of GDP over the years of Brexit or $170 billion. We emphasize that in three years when Great Britain remained in the EU, but wanted to leave it, the country's economy lost $170 billion. What will happen when Brexit officially enters the second phase, that is, the transition period begins? What will happen when the transition period is completed? What happens if Brussels and London fail to reach a trade agreement for 2020? So far, all these questions suggest the worst answer options for the British currency and the UK economy as a whole. Mark Carney, the head of the Bank of England, who is resigning after a month, did not become secretive in his last weeks and bluntly stated that the key rate could be lowered, the asset repurchase program expanded, and the instruments held by the regulator was not enough to stabilize the situation. We repeat: Great Britain has not even entered the transition period, and its economy is already "bursting at the seams". Thus, we believe that there are no positive expectations for 2020 regarding the pound sterling. At the very least, such a conclusion can be drawn at the moment. Of course, surprises are possible, but at the moment it's hard to even imagine what could support the British currency in 2020. Thus, we believe that the pound will be prone to fall throughout the year and may well update its multi-year lows. The period of "rising from its knees" for Britain has not even begun. By the way, official forecasts of the same economic study say that the UK economy will lose another 70 billion pounds in 2020, and the total loss over four years will amount to 261 billion dollars. Well, to all this, it is imperative to add all the geopolitical problems that London will definitely face and which it may face potentially. For example, London's biggest problem now is Scotland, which has seriously set out to hold a second independence referendum in order to avoid leaving the European Union or to return there as quickly as possible. Nicola Sturgeon does not want her country to live according to "the principles of Boris Johnson" and will require official permission from London for a referendum. However, according to some analysts, if Johnson does not grant such a right to Edinburgh, Sturgeon can go for an open riot and hold a referendum without the consent of London. Potentially, this means a new geopolitical conflict and new losses for the United Kingdom, which at such a pace could very soon turn into England. The technical picture now implies the resumption of the downward movement with targets 1.2993 and 1.2955. The goals are approximate and will be specified at the beginning of next week. Most importantly, the pound/dollar pair did not manage to overcome the Senkou Span B and Kijun-sen lines, so the downward movement now has no obstacles in its path. Trading recommendations: GBP/USD may resume downward movement. Therefore, traders are advised to continue to trade lower while aiming for the support level of 1.2993. It is recommended that purchases of British currency be returned no earlier than the price consolidation above the Kijun-sen line with the first targets of 1.3169 and 1.3224. Explanation of the illustration: Ichimoku indicator: Tenkan-sen is the red line. Kijun-sen is the blue line. Senkou Span A - light brown dotted line. Senkou Span B - light purple dashed line. Chikou Span - green line. Bollinger Bands Indicator: 3 yellow lines. MACD indicator: Red line and bar graph with white bars in the indicators window. Support / Resistance Classic Levels: Red and gray dotted lines with price symbols. Pivot Level: Yellow solid line. Volatility Support / Resistance Levels: Gray dotted lines without price designations. Possible price movement options: Red and green arrows. The material has been provided by InstaForex Company - www.instaforex.com |
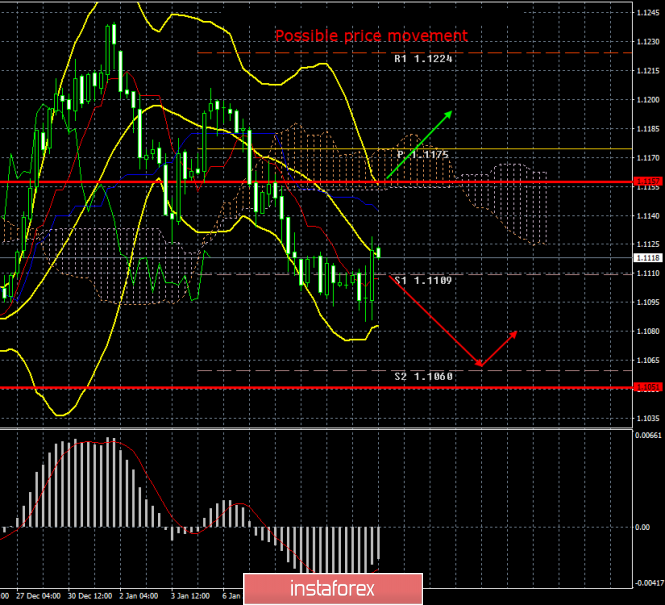
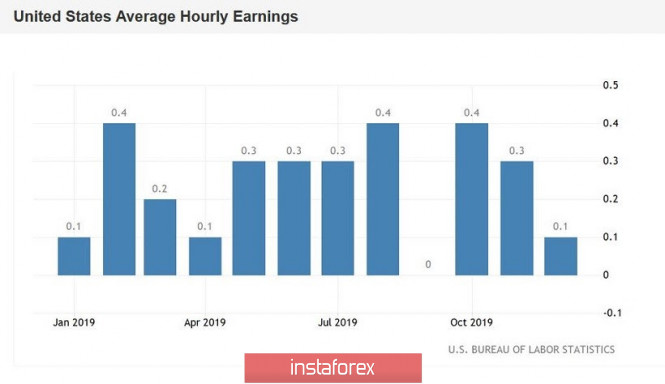
| Posted: 12 Jan 2020 02:43 PM PST 4-hour timeframe Amplitude of the last 5 days (high-low): 55p - 49p - 64p - 67p - 28p. Average volatility over the past 5 days: 53p (average). The last trading day of the week for the EUR/USD pair is an upward rollback, which, in principle, has been brewing for at least a day. The beginning of this pullback coincided with the publication of macroeconomic statistics in the United States, which, looking ahead, did not please investors in the US currency. At the same time, the US dollar lost some 25 points on the weak macroeconomic statistics from across the ocean, that is, very little, so the downward trend continues, as before, and the downward movement is most likely to resume after the correction is completed. In general, the pair's volatility in recent days has started to decline again, and the downward movement to slow down. Perhaps this is how the euro/dollar reacts when it comes close to two-year lows in the region of $1.09. About 200 points remain at this level at the moment. However, one way or another, the downward trend is still preserved, which means we expect the resumption of the downward movement. Macroeconomic statistics were published in the United States on Friday. After the ADP report on the change in the number of employees in the private sector exceeded the forecast value, traders also expected to see strong Nonfarm. In practice, everything turned out the other way around. The actual number of newly created jobs outside agriculture was 145,000 with a forecast of 162,000. The average hourly wage was 2.9% YOY, while the forecast was +3.1% YOY, and the unemployment rate remained unchanged at 3.5%. We believe that the reaction of currency traders to published statistics was absolutely logical. It is a small pullback in favor of the euro that is the most justified reaction of traders. Firstly, the NonFarm Payrolls report did not fail, but only turned out to be slightly lower than the not-so-weak forecast. Secondly, a strong report from ADP shows that the state of the labor market remains high. Thirdly, the low unemployment rate, the weakest over the past 50 years, also testifies to this. Thus, there was nothing disappointing in this statistics package. Wages also increased by 2.9%, which traders regarded as a weak increase, but until November 2018, wage growth in America was constantly below 3% in annual terms. Therefore, a slight slowdown in wage growth at the end of 2019 is also not a sign of a slowdown in the economy. Thus, the general conclusion is that statistics from overseas did not please traders, but did not disappoint; The US dollar has retreated from its highs (lows for the EUR/USD pair) and this is quite enough to consider the processing of reports completed. Meanwhile, it became known exactly what sanctions would be introduced by the United States against Iran as a result of attacks on US military bases in Iraq. Finance Minister Stephen Mnuchin said the restrictive measures will be aimed at 17 of the largest producers of steel, aluminum, copper and iron in Iran, at three companies in the Seychelles and China, as well as at one vessel that is "involved in the purchase and sale of Iranian metallurgical products" . In addition, the restrictions will apply to eight senior Iranian officials. In conclusion, Mnuchin said, President Donald Trump is about to sign a decree in the near future that aims to limit "additional sources of income used by the Iranian regime to finance and support its nuclear program, missile development, and terrorism." Donald Trump himself said that Iran was going to attack four American embassies, one of which was in Baghdad, and only the efforts of US drones that eliminated General Kassem Soleimani managed to prevent the attack. The US leader also said that no withdrawal of troops from Iraq is planned in the near future. Next week, tentatively on Friday, the case of the impeachment of Donald Trump will be transferred to the Senate. This was stated by the speaker of the lower house of Congress, Nancy Pelosi. "I asked the chairman of the judicial committee, Jerry Nadler, to be ready to submit next week a resolution on the appointment of governors and the transfer of articles on impeachment to the Senate." Thus, at the end of next week, Senate proceedings will begin and they could for Trump's impeachment. In any case, this epic will be completed, and most likely the fact that Trump will retain his post. From a technical point of view, the EUR/USD currency pair started an upward correction, which was also signaled by a MACD upward reversal. Thus, the correction can continue while aiming for the critical Kijun-sen line, from which a rebound and the resumption of a new downward trend could follow. For the last two days, a pair of lateral movement has been observed, therefore, none of the levels of volatility has been worked out. Trading recommendations: The EUR/USD pair began to adjust. Thus, now it is recommended for traders to wait until the correction is completed and resume trading on the downside with the target support level of 1.1060. It will be possible to consider purchases of the euro/dollar pair not earlier than the traders of the Senkou Span B line with the first goal of 1.1224. All goals will be specified on Monday in the morning reviews. Explanation of the illustration: Ichimoku indicator: Tenkan-sen is the red line. Kijun-sen is the blue line. Senkou Span A - light brown dotted line. Senkou Span B - light purple dashed line. Chikou Span - green line. Bollinger Bands Indicator: 3 yellow lines. MACD indicator: Red line and bar graph with white bars in the indicators window. Support / Resistance Classic Levels: Red and gray dotted lines with price symbols. Pivot Level: Yellow solid line. Volatility Support / Resistance Levels: Gray dotted lines without price designations. Possible price movement options: Red and green arrows. The material has been provided by InstaForex Company - www.instaforex.com |
| EUR/USD. Nonfarm disappointed, but the dollar keeps afloat Posted: 12 Jan 2020 02:42 PM PST US Nonfarm disappointed: almost all indicators of labor market growth in the US came out in the red zone, not reaching forecast values. Nevertheless, the dollar showed some a certain stress tolerance yesterday - although the currency weakened throughout the market, but at the same time remained almost at the same levels as before the release. The EUR/USD pair was no exception: the bulls were able to pull it into the area of the 11th figure, but the upward impulse almost completely drowned, and traders closed the trading week at 1.1118. That is, on the one hand, it cannot be said that dollar bulls completely ignored the release - the greenback to one extent or another fell in almost all pairs. On the other hand, the reaction of traders was extremely restrained, given the published data. It is likely that yesterday's release will still return to dollar bulls later, for example, at the end of January, when the Federal Reserve's first meeting this year will be held. But today, market participants clearly do not focus on the weak dynamics of the labor market, while maintaining interest in the US currency. The published data could not fundamentally reverse the fundamental picture for the pair, although in my opinion, they are clearly not in favor of the US currency. Almost all components came out worse than expected, reflecting a slowdown in the labor market. Only the unemployment rate remained the same, that is, at around 3.5%. This is a record of several decades - the last time the indicator stayed at this level in the distant 1969. However, this fact actually serves as little comfort for dollar bulls. The unemployment rate is not responding so quickly to the current situation - this indicator refers to lagging economic indicators. Therefore, a certain optimism among traders regarding the relatively low unemployment rate is premature, since more operational indicators indicate rather alarming trends. All of them went below the forecast values. Instead of an increase of 165 thousand (consensus forecast), the indicator grew by 145 thousand. But the number of jobs in the manufacturing industry has completely decreased (by 12 thousand). The indicator for the second time in a short time plunges into the negative area - it fell by 49 thousand in October. It is worth recalling that the ISM production index has been consistently decreasing for the past seven months, collapsing to the level of 47.2 points (this is a 10-year low) in December. The growth in the number of people employed in the private sector of the economy also slowed down (139 thousand with a forecast of 155 thousand, the previous value was 243 thousand). In this case, the decline is insignificant, but this factor still played a role, given the dynamics of the remaining indicators. Nonfarm's inflationary component — the level of average hourly wages — was especially disappointing. This most important indicator for the Fed was at around 0.1% on a monthly basis (the worst result since last September, when it fell to zero) and 2.9% on an annual basis (worst result since July 2018). Such dynamics are also correlated with the uncertain growth of key inflation indicators. It is worth noting here that the labor market has long been a reliable tool for the dollar. Against the backdrop of fluctuations in other key indicators, Nonfarm has always supported dollar bulls - after the spring recession last year, the US labor market recovered and kept the mark. But the numbers published yesterday amid a consistent decline in the ISM production index may subsequently undermine the greenback position. But yesterday, the market, in fact, ignored this fact, justifying the decline with seasonal, pre-holiday factors. In addition, White House chief economic adviser Larry Kudlow praised the December Nonfarm, stating that "employment rates still remain very strong." Comments by White House representatives on the dynamics of macroeconomic indicators tend to have little effect on the dollar's position - however, traders still focused on this nuance yesterday. In addition, participants in the foreign exchange market are now focused on waiting for the signing ceremony of the first phase of the US-China trade deal. It will be held early next week, while a newsletter on the text of the trade agreement will be released on January 15. At least Kudlow promised to make the text public by this deadline. Thus, the market actually ignored the alarming, in my opinion, signals from the US labor market. This made it possible for dollar bulls to hold the EUR/USD pair at the bottom of the 11th figure, preventing the development of the upward impulse. Next week, the dollar may receive additional support amid optimism regarding the prospects for trade relations between the US and China. The closest target of the downward movement is located at 1.1060 - this is the upper boundary of the Kumo cloud, which coincides with the lower line of the Bollinger Bands indicator on the daily chart. The material has been provided by InstaForex Company - www.instaforex.com |


| You are subscribed to email updates from Forex analysis review. To stop receiving these emails, you may unsubscribe now. | Email delivery powered by Google |
| Google, 1600 Amphitheatre Parkway, Mountain View, CA 94043, United States | |
No comments:
Post a Comment