
Forex analysis review |
- Forecast for EUR/USD on January 14, 2020
- Forecast for GBP/USD on January 14, 2020
- Forecast for USD/JPY on January 14, 2020
- Fractal analysis for major currency pairs on January 14
- Evening review 01/13 EURUSD. Euro chooses a direction
- GBP/USD. January 13. Results of the day. British economy: 2 steps forward, 5 steps back
- EUR/USD. January 13. Results of the day. New stumbling block in US-China Talks
- GBP/USD. Pound depressed again: Vlieghe's dovish comments and weak macroeconomic reports
- EUR/USD: euro should benefit from the end of the US-China trade war
- Bitcoin and the wedge pattern
- Short-term technical analysis on EURUSD
- Short-term Elliott wave analysis on GBPUSD
- January 13, 2020 : GBP/USD Intraday technical analysis and trade recommendations.
- January 13, 2020 : EUR/USD Intraday technical analysis and trade recommendations.
- BTC analysis for 01.13.2020 - Watch for potential drop on the BTC and second downside leg to develop
- EUR/USD for January 13,2020 - Potential for the new up move on the EUR, watch for buying opportunities
- Gold 01.13.2020 - Major support on the test and potential for upside continuation and test of $1.600
- USD/JPY – take profit!
- Pound released the "pigeons" at will
- Trading recommendations for GBPUSD for January 13, 2020
- Simplified wave analysis on EUR/USD and AUD/USD for January 13
- Trader's Diary: EUR/USD on 01/13/2019, Why there is no US - Iran war
- Everything went wrong again (review of EUR/USD and GBP/USD on 01/13/2020)
- USD/CAD bounce in progress above support!
- EUR/USD approaching support, potential for bounce!
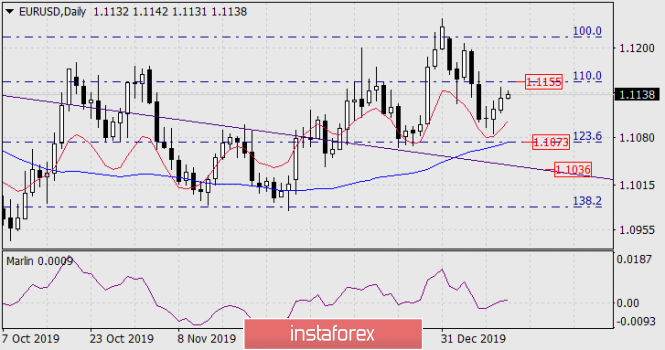
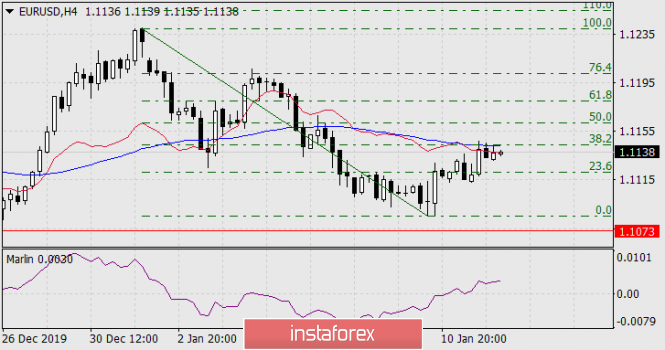
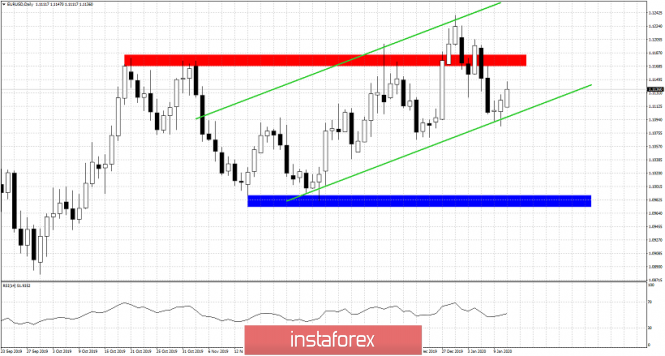
| Forecast for EUR/USD on January 14, 2020 Posted: 13 Jan 2020 07:21 PM PST EUR/USD On Monday, the euro grew by 29 points at the moment as part of the expected correction. The price received resistance from the MACD line on a four-hour chart. The line also coincides with the correctional level of 38.3%. Here, the correction can be considered completed. If the euro reverses down from current levels, the Marlin oscillator signal line on the daily chart will reverse from the boundary with the territory of an upward trend, at the moment the value of the line is 0.0008, but this penetration is not deep, a price reversal is possible. Overcoming yesterday's high may extend the growth to the Fibonacci level of 110.0% on the daily chart (1.1155). We are waiting for the euro to decline to support the MACD line and the Fibonacci level of 123.6% on the daily chart at a price of 1.1073. Overcoming the level opens the second target along the line of the price channel 1.1036. The material has been provided by InstaForex Company - www.instaforex.com |
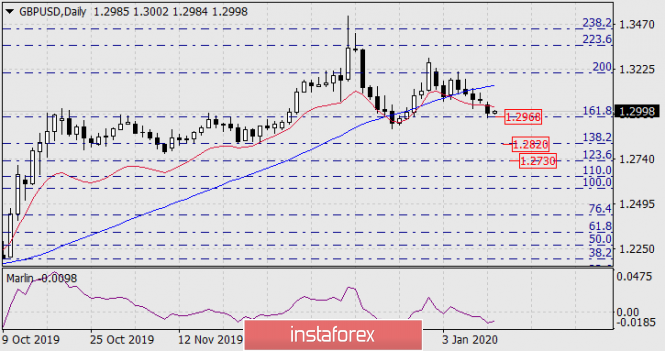
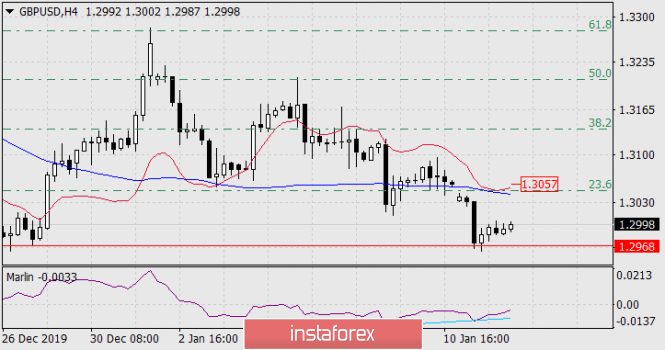
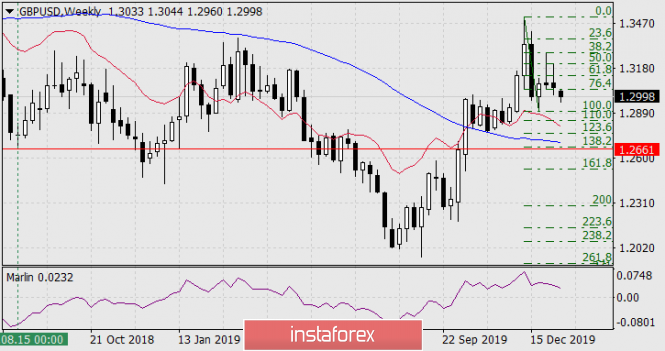
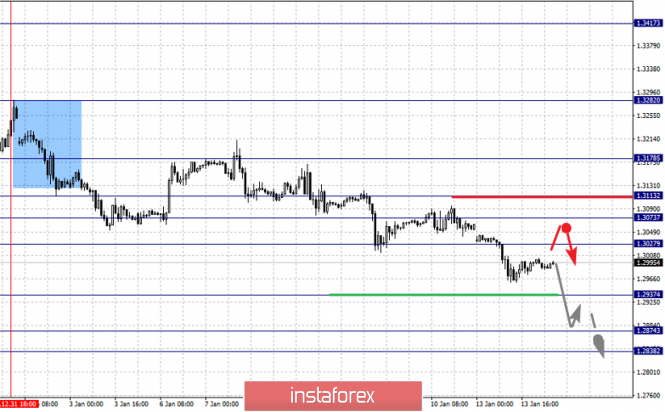
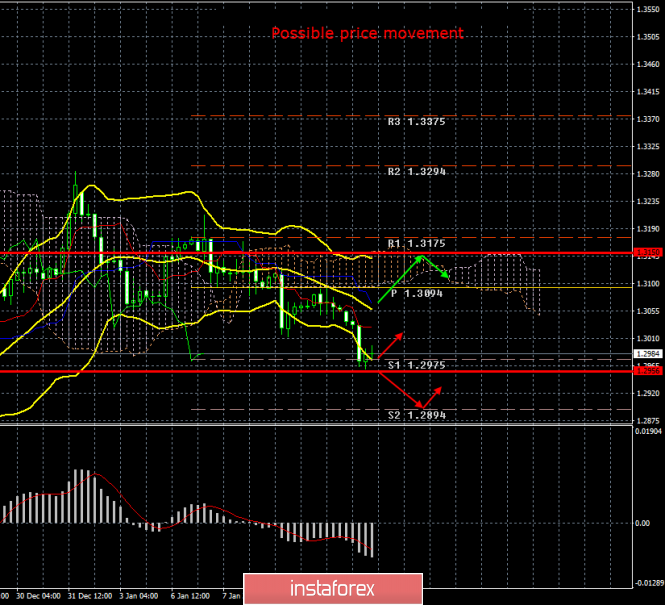
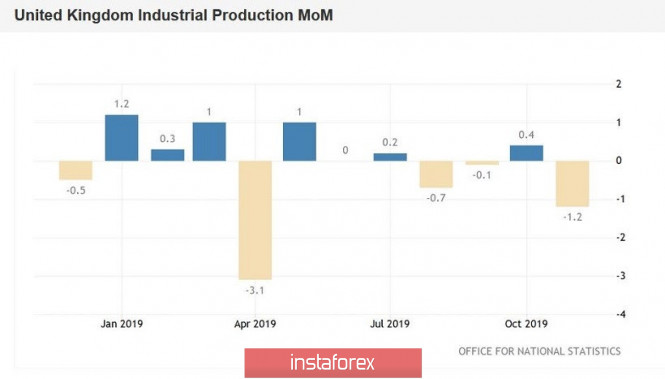
| Forecast for GBP/USD on January 14, 2020 Posted: 13 Jan 2020 07:21 PM PST GBP/USD The British pound lost 71 points yesterday due to disappointing UK economic data. Industrial production shrank by -1.2% in November against expectations of -0.1%, November GDP fell by 0.3% against the forecast of 0.0%. NIESR's UK GDP forecast for December was 0.0%. There have even been rumors in the market that the Bank of England may lower the rate as early as January 30 if key indicators continue to be weak in the future. The price reached its closest target at the Fibonacci level of 161.8% on the daily chart (1.2968), but the gap has not been closed since the opening of the week. Today, the market will have such an opportunity - to close the gap, since important British inflationary data will be released only tomorrow, and today flat data are expected for the US CPI - the forecast for the base CPI is 2.3% y/y - unchanged. On the H4 chart, the Marlin oscillator did not form a strong convergence. The upward movement may be short-term, the target 1.3057 is the low to close the opening gap of the week, after which we expect the pound to fall further with targets at 1.2820 and 1.2730 (Fibonacci levels on daily). In a slightly more distant future, until the end of the month, we are waiting for the pound to decline to the price of 1.2661 - here the Fibonacci reaction level of 138.2% converges on the weekly chart, the MACD line, the low of August 15, 2018. |
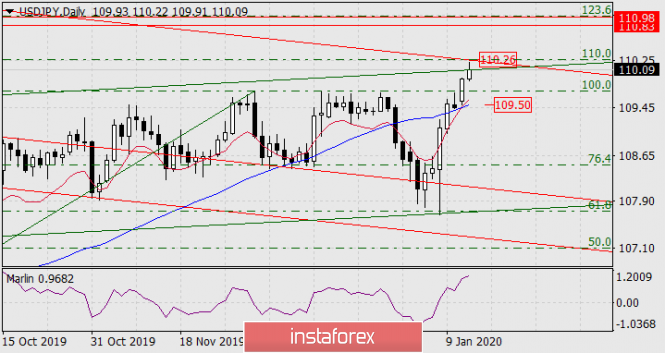
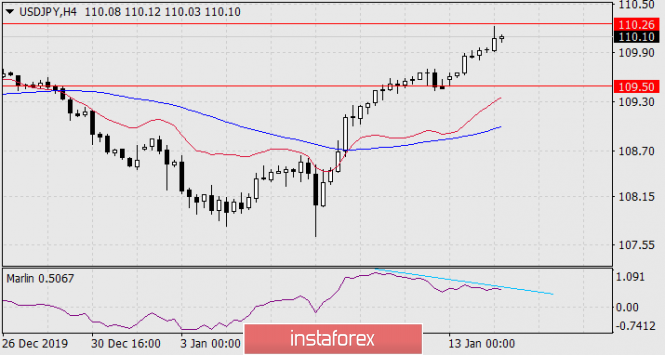
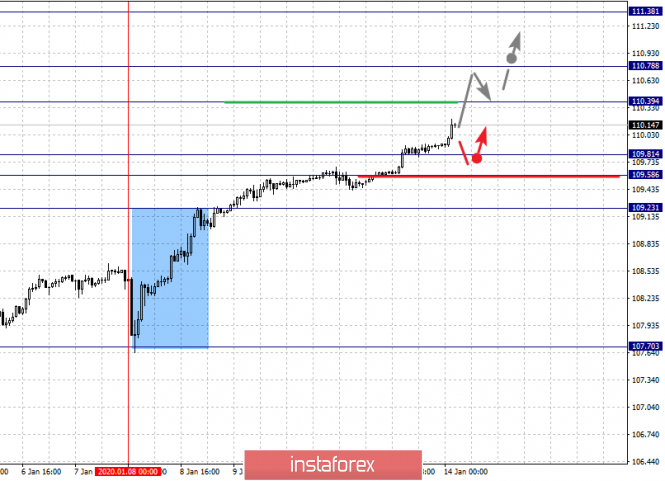
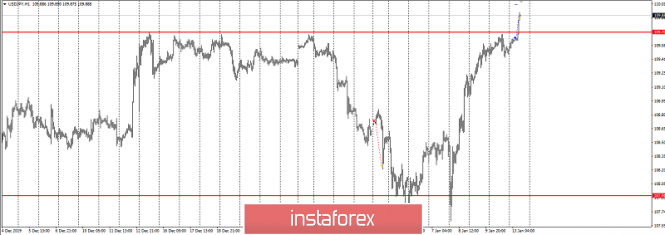
| Forecast for USD/JPY on January 14, 2020 Posted: 13 Jan 2020 07:21 PM PST USD/JPY Stock indices of the US market continue to set new records, along with them are rising Japanese indices and the USD/JPY pair. Yesterday, the S&P 500 grew by 0.70%, while the Nikkei 225 is adding a comparable 0.73% today. The China A50 Chinese stock index is up 0.40%, obviously, awaiting tomorrow's signing of the first part of a trade agreement with the United States. The United States also excluded China from the list of currency manipulators. Also, US corporate reports for the fourth quarter of 2019 are starting, forecasts are optimistic. Today, the largest banks are set to report: Citigroup (earnings forecast of $1.84 per share versus $1.61 in the third quarter), JPMorgan Chase & Co (forecast of $2.34 versus $1.98 earlier), Wells Fargo ($1.12 versus $1.21, but also good). Market growth may continue. So, if the price goes above the resistance of the red line of the price channel, we are waiting for the price in the target range of 110.83/98 formed by the extreme on November 27, 2017 and February 11, 2016. Here is the Fibonacci level of 123.6% of the growth branch from August 26 to December 2. The indicated trend line (110.26) is the upper limit of the downward price channel originating in August 2015, this is its important - overcoming the line can trigger the pair's growth by another order of two or three figures. The strength of the channel boundary is supported by the Fibonacci level of 110.0%. On the four-hour chart, the Marlin forms a divergence, perhaps before attacking the upper boundary of the price channel, the price will subside to the support of the MACD line on daily (109.50). The material has been provided by InstaForex Company - www.instaforex.com |
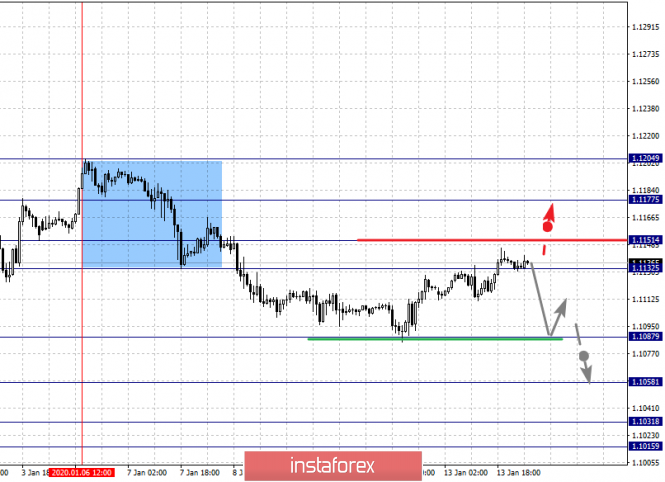
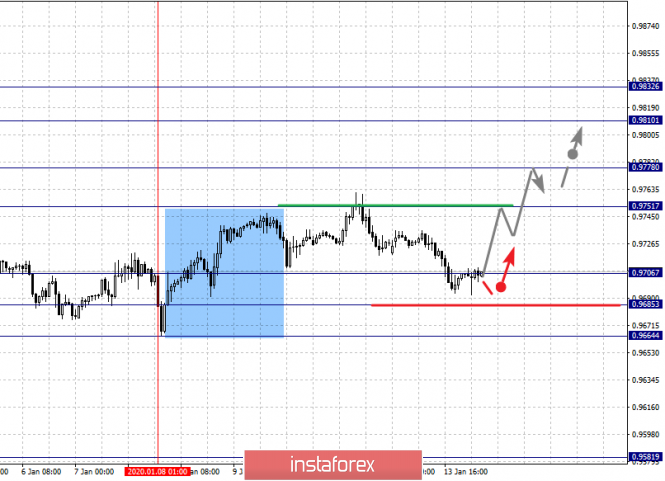
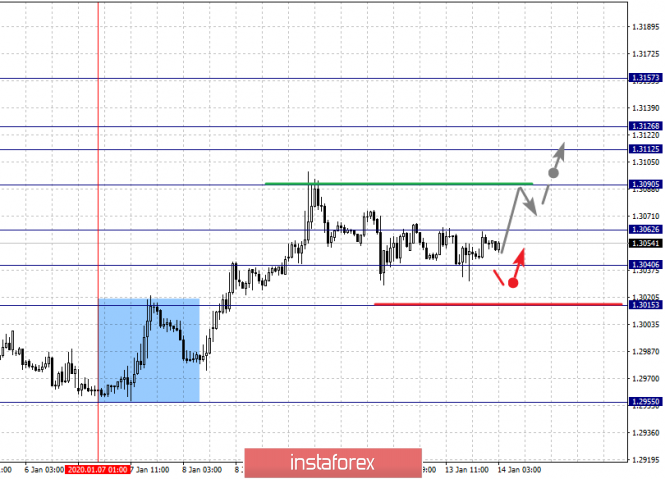
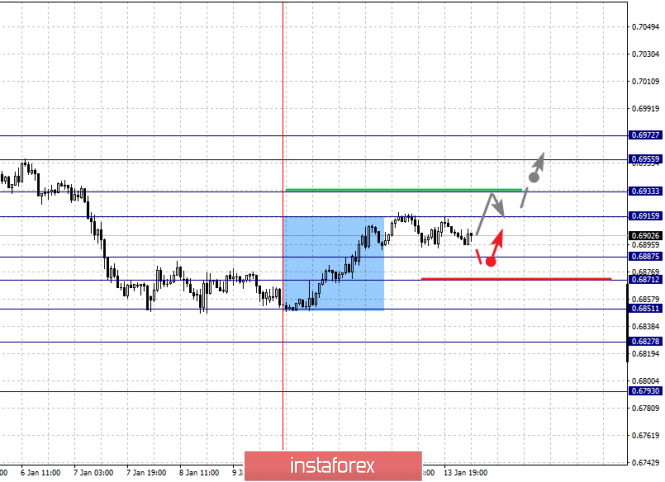
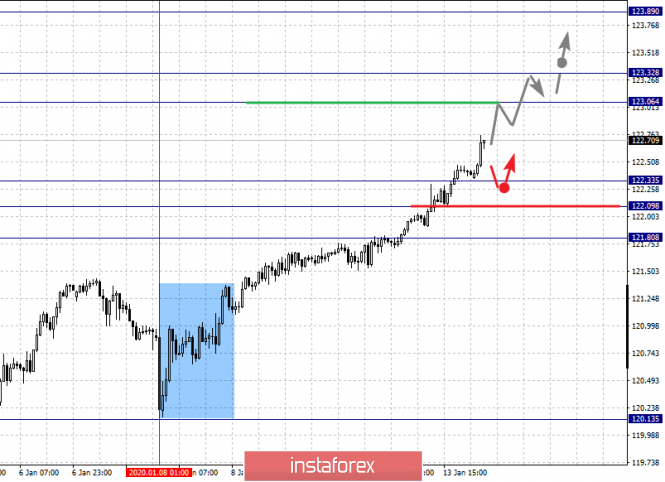
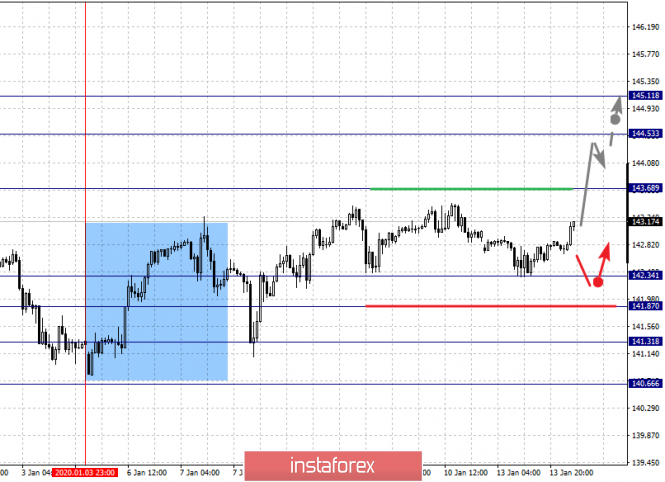
| Fractal analysis for major currency pairs on January 14 Posted: 13 Jan 2020 05:53 PM PST Forecast for January 14: Analytical review of currency pairs on the scale of H1: For the euro / dollar pair, the key levels on the H1 scale are: 1.1177, 1.1151, 1.1132, 1.1087, 1.1058, 1.1031 and 1.1015. Here, we continue to monitor the local descending structure of January 6. The continuation of the downward movement is expected after the breakdown of the level of 1.1087. In this case, the target is 1.1058. Price consolidation is near this level. The breakdown of the level of 1.1056 will lead to movement to a potential target - 1.1015. In turn, price consolidation is in the range of 1.1015 - 1.1031 and from here, we expect a rollback to the top. Short-term upward movement is possible in the range of 1.1132 - 1.1151. The breakdown of the latter value will lead to an in-depth correction. Here, the goal is 1.1177. This level is a key support for the downward structure. The main trend is the local descending structure of January 6 Trading recommendations: Buy: 1.1153 Take profit: 1.1175 Buy: 1.1178 Take profit: 1.1204 Sell: 1.1085 Take profit: 1.1060 Sell: 1.1056 Take profit: 1.1034 For the pound / dollar pair, the key levels on the H1 scale are: 1.3113, 1.3073, 1.3027, 1.2937, 1.2874 and 1.2838. Here, the continuation of the development of the downward cycle of December 31 is expected after the breakdown of the level of 1.2937. In this case, the target is 1.2874. For the potential value for the bottom, we consider the level of 1.2838. Upon reaching this level, we expect consolidation, as well as a rollback to the top. It is possible that the correction can be avoided after the breakdown of the level of 1.3027. Here, the first goal is 1.3073. The level of 1.3113 is the key support for the downward structure. Its passage in price will have the potential to form the initial conditions for the upward cycle. In this case, the potential goal is 1.3178. The main trend is the descending structure of December 31 Trading recommendations: Buy: 1.3027 Take profit: 1.3073 Buy: 1.3074 Take profit: 1.3113 Sell: 1.2935 Take profit: 1.2875 Sell: 1.2872 Take profit: 1.2838 For the dollar / franc pair, the key levels on the H1 scale are: 0.9832, 0.9810, 0.9778, 0.9751, 0.9706, 0.9685 and 0.9664. Here, we determine the next goals from the local ascending structure on January 8. The continuation of the movement to the top is expected after the breakdown of the level of 0.9751. In this case, the target is 0.9778. Price consolidation is near this level. The breakdown of the level of 0.9780 will lead to a pronounced movement. Here, the target is 0.9810. For the potential value for the top, we consider the level of 0.9832, upon reaching which, we expect consolidation, as well as a pullback to the bottom. Short-term downward movement is possibly in the range of 0.9706 - 0.9685. There is a high probability of a reversal to the top from this range. The breakdown of the level of 0.9685 will lead to the development of a downward structure. Here, the first potential target is 0.9664. The main trend is the local ascending structure of January 8, the zone of initial conditions Trading recommendations: Buy : 0.9751 Take profit: 0.9775 Buy : 0.9780 Take profit: 0.9810 Sell: 0.9705 Take profit: 0.9688 Sell: 0.9683 Take profit: 0.9664 For the dollar / yen pair, the key levels on the scale are : 111.38, 110.78, 110.39, 109.81, 109.58 and 109.23. Here, we are following the development of the upward cycle of January 8. At the moment, we expect a movement to the level of 110.39. The breakdown of which will allow us to count on movement to the level of 110.78. Price consolidation is near this value. The breakdown of the level of 110.80 should be accompanied by a pronounced upward movement. Here, the potential target is 111.38. Short-term downward movement is possibly in the range 109.81 - 109.58. The breakdown of the latter value will lead to an in-depth correction. Here, the goal is 109.23. This level is key support for the top. The main trend: the upward cycle of January 8. Trading recommendations: Buy: 110.40 Take profit: 110.76 Buy : 110.80 Take profit: 111.35 Sell: 109.80 Take profit: 109.58 Sell: 109.55 Take profit: 109.25 For the Canadian dollar / US dollar pair, the key levels on the H1 scale are: 1.3157, 1.3126, 1.3112, 1.3090, 1.3062, 1.3040 and 1.3015. Here, we are following the development of the upward cycle of January 7. The continuation of the movement to the top is expected after the breakdown of the level of 1.3090. In this case, the target is 1.3112. Price consolidation is in the range of 1.3112 - 1.3126. For the potential value for the top, we consider the level of 1.3157. Upon reaching this level, we expect a pullback to the bottom. Short-term downward movement, as well as consolidation are possible in the range of 1.3062 - 1.3040. The breakdown of the latter value will lead to an in-depth correction. Here, the target is 1.3015. This level is a key support for the top. The main trend is the upward cycle of January 7, the correction stage Trading recommendations: Buy: 1.3090 Take profit: 1.3112 Buy : 1.3126 Take profit: 1.3155 Sell: 1.3062 Take profit: 1.3042 Sell: 1.3038 Take profit: 1.3015 For the Australian dollar / US dollar pair, the key levels on the H1 scale are : 0.6972, 0.6955, 0.6933, 0.6915, 0.6887, 0.6871, 0.6851, 0.6827 and 0.6793. Here, the price forms the potential for the upward movement of January 9 in the correction of the downward cycle of December 31. Short-term movement to the top is expected in the range of 0.6915 - 0.6933. The breakdown of the last value will lead to a pronounced movement. Here, the target is 0.6955. For the potential value for the top, we consider the level of 0.6972, upon reaching this value we expect consolidation, as well as a pullback to the bottom. Short-term downward movement is expected in the range 0.6887 - 0.6871. The breakdown of the last value will have the subsequent development of the downward structure. Here, the first goal is 0.6851. As a potential value for the bottom, we consider the level of 0.6793. The movement to which is expected after the breakdown of the level of 0.6825. The main trend is the descending structure of December 31, the formation of potential for the top of January 9 Trading recommendations: Buy: 0.6915 Take profit: 0.6930 Buy: 0.6935 Take profit: 0.6955 Sell : 0.6887 Take profit : 0.6873 Sell: 0.6870 Take profit: 0.6852 For the euro / yen pair, the key levels on the H1 scale are: 123.89, 123.32, 123.06, 122.33, 122.09 and 121.80. Here, we monitor the development of the upward cycle of January 8 and currently, a movement to the level of 123.06 is expected. Short-term upward movement, as well as consolidation is in the range of 123.06 - 123.32. The breakdown of the level of 123.35 will lead to a movement to a potential target - 123.89. We expect a pullback to the bottom from this level. Short-term downward movement is possibly in the range of 122.33 - 122.09. The breakdown of the last value will lead to an in-depth correction. Here, the goal is 121.80. This level is a key support for the upward structure. The main trend is the upward cycle of January 8 Trading recommendations: Buy: 123.06 Take profit: 123.30 Buy: 123.35 Take profit: 123.85 Sell: 122.33 Take profit: 122.10 Sell: 122.07 Take profit: 121.84 For the pound / yen pair, the key levels on the H1 scale are : 145.11, 144.53, 143.68, 142.34, 141.87, 141.31 and 140.66. Here, we are following the development of the upward structure of January 3, after the abolition of the downward trend. We expect further upward movement after the passage at the price level of 143.70. In this case, the target is 144.53. Price consolidation is near this value. For the potential level for the top, we consider level 145.11, from which we expect a pullback to the bottom. Short-term downward movement is possible in the range of 142.34 - 141.87. The breakdown of the latter value will lead to an in-depth correction. Here, the goal is 141.31. This level is a key support for the upward structure. The main trend is the upward structure of January 3 Trading recommendations: Buy: 143.70 Take profit: 144.50 Buy: 144.55 Take profit: 145.10 Sell: 142.34 Take profit: 141.90 Sell: 141.85 Take profit: 141.35 The material has been provided by InstaForex Company - www.instaforex.com |
| Evening review 01/13 EURUSD. Euro chooses a direction Posted: 13 Jan 2020 02:42 PM PST Two factors played against the euro on Monday: 1. Negative news on the British economy - probably we are waiting for a halt in GDP growth and a decrease in the Bank of England rate - as a reaction to Brexit. 2. A breakthrough of the dollar-yen above resistance at 109.75. As a result, the euro did not fall, but the pressure on the euro intensified. Thus, two scenarios became equally probable: 1. Growth to 1.1205, a breakthrough and movement at 1.1240. 2. A break out at 1.1085 and fall to 1.1000 onwards. The material has been provided by InstaForex Company - www.instaforex.com |
| GBP/USD. January 13. Results of the day. British economy: 2 steps forward, 5 steps back Posted: 13 Jan 2020 02:41 PM PST 4-hour timeframe Amplitude of the last 5 days (high-low): 111p - 118p - 89p - 111p - 55p. Average volatility over the past 5 days: 97p (high). The British pound continued its downward movement on Monday, January 13, and also worked out the first support level of 1.2975, as well as the lower level of volatility that we gave in the morning, 1.2956. Thus, now the pound/dollar pair is ready for an upward correction, which is unlikely to be strong or even tangible. As we have repeatedly said, the overall fundamental background remains unambiguously in favor of the British pound, so traders have no choice but to continue to sell the British currency, despite the proximity of Brexit, which was identified with almost solving all the problems of the United Kingdom. However, we see that Brexit is approaching, it is no longer possible to cancel it, and there are only more problems. We will not dwell on geopolitical problems, which we have also talked about more than once. It will be exclusively about the problems in Great Britain's economy. Recall that for several consecutive months the Bank of England has been walking around the decision to lower the key rate, and only fears for the consequences of Brexit, which starts on January 31, prevented most members of the monetary committee from taking this step. The central bank is simply reinsured in this regard, trying to postpone lowering the rate as a last resort. In his last speech, the head of the BoE, Mark Carney, almost openly stated that the regulator could go on easing monetary policy. And it sounded "maybe" as "sure to go," because there are simply no other options. The economy will not suddenly begin to grow for no reason at all. Brexit, which, we repeat, has not even started yet (that is, the last three years can not even be called Brexit procedure, these were just preparations), already has a very negative impact on the British economy. The economy is losing around $70 billion annually. We can also add failed macroeconomic statistics in the last 3-4 months to these financial losses, which was supplemented today with new excellent reports. Industrial production data showed how weak the UK economy is at this time. The total indicator decreased by 1.6% in annual terms instead of the forecasted 1.4%. On a monthly basis, there was a decrease of 1.2% in November instead of the projected 0.1%. The manufacturing industry lost about 2.0% y/y. Furthermore, data on GDP for November were published, according to which the indicator fell (!!!) by 0.3%. If in recent months we have observed body movements of the indicator about 0%, now now in one fell swoop for one month the loss amounted to 0.3%. This is a lot. Such data were quite enough so traders again rushed to sell the British currency. An absolutely logical solution and now there is only one question. What will the BoE do at the next meeting, which will take place on January 30, that is, in two weeks? We believe that, firstly, the number of voting members of the monetary committee will increase from two to at least three or four, and, secondly, the British regulator should finally begin to prepare markets for a possible easing of monetary policy, because there is simply no other way. In general, we believe that the central bank will in any case be with dovish rhetoric, which will then be transformed into the bearish mood of currency traders. Consequently, the pound now has no reason to strengthen, and in two weeks these bases may become even less. Tomorrow, the British pound may be slightly helped by the consumer price index in the United States, which is projected to rise to 2.3% y/y. The forecast is high, respectively, the real value may be slightly lower. However, on Wednesday, January 15, inflation for December will be published in Britain, which has recently managed to accelerate and reach the level of 1.5% y/y. However, given today's macroeconomic statistics, it can be assumed that inflation may fail in December. The technical picture now presupposes a corrective movement, however, given the nature of macroeconomic statistics and in case of overcoming the level of 1.2975, we can expect continued movement down and without a pullback. Trading recommendations: GBP/USD continues to move down. Thus, traders are advised to stay on the pound/dollar pair with the target of a support level of 1.2894 until a rebound from the level of 1.2975 (or 1.2956). It is recommended that purchases of the British currency be returned no earlier than the price consolidation above the Kijun-sen and Senkou Span B lines with the first goals of 1.3150 and 1.3175. Explanation of the illustration: Ichimoku indicator: Tenkan-sen is the red line. Kijun-sen is the blue line. Senkou Span A - light brown dotted line. Senkou Span B - light purple dashed line. Chikou Span - green line. Bollinger Bands Indicator: 3 yellow lines. MACD indicator: Red line and bar graph with white bars in the indicators window. Support / Resistance Classic Levels: Red and gray dotted lines with price symbols. Pivot Level: Yellow solid line. Volatility Support / Resistance Levels: Gray dotted lines without price designations. Possible price movement options: Red and green arrows. The material has been provided by InstaForex Company - www.instaforex.com |
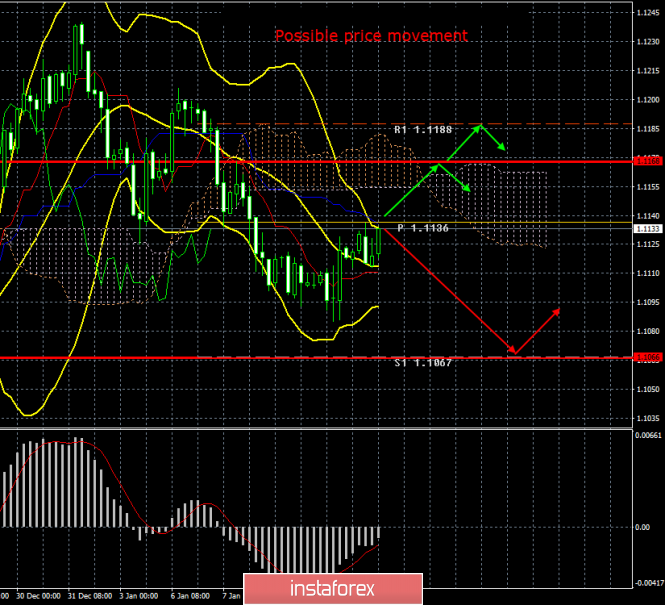
| EUR/USD. January 13. Results of the day. New stumbling block in US-China Talks Posted: 13 Jan 2020 02:41 PM PST 4-hour timeframe Amplitude of the last 5 days (high-low): 49p - 64p - 67p - 28p - 44p. Average volatility over the past 5 days: 51p (average). The EUR/USD pair ends the first trading day of the week with an upward correction, which began on Friday. The euro/dollar pair has currently worked out the critical Kijun-sen line, which is the first and main goal of any correction when we talk about the Ichimoku indicator. Thus, now traders have the right to wait for either the pair to clear from this line or to overcome it. The first option will allow the pair to resume the downward trend, and we believe that this option is most likely. The second option - will allow the correction to continue with the goal of the Senkou Span B line, which is even stronger than the Kijun-sen line and from which a rebound is also possible. Volatility on the first trading day of the week with an empty calendar of macroeconomic events is absolutely low, only 25 points. Thus, there can be no talk of working out any of the boundaries of the corridor of volatility today. Meanwhile, markets continue to closely monitor developments related to the signing of a trade agreement between the United States and China, the so-called "first phase" thereof. Today, January 13, the head of the Chinese delegation, Vice Premier of the State Council of the PRC Liu He arrived in Washington. It is expected that the parties will sign the very controversial agreement by today or tomorrow, which, it would seem, should be the first step towards reconciliation of the parties. "Contradictory" because, firstly, most of the details of this agreement are covered by secrecy, and secondly, most of the US duties on Chinese imports will remain in effect. Only a small share of duties on goods with a total amount of about $60 billion will be canceled. Recall that all imports from China to the United States are in excess of $500 billion. But according to the same agreement, China agreed to significantly increase the volume of purchases of agricultural products in the United States, with both sides giving completely different figures. However, in any case, if the parties sign the agreement, it will be a significant event. Donald Trump himself has already said that immediately after the signing of the first phase he will go to China to negotiate a "second phase". By the way, we would like to note how quickly the fights between Washington and Beijing over the adoption of the Uighur and Hong Kong laws by the US Congress subsided. Beijing vigorously protested these laws, accusing the United States of interfering in China's internal affairs, and simply stopped doing so at some point. That is, it seems that the parties are really important now - to agree on the end of the trade war. However, Washington, meanwhile, continues to "swing rights." According to the latest information, the United States intends to get the Chinese government to impose sanctions on Iran in the form of refusal to buy Iranian oil. We have already spoken about the military conflict between America and Iran several times. It remains only to add that, in principle, all US sanctions have no special significance, since Iran can sell its oil anywhere and to anyone. In practice, 70% of Iranian oil goes to China. According to Stephen Mnuchin, "Iran finances terrorist groups with the money received from China." Thus, the United States wants to get a refusal from the largest consumer of Iranian oil. The US Treasury Secretary also said: "Thanks to the sanctions, Washington was able to reduce Iran's oil exports. Probably more than 95%." It is difficult to say how true this figure is. It's even more difficult to say why Beijing should again follow Washington's occasion. China has no conflict with Iran, respectively, the United States need to offer something in return for abandoning Iranian oil. Will this new stumbling block hinder the signing of a trade agreement? From a technical point of view, we continue to witness the correction, which may be completed tomorrow. As we can see, today the euro/dollar pair failed to demonstrate any serious movement, but tomorrow inflation in the US for December will be published, which is forecasted with another acceleration, which could return demand for the US dollar in the foreign exchange market. Thus, we do not recommend trading against the trend in any case. So, you need to wait for the fundamental factors that complete the correction or, conversely, give the bulls a large amount of strength to form an upward trend. Trading recommendations: The EUR/USD pair continues to adjust. Thus, now it is recommended for traders to wait until the correction is completed and resume trading on a decline with the target support level of 1.1060, however, the price should be below the Kijun-sen line. It will be possible to consider purchases of the euro/dollar pair no earlier than when the traders of the Senkou Span B line overcome with the first goals of 1.1168 and 1.1188. Explanation of the illustration: Ichimoku indicator: Tenkan-sen is the red line. Kijun-sen is the blue line. Senkou Span A - light brown dotted line. Senkou Span B - light purple dashed line. Chikou Span - green line. Bollinger Bands Indicator: 3 yellow lines. MACD indicator: Red line and bar graph with white bars in the indicators window. Support / Resistance Classic Levels: Red and gray dotted lines with price symbols. Pivot Level: Yellow solid line. Volatility Support / Resistance Levels: Gray dotted lines without price designations. Possible price movement options: Red and green arrows. The material has been provided by InstaForex Company - www.instaforex.com |
| GBP/USD. Pound depressed again: Vlieghe's dovish comments and weak macroeconomic reports Posted: 13 Jan 2020 02:41 PM PST The pound fell into a depression against the dollar again, dropping to the area of the 29th figure today. The British currency was under pressure throughout the previous week, however, today the pair's bears were able to test a fairly important support level of 1.2980 (the upper boundary of the Kumo cloud on the daily chart). The pair is falling mainly for two reasons. Firstly, traders are concerned about the prospects of the negotiation process between London and Brussels. Almost all experts in unison say that the 11-month time range is not enough to agree on a trade agreement. But Boris Johnson continues to insist on the contrary, making investors nervous. The second reason for concern is the position of some Bank of England representatives amid a slowdown in the British economy. In particular, today Gertjan Vlieghe added fuel to the fire, which allowed a reduction in the interest rate in the foreseeable future. After this statement, the pound paired with the dollar could not hold the 30th figure and fell to the 29th price level for the first time this year. The January meeting of the English regulator will be held in two weeks, on the 30th. The previous - December - meeting ended on a major note. To the surprise of many experts, members of the central bank did not announce a rate cut (as many currency strategists warned about), and also did not rule out a rate hike in 2020 - naturally, provided that numerous risks do not materialize ("hard" Brexit, a decline in industrial production, inflation, GDP, the escalation of the trade war, etc.). That is why today's Vlieghe's statement took many traders by surprise. Although in fact he is a consistent representative of the "dovish wing" of the Bank of England. On the eve of the December meeting, rumors were circulating in the market that he would join his colleagues - Saunders and Haskell - who had voted in favor of rate cuts over the past few meetings. And although these rumors were not confirmed, it is not surprising that Vlieghe continues to voice a rather soft position regarding the prospects of monetary policy. In his view, the British economy needs support from the BoE - especially if key macroeconomic data continues to show signs of slowdown. Let me remind you that at its last meeting of the regulator, it revised the forecast for the growth of British GDP in the fourth quarter in the direction of deterioration - from +0.2% to +0.1% q/q. At the same time, the central bank acknowledged that the investment climate in the country could significantly improve in the near future, as many companies and enterprises will return to those investment projects that were frozen due to the risks of the hard Brexit. However, this is a matter of the coming months, while at the moment the main macroeconomic reports in Britain are published (as a rule) in the red zone. For example, Britain's GDP growth rate today came out worse than expected - on a monthly basis, the indicator fell back into the negative area (-0.3%). In quarterly terms, the key indicator increased by only 0.1% - this is the weakest growth rate since June last year. Previously published indicators also leave much to be desired. In particular, the British labor market was disappointing - unemployment, although it remained at the same level (3.8% with a forecast of growth of up to 3.9%), the number of applications for unemployment benefits increased significantly - to almost 29 thousand (with a forecast of 20 thousand ) Salaries also disappointed. The level of average earnings (including bonuses) grew to only 3.2%. This is the weakest growth since April of this year. Production activity remains weak - according to data published today, production in the manufacturing sector collapsed (in monthly terms) to -1.7%, with a forecast of decline to -0.2%. Only the construction sector demonstrated positive dynamics. But the indicator of changes in the volume of industrial production in Britain again turned out to be in the negative area - both in monthly and in annual terms. Obviously, if key macroeconomic indicators continue to disappoint, the BoE will resort to lower rates. Here it is worth recalling that back in the middle of last year, Mark Carney warned that the central bank would not "automatically" respond to events around Brexit. That is, in the event of the implementation of the hard scenario, the central bank will not resort to easing monetary policy at the next meeting — but even with the soft option, the regulator will not increase the interest rate only on the basis of approval of the deal. That is why the focus of GBP/USD traders again shifted to the British macroeconomic reports and comments of representatives of the BoE. Today's price dynamics once again confirms this fact. All this suggests that the British will show a downward trend in anticipation of the next test - on Wednesday the main data on inflation growth in the UK will be published. According to the consensus forecast, the December consumer price index should reach the same levels as in November (general index at the levels of 0.2% m/m, 1.5% y/y, the core index - 1.7%). If inflation also disappoints, the GBP/USD pair, first, will break through the support level of 1.2980 and go to the middle line of the Bollinger Bands indicator on the daily chart (1.2850). If inflationary dynamics will pleasantly surprise investors, the pair will have a chance to return to the region of the 30th figure. The material has been provided by InstaForex Company - www.instaforex.com |
| EUR/USD: euro should benefit from the end of the US-China trade war Posted: 13 Jan 2020 02:41 PM PST Weak data on the US labor market for December made it possible for the EUR/USD pair to cling to the bottom of the 11th figure. The number of jobs in the non-agricultural sector of the United States increased by 145 thousand last month , which was below market expectations (164 thousand). The average wage also disappointed: its growth rate slowed from 3.1% to 2.9% in annual terms. If the weakness of Non-Farm Payrolls is understandable (General Motors employees who participated in the strike returned to the workforce in November), then the dynamics of wages is a puzzle for experts. Despite the strength of the labor market, the indicator is not growing. The reasons should probably be sought in low inflation expectations. It seems that the United States is following the path of Japan, where, despite massive monetary stimulus, the threat of deflation is still present. Apparently, it is difficult for Americans born in the 1980s and 1990s to understand what inflation acceleration is. Even if the latter say that consumer prices will accelerate, few people believe in this. Reduced inflation expectations muffle workers' demands for higher wages. In such circumstances, it will not be easy for the Federal Reserve to achieve PCE growth to the target of 2% and also keep the indicator at this level. The derivatives market believes that by the end of 2020, the effective rate on federal funds will be 1.345%, which is 20.5 basis points lower than its current level. Thus, monetary expansion is not excluded, which may be an unpleasant surprise for the greenback. In the long run, the euro is supposed to benefit from the end of the US-China trade war. This will be facilitated not only by the restoration of the export-oriented economy of the eurozone. According to experts at Oxford Economics, if not for the trade conflict, US GDP would have grown by 2.6% last year. According to Bloomberg experts the indicator expanded by 2.3% in 2019, and it will increase by 1.8% in 2020. "The euro can strengthen to $1.16 in 2020 due to economic recovery in Europe, lower political risks in the region and the absence of significant changes in monetary policy by the ECB," Nomura currency strategists believe. As for the short-term prospects, along with the signing of the trade agreement by Washington and Beijing, the main events of the week by January 17 for EUR/USD will be the release of reports on inflation and retail sales in the US for December, as well as the publication of the minutes of the last ECB meeting. In case of further strengthening of the dollar, the main currency pair may decline to the area of 1.1040–1.1065. To restore the upward trend, the bulls will need a successful assault of resistance at 1.1135 and 1.1155. The material has been provided by InstaForex Company - www.instaforex.com |
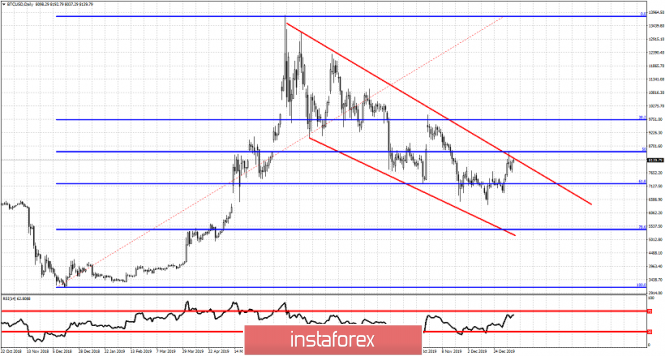
| Posted: 13 Jan 2020 01:34 PM PST Bitcoin is challenging the upper wedge pattern boundary. This is an important test for bulls. Recapturing the $8,200-$8,500 resistance area would be a big step for another move towards $10,000 and higher. A rejection at current levels could price BTCUSD back towards $6,000 and possibly lower.
Red lines- wedge pattern BTCUSD is bouncing strongly around the major Fibonacci retracement level of 61.8%. Will the wedge boundary resistance break? Short-term trend is bullish as price has reversed at $6,500 and is making higher highs and higher lows since December 17th. Support is at $7,200-$7,000 area and if we see price break below this level, we should confirm the rejection and the chances for a move below $6,000 will be high. The material has been provided by InstaForex Company - www.instaforex.com |
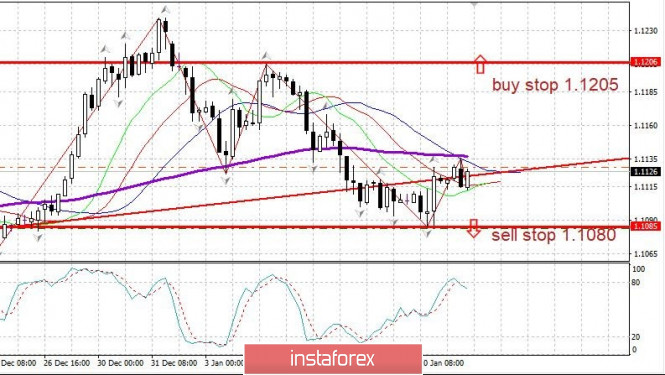
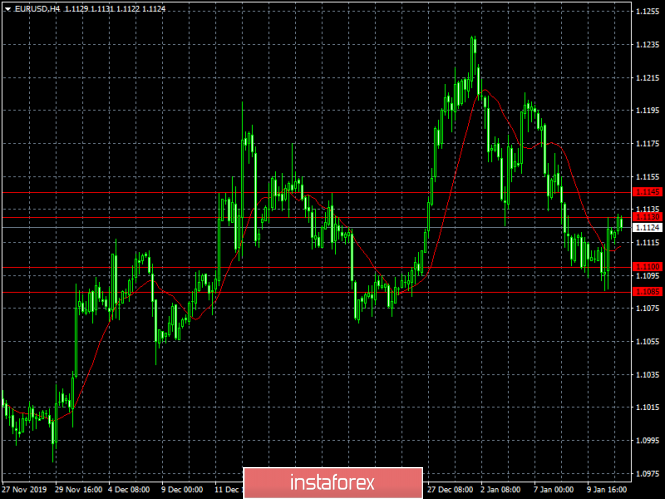
| Short-term technical analysis on EURUSD Posted: 13 Jan 2020 01:26 PM PST EURUSD is bouncing off channel support. Price continues to respect recent lows. There is no interruption in the higher highs and higher lows sequence yet. As long as this sequence is confirmed, we remain bullish.
Red rectangle -resistance area Blue rectangle - horizontal support Green lines- bullish channel EURUSD is bouncing off 1.11. Bulls need to recapture the 1.1170-1.1190 resistance area in order to hope for a move towards 1.13-1.14. Short-term trend remains bullish as long as price is above 1.1085. Short-term resistance is also found at 1.1205. Breaking above this level will increase the chances of seeing 1.13 and higher.The RSI is not overbought and with a slight upward trend. All this indicates that a move higher is more probable. The material has been provided by InstaForex Company - www.instaforex.com |
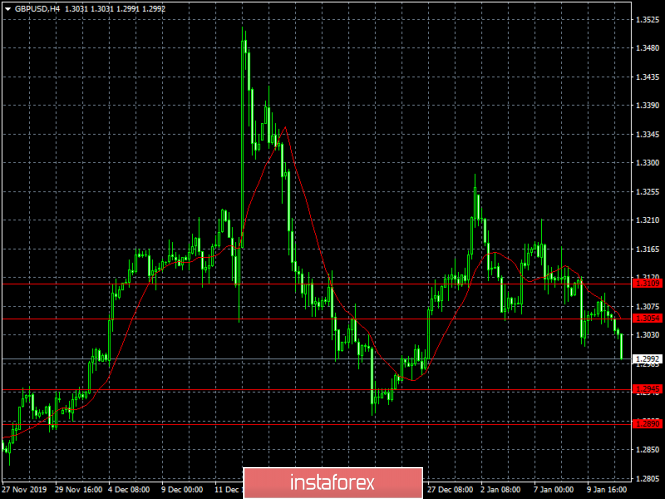
| Short-term Elliott wave analysis on GBPUSD Posted: 13 Jan 2020 01:20 PM PST GBPUSD is following our expected wave path for a move below 1.29 after bouncing towards 1.3250. Price has so far moved exactly as we predicted and this increases our hopes that a bigger reversal should follow,as this remains our key scenario for the first quarter. Price is following our analysis from December 17th.
|
| January 13, 2020 : GBP/USD Intraday technical analysis and trade recommendations. Posted: 13 Jan 2020 08:56 AM PST
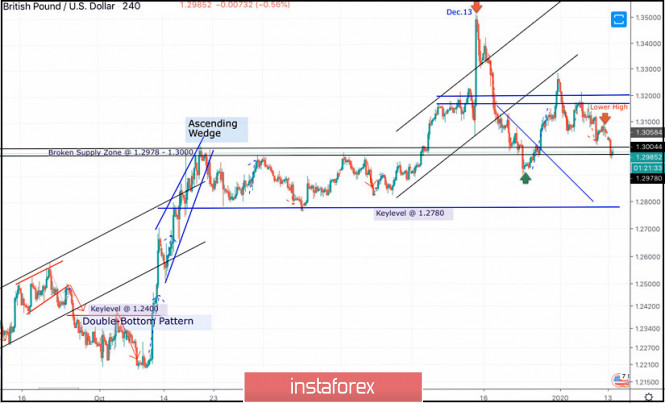
On December 13, the GBPUSD pair looked overpriced around the price levels of 1.3500 while exceeding the upper limit of the newly-established bullish channel. On December 23, initial bearish breakout below 1.3000 was demonstrated on the H4 chart. However, earlier signs of bullish recovery were manifested around 1.2900 denoting high probability of bullish breakout to be expected. Thus, Intraday technical outlook turned into bullish after the GBP/USD has failed to maintain bearish persistence below the newly-established downtrend line. That's why, bullish breakout above 1.3000 was anticipated. Thus, allowing the recent Intraday bullish pullback to pursue towards 1.3250 (the backside of the broken channel) where bearish rejection and another bearish swing were suggested for conservative traders in Last Week's previous articles. Intraday bearish target remains projected towards 1.3000 and 1.2980 provided that the current bearish breakout below 1.3170 is maintained on the H4 chart. Please also note that two descending highs are being demonstrated around 1.3120 and 1.3090 which enhances the bearish side of the market. On the other hand, bearish breakdown below 1.2980 is mandatory to enhance further bearish decline towards 1.2900 and probably 1.2800 where the backside of the previously-broken downtrend is located. Moreover, Intraday traders can watch any bullish pullback towards the depicted price zone (1.3170 - 1.3200) for bearish rejection and another valid SELL entry with intraday bearish targets projected towards 1.3000 and 1.2980. The material has been provided by InstaForex Company - www.instaforex.com |
| January 13, 2020 : EUR/USD Intraday technical analysis and trade recommendations. Posted: 13 Jan 2020 08:16 AM PST
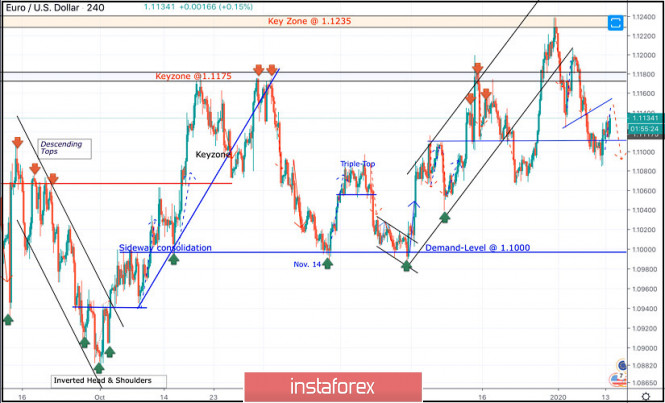
Since November 14, the price levels around 1.1000 has stood as a significant DEMAND-Level offering adequate bullish SUPPORT for the pair on two successive occasions. During this Period, the EUR/USD pair has been trapped within a narrow consolidation range between the price levels of 1.1000 and 1.1085-1.1100 (where a cluster of supply levels and a Triple-Top pattern were located) until December 11. On December 11, another bullish swing was initiated around 1.1040 allowing recent bullish breakout above 1.1110 to pursue towards 1.1175 within the depicted short-term bullish channel. Initial Intraday bearish rejection was expected around the price levels of (1.1175). Moreover, On December 20, bearish breakout of the depicted short-term channel was executed. Thus, further bearish decline was demonstrated towards 1.1065 where significant bullish recovery has originated. The recent bullish pullback towards 1.1235 (Previous Key-zone) was suggested to be watched for bearish rejection and another valid SELL entry. Suggested bearish position has achieved its targets while approaching the price levels around 1.1110. As expected, the Key-Level around 1.1110 has provided some bullish rejection. That's why, the current bullish pullback would be expected to pursue towards 1.1140 and probably 1.1175. On the other hand, for the bearish side of the market, bearish persistence below 1.1110 is needed to enable further bearish decline towards 1.1060 and probably 1.1040. Trade recommendations : Conservative traders should wait for bullish pullback towards the price levels of (1.1140-1.1175) as another valid SELL signal. Bearish projection target to be located around 1.1120 and probably 1.1060. Any bullish breakout above 1.1190 invalidates the mentioned bearish trading scenario. The material has been provided by InstaForex Company - www.instaforex.com |
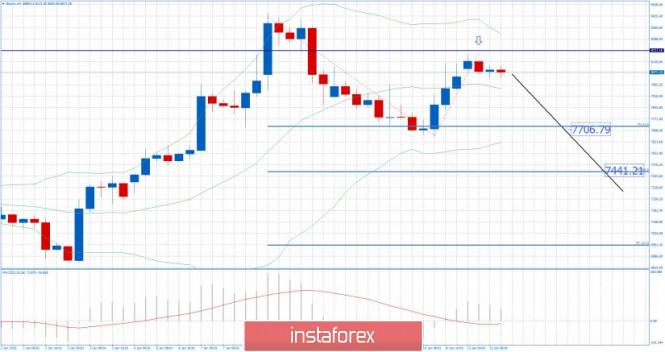
| BTC analysis for 01.13.2020 - Watch for potential drop on the BTC and second downside leg to develop Posted: 13 Jan 2020 04:48 AM PST Industry news: As the Bitcoin price hovers around $8,100, having gone up over 12% in the year-to-date period, there is one question on the minds of many investors/traders: will today's launch by the CME Group of options on Bitcoin futures help the BTC price climb even higher? According to data from CryptoCompare, Bitcoin is currently trading around $8,100, most unchanged over the weekend, but up 12.62% in the year-to-date (YTD) period: On 12 November 2019, CME Group ("CME"), which owns "large derivatives, options and futures exchanges in Chicago and New York City using its CME Globex trading platforms", announced options on its Bitcoin futures contracts would be launching ("pending regulatory review") on 13 January 2020. Technical analysis:
BTC has been trading sideways around the resistance at the price of $8.100. I still potential second downside leg to develop and test of the $7.710-$7.440. MACD oscillator is showing positive reading with the slow line in flat position... Resistance levels are seen at the price of $8.200 and $8.440 Support levels and downward targets are set at the price of $7.710, $7.440 and $7.000. Watch for selling opportunities... The material has been provided by InstaForex Company - www.instaforex.com |
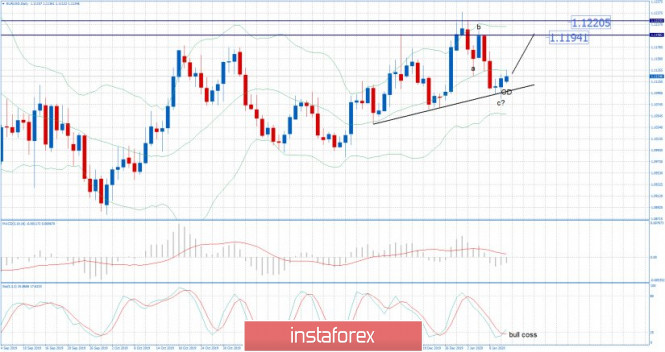
| Posted: 13 Jan 2020 04:37 AM PST EUR has been trading sideways at the price of
1.1123.I expect further upside movement and potential re-test of the 1.1194-1.1220. There is the successful rejection of the support trendline. The successful rejection of the major trend line was the key for my bullish view. My advice is to watch for buying opportunities on the dips using intraday-frames 5/15 minutes. Tomorrow there is the CPI m/m for USD, which may produce necessary volatility for EUR. MACD oscillator is showing decreasing downside momentum Stochastic oscillator is showing oversold condition and fresh new bull cross, which is sign for the further upside movement. Resistance levels are seen at the price of 1.1134 and $1.1194. Key support level is set at the price of 1.1084 The material has been provided by InstaForex Company - www.instaforex.com |
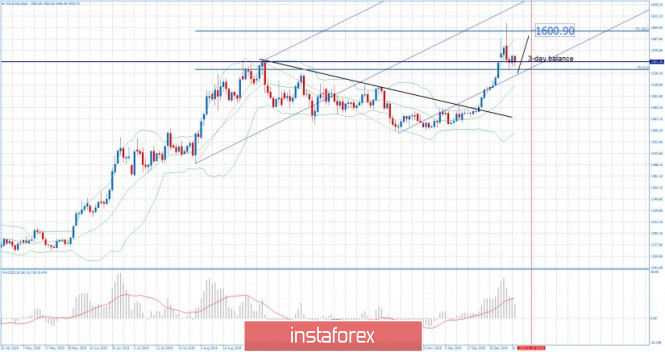
| Gold 01.13.2020 - Major support on the test and potential for upside continuation and test of $1.600 Posted: 13 Jan 2020 04:26 AM PST Gold has been trading sideways at the price of $1.553.My analysis from last week didn't change and I still see more upside on the Gold and potential re-test of $1.600 and $1.650.
The breakout of the major swing high this week was the key for strong demand on the Gold. My advice is to watch for buying opportunities on the dips using intraday-frames 5/15 minutes. Tomorrow there is the CPI m/m for USD, which may produce necessary volatility for Gold. MACD oscillator is showing increase on the upside momentum and new high, which is good confirmation for the further upside... Resistance levels and upward targets are seen at the price of $1.601 and $1.650. Key support level is set at the price of $1.550-$1.540The material has been provided by InstaForex Company - www.instaforex.com |
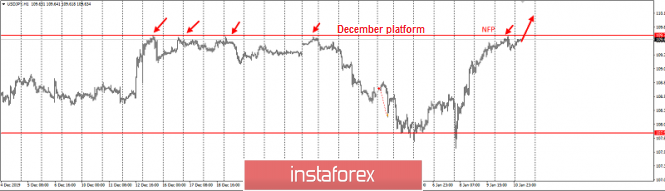
| Posted: 13 Jan 2020 03:49 AM PST Good afternoon, dear traders. Congratulations to those who took advantage of our trading idea to buy USD / JPY! The idea was to work out the breakdown of the important stop level of 109.7: As you can see, the level has been broken since the opening of the European session: You can do it in two ways: 1. Close all profits and spend money :) 2. Close a part, while leave another until tomorrow. Let the profits grow. Good luck in trading and control the risks! The material has been provided by InstaForex Company - www.instaforex.com |
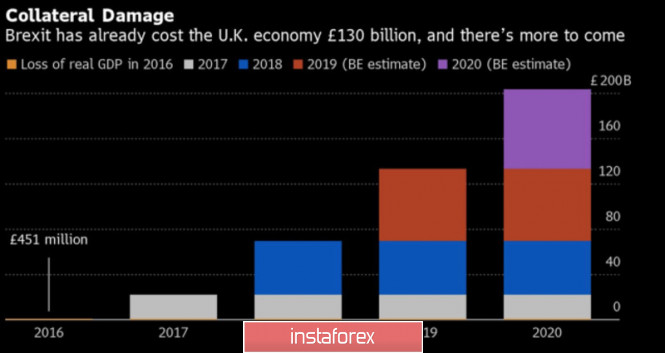
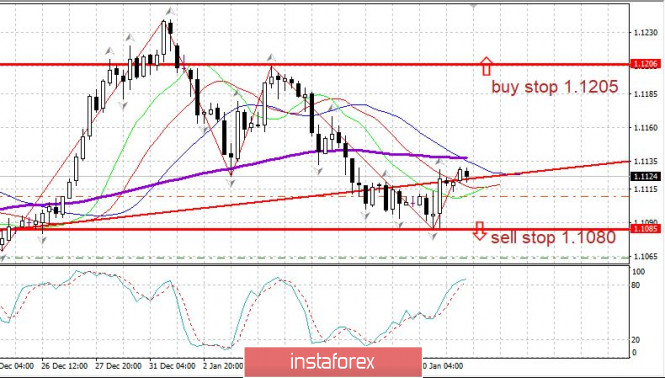
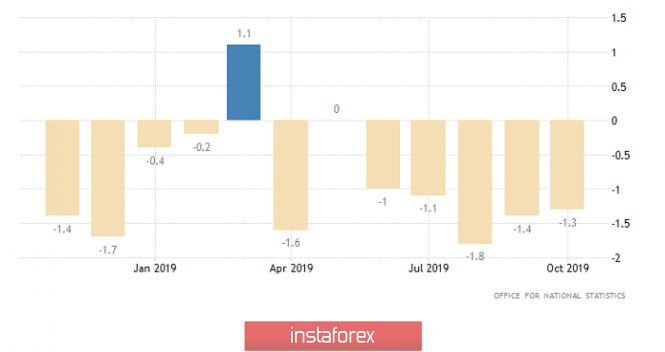
| Pound released the "pigeons" at will Posted: 13 Jan 2020 03:13 AM PST The British pound started the year very poorly. The uncertainty surrounding Brexit, the disappointing statistics on Albion, and the "pigeon" rhetoric of the Bank of England representatives, which did not disappear after Boris Johnson's intentions to limit the period of the transition period, led GBP/USD's quotes below the psychologically important mark of 1.3. We can say that while the British currency does not meet expectations, according to the consensus assessment of Reuters experts, pound should be worth $1.32 by the end of January, and $1.35 by the end of the year. Dashing trouble began however! While experts are betting on clarifying the situation around the divorce of Britain and EU, the differential in interest rates, the growth of external demands under the influence of the end of the US-China trade war and the Bank of England's reluctance in making changes in the monetary policy, the topic of the British pound's weakening is on the table at the MPC. According to outgoing Central Bank Governor Mark Carney, this issue is being discussed, and the regulator is ready to act to support the economy. Moreso, its Arsenal is wide. Along with a reduction in the REPO rate from its current value of 0.75%, the Bank of England has the option to buy bonds worth £60bn, which is equivalent to a 100P reduction in the rate. Silvana Tenreiro, a member of the monetary policy committee, said that if economic growth did not accelerate in the coming months, she would be inclined to loosen monetary policy. In this regard, a 0.1% reduction in Albion's GDP in November was the catalyst for the GBP/USD peak. In order to reach positive figures for the fourth quarter, the economy should expand by 0.1-0.2% in December. Brexit is expensive for Britain. According to Bloomberg's calculations, its cost from 2016 is about £130 billion, and in 2020, it could increase by another £70 billion. The dynamics of Britain's spending on Brexit:
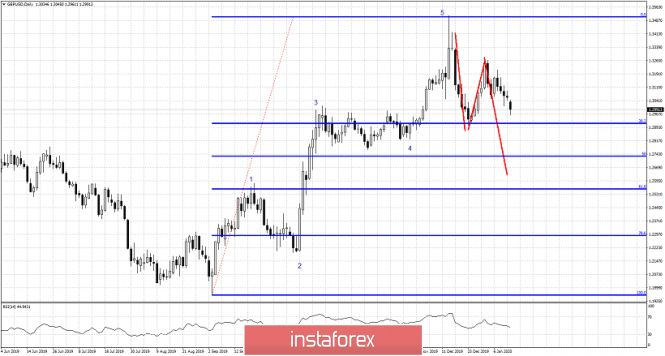
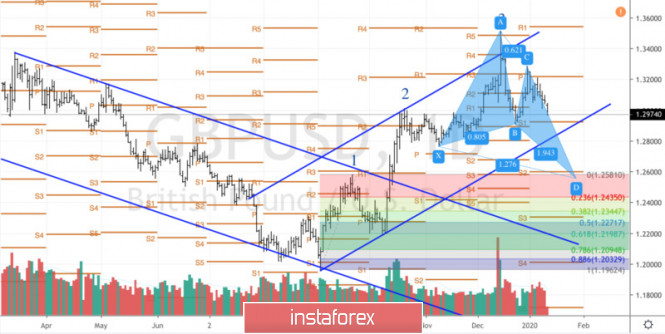
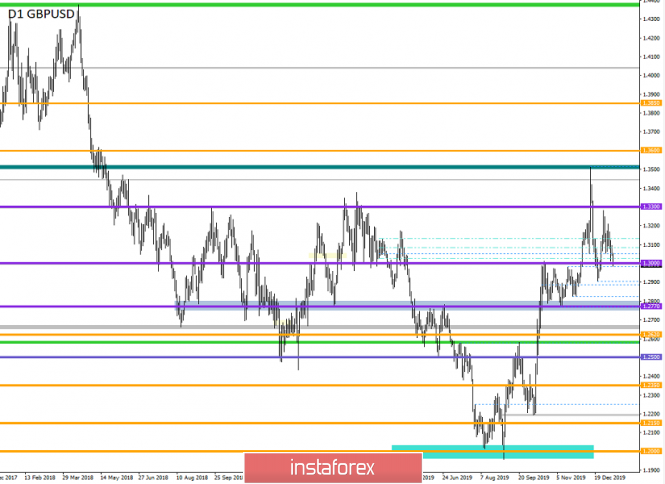
Mark Carney and Silvana Tenreiro's "pigeon" rhetoric is extremely dangerous for the pound, as there are already four supporters of the REPO rate reduction. Before that, Gertjan Vliege and Jonathan Haskel had spoken in favor of easing monetary policy. At any time, another MPC member may join them, and the issue of monetary expansion will be resolved. The futures market increased its chances from 30% to 60% in May. Pound, unlike in 2019, began to respond to economic events and the changes in the outlook of the Bank of England. It makes us take a closer look on the week of January 17. The releases of data on inflation and retail trade make the pound a candidate for the role of the most interesting currency of the five-day period. No wonder that Mark Carney, in his last speech, linked the sluggish growth on consumer prices with the possibility of lowering the REPO rate. Technically, the break through of the support at 1.29-1.292 (Pivot levels) and the exit of GBP/USD quotes outside the descending trading channel increase the risks of implementing the target by 127.2% on the "Perfect butterfly" pattern. On the contrary though, if the bulls manage to hold the above levels and return the pair above 1.302 and 1.311, the hope of restoring the upward trend will return to them. GBP / USD daily chart:
|
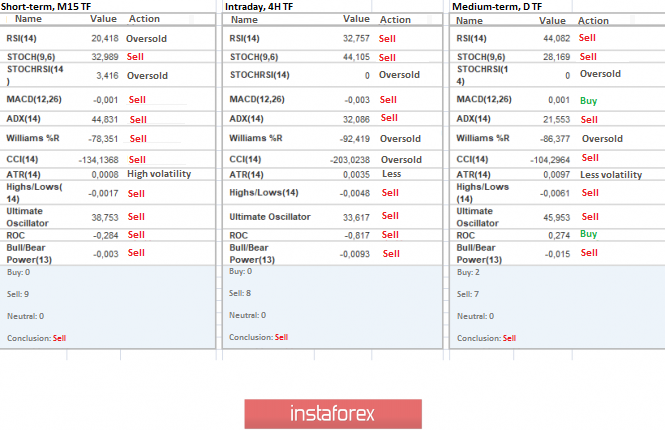
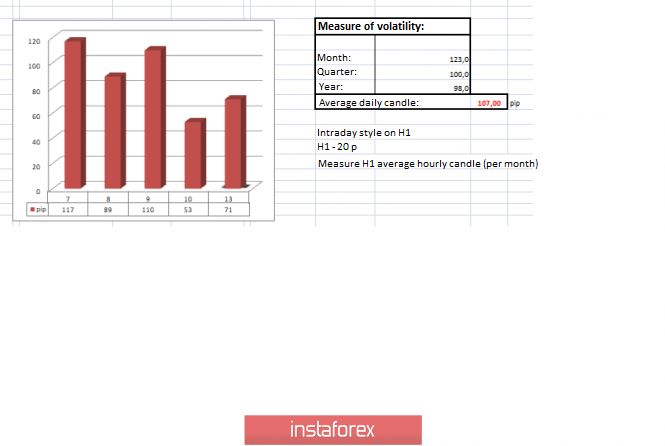
| Trading recommendations for GBPUSD for January 13, 2020 Posted: 13 Jan 2020 02:09 AM PST From a comprehensive analysis point of view, we see an insignificant pullback from the psychological level of 1.3000, where, as early as January 9 the quote initially found a foothold. In fact, on January 10, the bulls' indecision reflected the actions where the quotes with a sluggish amplitude moved from the rollback phase to stagnation-recovery, which plays into the hands of potential sellers. Seeing everything that is happening, traders are more and more inclined to further decrease, and the control level of 1.3000 is already being considered from a different perspective, as it was in the autumn period of last year. In terms of volatility, as noted earlier, a local slowdown to 53 points was recorded which in relation to the dynamics of January we have a decrease of 52%. At the same time, speculative interest is still maintained in the market, as evidenced by the structure of candles and trading volumes. Analyzing the past minute by minute, we see that almost all of the interest was directed to a decrease, and the average amplitude of the hourly candlestick was 14 points. As discussed in a previous review, speculators mostly work with short positions, and they do pretty well. In fact, this tactic was set in early January, where the next round of downward operations was born, with variable points of regrouping of trading forces. Considering the trading chart in general terms [the daily period], we see another attempt to return sellers to the market after the quotes reached a one and a half year high of 1.3513. It is worth considering that the global trend is still downward, in the structure of which, there was an upward trend in the second half of last year. Friday's news background included the publication of a report by the United States Department of Labor, where forecasts of negative development were confirmed. So, 145 thousand new jobs were created outside the agricultural sector with a forecast of 165 thousand, while the previous period had 256 thousand. At the same time, the unemployment rate, which according to forecasts was supposed to grow to 3.6%, remained unchanged. This is 3.5% which played into the hands of the American dollar. Market reaction to the publication of the report was negligible. So, considering the trading chart, we see that at 13:30 UTC there was a sharp jump up, just against the background of a decrease in new jobs, but by 13:35 UTC, the reverse process had already occurred a 100% recovery. In terms of the general informational background, we have a variable discussion of the recently adopted bill on Britain's secession from the European Union. So, Irish Foreign Minister Simon Coveney believes that as soon as the transition period begins, the EU will not rush to trade agreement, as they intend to make the agreement the most optimal, of course, for themselves. At the same time, experts from Bloomberg have already concluded that economic losses to the United Kingdom since the beginning of Brexit have already reached $170 billion, and by the end of the year, they can grow by another 50%. If we switch to the British labor market we will see that the number of jobs has catastrophically decreased last year, vacancies decreased by 59,000, which took place after the financial crisis in 2009. Now we understand when a wide range of experts portends hard times for the UK economy and the pound sterling. Today, in terms of the economic calendar, we have published data on industrial production in the UK, where the decline can accelerate from -1.3% to -1.4%, which will put pressure on the pound. Further development Analyzing the current trading chart, we see that the quote is rapidly storming the psychological level of 1.3000, drawing out impulsive descending candles. In fact, last week's minimum fell to 1.012, and against this background, acceleration is seen which gives sellers strength in breaking the control value. In terms of volatility, we see signals of possible acceleration, as evidenced by an increase in the rate of speculative operations. By detailing the per-minute time span, that at the start of the European trading session, impulsive downward jumps began to appear which to this day remain on the market. In turn, speculators continue to work on the decline. In this case, work is being done on the breakdown level of 1.3000, and in the case of confirmation, the decline may continue. Having a general picture of actions, it is possible to assume that the ambiguous chatter at the level of 1.3000 may still remain on the market for some time. However, in this case, the main move will be revealed as to which is worth paying attention to. That is, if the quotes still manage to stay below the psychological level of 1.3000 and go down to the area of 1.2980, then the chance of a further decline will increase significantly. Based on the above information, we derive trading recommendations as follows: - Buy positions are considered in case of price-fixing higher than 1.3015. - Sales positions are considered in case of price-fixing lower than 1.2980. Indicator analysis Analyzing a different sector of timeframes (TF), we see that indicators unanimously signal sales, which is confirmed by the general market interest. Volatility per week / Measurement of volatility: Month; Quarter; Year Measurement of volatility reflects the average daily fluctuation, calculated for the Month / Quarter / Year. (January 13 was built taking into account the time of publication of the article) The volatility of the current time is 71 points, which is already pretty good for the morning time. It is likely to assume that if it is still possible to break through the psychological level and at the same time increase from it, then volatility can safely exceed the average. Key levels Resistance zones: 1.3180 **; 1.3300 **; 1.3600; 1.3850; 1.4000 ***; 1.4350 **. Support Areas: 1,3000; 1.2885 *; 1.2770 **; 1.2700 *; 1.2620; 1.2580 *; 1.2500 **; 1.2350 **; 1.2205 (+/- 10p.) *; 1.2150 **; 1,2000 ***; 1.1700; 1.1475 **. * Periodic level ** Range Level *** Psychological level **** The article is built on the principle of conducting a transaction, with daily adjustment The material has been provided by InstaForex Company - www.instaforex.com |
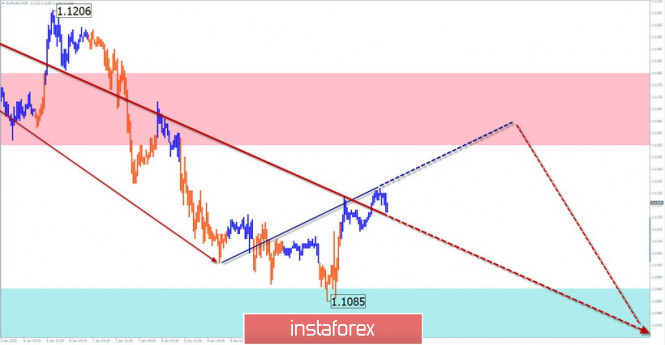
| Simplified wave analysis on EUR/USD and AUD/USD for January 13 Posted: 13 Jan 2020 02:04 AM PST EUR/USD Analysis: On the euro chart, the price decline that began on December 31 continues. The potential of its beginning allows you to wait for the continuation of the movement, with the transition to a larger scale of the chart. In recent days, an upward pullback is forming. Forecast: Today, the price is expected to continue rising until it is fully completed. A reversal is likely in the area of calculated resistance. The start of the decline can be expected by the end of today or tomorrow. Potential reversal zones Resistance: 1.1150/1.1180 Support: 1.1090/1.1060 Recommendations: Trading in the euro market today can be risky. You can buy a reduced lot in the first half of the day. It is safer to refrain from entering the pair's market until the completion of the upward turn, and at its end to track the sell signals
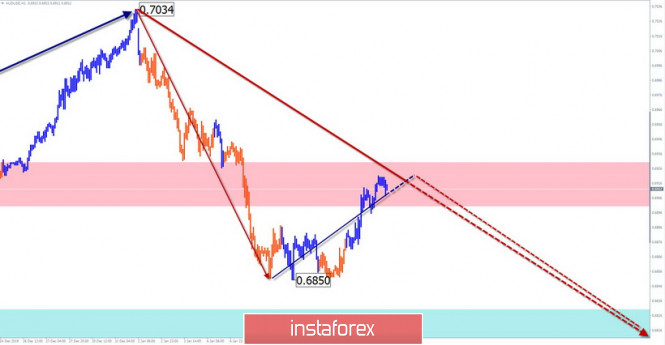
AUD/USD Analysis: The Australian currency has been forming a bearish wave since September last year. The wave is complex, and has the appearance of an ascending pennant. On December 31, the formation of the final part (C) began. In its framework, the price has been rolling back up since last week. Forecast: In the coming days, it is expected that the upward movement will be completed, and the price will move down. The calculated support is located at the upper border of the wide reversal zone of the senior TF, so a breakthrough further down in the near future should not be expected. Potential reversal zones Resistance: 0.6900/0.6930 Support: 0.6830/0.6800 Recommendations: The pair's purchases are hopeless today. It is recommended that we focus on searching for selling signals in the instrument.
Explanations: In the simplified wave analysis (UVA), the waves consist of 3 parts (A-B-C). The last incomplete wave is analyzed. The solid background of the arrows show the formed structure, whereas the dotted background shows the expected movements. Attention: The wave algorithm does not take into account the duration of the pair's movements in time! The material has been provided by InstaForex Company - www.instaforex.com |
| Trader's Diary: EUR/USD on 01/13/2019, Why there is no US - Iran war Posted: 13 Jan 2020 01:01 AM PST
USA - Iran. As we recall, on January 3, the United States killed one of the most famous organizers of terrorist acts against the country itself - General Soleimani. This was through Trump's personal instructions. Due to this, Iran has promised a violent retaliation. Trump, in response, threatened to destroy 52 objects that are significant to Iran. Then all of a sudden, Iran launched a clearly weak attack and said that it was satisfied. The US, on the other hand, said they want negotiations. And so, the war ended very quickly. Before it even started. Why is that? USA: The USA has no forces for a ground war against Iran which is a big country. There will be a lot of corpses on both sides. The United States is clearly not ready for a major war, and they do not need it. Trump, as well, does not need it due to the coming election year. Iran: Iran would have fought with the United States if there were chances to cause serious damage to the United States. But this is unrealistic. If the United States has to fight, it's quite obvious that the United States will first destroy the Iranian air defense force and then destroy the entire Iranian economy as well as the oil fields. That way, Iran will hardly be able to answer. Conclusion: War is not needed by either side. At least not for now. EURUSD: Consolidation continues at support 1.1100. Or the euro will be able to overcome the resistance of sellers and move to 1.1205 - 1.1240 and up. Or - breaking down 1.1180 and down. The material has been provided by InstaForex Company - www.instaforex.com |
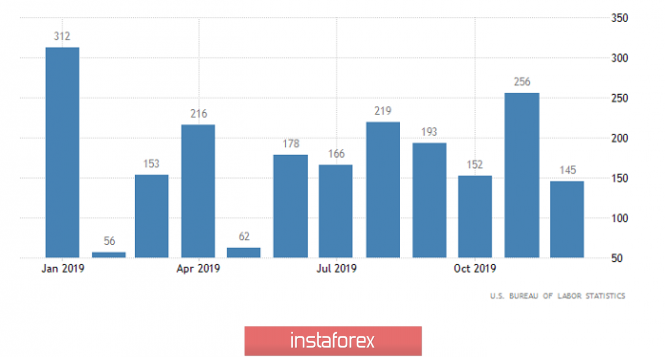
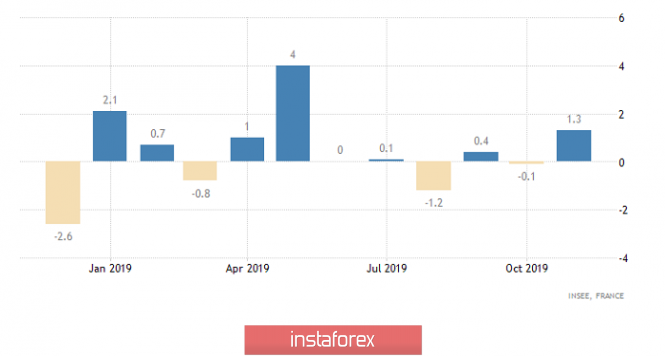
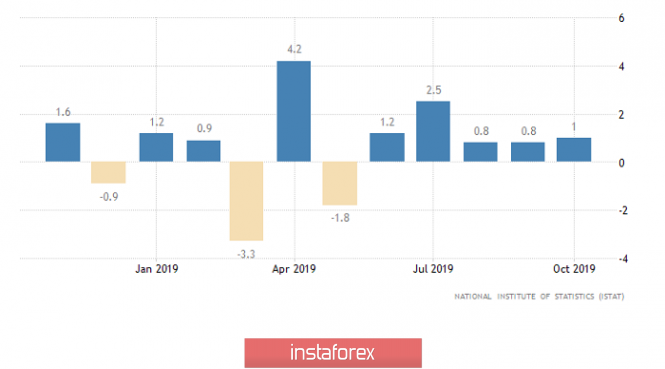
| Everything went wrong again (review of EUR/USD and GBP/USD on 01/13/2020) Posted: 13 Jan 2020 12:46 AM PST Investors had high hopes for a report from the United States Department of Labor, but, as usual, all dreams fell apart like a house of cards. The forecasts for the contents of this very report of the United States Department of Labor were so large-scale that everyone was actively preparing for the massive sale of the dollar, but something went wrong. Of course, the first of the two main indicators met the expectations placed on it, and 145 thousand new jobs were created outside agriculture, which turned out to be even worse than the forecast of 165 thousand. It should be noted that 256 thousand new jobs were created in the previous month. That is, there is a clear decrease in the pace of creating new jobs, which should have contributed to a serious weakening of the dollar. However, the unemployment rate failed, which did not increase from 3.5% to 3.6%, but remained unchanged. This confused investors so much that they, having really no time to start getting rid of the dollar, abandoned the event with a sad look. And no matter how sad it may sound, although such behavior was yet another confirmation of the fact that people do not look at the whole picture in general, but only at the headlines or at one or two indicators. After all, a close look reveals that the content of the report of the United States Department of Labor is clearly negative. In particular, the unemployment rate remained unchanged only because the share of labor in the total population remained the same. However, its increase was predicted from 63.2% to 63.3%. Moreover, the growth rate of average hourly wages slowed from 3.1% to 2.9%. In addition to all this, the average working week decreased from 34.4 hours to 34.3 hours no matter what the statistics show and just the previous value was revised down to 34.3 hours. So, in the bottom line, we have a slowdown in the creation of new jobs amid a slowdown in wage growth. This will inevitably lead to a decrease in consumer activity, which is the main engine of the American economy. The number of new jobs created outside agriculture (United States): It is clear that the publication of the report of the United States Department of Labor is such a large-scale event that almost no one paid attention to data from Europe. But in France, the second economy of the euro area, the decline in industrial production by 0.1% gave way to an increase of 1.3%. Meanwhile, roughly the same thing happened in Spain, which is the fourth economy in the euro area, where a decline of 1.3% gave way to a growth of 2.1%. And about the same picture is in the third economy of the euro area, that is, in Italy, however, we are talking about slowing down the pace of decline, which is from -2.4% to -0.6%. Industrial Production (France): On Monday, the macroeconomic calendar is usually completely empty, but the situation is somewhat different today. Investors should pay close attention to data on industrial production in the UK, the decline of which should accelerate from -1.3% to -1.4%. Moreover, if these forecasts come true, it turns out that industrial production in the United Kingdom has been declining for the eighth month in a row. Without a doubt, this is a sad fact for the pound. Industrial Production (UK): For the euro area as a whole, no data is published. However, this does not mean that there is nothing to look at. For example, Germany has already recorded a slowdown in the decline in wholesale prices from -2.5% to -1.3%, which gives hope for inflation. In addition, Italy is expected to accelerate retail sales growth from 1.0% to 1.4%. Now, it is obvious that this will have a beneficial effect on sales in general given that we are talking about the third economy of the euro area. Retail Sales (Italy): For the single European currency, today will be pretty calm despite the clearly positive data for a number of European countries and it will be in the range from 1.1100 to 1.1125. The pound is already actively going down, so do not be surprised if it closes the day at 1.2950. |
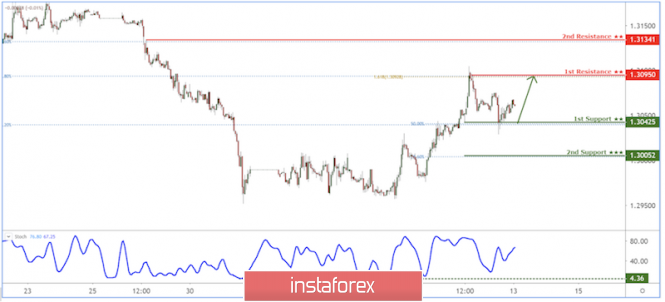
| USD/CAD bounce in progress above support! Posted: 13 Jan 2020 12:31 AM PST
Trading Recommendation Entry: 1.30425 Reason for Entry: 50% Fibonacci retracement, graphical swing low Take Profit : 1.30950 Reason for Take Profit: 161.80% Fibonacci extension, horizontal swing high Stop Loss: 1.30052 Reason for Stop loss: 78.6% Fibonacci retracement The material has been provided by InstaForex Company - www.instaforex.com |
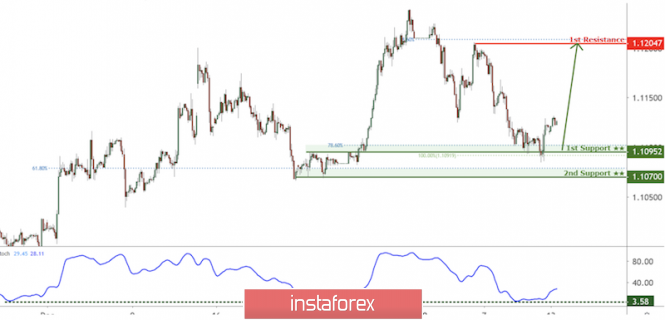
| EUR/USD approaching support, potential for bounce! Posted: 13 Jan 2020 12:29 AM PST
Trading Recommendation Entry: 1.10952 Reason for Entry: 100% extension, horizontal overlap support, 78.6% fibonacci retracement Take Profit : 1.12047 Reason for Take Profit: 78.6% Fibonacci retracement, horizontal swing high resistance Stop Loss: 1.10700 Reason for Stop loss: Horizontal swing low support, 61.8% fibonacci retracement The material has been provided by InstaForex Company - www.instaforex.com |


| You are subscribed to email updates from Forex analysis review. To stop receiving these emails, you may unsubscribe now. | Email delivery powered by Google |
| Google, 1600 Amphitheatre Parkway, Mountain View, CA 94043, United States | |
No comments:
Post a Comment