Forex analysis review |
- Forecast for EUR/USD on January 15, 2020
- Forecast for GBP/USD on January 15, 2020
- Forecast for AUD/USD on January 15, 2020
- USD/CAD bounce in progress above support!
- EUR/USD bouncing off support, potential for further rise!
- USD/JPY potential bounce coming!
- Fractal analysis for major currency pairs on January 15
- EUR/USD. US inflation was not in favor of the dollar, but the market is still busy with other problems
- GBP/USD: despite the decline, the pound retains ambition to regain lost ground
- EUR/USD: thaw in US-China trade relations lends a helping hand to the euro
- Dollar: collapse is just around the corner?
- January 14, 2020 : EUR/USD Intraday technical analysis and trade recommendations.
- January 14, 2020 : GBP/USD Intraday technical analysis and trade recommendations.
- EUR/USD. January 14. The pair's last call to sell with a target of 1.1042
- GBP/USD. January 14. The last call of the pair to fall to the level of 1.2904
- BTC analysis for 01.14.2020 - Major resistance zone at the price of $8.500 on the test, watch for selling opportunities
- Evening review for EURUSD on 01/14/2020. Euro will have to choose a direction
- Gold 01.14.2020 - Sell zone on the Gold, downward target is set at the price of $1.536
- EUR/USD for January 14,2020 - Watch for selling opporrtunities due to rejection of the resistance, main target at the price
- Oil deprived of important trump card
- Technical analysis of EUR/USD for January 14, 2020
- EUR/USD and the US inflation
- Analysis of EUR/USD and GBP/USD for January 14. UK's GDP report makes another trip to pound
- Signing of the first phase of the trade agreement between the US and China will be positive for the markets (we expect a
- Trading plan for EUR/USD and GBP/USD on 01/14/2020
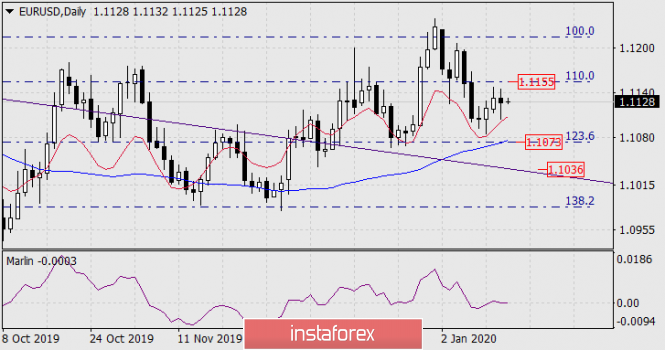
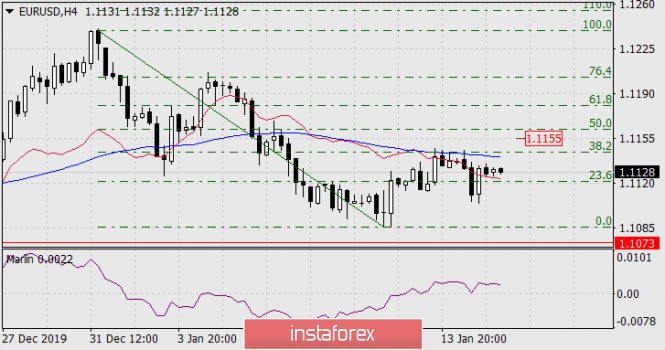
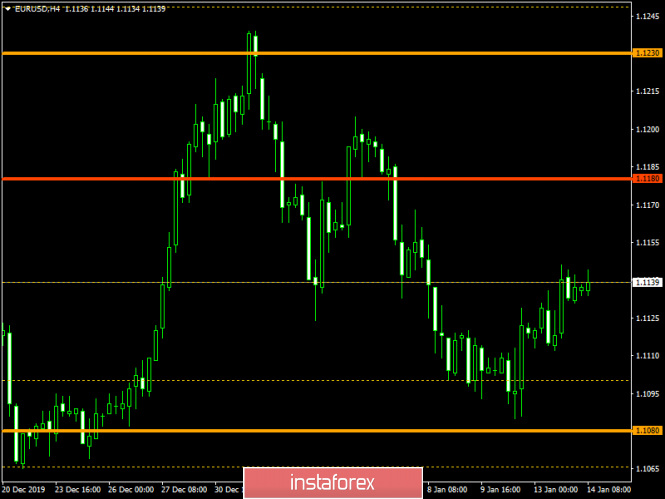
| Forecast for EUR/USD on January 15, 2020 Posted: 14 Jan 2020 07:02 PM PST EUR /USD The dollar slightly strengthened on Tuesday, with the release of inflation data for the United States, but investors found the data not sufficient enough for a more decisive offensive. As a result, the euro showed a decline of only five points by the close of the day. The basic consumer price index added 0.1% for December against the expected 0.2%, while maintaining an annual value of 2.3%. On the daily chart, the signal line of the Marlin oscillator moves sideways directly along the boundary of the bullish and bearish trends, which creates the risk of continued correctional growth to the Fibonacci level of 110.0% at the price of 1.1155. If the potential is not realized, a planned decrease to the Fibonacci level of 123.6% will follow at the price of 1.1073, where the MACD indicator line also passes. On the four-hour chart, a price reversal from the MACD line was noted, but not fully realized. At the moment, the price is already above the balance line (red moving) and the Marlin oscillator is holding in the growth zone, which shows the price's intention to once again attack the MACD line. Now the condition for a further decrease is overcoming the price of yesterday's low. In general, the situation is neutral and the euro may cheer up today's data on industrial production for November (forecast 0.3%), but tomorrow retail sales in the US for December will be released, the forecast for which is 0.5% for basic sales and 0.3% for general . It is likely that investors are planning more active actions for this data. The material has been provided by InstaForex Company - www.instaforex.com |
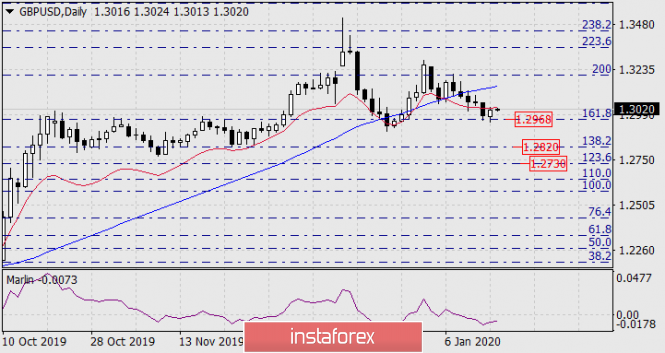
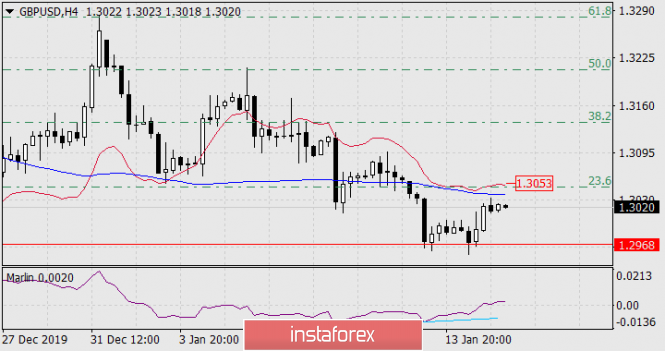
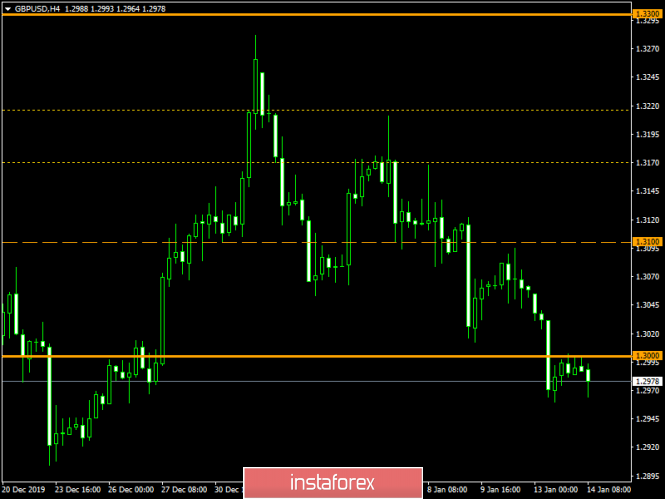
| Forecast for GBP/USD on January 15, 2020 Posted: 14 Jan 2020 07:02 PM PST GBP/USD The British pound slightly grew on Tuesday, on track for closing the gap open on Monday. About 40 points remain until the task is completed. There is data on inflation for December in the UK. The basic and general CPIs are projected unchanged at 1.7% YOY and 1.5% YOY, retail prices may rise from 2.2% YOY to 2.3% YOY, residential property price index is expected to grow from 0.7% YOY to 1.1% YOY. If the indicators come out better than expected, the pound may overlap the gap to some extent. The retail sales forecast for basic sales of 0.5% and 0.3% for the general market will be released in the US tomorrow. The data may trigger the pound into a new wave of decline, where the first target is the Fibonacci level of 138.2% at the price of 1.2820. The margin of the Marlin oscillator signal line to the boundary with the growth territory allows the price to safely complete the correction. The Marlin convergence worked on a four-hour chart - the price went up. The signal line of the indicator is already in the growth zone, which provides strength to the price to continue growth with a temporary exit above the MACD line.... |
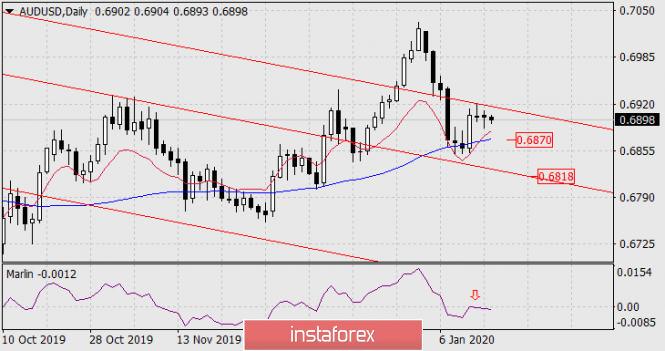
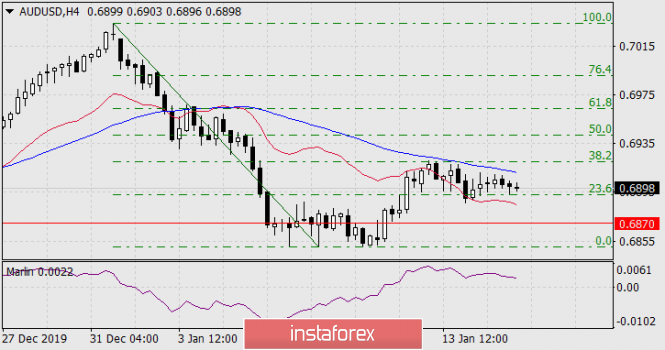
| Forecast for AUD/USD on January 15, 2020 Posted: 14 Jan 2020 07:02 PM PST AUD/USD The Australian dollar has not shown initiative in a calm market for the past two days. The price on the daily chart is between the resistance of the price channel and the support of the MACD line. You need a good driver in order to move in any direction here. Today, pressure on the aussie can continue from the commodity markets (unless oil changes its mind to decline, as iron ore did yesterday, which jumped 1.19% on China's trade balance data, which showed an increase from 274 billion yuan in December to 329 billion), and tomorrow, the US dollar can take control of the situation, using data on retail sales for December, the forecast for which is 0.3%. The immediate goal is to support the MACD line (0.6870). The second goal is the embedded line of the red price channel in the region of 0.6818. The signal line of the Marlin oscillator is already turning from the boundary with the growth zone. The situation is neutral on the H4 chart. The price between the indicator lines of the balance and MACD, Marlin slowly decreases in the growth zone following the price. The material has been provided by InstaForex Company - www.instaforex.com |
| USD/CAD bounce in progress above support! Posted: 14 Jan 2020 06:34 PM PST
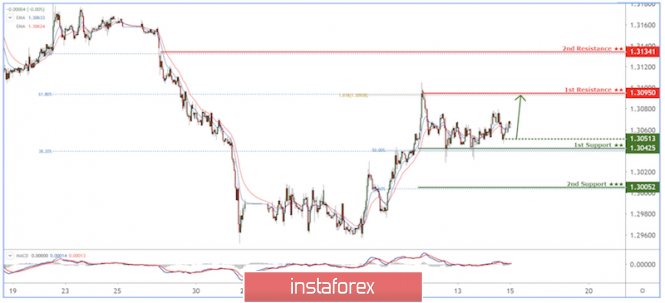
Trading Recommendation Entry: 1.30425 Reason for Entry: 50% and 38.2% Fibonacci retracement, graphical swing low Take Profit : 1.30950 Reason for Take Profit: 161.80% Fibonacci extension, 61.8% Fibonacci retracement, horizontal swing high Stop Loss: 1.30052 Reason for Stop loss: 78.6% Fibonacci retracement The material has been provided by InstaForex Company - www.instaforex.com |
| EUR/USD bouncing off support, potential for further rise! Posted: 14 Jan 2020 06:32 PM PST
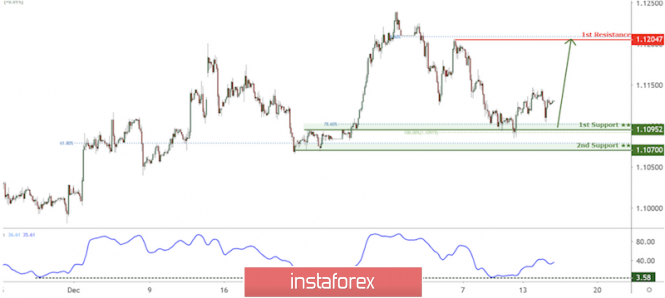
Trading Recommendation Entry: 1.10952 Reason for Entry: horizontal overlap support, 78.6% fibonacci retracement, 100% Fibonacci extension Take Profit : 1.12047 Reason for Take Profit: 78.6% Fibonacci retracement, horizontal swing high resistance Stop Loss: 1.10700 Reason for Stop loss: horizontal swing low support The material has been provided by InstaForex Company - www.instaforex.com |
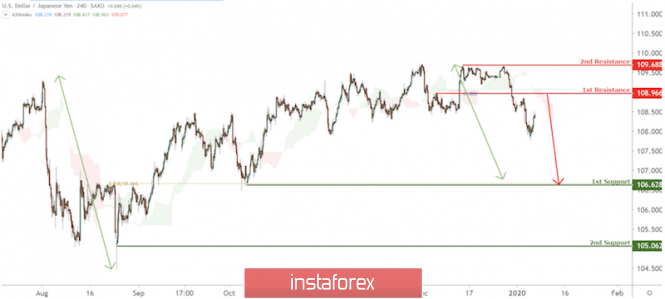
| USD/JPY potential bounce coming! Posted: 14 Jan 2020 06:30 PM PST
Trading Recommendation Entry:106.71 Reason for Entry: 61.8% Fibonacci extension Take Profit :108.42 Reason for Take Profit: 61.8% Fibonacci retracement Stop Loss: 105.06 Reason for Stop loss: Horizontal swing low support The material has been provided by InstaForex Company - www.instaforex.com |
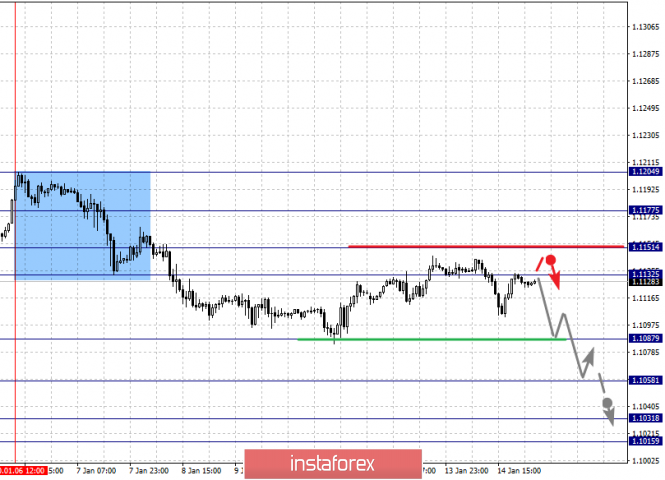
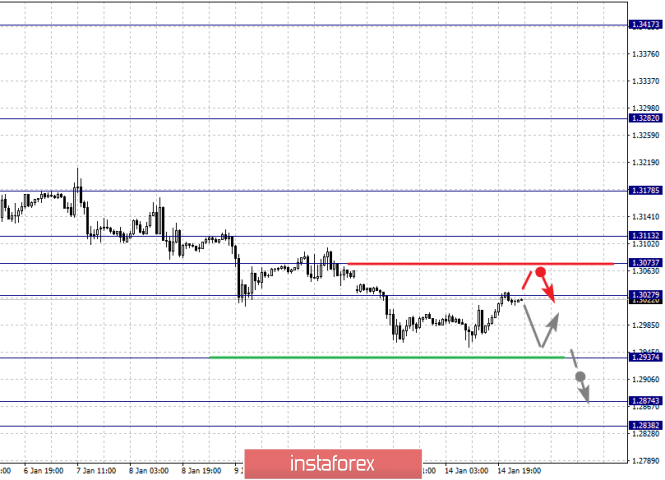
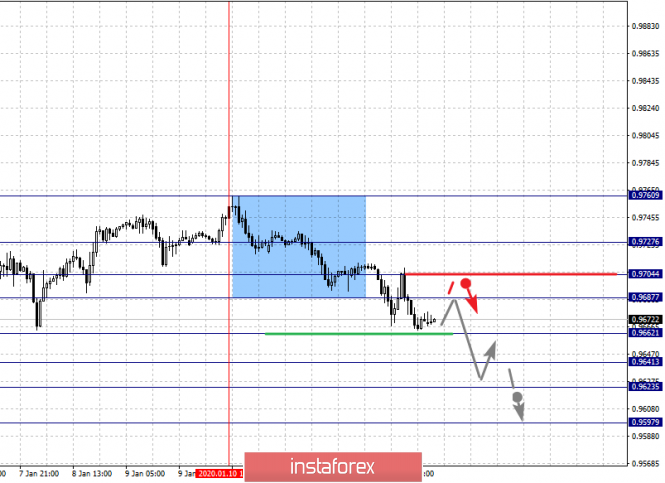
| Fractal analysis for major currency pairs on January 15 Posted: 14 Jan 2020 05:23 PM PST Forecast for January 15: Analytical review of currency pairs on the scale of H1:
For the euro / dollar pair, the key levels on the H1 scale are: 1.1177, 1.1151, 1.1132, 1.1087, 1.1058, 1.1031 and 1.1015. Here, we continue to monitor the local descending structure of January 6. The continuation of the movement to the bottom is expected after the breakdown of the level of 1.1087. In this case, the target is 1.1058. Price consolidation is near this level. The breakdown of the level of 1.1056 will lead to movement to a potential target - 1.1015. Price consolidation is in the range of 1.1015 - 1.1031, and from here, we expect a rollback to the top. Consolidated movement is possibly in the range of 1.1132 - 1.1151. The breakdown of the last value will lead to an in-depth correction. Here, the goal is 1.1177. This level is a key support for the downward structure. The main trend is the local descending structure of January 6 Trading recommendations: Buy: 1.1153 Take profit: 1.1175 Buy: 1.1178 Take profit: 1.1204 Sell: 1.1085 Take profit: 1.1060 Sell: 1.1056 Take profit: 1.1034
For the pound / dollar pair, the key levels on the H1 scale are: 1.3113, 1.3073, 1.3027, 1.2937, 1.2874 and 1.2838. Here, the continuation of the development of the downward cycle of December 31 is expected after the breakdown of the level of 1.2937. In this case, the target is 1.2874. For the potential value for the bottom, we consider the level of 1.2838. Upon reaching this level, we expect consolidation, as well as a rollback to the top. It is possible that the correction can be avoided after the breakdown of the level of 1.3027. Here, the first goal is 1.3073. The level of 1.3113 is the key support for the downward structure. Its passage in price will have the potential to form the initial conditions for the upward cycle. In this case, the potential goal is 1.3178. The main trend is the descending structure of December 31 Trading recommendations: Buy: 1.3027 Take profit: 1.3073 Buy: 1.3074 Take profit: 1.3113 Sell: 1.2935 Take profit: 1.2875 Sell: 1.2872 Take profit: 1.2838
For the dollar / franc pair, the key levels on the H1 scale are: 0.9727, 0.9704, 0.9687, 0.9662, 0.9641, 0.9623 and 0.9597. Here, the price registered the expressed initial conditions for the downward movement of January 10. The continuation of the movement to the bottom is expected after the breakdown of the level of 0.9662. In this case, the target is 0.9641. Short-term downward movement, as well as consolidation is in the range of 0.9641 - 0.9623. For the potential value for the bottom, we consider the level of 0.9597. Upon reaching this level, we expect a pullback to the top. Short-term upward movement is possibly in the range of 0.9687 - 0.9704. The breakdown of the latter value will lead to an in-depth correction. Here, the target is 0.9727. This level is a key support for the bottom. The main trend is the initial conditions for the bottom of January 10 Trading recommendations: Buy : 0.9687 Take profit: 0.9702 Buy : 0.9706 Take profit: 0.9725 Sell: 0.9661 Take profit: 0.9642 Sell: 0.9639 Take profit: 0.9624
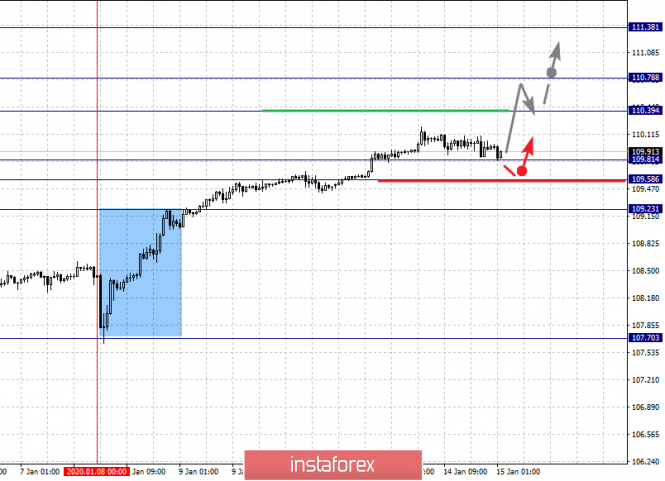
For the dollar / yen pair, the key levels on the scale are : 111.38, 110.78, 110.39, 109.81, 109.58 and 109.23. Here, we are following the development of the upward cycle of January 8. At the moment, we expect a movement to the level of 110.39. The breakdown of which will allow us to count on movement to the level of 110.78. Price consolidation is near this value. The breakdown of the level of 110.80 should be accompanied by a pronounced upward movement. Here, the potential target is 111.38. Short-term downward movement is possibly in the range 109.81 - 109.58. The breakdown of the latter value will lead to an in-depth correction. Here, the goal is 109.23. This level is key support for the top. The main trend: the upward cycle of January 8. Trading recommendations: Buy: 110.40 Take profit: 110.76 Buy : 110.80 Take profit: 111.35 Sell: 109.80 Take profit: 109.58 Sell: 109.55 Take profit: 109.25
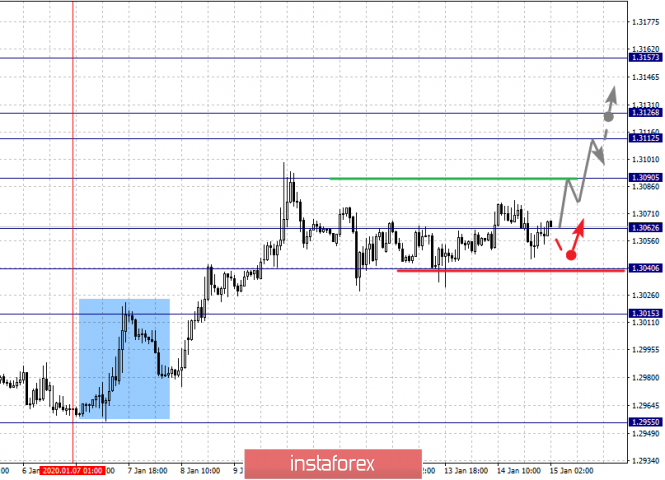
For the Canadian dollar / US dollar pair, the key levels on the H1 scale are: 1.3157, 1.3126, 1.3112, 1.3090, 1.3062, 1.3040 and 1.3015. Here, we are following the development of the upward cycle of January 7. The continuation of the movement to the top is expected after the breakdown of the level of 1.3090. In this case, the target is 1.3112. Price consolidation is in the range of 1.3112 - 1.3126. For the potential value for the top, we consider the level of 1.3157. Upon reaching this level, we expect a pullback to the bottom. Short-term downward movement, as well as consolidation are possible in the range of 1.3062 - 1.3040. The breakdown of the latter value will lead to an in-depth correction. Here, the target is 1.3015. This level is a key support for the top. The main trend is the upward cycle of January 7, the correction stage Trading recommendations: Buy: 1.3090 Take profit: 1.3112 Buy : 1.3126 Take profit: 1.3155 Sell: 1.3062 Take profit: 1.3042 Sell: 1.3038 Take profit: 1.3015
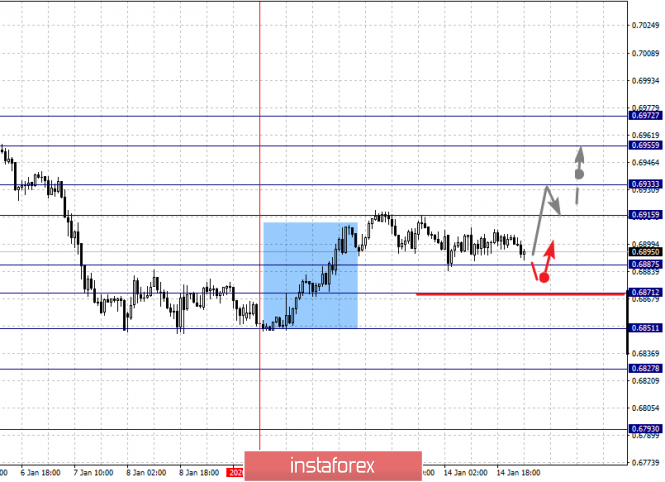
For the Australian dollar / US dollar pair, the key levels on the H1 scale are : 0.6972, 0.6955, 0.6933, 0.6915, 0.6887, 0.6871, 0.6851, 0.6827 and 0.6793. Here, the price forms the potential for the upward movement of January 9 in the correction of the downward cycle of December 31. Short-term movement to the top is expected in the range of 0.6915 - 0.6933. The breakdown of the last value will lead to a pronounced movement. Here, the target is 0.6955. For the potential value for the top, we consider the level of 0.6972, upon reaching this value we expect consolidation, as well as a pullback to the bottom. Short-term downward movement is expected in the range 0.6887 - 0.6871. The breakdown of the last value will have the subsequent development of the downward structure. Here, the first goal is 0.6851. As a potential value for the bottom, we consider the level of 0.6793. The movement to which is expected after the breakdown of the level of 0.6825. The main trend is the descending structure of December 31, the formation of potential for the top of January 9 Trading recommendations: Buy: 0.6915 Take profit: 0.6930 Buy: 0.6935 Take profit: 0.6955 Sell : 0.6887 Take profit : 0.6873 Sell: 0.6870 Take profit: 0.6852
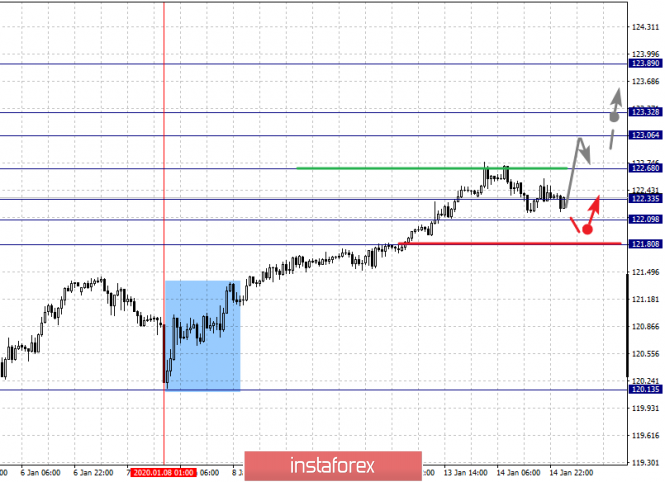
For the euro / yen pair, the key levels on the H1 scale are: 123.89, 123.32, 123.06, 122.33, 122.09 and 121.80. Here, we monitor the development of the upward cycle of January 8 and currently, a movement to the level of 123.06 is expected. Short-term upward movement, as well as consolidation is in the range of 123.06 - 123.32. The breakdown of the level of 123.35 will lead to a movement to a potential target - 123.89. We expect a pullback to the bottom from this level. Short-term downward movement is possibly in the range of 122.33 - 122.09. The breakdown of the last value will lead to an in-depth correction. Here, the goal is 121.80. This level is a key support for the upward structure. The main trend is the upward cycle of January 8 Trading recommendations: Buy: 122.70 Take profit: 123.05 Buy: 123.06 Take profit: 123.30 Sell: 122.33 Take profit: 122.10 Sell: 122.07 Take profit: 121.84
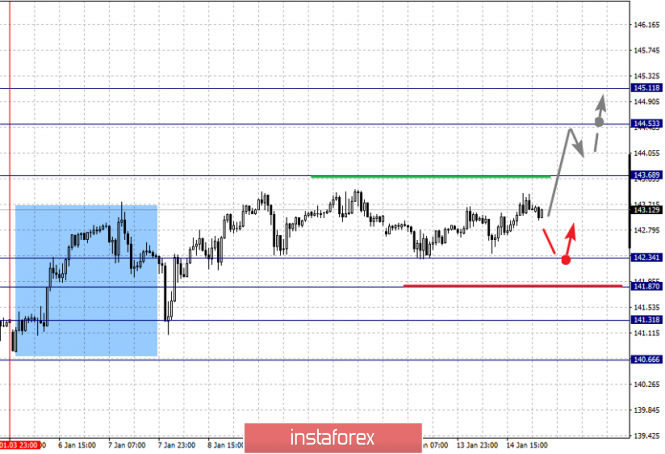
For the pound / yen pair, the key levels on the H1 scale are : 145.11, 144.53, 143.68, 142.34, 141.87, 141.31 and 140.66. Here, we are following the development of the upward structure of January 3, after the abolition of the downward trend. We expect further upward movement after the passage at the price level of 143.70. In this case, the target is 144.53. Price consolidation is near this value. For the potential level for the top, we consider level 145.11, from which we expect a pullback to the bottom. Short-term downward movement is possible in the range of 142.34 - 141.87. The breakdown of the latter value will lead to an in-depth correction. Here, the goal is 141.31. This level is a key support for the upward structure. The main trend is the upward structure of January 3 Trading recommendations: Buy: 143.70 Take profit: 144.50 Buy: 144.55 Take profit: 145.10 Sell: 142.34 Take profit: 141.90 Sell: 141.85 Take profit: 141.35 The material has been provided by InstaForex Company - www.instaforex.com |
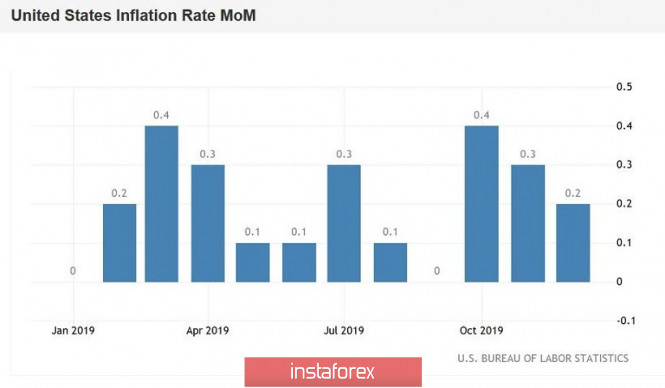
| Posted: 14 Jan 2020 02:54 PM PST The euro-dollar pair reacted minimally to conflicting data on the growth of US inflation. Almost all components reached the forecast level, but some of the nuances of the release are nevertheless alarming, especially with regard to the dynamics of wage growth. In general, nothing catastrophic happened: the indicators were not impressive, but at the same time they didn't particularly disappoint. Immediately after the publication of the data, the pair fell to the bottom of the 11th figure, as they say, "seizing the moment." But since there were no obvious reasons for optimism, sellers were not able to push the price into the area of the 10th figure. By and large, the pair remained almost at the same positions as before the release. What is the reason for such apathetic traders? In my opinion, such price dynamics are due to several fundamental factors. Firstly, the inflation release as a whole turned out to be at the expected level. The monthly average consumer price index slowed down to 0.2%. The negative dynamics here can be traced for the second month in a row, after the index reached 0.4% in October. The indicator has grown in annual terms, thereby continuing the positive trend, which has been recorded for the third consecutive month. If the indicator reached 1.7% in September, then it rose to 2.3% in December. Most experts expected to see it slightly higher (2.4%), but the trend itself is important here. If we talk about the core consumer price index (that is, excluding food and energy prices), then the situation here is also "neutral-contradictory" in nature. On a monthly basis, the index did not reach the forecast values (+0.1% instead of the planned +0.2%), but in annual terms, it completely coincided with the expectations of most experts (an increase of up to 2.3%, as in the previous two months). Salaries significantly disappointed. This component probably kept the EUR/USD pair from falling into the 10th figure. After the publication of rather weak Nonfarms, today's figures only supplemented the negative picture in this area. The growth rate of the real average weekly wage came out at zero, while in the previous month this indicator came out at 0.8%. The growth rate of the real average hourly wage also turned out to be lower than forecasts - the growth was 0.6%, while analysts had expected a jump to 1.1%. According to some experts, there is no need to panic - during the pre-Christmas and New Year period, the employment of seasonal workers increased in the US, and this factor of a seasonal nature, apparently, was not taken into account with appropriate adjustments. On the other hand, the Nonfarms inflation component entered the red zone: the average hourly wage was at 0.1% on a monthly basis (the worst result since September last year, when it dropped to zero) and 2.9 % per annum (the weakest figures since July 2018). Thus, the EUR/USD bears had no good reason for the downward dynamics. On the one hand, the release could have been much worse (taking into account the dynamics of indirect inflation indicators), on the other hand, today's figures may have a corresponding effect on the position of the Federal Reserve members regarding monetary policy prospects, especially against the background of sluggish Nonfarms. Jerome Powell has repeatedly said that the regulator will begin to raise interest rates only if inflation demonstrates "dynamic and steady growth." Obviously, today's data does not meet the specified criteria. Nevertheless, the dollar is still holding the defense. Traders seem to be nervous about tomorrow's events. Let me remind you that on Wednesday, the first phase of the trade deal between the United States and China should be signed in Washington. The first details of this agreement appeared in the Chinese press. According to them, it includes Beijing's reassurance that China will acquire US goods in four industries for a total of $200 billion over two years. In addition, the Chinese side pledged to purchase a substantial amount of US industrial products ($75 billion), energy - $50 billion, agricultural products - $40 billion. China also agreed to spend 35 billion on purchases in the US services sector. The signing ceremony will take place at the White House, although Trump said yesterday that she could be postponed "to a later date." In anticipation of this historic event, the market is clearly nervous, and this fact is reflected in the dynamics of the US currency. Nevertheless, short positions in the pair now look extremely risky. After the first emotions about the conclusion of the deal settle down, the focus of the market will again shift to macroeconomic statistics. This means that the dollar continues to be vulnerable, despite certain outbursts of interest in this currency. Technically, the EUR/USD pair continues to be on the middle line of the BB indicator on the daily chart, although today the bears tried to pull down the price. However, the downward movement is accompanied by oncoming resistance, and now it is impossible to talk about the prospects for the downward impulse. The situation remains in limbo, so at the moment it is advisable to take a wait-and-see attitude in view of the increased uncertainty in anticipation of tomorrow's events. The material has been provided by InstaForex Company - www.instaforex.com |
| GBP/USD: despite the decline, the pound retains ambition to regain lost ground Posted: 14 Jan 2020 02:54 PM PST The GBP/USD pair sank below 1.30, reaching its lowest level since late December. The fall of the pound followed the disappointing economic data for the United Kingdom and the comments of representatives of the Bank of England, indicating the regulator's readiness to lower interest rates. It seems that the example of the Federal Reserve, which resorted to three cuts in the interest rate for preventive purposes, was contagious. Any central bank has a choice: either wait for the recession to occur, the arsenal of tools to combat which may be limited (as is the case with BoE), or act ahead of time to prevent a recession. Judging by the latest comments, more and more representatives of the Bank of England Monetary Policy Committee are leaning toward the second option. BoE Governor Mark Carney argues that easing monetary policy is virtually on the table, with MPC members Gertjan Vlieghe and Silvana Tenreyro associating monetary expansion with a weak British economy. Is it any wonder then that after these statements in just a week, the chances of lowering the BoE interest rate in January increased from 5% to 52%, and in May - from 30% to 85%. Recall that at the last meeting of the BoE, they decided to maintain the interest rate at 0.75% with seven votes to two. If three more votes are added to these two votes, then we can expect changes in BoE's monetary policy in January. In addition, macrostatistics in the UK recently have not been pleasing to the eye. In November, national GDP fell by 0.3% in monthly terms. In order to grow by the end of the quarter, the economy needs to accelerate by 0.2% in December. It should be noted that the pound's fall might not have been so swift if it were not for the excessive optimism of speculators. By the end of the week, by January 7, they had increased their net bullish rates on GBP/USD to the highest level in a year and a half. However, the opposite process began - long positions began to actively close, which caused the British currency to fall below $1.3. If London and Brussels succeed in resolving relations until January 31, and the BoE refrains from lowering rates in January, then the holiday will very soon return to GBP/USD. "Investors must take advantage of any further depreciation of the pound to buy it, because concerns about weak economic data in the UK look excessive," BMO Capital Markets said. "Economic data for the UK is already old news, and even a potential interest rate cut by the BoE means that the pound's recovery at any increased budget spending will be even greater," said BMO strategist Stephen Gallo. The material has been provided by InstaForex Company - www.instaforex.com |
| EUR/USD: thaw in US-China trade relations lends a helping hand to the euro Posted: 14 Jan 2020 02:53 PM PST The EUR/USD pair pushed off the 1.11 mark in response to expectations about the acceleration of the eurozone economy and the signing of the first phase of a trade agreement between the United States and China. The thaw in Washington-Beijing trade relations, as well as signs that the Chinese economy was groping for the bottom, were good news for the euro. In addition, the geopolitical risks in the Middle East quickly came to naught. Obviously, headwinds for global and European GDP are gradually weakening, which allows the bulls to return to the game at EUR/USD. Further disappointing data on inflation and US retail sales for December and the publication of a minutes from the last meeting of the ECB Governing Council can contribute to the main currency pair's further growth. In addition, not even a few months have passed since Christine Lagarde took the helm of the ECB, and relations between the European regulator and the Bundesbank have noticeably improved. Earlier, the head of the German central bank, Jens Weidmann, took all the decisions of the French predecessor, Mario Draghi, with hostility, but now he supported her with a statement about the need for fiscal stimulus from Berlin. This is possible if the positions of politicians are close. The fact that Lagarde wants to be a "wise owl" and not a dove is a favorable factor for the euro. While the bulls on EUR/USD are trying to storm the resistance at 1.1135, however, to regain confidence in their abilities, they need to push quotes above 1.1155. It should be noted that the level of 1.1150 acts as a strong area of resistance, where the weekly high and support for the downward trend converge. It is expected that growth above 1.1150 will introduce resistance levels of 1.1170, 1.1205, 1.1230 and 1.1240, which have shown themselves on the eve of the New Year. The material has been provided by InstaForex Company - www.instaforex.com |
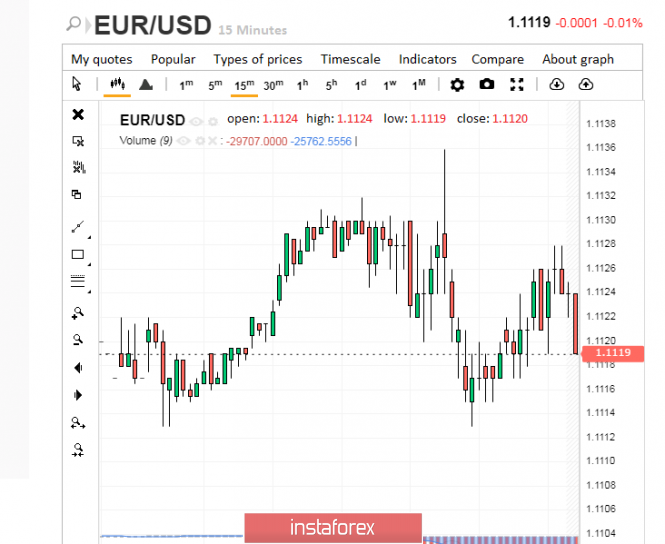
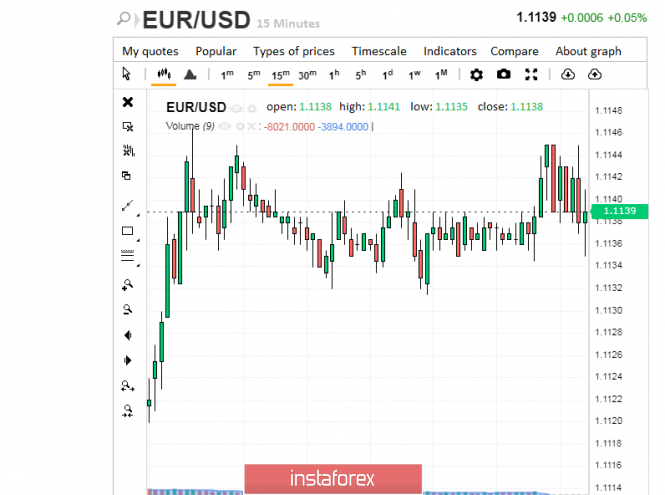
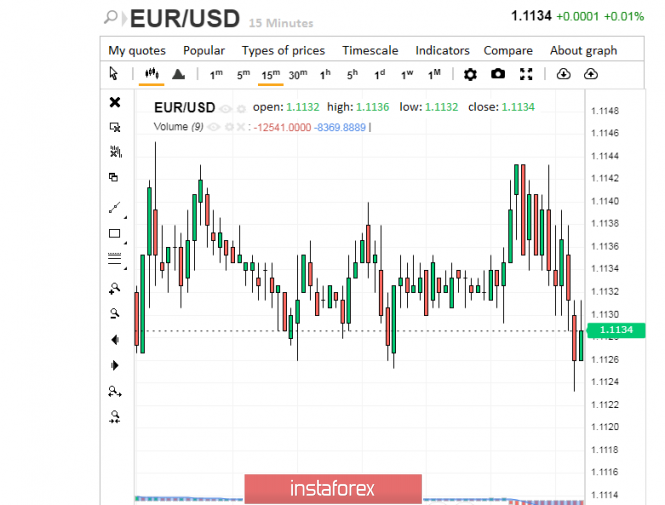
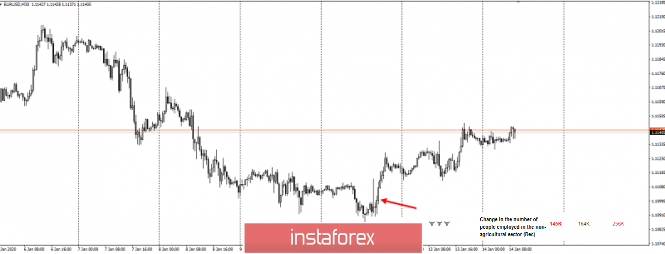
| Dollar: collapse is just around the corner? Posted: 14 Jan 2020 02:53 PM PST The current situation in the financial markets at first glance is favorable for the US currency. The upcoming signing of the first phase of a new trade agreement between Washington and Beijing, scheduled for this Wednesday, January 15, inspires optimism. However, experts note a number of factors that can undermine the credibility of the greenback. One of the reasons experts consider the slowdown in economic growth in the United States. Despite the power of the US economy, it is still present, being a fly in the ointment in a barrel of financial honey. An illustration is the indicator of employment in the non-agricultural sector of the United States, which amounted to 145 thousand people in December 2019, and over the past year, employment increased by 2.08 million people, which is less than the indicator of 2.51 million people recorded in 2018. Another factor in the slipping of the dollar may be data on the consumer price index for December. Experts have a double opinion on this score: current information can both support the US currency and push it down. The situation will depend on whether the current index value matches the previous forecast or the discrepancy with it. An additional driver of the greenback's potential fall may be the actions of the Federal Reserve. Recall that since the fall of 2019, the regulator has been implementing a quantitative easing (QE) program, skillfully disguised as other economic measures. However, the Fed's actions, which is not recognized in the conduct of QE, indicate the opposite, experts said A positive moment for the greenback was the attenuation of the Middle East conflict, the risk of further revelation of which was very great. The absence of a negative background from the Asian side contributed to a partial recovery of markets and increased investor risk appetite. However, the greenback was again under pressure, although it radiated confidence during the escalation of the Middle East crisis. The reason for this, in addition to the general slowdown in US economic growth, analysts believe the disappointing data on the number of new jobs for December 2019 recorded in the US economy. Recall that the number of new jobs amounted to 145 thousand compared to the forecast of 164 thousand. Low rates of average hourly wages added fuel to the fire. It fell to 0.1% in December, although economists had expected it to rise by 0.3%. On an annualized basis, the growth in average hourly wages decreased to 2.9% from the previous 3.1%. In this regard, many investors believe that the US economic growth rate will also decline. Such a situation could force the Fed to return to lower interest rates, analysts warn. The implementation of such a scenario will become a significant negative for the dollar, fueling its downward trend. The weakening of the greenback will be facilitated by the signing of an agreement between Washington and Beijing, while the demand for risky assets will increase. An additional factor of pressure on the greenback will be the current negative effect of macroeconomic statistics in the US, although its impact can not greatly undermine the dollar, experts said. Subsequently, the pair subsided to 1.1119, making desperate attempts to get out of this pit. However, its efforts were not rewarded as soon as expected. On Tuesday morning, January 14, the EUR/USD pair rose to the level of 1.1139, having won back yesterday's loss. Nevertheless, the pair failed to gain a foothold at this level. Currently, the EUR/USD pair runs near 1.1134, having slightly lost previous achievements, but still remaining in a relatively acceptable range. According to experts, the EUR/USD pair expects a difficult period. The euro will slow down the eurozone economy and the situation around Brexit, and the dollar will have to overcome the negative from the Fed stimulus measures and weak data on the number of new jobs in the US labor market. However, the pair will be able to cope with the situation and wrap the negativity to its advantage, experts said. The material has been provided by InstaForex Company - www.instaforex.com |
| January 14, 2020 : EUR/USD Intraday technical analysis and trade recommendations. Posted: 14 Jan 2020 11:31 AM PST
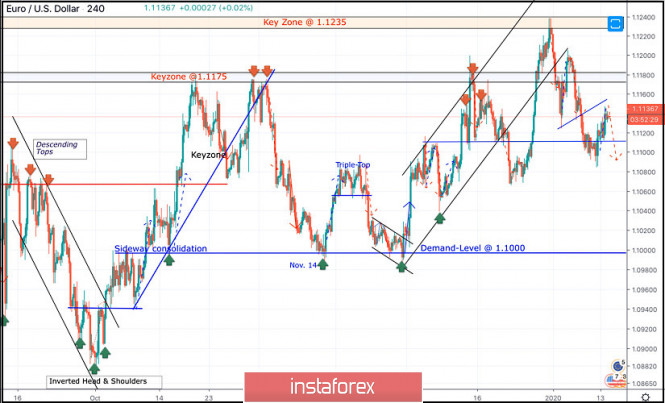
Since November 14, the price levels around 1.1000 has stood as a significant DEMAND-Level offering adequate bullish SUPPORT for the pair on two successive occasions. During this Period, the EUR/USD pair has been trapped within a narrow consolidation range between the price levels of 1.1000 and 1.1085-1.1100 (where a cluster of supply levels and a Triple-Top pattern were located) until December 11. On December 11, another bullish swing was initiated around 1.1040 allowing recent bullish breakout above 1.1110 to pursue towards 1.1175 within the depicted short-term bullish channel. Initial Intraday bearish rejection was expected around the price levels of (1.1175). Moreover, On December 20, bearish breakout of the depicted short-term channel was executed. Thus, further bearish decline was demonstrated towards 1.1065 where significant bullish recovery has originated. The recent bullish pullback towards 1.1235 (Previous Key-zone) was suggested to be watched for bearish rejection and another valid SELL entry. Suggested bearish position has achieved its targets while approaching the price levels around 1.1110. As expected, the Key-Level around 1.1110 has provided some bullish rejection. That's why, the current bullish pullback would be expected to pursue towards 1.1140 and probably 1.1175. On the other hand, for the bearish side of the market, bearish persistence below 1.1110 is needed to enable further bearish decline towards 1.1060 and probably 1.1040. Trade recommendations : Conservative traders should wait for any bullish pullback towards the price levels of (1.1140-1.1175) as another valid SELL signal. Bearish projection target to be located around 1.1120 and probably 1.1060. Any bullish breakout above 1.1190 invalidates the mentioned bearish trading scenario. The material has been provided by InstaForex Company - www.instaforex.com |
| January 14, 2020 : GBP/USD Intraday technical analysis and trade recommendations. Posted: 14 Jan 2020 11:25 AM PST
On December 13, the GBPUSD pair looked overpriced around the price levels of 1.3500 while exceeding the upper limit of the newly-established bullish channel. On December 23, initial bearish breakout below 1.3000 was demonstrated on the H4 chart. However, earlier signs of bullish recovery were manifested around 1.2900 denoting high probability of bullish breakout to be expected. Thus, Intraday technical outlook turned into bullish after the GBP/USD has failed to maintain bearish persistence below the newly-established downtrend line. That's why, bullish breakout above 1.3000 was anticipated. Thus, allowing the recent Intraday bullish pullback to pursue towards 1.3250 (the backside of the broken channel) where bearish rejection and another bearish swing were suggested for conservative traders in Last Week's previous articles. Intraday bearish target remains projected towards 1.3000 and 1.2980 provided that the current bearish breakout below 1.3170 is maintained on the H4 chart. Please also note that two descending highs are being demonstrated around 1.3120 and 1.3090 which enhances the bearish side of the market. Bearish breakdown below 1.2980 is needed first to enhance further bearish decline towards 1.2900 and probably 1.2800 where the backside of the previously-broken downtrend is located. Otherwise, Intraday traders can watch any bullish pullback towards the depicted price zone (1.3170 - 1.3200) for bearish rejection and another valid SELL entry with intraday bearish targets projected towards 1.3000 and 1.2980. The material has been provided by InstaForex Company - www.instaforex.com |
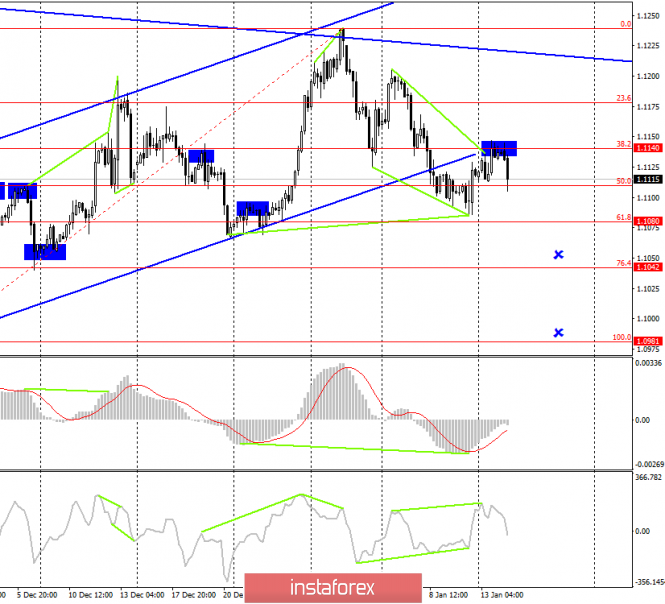
| EUR/USD. January 14. The pair's last call to sell with a target of 1.1042 Posted: 14 Jan 2020 07:15 AM PST EUR/USD - 4H.
As seen on the 4-hour chart, the EUR/USD pair still performed an increase to the corrective level of 38.2% (1.1140) even after the formation of a bearish divergence in the CCI indicator. The rebound from this Fibo level worked in favor of the US currency and the resumption of the fall, according to the trading ideas that I have voiced in the last few days. At the moment, the pair has made a drop to the corrective level of 50.0% (1.1109). I believe that traders will be able to break through this level today. The targets for falling quotes of the pair remain the same. The minimum is 1.1042 and the maximum is 1.0981. At the same time, if something prevents the pair from gaining a foothold under the previous local lows (1.1085), I will consider that the downward potential is exhausted or not convenient for working out and all sell signals will be considered canceled. Forecast and trading recommendations for EUR/USD: The long-term trading idea remains in force, as the pair's quotes performed a consolidation under the upward small corridor on the 24-hour chart. Traders got a target for a drop of about 250 points - around the level of 1.0850. The deadline is one to two weeks. For the second trading idea, I still expect a fall during the week to the corrective levels of 1.1042 and 1.0981. Bearish divergence + rebound from the Fibo level of 38.2% indicates the beginning of a new fall in the pair. Closing quotes below the corrective level of 50.0% will increase the probability of continuing the fall. The material has been provided by InstaForex Company - www.instaforex.com |
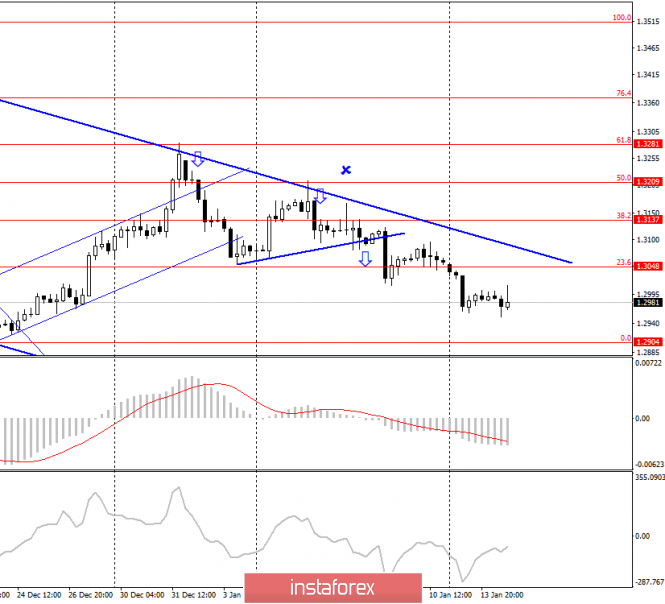
| GBP/USD. January 14. The last call of the pair to fall to the level of 1.2904 Posted: 14 Jan 2020 07:15 AM PST GBP/USD - 4H.
The GBP/USD pair, after fixing under the corrective level of 23.6% (1.3048), continues to fall in the direction of the last and main target level - the Fibo level of 0.0% (1.2904). At the moment, the pair has made a new approach to fall to this level, which is only 70 points away. Today, the divergence is not observed in any indicator. The pair is still moving following the general trend expressed by the downward trend corridor. Thus, I expect the pair to continue falling, especially since today it became known that inflation in America has accelerated to 2.3% per annum, which is undoubtedly a positive factor for the US dollar. Thus, both the "foundation" and the "chart" speak of the same thing - a further fall in the pair's quotes, according to my trading idea. Forecast and trading recommendations for GBP/USD: The current trading idea is to sell the pound with a target of 1.2904 since as many as three sales signals were received. I recommend moving Stop Loss levels outside the trend area or placing them behind the nearest corrective levels. The material has been provided by InstaForex Company - www.instaforex.com |
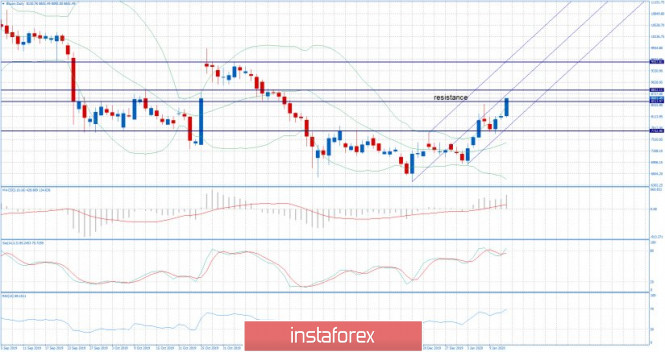
| Posted: 14 Jan 2020 04:42 AM PST Industry news: Chair Heath Tarbert told Cheddar Monday that his agency is helping create a regulated futures market that investors would be able to "rely on" for better "price discovery, hedging and risk management." "By allowing [cryptocurrencies] to come into the world of the CFTC," investors can better access trusted and regulated financial products, improving overall confidence in the asset class, according to Tarbert. "It's helping to legitimize [digital assets], in my view, and add liquidity to these markets," he said. The marketplace for cryptocurrencies derivatives is expanding. Although still dominated by unregulated exchanges, it is gradually facing greater competition from regulated alternatives. Bakkt launched physically-delivered bitcoin futures last September and CME, which first launched bitcoin futures in December 2017, opened trading for options contracts Monday. Technical analysis:
BTC has been trading upside with strong momentum and the price reached the level of $8.600. Anyway, there is solid resistance zone from $8.500-$8.800 and my advice is to be careful with long opportunities cause potential for downside correction. Watch for any bearish pattern around the resistance zone for potential sell position and target at $7.750. In case of the upside breakout of $8.800, watch for long opportunities on the dips with the target at $9.500. MACD oscillator is showing new momentum up and slow line is in bull mode... Major resistance level is set at the price of $8.800. Support levels and downward targets are set at the price of $8.420 and $7.750.. The material has been provided by InstaForex Company - www.instaforex.com |
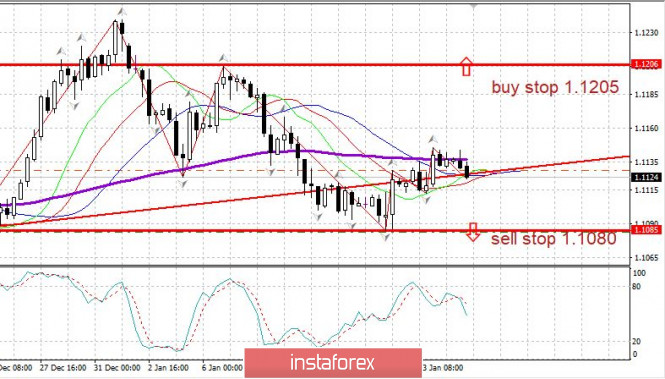
| Evening review for EURUSD on 01/14/2020. Euro will have to choose a direction Posted: 14 Jan 2020 04:41 AM PST
On Tuesday, sellers are trying to increase the pressure on the euro. The course is gradually slipping. So, consolidation in a narrow range continues. A trend is beginning to form that will last until the end of January: Or the EURUSD exchange rate will be able to overcome the mark of 1.120 up - and the movement "to the North" will begin"; Or, on the contrary, the euro will not stay above 1.1100, will break the minimum of 1.1085 - and then probably fall from 1.0900. So: we buy the euro for a breakthrough 1.1205. Or: we sell euros from 1.1084. The material has been provided by InstaForex Company - www.instaforex.com |
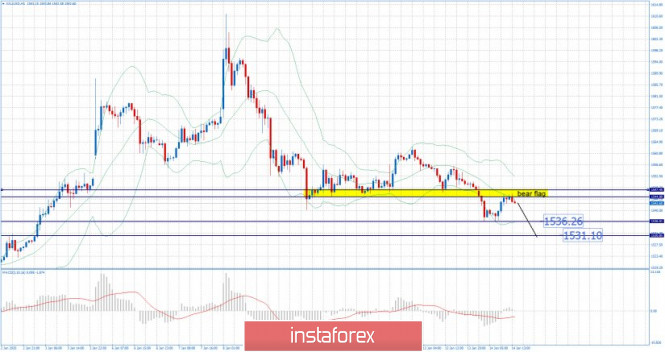
| Gold 01.14.2020 - Sell zone on the Gold, downward target is set at the price of $1.536 Posted: 14 Jan 2020 04:29 AM PST Gold has been trading upwards but it found strong resistance at the price of $1.545. My advice is to watch for selling opportunities with the downward targets at the price of $1.535 and $1.531.
Gold is still trading in the bearish trend and most recently I found rejection of the middle Bollinger band, which is sign that there is more downside yet to come. MACD oscillator is showing neutral stance and slow is trying to turn bearish. Major resistance level is set at the price of $1.545 Support levels and downward targets are set at the price of $1.536 and $1.531. The material has been provided by InstaForex Company - www.instaforex.com |
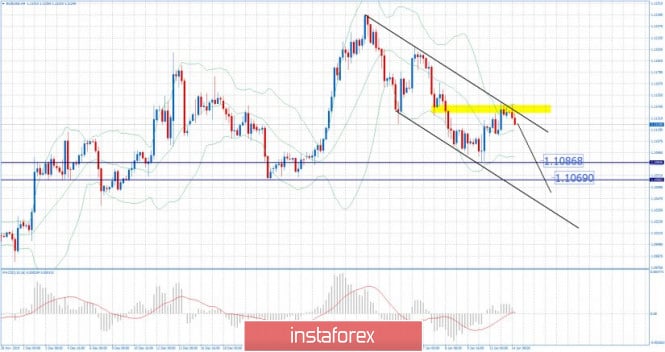
| Posted: 14 Jan 2020 04:17 AM PST EUR/USD has been trading upwards but it found strong resistance at the price of 1.1146. My advice is to watch for selling opportunities with the downward targets at the price of 1.1086 and 1.1069.
EUR/USD is still trading in the well-defined downside channel, which is good confirmation for further downside. Watch for selling opportunities on the rallies using intraday-frames 5/15 minutes. MACD oscillator is showing neutral stance and slow is is trying to turn bearish. Major resistance level is set at the price of 1.3145 Support levels and downward targets are set at the price of 1.1086 and 1.1069. The material has been provided by InstaForex Company - www.instaforex.com |
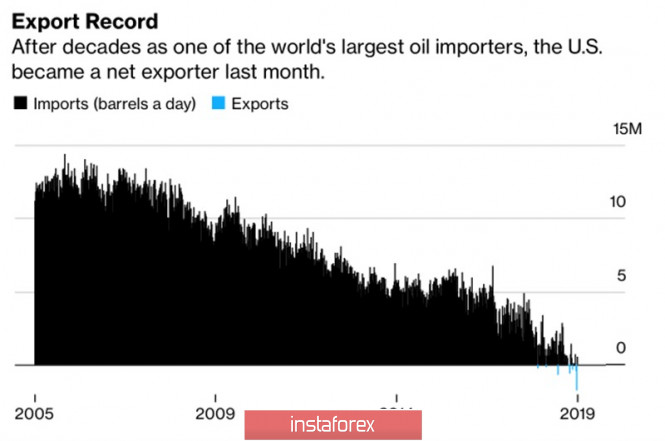
| Oil deprived of important trump card Posted: 14 Jan 2020 02:48 AM PST The oil market is getting used to a new reality, "short-term price spikes amid rising geopolitical tensions". The US-Iran conflict in January which is sending prices to an area of 8-month highs had much in common with the September events. Then, after attacks on industrial facilities in Saudi Arabia, the market started talking about supply disruptions, however, as soon as it turned out that the industry suffered minor damage, Brent together with WTI moved down. According to DNB Bank, in order for the North Sea variety to gain a foothold above $70 per barrel, investors need confidence in the supply of black gold. After the assassination of an Iranian general and an attack on US military bases in Iraq, the Middle East conflict was exhausted. Tehran did not block the Strait of Hormuz, Donald Trump did not start the war. As a result, the euphoria of speculators, which grew by the end of the first week of January to Brent net longs to their highest levels since October 2018, turned out to be excessive. It quickly gave way to panic and the closure of long positions. As a result, the North Sea variety was the worst five-day in six months. The avalanche-like closing of the longs is not the only reason for the sharp fall in prices for black gold. US oil companies are actively using Brent and WTI ups to hedge risks. They fix the high cost of oil, and then quietly increase production. This tactic has allowed the States to become the largest mining country in the world and for the first time in many years to receive the status of a net exporter. The dynamics of the American foreign trade in oil:
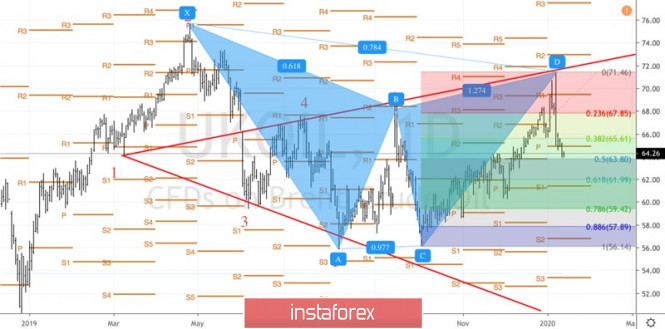
After going into the shadow of the geopolitical factor, the bulls on black gold can only count on the continued strong demand from China and on the OPEC + agreement to reduce production. Nevertheless, the second factor is already largely taken into account in futures quotes, and the Celestial Empire in 2020 can significantly reduce oil imports. In 2019, it increased by 9.5% yearly and reached a level of 506 million tons, which is equivalent to 10.12 million bps. In December, China imported 10.78 million bps, which is the second record high after the November 11.3 million bps. The reason should be sought in the construction of new refineries, however, according to China National Petroleum, in the new year, demand may decrease by almost half. Pressure will come from trade wars and a weak domestic car market. In my opinion, the fact that American producers managed to fix high oil prices as a result of hedging and now be able to increase production without any fear is a bad sign for the black gold market. It is not known whether the economies of the Middle Kingdom and the eurozone can begin to recover even after the signing of the trade agreement by Washington and Beijing, because tariffs on $370 billion of Chinese imports remain in force. Technically, after reaching the targets for the "Wolfe Waves" and Gartley patterns, a logical rollback followed. If the Brent bulls fail to control the support at $63.8 per barrel, the correction risks gaining momentum. Brent daily chart:
|
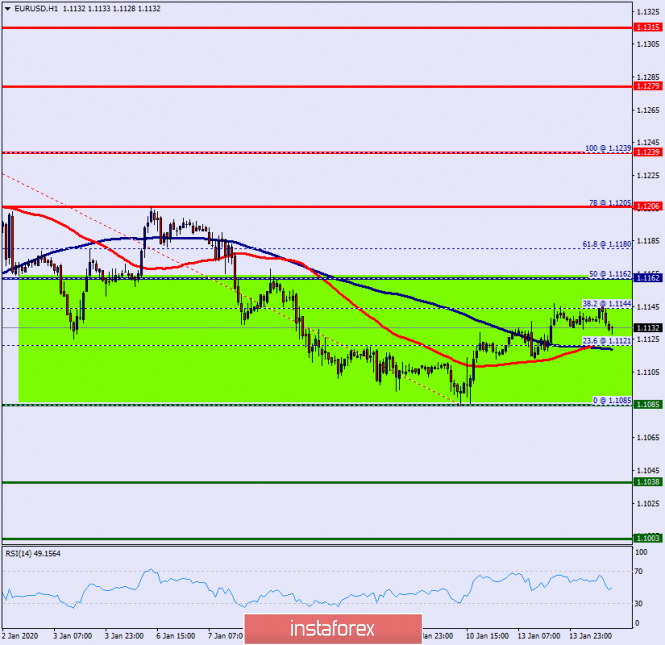
| Technical analysis of EUR/USD for January 14, 2020 Posted: 14 Jan 2020 02:46 AM PST Overview: The EUR/USD pair movement was debatable as it took place in a narrow sideways channel for a while. The market showed signs of instability. Amid the previous events, the price is still moving between the levels of 1.1162 and 1.1085 (range = 1.1162 - 1.1085 = 77 pips). The daily resistance and support are seen at the levels of 1.1162 and 1.1085 respectively. In consequence, it is recommended to be cautious while placing orders in this area. Thus, we should wait until the sideways channel has completed. The price spot of 1.1162 remains a significant resistance zone. Therefore, there is a possibility that the EUR/USD pair will move to the downside and the fall structure does not look corrective. Resistance is seen at the level of 1.1162 today. So, sell below 1.1162 with the first target at 1.1085 to test last week's bottom. In overall, we still prefer the bearish scenario as long as the price is below the level of 1.1162. Furthermore, if the NZD/USD pair is able to break out the bottom at 1.1085, the market will decline further to 1.1038. However, it would also be sage to consider where to place a stop loss; this should be set above the second resistance of 1.1206. we still prefer a bearish scenario at this phase. The material has been provided by InstaForex Company - www.instaforex.com |
| Posted: 14 Jan 2020 12:38 AM PST Good day, dear traders! Happy New Year to all, according to the Julian calendar. I wish you good luck and good financial well-being! Today, we have important news from the United States: the basic consumer price index (CPI), which is forecasted to be unchanged: Some might think that it doesn't mean anything, but it does actually. Moreover, at the moment, there is a very interesting intrigue on the dynamics of data from the States. Let me remind you that last Friday, the NFP passed a very weak report for the dollar: In this regard, the EUR/USD pair-strengthened its positions: After the news of the NFP inflation in the USA, there are three possible scenarios: 1. Strong data will strengthen the dollar, and the EUR/USD pair will fall. This will cause a CONFLICT BETWEEN the NFP and the CPI, which will confuse traders and make a flat of increased volatility. 2. Weak data will weaken the dollar, and the EUR/USD pair will rise. This will lead to a trend associated with a SERIES of WEAK DATA FROM the United States. 3. Inflation will not change and will remain at the forecasted level. This is the most boring option because everything that is laid by analysts has no volatility. Scenario 2 will show the best volatility and trend. Movements associated with an overlay or a series of unidirectional news have the brightest unidirectional trends. In any case, I recommend waiting for the news and work based on the numbers, not on expectations. Good luck in trading and control the risks! The material has been provided by InstaForex Company - www.instaforex.com |
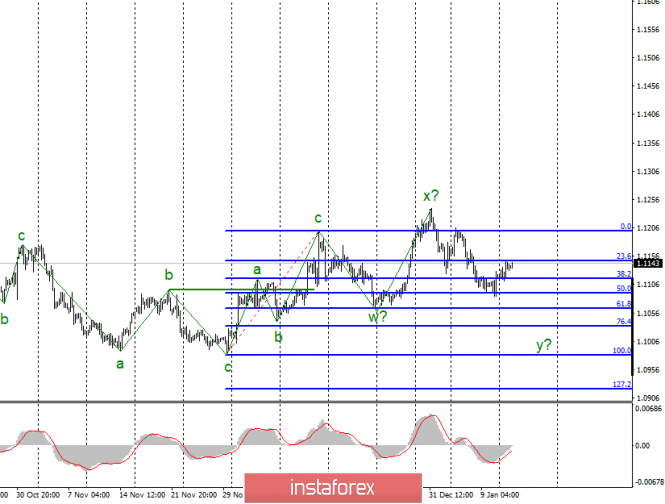
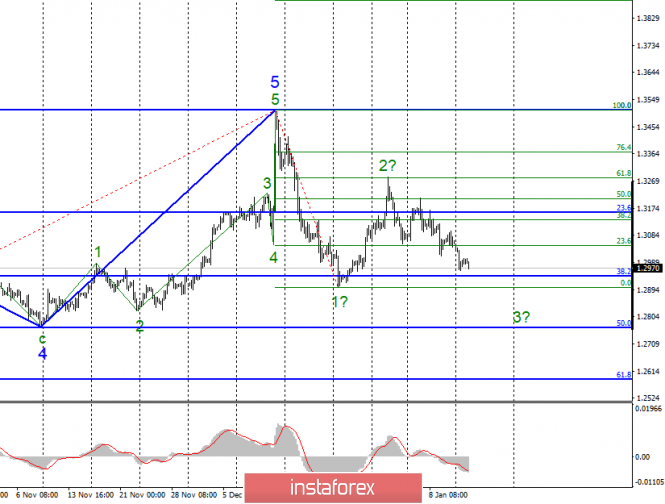
| Analysis of EUR/USD and GBP/USD for January 14. UK's GDP report makes another trip to pound Posted: 14 Jan 2020 12:37 AM PST EUR / USD On January 13, the EUR / USD pair gained about 15 basis points. However, the current wave marking remains the same, and I expect the instrument to turn down and go down as part of an unfinished downward wave y again. If this assumption is correct, then an unsuccessful attempt to break through the 23.6% Fibonacci level or a MACD signal "down" will indicate the readiness of the instrument for a new decrease. The wave pattern still does not look convincing enough, since there has not been a pulsed 5-wave segment of the trend for a long time. Fundamental component: There was no news background for the euro-dollar instrument on Monday. Not a single economic report came out over the past day, and the attention of the markets was turned to Britain, where important economic data were published. Meanwhile, the euro continued to seize the moment and continued to move away from the lows reached since there were no new weak data from the European Union. At the same time, I still expect the quotes of the instrument to decline due to the unfinished form of the wave y. Therefore, today, I hope for the help of the inflation report, which will be released this afternoon in America. According to market expectations, inflation in December will increase from 2.1% to 2.3%, which will certainly be regarded by the markets as a bear factor for the euro / dollar. Thus, we need a strong consumer price index in America to resume building the wave y. There is no other news on the calendar today. The political background remains unchanged and comes down to topics with impeachment by Trump and the Senate considering this case this week, a conflict with Iran, which seems to be put on hold and the expectation of signing a trade agreement between China and America from day to day. The signing of the agreement, by the way, can also support the dollar and cause additional demand for this currency. Still, the end of the conflict with China is good news for the US economy. General conclusions and recommendations: The euro-dollar pair allegedly completed the construction of the upward trend section. Thus, I would recommend resuming sales of the instrument with targets located near the levels of 1.1034 and 1.0982, which corresponds to 76.4% and 100.0% Fibonacci. Meanwhile, the MACD signal "down", which indicates the readiness of markets for building a new downward wave of y. GBP / USD On January 13, GBP / USD lost another 70 basis points and continues to build the alleged wave 3 as part of the bearish trend section, which may still turn out to be 3-wave. However, I believe that an impulse wave structure consisting of 5 will be built. Thus, quotes should minimally fall below the 29th figure. This will be enough for wave 3 to identify as well as with C. Fundamental component: The news background for the GBP / USD instrument on Monday was very important for the British currency, as the most important and significant economic reports for December were released. It turned out that GDP for this month "managed" to lose 0.3% immediately, although markets expected 0.0% and industrial production declined 1.6% y / y, which is also much worse than market expectations. In principle, this can end the description of yesterday's news background, since after such failures there can be no talk of any increase in the "Briton". Thus, wave 3 has the necessary news background to continue its construction. Moreover, today, this news background may intensify even more in the case of a strong report on inflation in the United States. Thus, the hopes of the pound / dollar instrument buyers are connected with the expectations of a weak report from America, otherwise, the instrument can already make a successful attempt to break the level of 1.2943, which corresponds to 38.2% Fibonacci. General conclusions and recommendations: The pound / dollar instrument continues to build a new downward trend. I recommend continuing to sell the instrument with targets near the level of 1.2764, which corresponds to the Fibonacci level of 50.0%. On the contrary, an unsuccessful attempt to break through the 38.2% Fibonacci level may lead to a small departure of quotes from the lows reached. The material has been provided by InstaForex Company - www.instaforex.com |
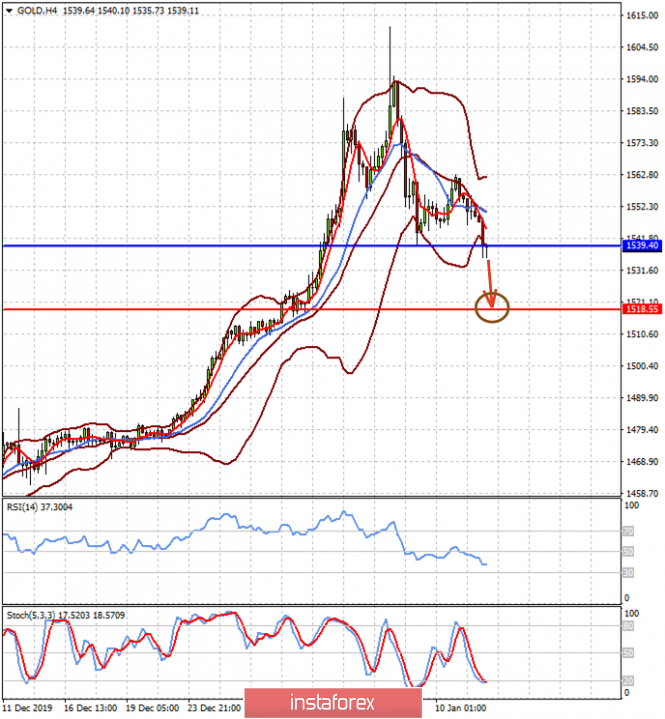
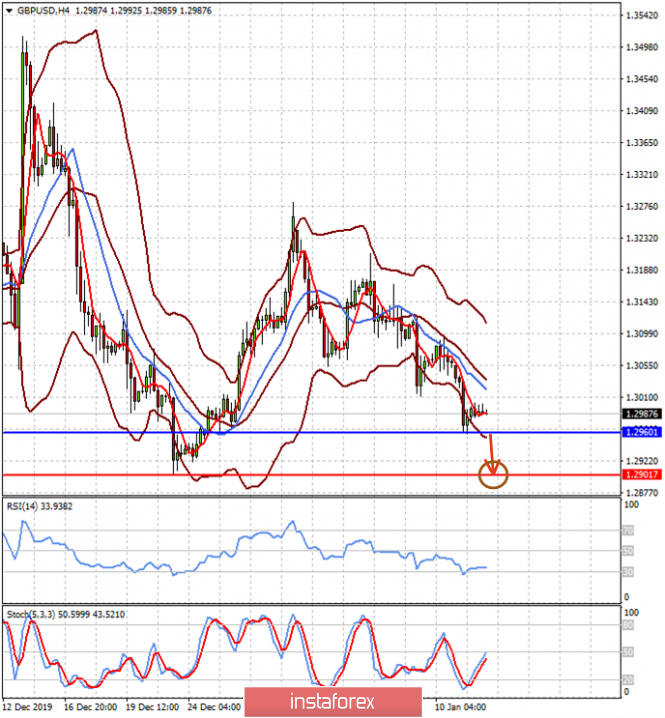
| Posted: 14 Jan 2020 12:37 AM PST The attention of the markets has completely focused on this topic, before the official meeting between D. Trump and Xi Jinping, at which a new trade agreement, the so-called "first phase", will be signed. The long-awaited meeting between the American and Chinese leaders will take place on Wednesday, at which, at last, a new trade agreement will be signed, which will resolve, although not all controversial trade issues between China and the United States, but, in any case, will allow laying the road to resolving this important contradiction, which has been affecting the world economy and financial markets for almost two years now. Now, what will be the reaction of the markets to this event? In our opinion, the reaction of investors to the fact of signing the first phase of the trade agreement is likely to be moderate if, of course, it does not contain any danger that will weaken it. In principle, everything that markets could win back in this news "clearing" has already happened. A noticeable positivity can manifest itself only if at this meeting some new actions are announced aimed at a complete settlement of this problem and there are doubts here. On the other hand, Former Fed Chairman J. Yellen, warned that the trade conflict between the two countries is still far from over during a speech at the Asian Financial Forum on Monday. She made it clear that there are a number of significant contradictions, which it is not yet possible to resolve, since there are noticeable contradictions between countries in the field of the latest technologies. She suggested that not introducing new trade duties under the "first phase" would not be "weighty" for US households. She also added that there is a topic of subsidizing Chinese national state business by the Chinese authorities, which puts American companies in unequal competitive conditions. However, a step forward towards the normalization of trade relations will be positive for the global economy despite these still apparent contradictions. It will reassure markets as much as possible in the current geopolitically unstable situation. This will increase the demand for risky assets in the short term. In our opinion, this will put pressure on the demand for protective assets. Gold, government bonds of economically developed countries, as well as the yen and the franc may be under pressure. At the same time, there is a probability of increased demand for commodity and commodity currencies. However, the dollar in a situation of "pacification" may be generally under pressure against the background of the Fed pursuing a course of soft monetary policy. Forecast of the day: GBP/USD remains under pressure in the wake of the fall in expectations of a rate increase by the Bank of England ahead of Brexit's historic decision on January 31. We believe that the pair will continue a limited decline to 1.2900 after crossing the level of 1.2960. Gold on the spot also has every chance to continue to decline against the background of the signing of a trade agreement between the United States and KN. From a technical point of view, it needs to stay below the level of 1539.40. In this case, it can continue to decline to 1518.55. |
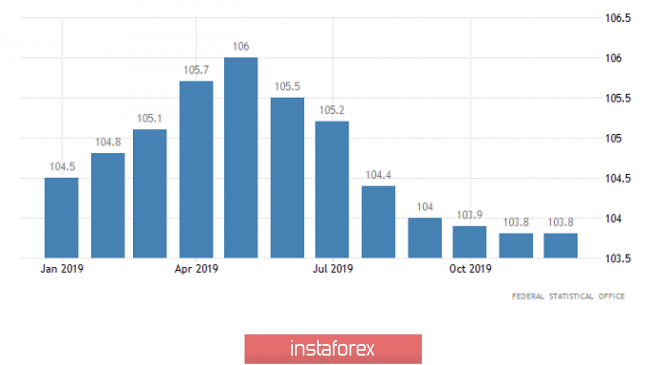
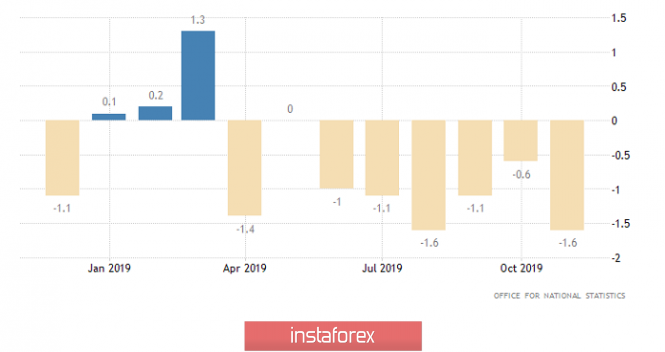
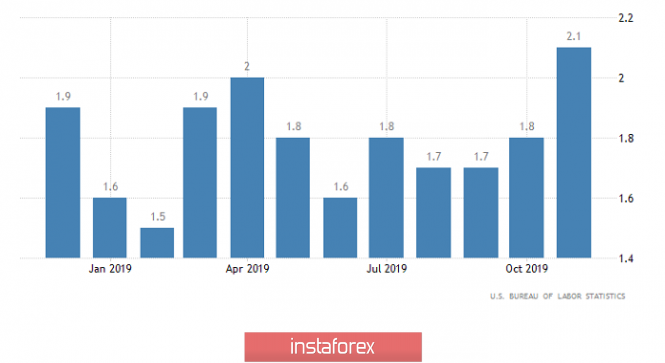
| Trading plan for EUR/USD and GBP/USD on 01/14/2020 Posted: 14 Jan 2020 12:25 AM PST Oddly enough, the pound and the single European currency behaved quite differently yesterday. The pound was steadily declining, although not much, but the single European currency was quite standing still, because you need a microscope in order to see its growth. But all this is completely due to objective reasons, especially the fact that both the pound and the single European currency were left to their own devices due to the complete absence of news from the United States. In part, the same uncertainty also explains some of the common European currency. Only secondary data were published for individual countries in the euro area. So, in Germany, the decline in wholesale prices slowed from -2.5% to -1.3%. And although this is encouraging about the possible increase in inflation in Germany, it should be noted that we are not talking about the whole of Europe, and also that a slowdown to -1.1% was predicted. But in Italy, the growth rate of retail sales slowed down from 1.0% to 0.9%, and although this is sad news, we must still admit that we are talking only about the third economy of the euro area, and its effect on the whole of Europe simply fades in Comparison with Germany. Therefore, European statistics clearly did not contribute to any noticeable progress. Well, the growth of the single European currency, although almost imperceptible, is largely due to the elementary overbought dollar. Wholesale prices (Germany): However, the pound fell noticeably, but it happened early in the morning, even before the publication of data on industrial production. The decline of which accelerated from -0.6% to -1.6%. At the same time, they expected acceleration of the recession to -1.4%, and it seems that investors either knew in advance that the data would turn out worse than forecasts, or simply began to prepare for the sad news in advance. And when they saw that the data really turned out to be worse than forecasts, they did not even pay attention to the fact that they overdid it a little. Like, and so it goes, what a horror is going on - the total deindustrialization of the United Kingdom. Moreover, industrial production has been declining for the eighth month in a row. Industrial Production (UK): There is even less news today, but this is news from the United States and what is much more interesting is that inflation data is published. It is not surprising that investors are looking forward to publishing these data given the fact that inflation is one of the two main indicators taken into account when deciding on the monetary policy parameters of the Federal Reserve System. In addition, market participants expect inflation to accelerate from 2.1% to 2.3%, since increasing inflation alone is a good factor for the dollar. If we add to this that inflation will then accelerate for the fourth month in a row, then it is still more interesting. The fact is that in this case this will be a confirmation of Jerome Powell's words that the Federal Reserve is taking a break. That is, translated into human language, this means that the Federal Reserve will definitely no longer be bullies and will leave the refinancing rate alone in the near future. Moreover, inflation is not just accelerating, it is still consolidating above the target level that has long been designated by the Federal Reserve System. This indicates the possibility that soon some of the representatives of the Federal Reserve System will begin to talk about the possibility of increasing the refinancing rate. To simply put it, the dollar is optimistic about the future and has high expectations for today's inflation data. Inflation (United States): The euro / dollar currency pair is in the correction phase, after the quote managed to get closer to the range level of 1.1080. It is likely to assume a temporary chatter relative to the value of 1.1145, with variable price jumps. In the afternoon, the correction phase may be under pressure, resuming a downward move against the background of the news flow. The pound/dollar currency pair quickly broke through the psychological level of 1.3000, forming a fixation platform under it. It is likely to assume that the downward interest may resume if the current sentiment is maintained and the price is fixed lower than 1.2960. |
| You are subscribed to email updates from Forex analysis review. To stop receiving these emails, you may unsubscribe now. | Email delivery powered by Google |
| Google, 1600 Amphitheatre Parkway, Mountain View, CA 94043, United States | |









No comments:
Post a Comment