Forex analysis review |
- Forecast for GBP/USD on January 23, 2020
- Forecast for AUD/USD on January 23, 2020
- Fractal analysis of the main currency pairs for January 23
- GBP/USD. January 22. Results of the day. UK's losses from Brexit are almost equal to contributions to the EU over 47 years
- EUR/USD. January 22. Results of the day. Positive effect of lowering the rate and restarting QE program is temporary and
- EUR/USD: is the dollar on the path of war?
- EUR/USD. Preview: ECB's January meeting
- USDCAD breaks bullish flag to the upside
- EURUSD at major support
- BTC analysis for 01.22.2020 - Coling market, watch for the breakout of rejection of the main pivot at $8.400 to confirm further
- Gold 01.22.2020 - Rejection of the major pivot resistance at the prrice of $1.562 in the background, selling opportunities
- EUR/USD for January 22,2020 - First downward target at the price of 1.1075 reached, second target at the price of 1.1040
- January 22, 2020 : EUR/USD Intraday technical analysis and trade recommendations.
- EUR/USD. January 22. We are still waiting for a fall to 1.1040
- GBP/USD. January 22. Two correction lines at once provide good opportunities for sales
- Fractal analysis for major currency pairs as of January 22
- January 22, 2020 : GBP/USD Intraday technical analysis and trade recommendations.
- Volume analysis and trading idea for oil
- Evening review for EURUSD for 01/22/2020. The key level for the euro - 1.1070
- Trading recommendations on EUR/USD for January 22
- Technical analysis of EUR/USD for January 22, 2020
- Gold weighs risks
- Is the Pound a candidate for outsiders? No!
- AUD/USD drop in progress. Further drop expected!
- Trading recommendations for GBP/USD on January 22
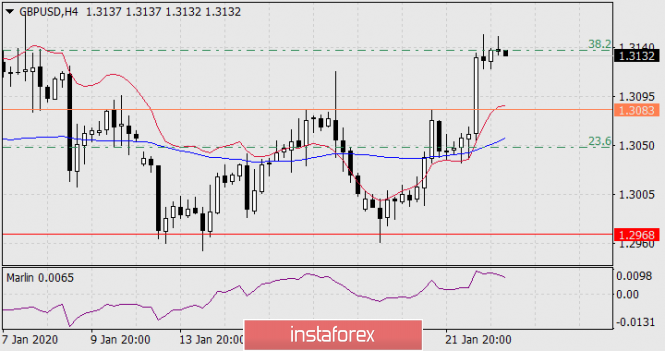
| Forecast for GBP/USD on January 23, 2020 Posted: 22 Jan 2020 08:16 PM PST GBP/USD On Wednesday, the House of Lords of the British Parliament passed the Brexit bill. The UK, as planned, will officially leave the EU on January 31. Then England and the EU countries will have 11 months to prepare trade agreements. The pound once again rose on the news of Brexit, adding 92 points yesterday. We once again believe that the growth of the pound is speculative since the divorce agreement does not give any advantages to the UK with the state that it had before leaving the EU.
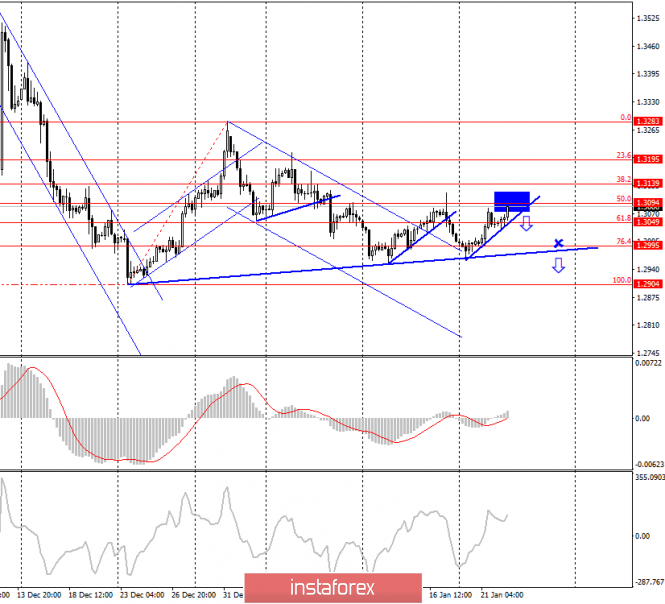
As seen on the four-hour chart, the price yesterday overcame the signal level of 1.3083, choosing an upward direction, as we assumed in yesterday's review, and reached the target of the corrective level of 38.2%. From the current level, the price may turn down, however, the Marlin oscillator, as a leading indicator, is in no hurry to turn around, so another growth impulse is possible to the area of the corrective level of 50.0% (1.3200).
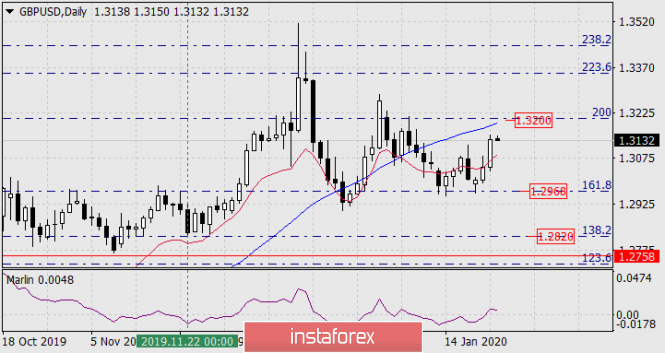
On the daily chart, there is a Fibonacci level of 200.0% near the price of 1.3200, which the MACD line is aiming for. The resistance is strong and it is likely to cause the price to turn down. The material has been provided by InstaForex Company - www.instaforex.com |
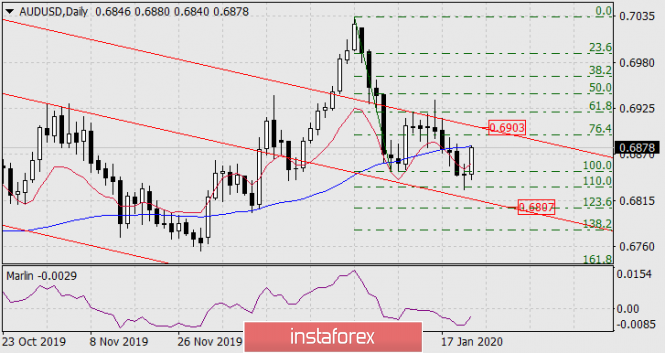
| Forecast for AUD/USD on January 23, 2020 Posted: 22 Jan 2020 07:26 PM PST AUD / USD The Australian dollar absorbed a positive market sentiment relative to the British pound yesterday, and just this morning, this news was actively played back on the positive employment data. By December, about 29 thousand people got a job, this is contrary and higher than the 15 thousand on the forecast. This makes the overall unemployment rate fell from 5.2% to 5.1%. In the Asian session, the growth of the "Australian dollar" graduated to 34 points, and the price exactly reached the MACD line on the daily chart. In the European session, exit above the line 0.6880 with consolidation above it and on Friday, the growth may extend to the price channel line 0.6903.
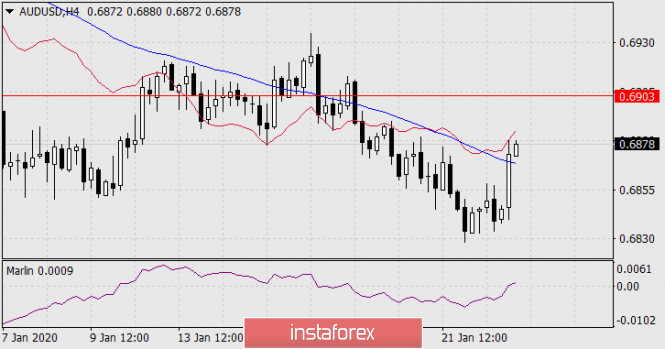
The price exceeded the MACD line on the four-hour chart but is still under the balance line, which means that the situation is developing mainly according to the older chart. For this day, everything will depend on whether the price can fix itself above the MACD line on the daily chart. The signal line of the Marlin oscillator in the zone of positive values is already a sign of the price's intention to overcome the resistance of the senior TF, but in any scenario this growth is corrective.
|
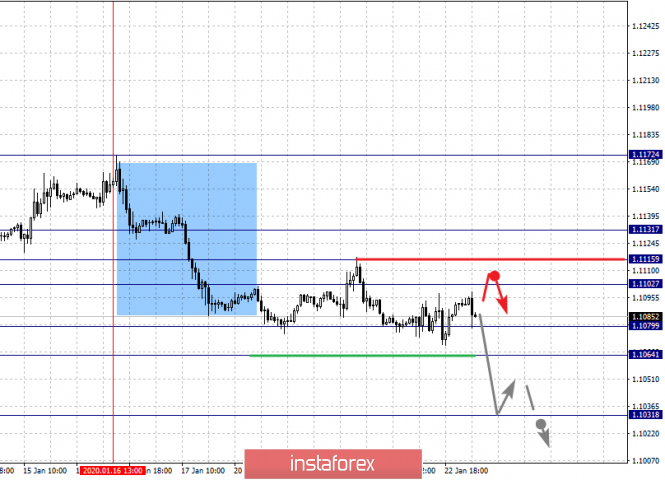
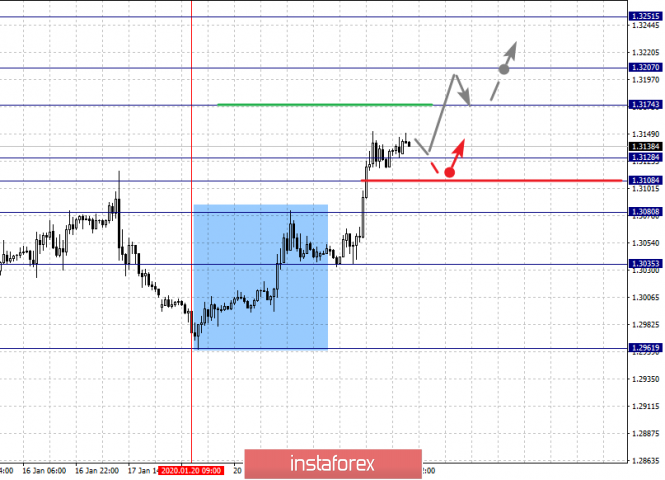
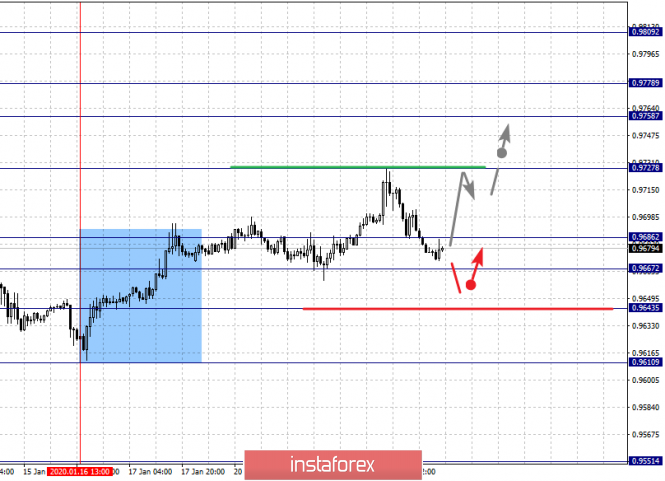
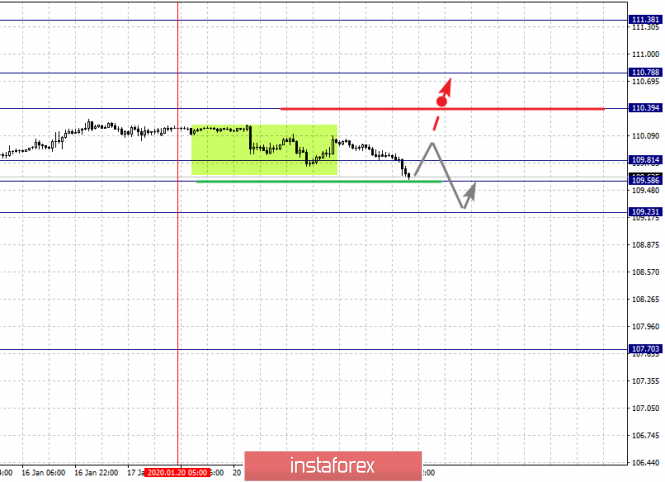
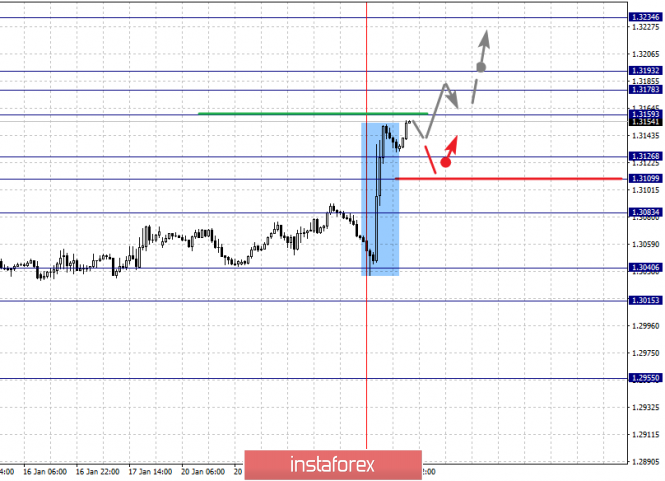
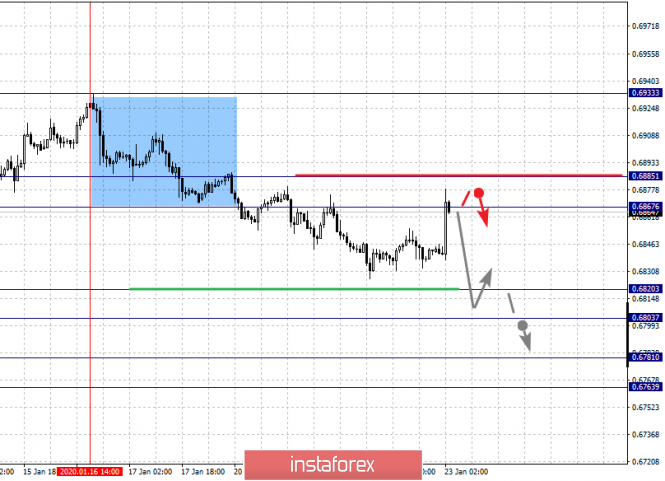
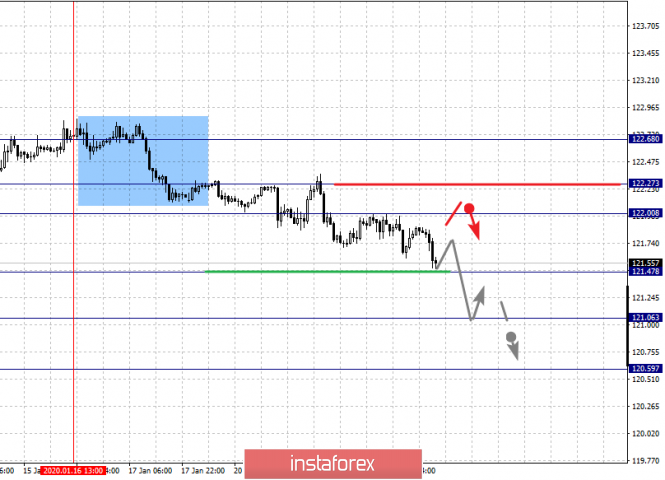
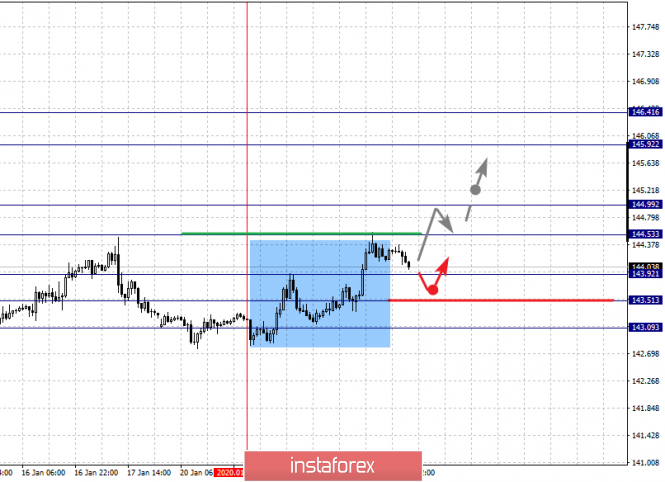
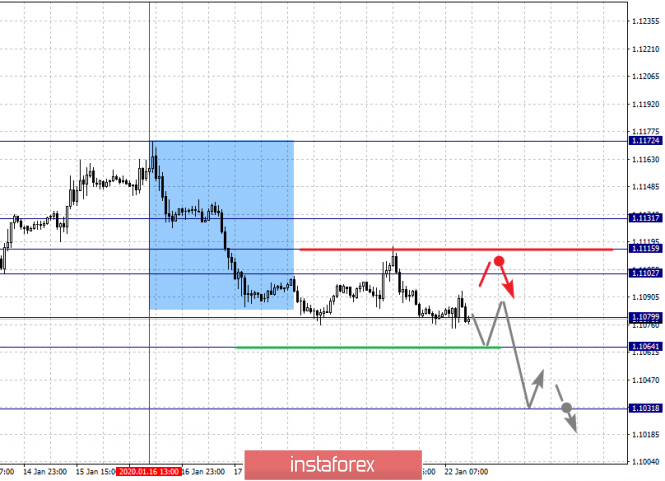
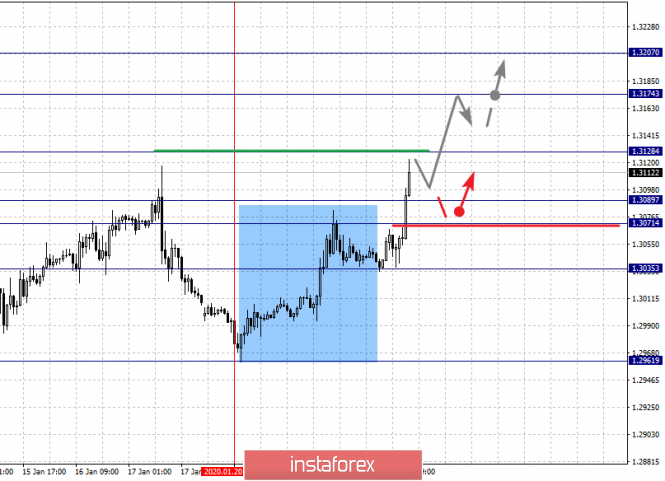
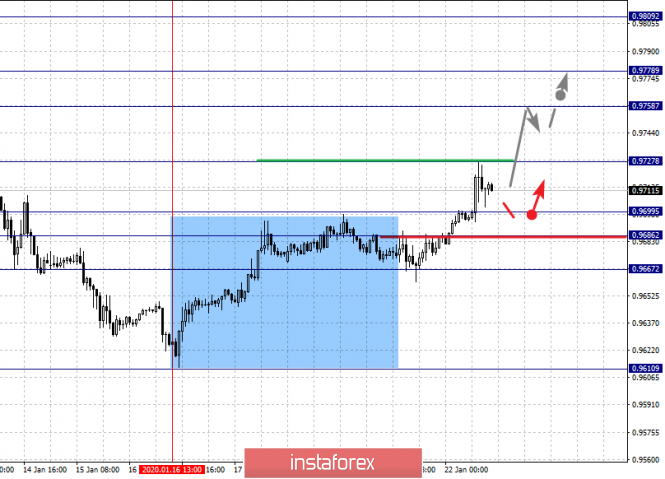
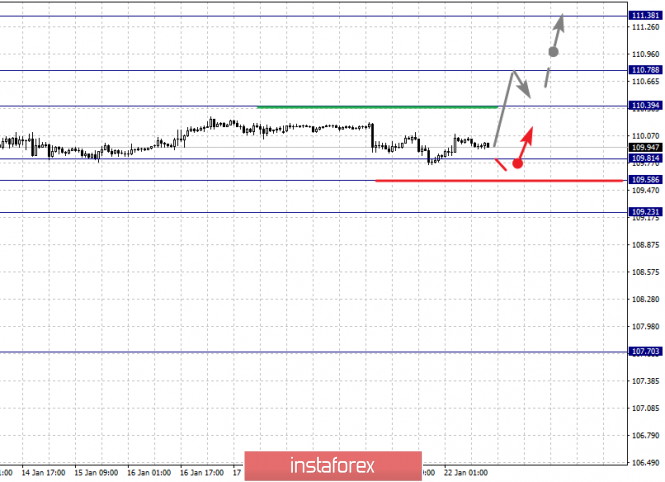
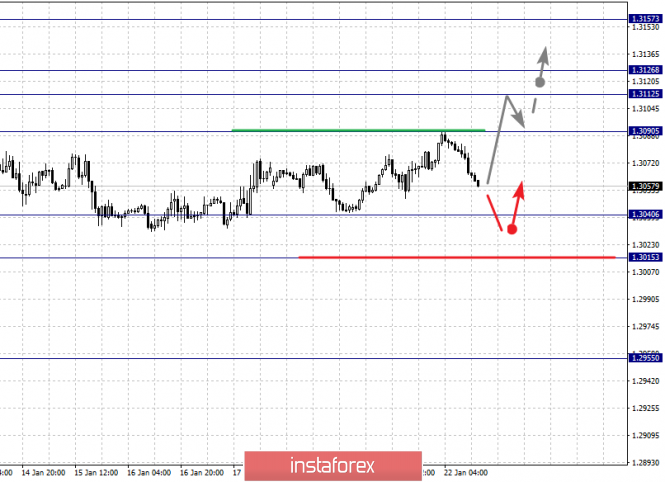
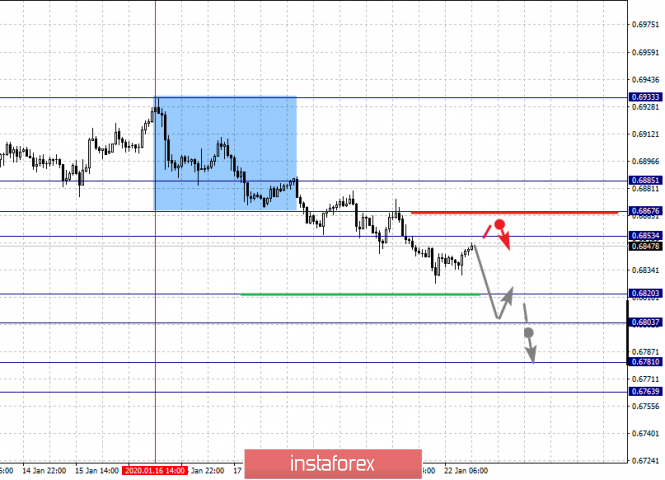
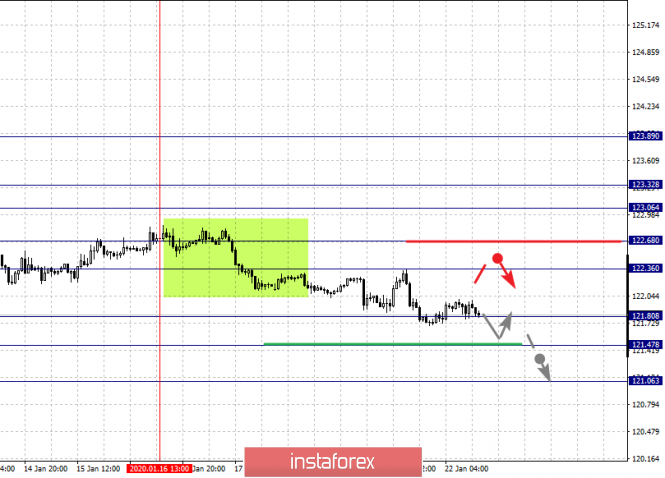
| Fractal analysis of the main currency pairs for January 23 Posted: 22 Jan 2020 06:22 PM PST Forecast for January 23: Analytical review of currency pairs on the scale of H1: For the euro / dollar pair, the key levels on the H1 scale are: 1.1131, 1.1115, 1.1102, 1.1079, 1.1064 and 1.1031. Here, we are following the descending structure of January 16. Short-term downward movement is expected in the range of 1.1079 - 1.1064. The breakdown of the last value will lead to a pronounced movement. Here, the potential target is 1.1031. We expect a pullback to the top from this level. Short-term upward movement is possibly in the range 1.1102 - 1.1159. The breakdown of the last value will lead to an in-depth correction. Here, the target is 1.1131. This level is a key support for the downward structure. The main trend is the descending structure of January 16 Trading recommendations: Buy: 1.1102 Take profit: 1.1113 Buy: 1.1116 Take profit: 1.1130 Sell: 1.1078 Take profit: 1.1065 Sell: 1.1063 Take profit: 1.1034 For the pound / dollar pair, the key levels on the H1 scale are: 1.3251, 1.3207, 1.3174, 1.3128, 1.3108, 1.3080 and 1.3035. Here, we continue to follow the upward cycle of January 20. Short-term upward movement is expected in the range 1.3174 - 1.3207. The breakdown of the latter value will lead to movement to a potential target - 1.3251. We expect a pullback to the bottom from this level. Short-term downward movement is possibly in the range of 1.3128 - 1.3108. The breakdown of the last value will lead to an in-depth correction. Here, the target is 1.3080. This level is a key support for the top, its passage at the price will lead to the formation of initial conditions for the downward movement. In this case, the goal is 1.3035. The main trend is the upward structure of January 20 Trading recommendations: Buy: 1.3175 Take profit: 1.3205 Buy: 1.3208 Take profit: 1.3250 Sell: 1.3128 Take profit: 1.3109 Sell: 1.3106 Take profit: 1.3080 For the dollar / franc pair, the key levels on the H1 scale are: 0.9809, 0.9778, 0.9758, 0.9727, 0.9686, 0.9667 and 0.9643. Here, we are following the development of the ascending structure of January 16. The continuation of the movement to the top is expected after the breakdown of the level of 0.9727. In this case, the target is 0.9758. Short-term upward movement, as well as consolidation is in range of 0.9758 - 0.9778. We consider the level of 0.9809 to be a potential value for the upward movement; upon reaching this level, we expect a pullback to the bottom. Short-term downward movement is possibly in the range of 0.9686 - 0.9667. The breakdown of the latter value will lead to an in-depth correction. Here, the target is 0.9643. This level is a key support for the top. The main trend is the upward cycle of January 16 Trading recommendations: Buy : 0.9727 Take profit: 0.9756 Buy : 0.9758 Take profit: 0.9776 Sell: 0.9665 Take profit: 0.9645 Sell: 0.9640 Take profit: 0.9616 For the dollar / yen pair, the key levels on the scale are : 111.38, 110.78, 110.39, 109.81, 109.58 and 109.23. Here, the price holds the downside potential of January 20. Short-term downward movement, as well as consolidation are possible in the range 109.81 - 109.58. The breakdown of the latter value will lead to an in-depth correction. Here, the goal is 109.23. This level is a key support for the top. The continuation to the top is possibly after a breakdown of the level of 110.39. In this case, the first target is 110.78. The breakdown of the level of 110.80 should be accompanied by a pronounced upward movement. Here, the potential target is 111.38. Main trend: potential downward structure of January 20 Trading recommendations: Buy: 110.40 Take profit: 110.76 Buy : 110.80 Take profit: 111.35 Sell: Take profit: Sell: 109.55 Take profit: 109.25 For the Canadian dollar / US dollar pair, the key levels on the H1 scale are: 1.3234, 1.3193, 1.3178, 1.3159, 1.3126, 1.3109 and 1.3083. Here, the price registered the local upward structure of January 22. The continuation of the movement to the top is expected after the breakdown of the level of 1.3160. In this case, the target is 1.3178. Price consolidation is near this level. Passing at the price of the noise range 1.3178 - 1.3193 will lead to a movement to a potential target - 1.3234. We expect a pullback to the bottom from this level. Short-term downward movement is possibly in the range of 1.3126 - 1.3109. The breakdown of the latter value will lead to an in-depth correction. Here, the target is 1.3083. The main trend is the local ascending structure of January 22. Trading recommendations: Buy: 1.3160 Take profit: 1.3178 Buy : 1.3194 Take profit: 1.3234 Sell: 1.3126 Take profit: 1.3110 Sell: 1.3107 Take profit: 1.3085 For the Australian dollar / US dollar pair, the key levels on the H1 scale are : 0.6885, 0.6867, 0.6853, 0.6820, 0.6867 and 0.6885. Here, we are following the development of the descending structure of January 16. Short-term downward movement is expected in the range 0.6820 - 0.6803. The breakdown of the last value should be accompanied by a pronounced downward movement. Here, the target is 0.6781. For the potential value for the bottom, we consider the level of 0.6763. Upon reaching which, we expect consolidation, as well as a rollback to the top. Short-term upward movement is expected in the range of 0.6867 - 0.6885. The breakdown of the latter value will lead to the formation of initial conditions for the top. In this case, the potential target is 0.6910. The main trend is the descending structure of January 16, the correction stage Trading recommendations: Buy: Take profit: Buy: 0.6868 Take profit: 0.6883 Sell : 0.6820 Take profit : 0.6804 Sell: 0.6802 Take profit: 0.6784 For the euro / yen pair, the key levels on the H1 scale are: 122.68, 122.27, 122.00, 121.47, 121.06 and 120.59. Here, we are following the descending structure of January 16. The continuation of movement to the bottom is expected after the breakdown of the level of 121.45. In this case, the goal is 121.06. Price consolidation is near this level. For the potential value for the bottom, we consider the level of 120.59. Upon reaching which, we expect a pullback to the top. Short-term upward movement is possibly in the range of 122.00 - 122.27. The breakdown of the last value will lead to the formation of initial conditions for the top. In this case, the potential target is 122.68. The main trend is the descending structure of January 16 Trading recommendations: Buy: 122.00 Take profit: 122.25 Buy: 122.30 Take profit: 122.65 Sell: 121.45 Take profit: 121.10 Sell: 121.04 Take profit: 120.60 For the pound / yen pair, the key levels on the H1 scale are : 146.41, 145.92, 144.99, 144.53, 143.92, 143.51 and 143.09. Here, we determined the next goals for the top from the local structure on January 21. Short-term upward movement is expected in the range of 144.53 - 144.99. The breakdown of the last value should be accompanied by a pronounced upward movement. Here, the target is 145.92. For the potential value for the top, we consider the level of 146.41. Upon reaching this level, we expect consolidation, as well as a pullback to the bottom. A short-term downward movement is possibly in the range of 143.92 - 143.51. The breakdown of the last value will lead to an in-depth correction. Here, the goal is 143.09. This level is a key support for the top. The main trend is the local ascending structure of January 21 Trading recommendations: Buy: 144.53 Take profit: 144.95 Buy: 145.00 Take profit: 145.90 Sell: 143.90 Take profit: 143.54 Sell: 143.50 Take profit: 143.10 The material has been provided by InstaForex Company - www.instaforex.com |
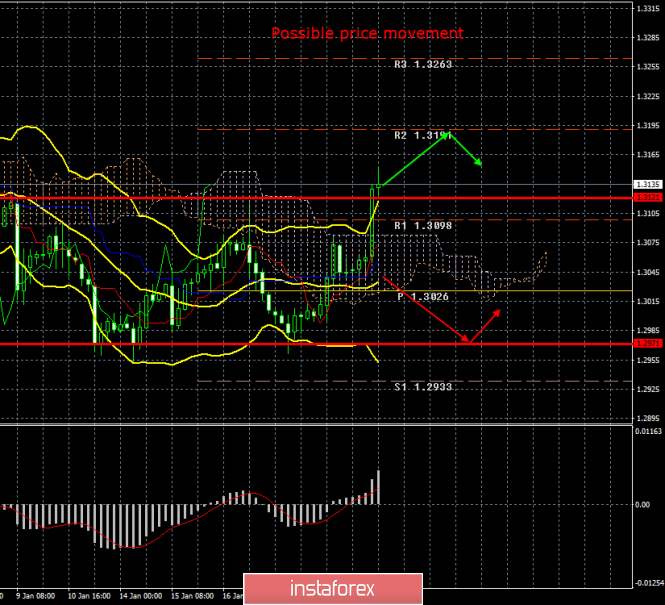
| Posted: 22 Jan 2020 03:25 PM PST 4-hour time frame Amplitude of the last 5 days (high-low): 58p - 57p - 115p - 52p - 89p. Average volatility over the past 5 days: 75p (average). The British pound unexpectedly increased for everyone and grew significantly on Wednesday, January 22. During the third trading day of the week, the pound / dollar currency pair managed to rise by 75 points. But the reason for such a strengthening of the British currency is difficult to say. There was not a single important macroeconomic publication in the UK or the States during the day. Donald Trump did not particularly touch upon Great Britain in his speeches in Davos, although we have heard promises of a deal with Boris Johnson more than once. In general, we believe that the pound has taken up its favorite thing again - to rise in price on rumors or unverified information or perhaps, the second option is another technical correction before a new, even stronger decline. It is most likely that the second option will be fulfilled, although at the moment most of the indicators already signal an upward trend, so now it is recommended to wait for the trend to change to a downward one and only then resume selling the British currency. As for the fundamental background, it remains the same for obvious reasons. The House of Lords rejected a bill by Boris Johnson on a deal with the European Union and Brexit, but this will not change anything. Brexit can no longer be canceled, and Boris Johnson will rule the country almost single-handedly in the coming years. Thus, the "Damocles sword" still hangs over the pound in the form of uncertainties related to the consequences of Brexit, with negotiations with the European Union on trade relations. However, all this is lyrics so far. Now, the pound needs to be afraid of macroeconomic statistics, as well as the meeting of the Bank of England, which will be held next week. Macroeconomic statistics, as well as simple finances, only indicate that the UK economy continues to lose money, continues to lose investment. The experts counted first, how much Brexit will cost the UK - the figure was more than 200 billion pounds. And a little later it was estimated that she paid contributions in the amount of 215 billion pounds for 47 years of British membership in the EU. That is, the last three years of "divorce" with the Alliance cost the British about the same as 47 years of membership in the European Union. So, dear traders, Jjdge for yourself about these numbers. What is positive for the British pound? There is little positivity. Macroeconomic data on wages and unemployment cannot level all the losses that Britain has already suffered and will continue to suffer. It cannot level the losses of the rest of the failed statistics, where inflation and GDP are. Therefore, every time we see a strong strengthening of the pound, we look at this phenomenon with skepticism, realizing that it will be followed by a 90% probability drop. In principle, the current growth of the pair may not mean that the pound began to grow in the literal sense of the word. It may mean that some of the short positions were closed in the currency market, or some bank entered the market with a major transaction, which caused a bias in supply and demand for the pound on January 22. In any case, pullbacks and corrections are needed, but traders can use them for more profitable sales of the British currency. From a technical point of view, we are expecting a correction at the moment against the upward trend that has formed in recent days. We also assume that the upward movement in the last few days will end today. However, we still do not recommend "catching reversals" . We consider it more advisable to wait until the quotes of the pound / dollar pair are fixed below the critical line, and then resume selling the British currency. Trading recommendations: GBP/USD has temporarily postponed the downward trend option. Thus, traders are advised to resume sales of the pound / dollar pair with targets at 1.2971 and 1.2933 after completing the correction and fixing the pair below the Kijun-sen line. The pair's purchases are formally relevant now with the goal of the resistance level of 1.3191. However, we do not see logical reasons for continuing the strengthening of the British currency. Explanation of the illustration: Ichimoku indicator: Tenkan-sen is the red line. Kijun-sen is the blue line. Senkou Span A - light brown dotted line. Senkou Span B - light purple dashed line. Chikou Span - green line. Bollinger Bands Indicator: 3 yellow lines. MACD indicator: Red line and bar graph with white bars in the indicators window. Support / Resistance Classic Levels: Red and gray dashed lines with price symbols. Pivot Level: Yellow solid line. Volatility Support / Resistance Levels: Gray dotted lines without price designations. Possible price movements: Red and green arrows. The material has been provided by InstaForex Company - www.instaforex.com |
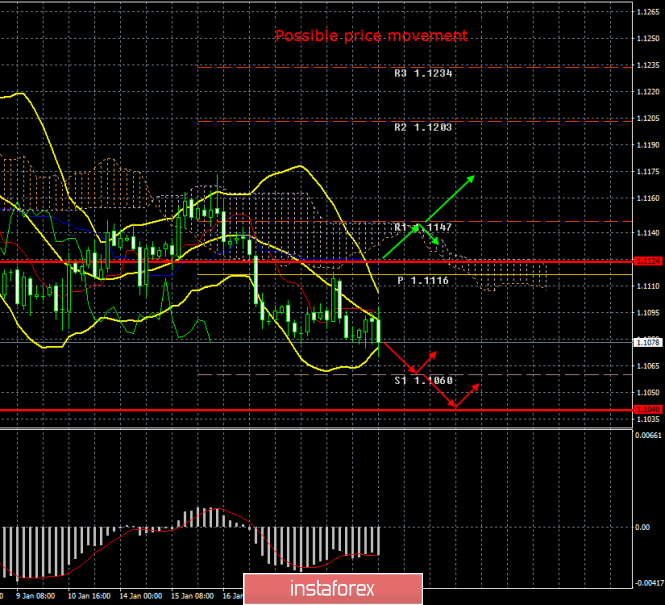
| Posted: 22 Jan 2020 03:25 PM PST 4-hour time frame Amplitude of the last 5 days (high-low): 44p - 45p - 57p - 25p - 38p. Average volatility over the past 5 days: 42p (average). The third trading day of the week ends with an absolute flat for the EUR / USD pair. The daily volatility of the currency pair is minimal again - only 28 points and no distinct upward movement or downward movement was observed during the day. At the same time, the calendar of macroeconomic events is completely empty. Well, traders seem to have decided to wait for tomorrow's results of the meeting of the European Central Bank. Today, we will not repeat once again that the fundamental and macroeconomic background remains entirely on the side of the American currency. Perhaps, these moments will change tomorrow, when the results of the meeting become known and a press conference will be held with representatives of the ECB. In addition, another speech by ECB President Christine Lagarde is scheduled for Friday, so we will definitely find out any new information from the lobby of the European regulator by the end of the week. Most experts agree that no change in the parameters of the monetary policy of the ECB should be expected. A number of factors speak in favor of this. Firstly, the easing of monetary policy in September 2019 yields certain results (then the regulator lowered its key rate and resumed redemption of assets from the open market). Although inflation remains at low values far from the target, it has accelerated in recent months from 0.7% y / y to 1.3% y / y. Secondly, there were no hints of possible changes from members of the ECB's monetary committee. However, from our point of view, the first factor is absolutely ambiguous, and it can be interpreted in different ways. It turns out that the ECB went on easing monetary policy in September, and we saw the absolutely minimal inflation rate in October while inflation dropped to 0. 7% y / y which is already at ultra-low rates on deposits and loans. However, the ECB lowered the rate to -0.4% even earlier, respectively, respectively, past measures to soften monetary policy had only a temporary positive effect and it could be exactly the same this time. Moreover, inflation will be at more or less decent levels for some time, but all the factors that negatively affect it have not disappeared. The United States-China trade war continues, and it is not known whether it will escalate during 2020. On the other hand, US President Donald Trump openly stated at the international economic forum in Davos that he was preparing to impose sanctions on products of the European Union's engineering industry if "Europeans do not want to sign a trade agreement." The European Union, of course, answered Trump that he would introduce mirror duties on imports from the US. However, absolutely everyone understands that the EU-US trade war will put new pressure, primarily on the economy of the European Union. It turns out that the rate has been reduced and inflation has "risen", but a new blow may be dealt to the EU economy in the near future, and inflation and other macroeconomic indicators may fall down again. Furthermore, the industrial sector is now in extremely poor condition in the eurozone even if you do not take into account the potential trade war. Business activity in all EU countries is at extremely weak values, industrial production is declining. Thus, this phenomenon itself already requires additional stimulation of the economy, additional investments in the economy. We believe that the ECB, approximately, like the Bank of England, may not go for another easing of monetary policy right tomorrow, but the fate of the key rate is almost decided. The only question is when will the regulator go for another reduction? Separately, it is worth noting the speech of Christine Lagarde, as it is she who can confirm the market concerns or, conversely, dismiss them or at least it can bring market participants up to date, as it previously announced structural changes to the ECB. According to Christine Lagarde, the ECB can revise its policy, which has not changed since 2003. Accordingly, its new goals will be set, and depending on ways to achieve them will be evaluated through all the same monetary policy instruments. Thus, in essence, it is Christine Lagarde's speech on Thursday and Friday that will become the key events of the week for the euro / dollar pair. Based on the previously mentioned, we believe that the euro can fall under the pressure of traders again, since nothing optimistic is simply not expected. Of course, more accurate conclusions should be drawn after the speech of the head of the ECB, but now, it is becoming clear that even hypothetical positive points may be few. The technical picture of the pair shows a downward trend. Therefore, we believe that sell orders remain relevant. All indicators are directed downward, only the average volatility remains low, and it has completely dropped to its minimum values in recent days. Trading recommendations: EUR/USD continues to move down. Thus, it is recommended that you either hold open shorts with targets 1.1060 and 1.1040, or open new ones with new signals (MACD turn down or a rebound from the Kijun-sen line). It will be possible to consider purchases of the euro / dollar pair not earlier than the traders of the Senkou Span B line break through the first goal - the resistance level of 1.1203. Explanation of the illustration: Ichimoku indicator: Tenkan-sen is the red line. Kijun-sen is the blue line. Senkou Span A - light brown dotted line. Senkou Span B - light purple dashed line. Chikou Span - green line. Bollinger Bands Indicator: 3 yellow lines. MACD indicator: Red line and bar graph with white bars in the indicators window. Support / Resistance Classic Levels: Red and gray dashed lines with price symbols. Pivot Level: Yellow solid line. Volatility Support / Resistance Levels: Gray dotted lines without price designations. Possible price movements: Red and green arrows. The material has been provided by InstaForex Company - www.instaforex.com |
| EUR/USD: is the dollar on the path of war? Posted: 22 Jan 2020 03:25 PM PST Those who seriously hoped that Donald Trump would not start a new trade war before the next presidential election in the United States seemed to be mistaken. The World Economic Forum in Davos has confirmed this. During his public speech, the head of the White House emphasized the dignity of the American economy. On the sidelines of the forum, he expressed dissatisfaction with the huge deficit in US foreign trade with the European Union and announced his intention to introduce duties on car imports to America from the Old World if Washington and Brussels fail to reach a trade agreement. Against this background, a single European currency, barely able to find the ground under its feet thanks to reports of a trade ceasefire between the United States and France before the end of 2020, was sent to another knockdown. Apparently, the trade conflict between the US and the EU is not included in the plans of the bulls for EUR/USD. The trade war between Washington and Beijing dealt a serious blow to the export-oriented economy of the eurozone. What will become of it if large-scale American duties on European products are introduced? Brussels promises to introduce $ 60 billion in fees for delivering goods and services from the United States in response to an increase in US import tariffs for cars and parts from the EU of $ 60 billion. So, we have already seen what the increase in duties for international trade and world GDP can turn out to be. Trump did not just praise the American economy at the Davos forum. He stated that her power allowed the United States to celebrate victory in a trade war with China. "America is growing, America is thriving and winning like never before," the American leader proclaimed. The dollar reacted to the fiery speech of the US president with growth, primarily due to the principle of "strong economy - strong currency". However, the World Bank, the IMF and the OECD do not count on the rapid recovery of the global economy in 2020. The White House promises to lower taxes for the middle class once again, which contributed to the acceleration of US GDP growth rates to almost 3% in 2018. If the divergence between global and US GDP does not expand, then the USD index will continue to confidently go upwards, and a new trade war will be in the hands of the "bears" in EUR/USD. On the other hand, recovery of the introduction of US import duties on European cars forced investors to turn a blind eye to the positive from the German economic sentiment index ZEW. The figure rose to its highest level in more than 4 years, thanks to the trade truce of Washington and Beijing and the optimism of the Bundesbank, which said that German industry had touched the bottom. If it weren't for the threat of a US-EU trade war appearing on the horizon again, the euro would have reacted to strong data with growth against major currencies. Meanwhile, the first decline in demand for bank loans in the eurozone in the last 6 years is an alarming bell for the currency block economy, as well as for the ECB, which is trying to increase this demand by reducing deposit rates and renewing QE. If ECB President Christine Lagarde and her colleagues express concerns about a new trade war and a further slowdown in the European economy instead of moderate optimism at the regulator's meeting on January 23, then support at 1.1070 and 1.1055 may not resist the pressure of the "bears" in EUR / USD. The material has been provided by InstaForex Company - www.instaforex.com |
| EUR/USD. Preview: ECB's January meeting Posted: 22 Jan 2020 03:25 PM PST The euro/dollar pair froze in anticipation of the January meeting of the European Central Bank, which will be held tomorrow. After a sharp decline in the area of the 10th figure, the price has consolidated today, while demonstrating weak movements within the 20-point range. At the same time, the negative effect of yesterday's statement by Donald Trump gradually became unsuccessful - partly due to his subsequent comments. Let me remind you that after a long pause, the US president threatened Brussels again with the introduction of duties on European cars and spare parts - "if the parties do not conclude a trade agreement on the terms of Washington." After this statement, currency exchange traders were seriously worried - and quite reasonably, given the possible consequences of a new trade war. Indeed, the key macroeconomic indicators of the eurozone have just begun to show signs of growth after a significant decline in the second half of last year. Obviously, the bulls of the EUR/USD pair are completely unnecessary for the trade conflict between the USA and the EU, especially against the backdrop of recent trends in the European economy. Therefore, the threats of the head of the White House acted on the pair accordingly - the price interrupted its growth and returned to the 10th figure. Nevertheless, Trump's subsequent comments didn't sound so "warlike" anymore. He also said that the deadline for the negotiation process between Washington and Brussels has not yet been determined while at the Davos Economic Forum. At the same time, he expressed the hope that the parties will conclude an agreement with the European Union before the presidential election in the United States, that is, until November of this year. Yesterday, he also did not talk about any deadlines - according to him, Europeans themselves "know what dates are in question." In other words, judging by the rhetoric of the American leader, a trade war, if it does, doesn't come in the coming days (although the initial threats sounded that way) - the negotiation process between Washington and Brussels is still ongoing. Thus, the EUR/USD pair suspended its decline against the background of the changed fundamental picture - the bears lost weighty arguments for a "trip to the downside". However, buyers are not in a hurry to open long positions since they are still waiting for the main interest of this week to be resolved - will Christine Lagarde appreciate the latest "achievements" of the European economy or does the rhetoric of the head of the ECB remain just as soft? According to the general forecast of economists, the European Central Bank will keep the monetary policy parameters in the same form tomorrow, but at the same time, more optimistic about the prospects for economic growth in the eurozone. The implementation of this scenario will support the euro. Firstly, it will be possible to say with confidence that in the foreseeable future (at least until the middle of this year) the regulator will take a wait-and-see attitude, that is, the risk of monetary policy easing will be practically zero. Secondly, it will be possible to discuss the issue of raising the rate in such a fundamental scenario - so far hypothetically, but still. If European inflation will continue to show growth, and industrial production in key EU countries will "revive", then the probability of tightening monetary policy at the end of the current or early 2021 cannot be excluded. Moreover, there are already certain prerequisites for the implementation of such a scenario. The growth of the oil market, the pause in the trade war between the US and China, and the "soft" Brexit - all these factors play in favor of the overall growth of the European economy. Recent ZEW reports eloquently testify to this, while key macroeconomic releases show a positive trend. First of all, we are talking about inflation. The general consumer price index in December reached 1.3% from the previous value of 1.0%. Core inflation also showed growth - the core index was at the same level as in November, that is, at around 1.3%. In addition, Christine Lagarde may appeal to the governments of European countries again to use the surplus of their budgets. Over the past months, she has repeatedly called on some EU countries (primarily Germany and the Netherlands) with their "chronic budget surpluses" to increase investment and government spending. Tomorrow, she can convey a veiled "hello" to these countries once again. In addition, the head of the ECB may respond positively to the implementation of the European Green Rate investment program, which sums up to one trillion euros. Thus, the European Central Bank is unlikely to announce any concrete theses regarding the prospects of monetary policy tomorrow. At the same time, Lagarde may take a more "hawkish" position relative to the December meeting. This will allow the bulls of the EUR/USD pair to return to the area of the 11th figure. The nearest resistance level is located at 1.1140 (the middle line of the Bollinger Bands on the daily chart). Now, if the head of the ECB maintains a cautious look at the current situation, voicing pessimistic arguments, then the pair will continue its downward movement, declining to the base of the 10th figure. The material has been provided by InstaForex Company - www.instaforex.com |
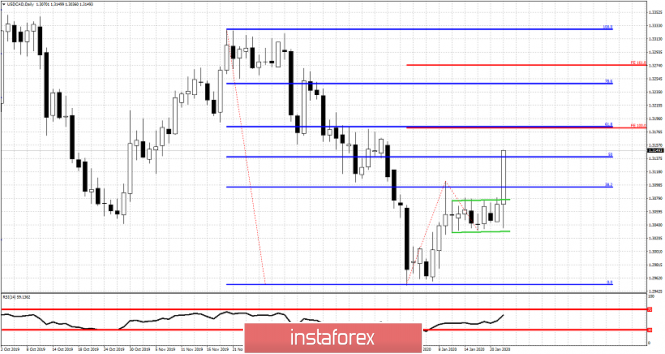
| USDCAD breaks bullish flag to the upside Posted: 22 Jan 2020 09:55 AM PST In our previous analysis on USDCAD we observed a bullish flag pattern in the making as price was moving sideways. Price has now recaptured our key resistance at 1.3080-1.31 and has given us a bullish signal with 1.3180 as target, as we explained in our last post.
Red lines - Fibonacci extension targets USDCAD has clearly broken out of the bullish flag and is approaching our first target at 1.3180 where we find the 100% extension of the first upward move. I expect price to reach that level as we can also find there the important 61.8% Fibonacci retracement level. Next target is at 1.3275. If we manage to break above 1.3180 and hold above it, then we can see a move towards 1.33 unfold. Support is key at 1.3080 and bulls do not want to see price pull back below this level. This would be a very bearish signal. The material has been provided by InstaForex Company - www.instaforex.com |
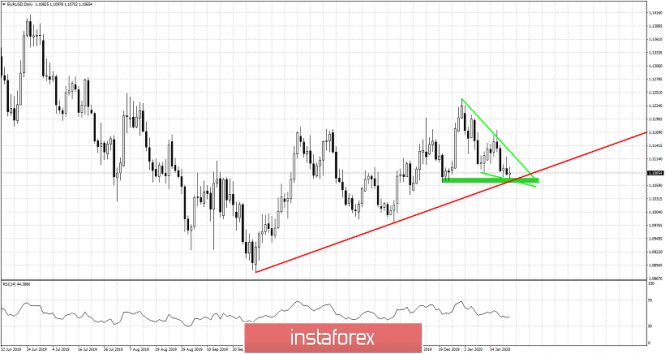
| Posted: 22 Jan 2020 09:49 AM PST EURUSD is trading still below 1.11 but above the key support of 1.1050-1.1060 as we explained in previous analysis. Today we show how this area between 1.1060-1.1070 is support and what can see expect next.
Red line - upward sloping support trend line Green lines - bullish wedge pattern First we observe that price is above the horizontal support from mid-December lows. Price is also testing the upward sloping trend line support. Price is inside a green wedge pattern. So far price respects support in the area of 1.1060-1.1080. The chances of a reversal and a move towards 1.1150 are realistic and bears need to be very cautious. A daily close above 1.1120 will be a bullish signal confirming the strength of support. The risk reward ratio favors bullish positions at this current point in time. If price fails to hold above 1.1050 then we can turn bearish again with potential to move much lower. The material has been provided by InstaForex Company - www.instaforex.com |
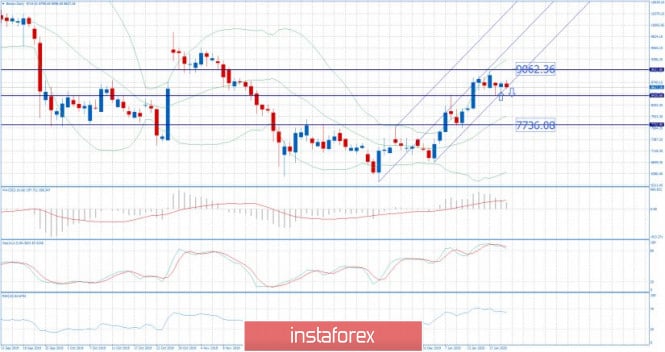
| Posted: 22 Jan 2020 08:21 AM PST Industry news: Trading volume for Bitcoin (BTC) options from the Chicago Mercantile Exchange, or CME Group, has increased by over 100 percent in just the first week after their launch. Bitcoin options volumes more than doubled in the seven days following their introduction on January 13, 2020. The volume recorded, as of January 17, was 122 contracts, valued at 610 BTC, which is currently worth $5.27 million. On day one of their launch, BTC options volume was only 55 contracts, or 275 BTC, which is presently worth $2.37 million. Open interest on Bitcoin options contracts remained steady at 219 contracts on Friday, which is valued at an estimated 1,095 BTC, or $9.45 million at current prices. Technical analysis:
BTC has been trading sideways at the price of $8.626. I found that the level of $8.440 is critical pivot level for BTC and further direction. My analysis from yesterday is still valid. In case of the downside breakout of $8.440, watch for selling opportunities on the rallies with the main target at $7.725. In case of the rejection of the pivot $8.440, watch for buying on the dips with the main target at $9.000. Stochastic is in overbought zone and we got fresh new bear cross MACD oscillator is still showing positive reading above the zero but the momentum is decreasing to the upside. Resistance level is seen at the price of $9.000 Main support pivots are set at $8.440 and $7.725The material has been provided by InstaForex Company - www.instaforex.com |
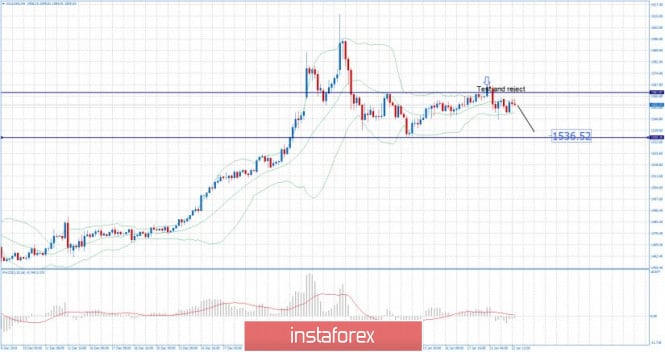
| Posted: 22 Jan 2020 07:43 AM PST Gold has been trading sideways at the price of $1.555 but with the strong rejection of the resistance in the background at $1.562. I expect further downside movement towards the support at $1.536.
Due to strong rejection of our critical pivot level at $1.562, watch for selling opportunities on the rallies using the lower fames 5/15 minutes. MACD oscillator is showing negative reading below the zero and the slow line is tuned to the downside. Major resistance is set at the price of $1.562. Support levels and downward target is set at the price of $1.535.The material has been provided by InstaForex Company - www.instaforex.com |
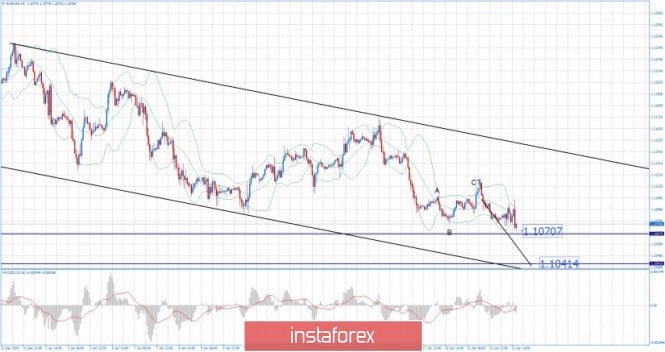
| Posted: 22 Jan 2020 07:35 AM PST EUR has been trading downwards. The price tested my first downward target from yesterday at the price of 1.1070. I see further downside on the EUR and potential test of our second target at the price of 1.1040.
The EUR is still trading inside of the downward slopping channel, which is sign of the short-term down trend. My advice is to watch for selling opportunities on the rallies using intraday-frames 5/15 minutes. MACD oscillator is showing increase on the downside momentum... Resistance levels are set at the price of 1.1098 and 1.1118 Support level and second downward target is set at the price of 1.1040. The material has been provided by InstaForex Company - www.instaforex.com |
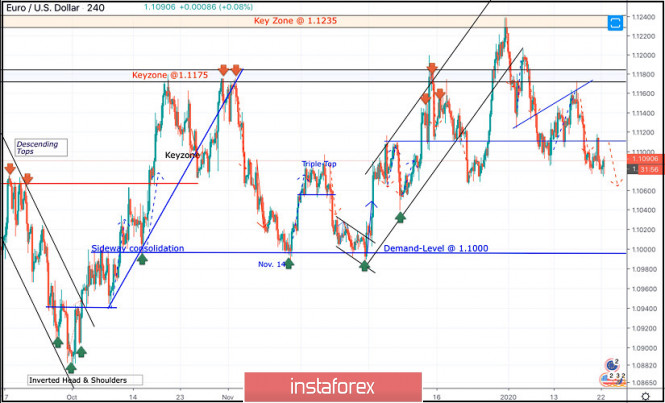
| January 22, 2020 : EUR/USD Intraday technical analysis and trade recommendations. Posted: 22 Jan 2020 06:09 AM PST
Since November 14, the EUR/USD pair has been trapped within a narrow consolidation range between the price levels of 1.1000 and 1.1085-1.1100 (where a cluster of supply levels and a Triple-Top pattern were located) until December 11. On December 6, a bullish swing was initiated around 1.1040 allowing another bullish breakout above 1.1110 to pursue towards 1.1175 within the depicted short-term bullish channel. Initial Intraday bearish rejection was expected around the price levels of (1.1175). Moreover, On December 20, bearish breakout of the depicted short-term channel was executed. Thus, further bearish decline was demonstrated towards 1.1065 where significant bullish recovery has originated. Shortly-after, another bullish pullback towards 1.1235 (Previous Key-zone) was suggested to be watched for bearish rejection and another valid SELL entry. Suggested bearish position has achieved its targets while approaching the price levels around 1.1110. However, the Key-Level around 1.1110 has provided some bullish rejection. This was followed by a bullish pullback towards 1.1140 and 1.1175 where the depicted key-zone as well as the recently-broken uptrend were located. Recently, evident signs of bearish rejection were demonstrated around 1.1175. That's why, quick bearish decline was executed towards 1.1110. For the bearish side of the market to dominate, bearish persistence below 1.1110 is needed to enable further bearish decline towards 1.1060 and probably 1.1040. Trade recommendations : Yesterday, Intraday traders were advised to consider the recent bullish pullback towards 1.1120 as a valid SELL signal. It's already running in profits. Bearish projection targets are to be located around 1.1060 and 1.1040.Any bullish breakout above 1.1140 invalidates the mentioned bearish trading scenario. The material has been provided by InstaForex Company - www.instaforex.com |
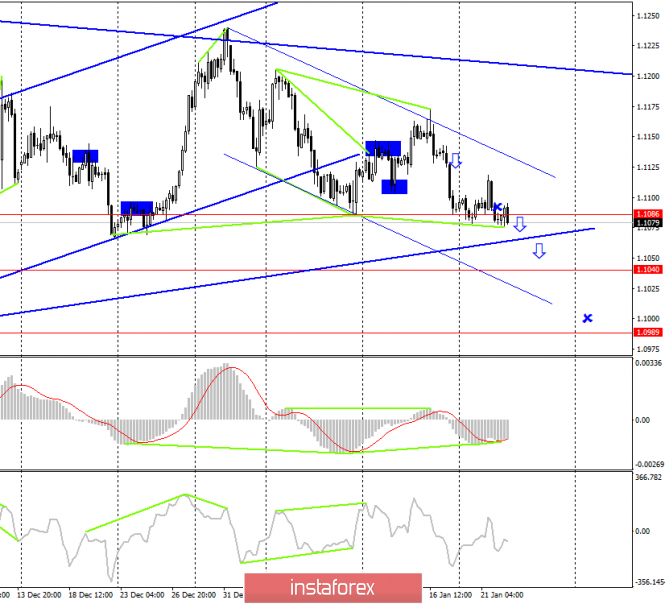
| EUR/USD. January 22. We are still waiting for a fall to 1.1040 Posted: 22 Jan 2020 06:06 AM PST EUR/USD - 4H
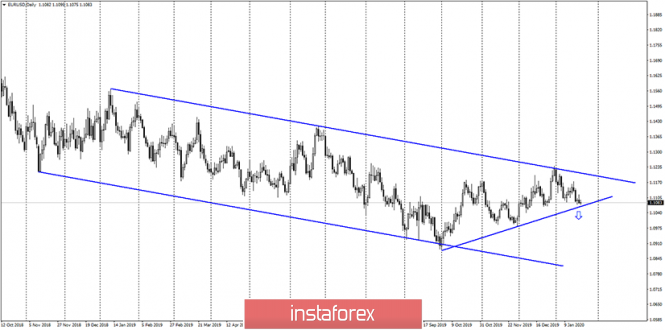
As seen on the 4-hour chart, the EUR/USD pair performed a reversal in favor of the US currency and resumed the process of falling, but again hit the low level of 1.1086, from which it rebounded last time. Also, a new bullish divergence has been formed for the MACD indicator, which allows us to count on a new reversal in favor of the European currency and some growth in the direction of the upper area of the trend downward corridor. Also, a long-term upward trend line is formed (it is better visible on the daily chart), which supports bull traders. Thus, at the moment, several signals can be formed at once, and in different directions. I still expect the quotes to consolidate below the level of 1.1086 and continue falling towards the next level - the low of 1.1040, and then even lower. Downward trend channels (global and small) are still valid, and clearly show the current mood of the market. The information background is weak today, traders are waiting for the results of tomorrow's meeting of the European Central Bank. EUR/USD - daily
As seen on the 24-hour chart, we still have a trading idea with a drop to the lower border of the downward trend corridor. However, at the moment, there is also a new trend line, which we discussed above. Thus, fixing the pair's quotes along this line will significantly increase the probability of a further fall in the direction of the approximate target level of 1.0850. Forecast for EUR/USD and trading recommendations: The long-term trading idea remains valid. Traders still have a long-term target for a fall near the level of 1.0850. It is advisable to open new sales for this trading idea after closing under the trend line. The short-term trading idea is to sell the pair with the goal of 1.1040 since the trend on the 4-hour chart remains "bearish". The trend line may not send quotes so low, so for both trading ideas, you can try to wait for the euro-dollar pair to close below this line. The material has been provided by InstaForex Company - www.instaforex.com |
| GBP/USD. January 22. Two correction lines at once provide good opportunities for sales Posted: 22 Jan 2020 06:06 AM PST GBP/USD - 4H.
As seen on the 4-hour chart, the GBP/USD pair performed an increase in the area of the corrective level of 50.0% (1.3094), which I mentioned in yesterday's review. Also, the pair's quotes came close to the previous peak level - 1.3118. In that area, I'm waiting for the quotes to turn down and resume falling. Perhaps immediately, perhaps a little higher and a little later. Just like for the euro, we have a new upward correction line, and in addition to it, a small upward correction line. Fixing quotes below the correction line will work in favor of the US dollar. Closing below the trend line will work in favor of the US dollar. The rebound of the pound-dollar pair from the Fibo level of 50.0% (or 38.2%) will work in favor of the US dollar. I am considering the option of increasing the pair's quotes, however, I believe that there is more chance of a renewed fall in the pound. The information background is neutral for the pair today, no economic reports are listed in the calendar today. Forecast for GBP/USD and trading recommendations: The trading idea is still in the sales of the pound. However, this time, I expect a reversal around the level of 1.3094 with a drop of about 100 points down. Or closing under the global correction line and further falling 100-200 points down. Anyway, you need to wait for signals in the form of closing under the correction lines or rebounds from the level of 1.3094 or 1.3139. The material has been provided by InstaForex Company - www.instaforex.com |
| Fractal analysis for major currency pairs as of January 22 Posted: 22 Jan 2020 06:06 AM PST Hello, dear colleagues. For the euro-dollar pair, the price forms a potential for the development of a downward trend on the H1 scale and the level of 1.1064 is the key resistance. For the pound-dollar pair, we follow the upward structure of January 20 and the level of 1.3128 is the key resistance. For the dollar-franc pair, we expect the upward movement to continue after the breakout of 0.9728 and the level of 0.9667 is the key support. For the dollar-yen pair, we expect the continuation of the downward cycle from January 8 after the breakdown of 110.40. For the euro-yen pair, local initial conditions are needed to resume the upward movement, which we expect to reach the level of 122.68. For the pound-yen pair, we expect a move to the level of 144.53 and the level of 143.07 is the key support. Forecast for January 22: Analytical review of currency pairs on the H1 scale:
For the euro-dollar pair, the key levels on the H1 scale are: 1.1131, 1.1115, 1.1102, 1.1079, 1.1064, and 1.1031. We follow the downward structure from January 16. The short-term downward movement is expected in the area of 1.1079-1.1064 and the breakdown of the last value will lead to a pronounced movement. The potential target is 1.1031 and we expect a pullback up from this level. The short-term upward movement is possible in the range of 1.1102-1.1159 and the breakdown of the last value will lead to a deep correction. The target is 1.1111 and this level is the key support for the downward structure. The main trend is the downward structure from January 16. Trading recommendations: Buy: 1.1102 Take profit: 1.1113 Buy: 1.1116 Take profit: 1.1130 Sell: 1.1078 Take profit: 1.1065 Sell: 1.1063 Take profit: 1.1034
For the pound-dollar pair, the key levels on the H1 scale are: 1.3207, 1.3174, 1.3128, 1.3089, 1.3071, and 1.3035. The price canceled the development of the downward structure, and at the moment, we are following the upward structure from January 20. We expect the upward movement to continue after the breakout of 1.3128. In this case, the target is 1.3174. We consider the level of 1.3207 as a potential value for the top; when this level is reached, we expect consolidation, as well as a pullback to the top. A short-term downward movement is possible in the area of 1.3089-1.3071 and the breakdown of the last value will lead to a deep correction. The target is 1.3035 and this level is the key support for the top. The main trend is the upward structure from January 20. Trading recommendations: Buy: 1.3128 Take profit: 1.3172 Buy: 1.3175 Take profit: 1.3205 Sell: 1.3089 Take profit: 1.3073 Sell: 1.3068 Take profit: 1.3037
For the dollar-franc pair, the key levels on the H1 scale are: 0.9809, 0.9778, 0.9758, 0.9727, 0.9699, 0.9686, and 0.9667. We follow the development of the upward structure from January 16. We expect the upward movement to continue after the breakout of 0.9727. In this case, the target is 0.9758 and in the area of 0.9758-0.9778 is the short-term upward movement, as well as consolidation. We consider the level of 0.9809 to be a potential value for the upward movement; upon reaching this level, we expect a downward rollback. A short-term downward movement is possible in the area of 0.9699-0.9686 and the breakdown of the last value will lead to a deep correction. The target is 0.9667 and this level is the key support for the top. The main trend is an upward cycle from January 16. Trading recommendations: Buy: 0.9727 Take profit: 0.9756 Buy: 0.9758 Take profit: 0.9776 Sell: 0.9699 Take profit: 0.9687 Sell: 0.9684 Take profit: 0.9668
For the dollar-yen pair, the key levels in the H1 scale are: 111.38, 110.78, 110.39, 109.81, 109.58, and 109.23. We follow the development of the upward cycle from January 8. At the moment, we expect to reach the level of 110.39 and the breakdown of which will allow us to count on the movement to the level of 110.78. The breakdown of 110.80 should be accompanied by a pronounced upward movement. The potential target is 111.38. A short-term downward movement is possible in the range of 109.81-109.58 and the breakdown of the last value will lead to an in-depth correction. The target is 109.23 and this level is the key support for the top. The main trend is the upward cycle of January 8. Trading recommendations: Buy: 110.40 Take profit: 110.76 Buy: 110.80 Take profit: 111.35 Sell: 109.80 Take profit: 109.58 Sell: 109.55 Take profit: 109.25
For the Canadian dollar-dollar pair, the key levels on the H1 scale are: 1.3157, 1.3126, 1.3112, 1.3090, 1.3062, 1.3040, and 1.3015. We follow the development of the upward cycle from January 7. We expect the upward movement to continue after the breakout of 1.3090. In this case, the target is 1.3112 and in the area of 1.3112-1.3126 is the consolidation. We consider the level 1.3157 to be a potential value for the top; upon reaching this level, we expect a downward rollback. The short-term downward movement, as well as consolidation, are possible in the area 1.3040-1.3015 and the breakdown of the latter value will lead to the formation of initial conditions for the downward cycle. In this case, the potential target is 1.2988. The main trend is the upward cycle from January 7, the correction stage. Trading recommendations: Buy: 1.3090 Take profit: 1.3112 Buy: 1.3126 Take profit: 1.3155 Sell: 1.3038 Take profit: 1.3017 Sell: 1.3013 Take profit: 1.2990
For the Australian dollar-dollar pair, the key levels on the H1 scale are: 0.6885, 0.6867, 0.6853, 0.6820, 0.6803, 0.6781, and 0.6763. We follow the development of the downward structure from January 16. We expect a short-term downward movement in the range of 0.6820-0.6803 and the breakdown of the last value should be accompanied by a pronounced downward movement. The target is 0.6781. We consider the level of 0.6763 as a potential value for the bottom, upon reaching which we expect consolidation, as well as a pullback to the top. The short-term upward movement is expected in the area of 0.6853-0.6867 and the breakdown of the last value will lead to a deep correction. The target is 0.6885 and this level is the key support for the downward structure. The main trend is the downward structure from January 16. Trading recommendations: Buy: 0.6853 Take profit: 0.6865 Buy: 0.6868 Take profit: 0.6883 Sell: 0.6820 Take profit: 0.6804 Sell: 0.6802 Take profit: 0.6784
For the euro-yen pair, the key levels on the H1 scale are: 123.89, 123.32, 123.06, 122.68, 122.36, 121.80, 121.47, and 121.06. For the subsequent development of the upward trend, it is necessary to create local initial conditions. The resumption of the upward movement is expected after breakdown 122.36. In this case, the first target is 122.68. The breakdown of which, in turn, should be accompanied by a pronounced movement to the level of 123.06 and in the area of 123.06-123.32 is the short-term upward movement, as well as consolidation. A breakdown of the level of 123.35 will lead to a movement to a potential target - 123.89, from this level, we expect a rollback down. A short-term downward movement is possible in the area of 121.80-121.47 and the breakdown of the last value will lead to the development of a downward structure from January 16. In this case, the goal is 121.06. The main trend is the downward structure from January 16. Trading recommendations: Buy: 122.36 Take profit: 122.66 Buy: 122.70 Take profit: 123.06 Sell: 121.80 Take profit: 121.50 Sell: 121.45 Take profit: 121.10
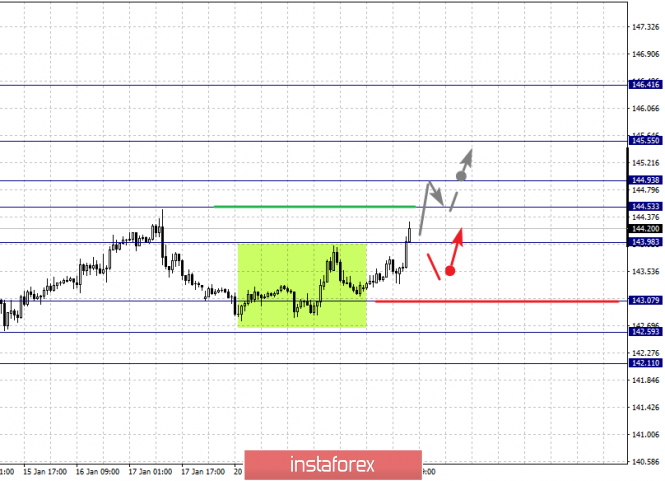
For the pound-yen pair, the key levels on the H1 scale are: 146.41, 145.55, 144.93, 144.53, 143.98, 143.07, 142.59, and 142.11. It is expected to reach the level of 144.53. A short-term upward movement in the area of 144.53-144.93 is also expected and the breakdown of the last value will lead to a move to the level of 145.55, near which we expect consolidation. The potential value for the top is the level of 146.41, from which we expect a pullback to the bottom. A short-term downward movement is possible in the area of 143.07-142.59 and the breakdown of the last value will lead to the formation of initial conditions for the downward cycle. In this case, the potential goal is 142.11. The main trend is the upward structure from January 3, the correction stage. Trading recommendations: Buy: 144.53 Take profit: 144.91 Buy: 144.95 Take profit: 145.55 Sell: 143.05 Take profit: 142.65 Sell: 142.54 Take profit: 142.11 The material has been provided by InstaForex Company - www.instaforex.com |
| January 22, 2020 : GBP/USD Intraday technical analysis and trade recommendations. Posted: 22 Jan 2020 06:05 AM PST
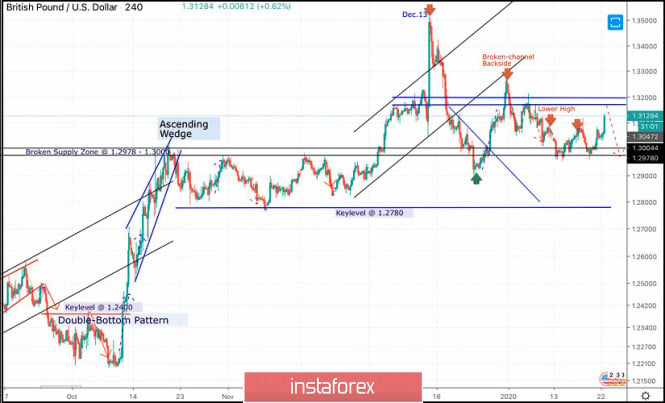
On December 13, the GBPUSD pair looked overpriced around the price levels of 1.3500 while exceeding the upper limit of the newly-established bullish channel. On the period between December 18 - 23, bearish breakout below the depicted channel followed by initial bearish closure below 1.3000 were demonstrated on the H4 chart. However, earlier signs of bullish recovery were manifested around 1.2900 denoting high probability of bullish pullback to be expected. Thus, Intraday technical outlook turned into bullish after the GBP/USD has failed to maintain bearish persistence below the newly-established downtrend line. That's why, bullish breakout above 1.3000 was demonstrated allowing the recent Intraday bullish pullback to pursue towards 1.3250 (the backside of the broken channel) where bearish rejection and another bearish swing were suggested for conservative traders in previous articles. Moreover, two descending highs were recently demonstrated around 1.3120 and 1.3090 which enhances the bearish side of the market. Intraday technical outlook remains bearish as long as the pair maintains is movement below 1.3120. Conservative traders should wait for bearish breakdown below 1.2980, This is needed first to enhance further bearish decline towards 1.2900, 1.2800 and 1.2780 where the backside of the previously-broken downtrend is located. In the Meanwhile, Intraday traders can watch any bullish pullback towards the depicted price zone (1.3170 - 1.3200) for bearish rejection and another valid SELL entry with intraday bearish targets projected towards 1.3000 and 1.2980. On the other hand, any bullish breakout above 1.3100-1.3120 (the recently established descending high) invalidates the intraday bearish scenario. Thus, further bullish pullback would be expected towards 1.3200. The material has been provided by InstaForex Company - www.instaforex.com |
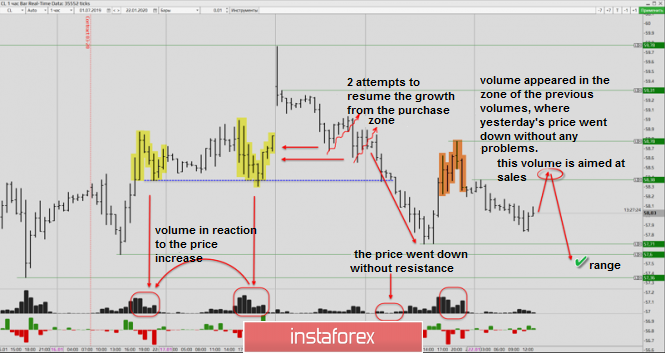
| Volume analysis and trading idea for oil Posted: 22 Jan 2020 04:55 AM PST On Thursday last week, the futures for oil expired. New money provides new levels and price movements. At the same time, on Thursday and Friday, US volumes rose up, and the price of GEP made a new high. On the same day (Monday), in the European session, two attempts to resume the price growth from the previous US volumes were made. However, it did not succeed, which suggests a reduced volume in this zone, as well as the lack of progress in price growth. Moreso, on Monday, it was a public holiday in the United States, and the Americans did not bargain. The price easily went down under these volumes, confirming the absence of buyers at the level of previous volumes. Yesterday, during the US session, the price came to the zone of the previous volumes. The price went down there, making the volume appear in the zone. This just means that this volume is more likely to be sold. Wait for sales from the local level of 58.38-58.40, in order to capture the liquidity of 2 days-57.70 - 57.60. Good luck in trading and control your risks! The material has been provided by InstaForex Company - www.instaforex.com |
| Evening review for EURUSD for 01/22/2020. The key level for the euro - 1.1070 Posted: 22 Jan 2020 04:49 AM PST
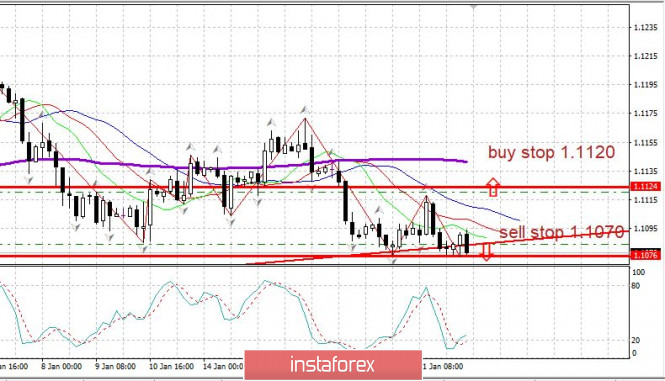
The main news factor is the same - expectations of ECB decisions tomorrow, January 23 - and the speech of ECB head Lagarde. In anticipation of this event, a serious fight between the "bulls" and "bears" on the euro unfolded: It seems that the level of 1.1070 is the key to the further direction of the euro. EURUSD: We are ready to buy from the level of 1.1120. We are ready to sell from the level of 1.1070. The material has been provided by InstaForex Company - www.instaforex.com |
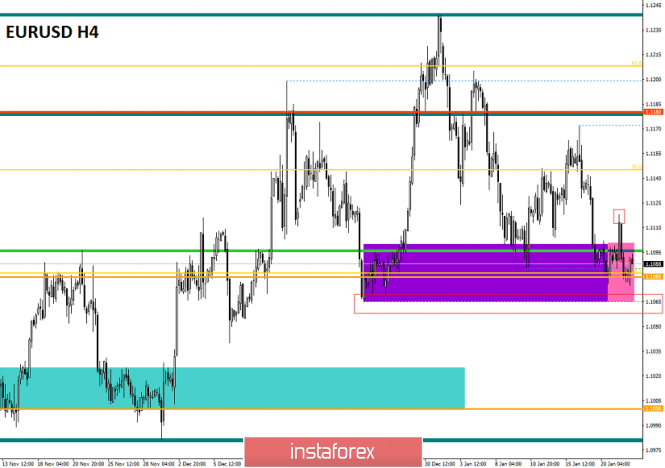
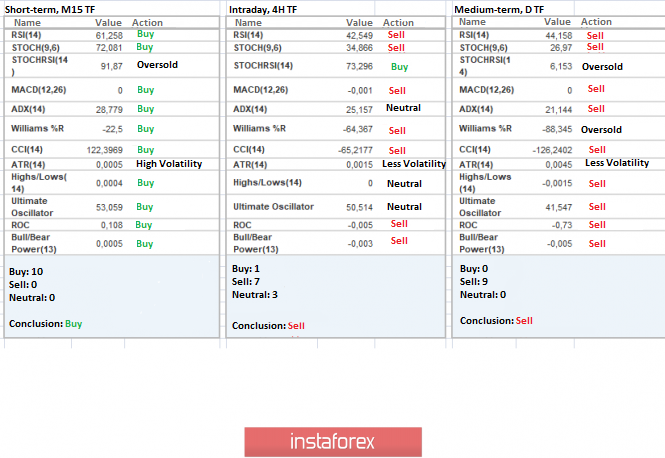
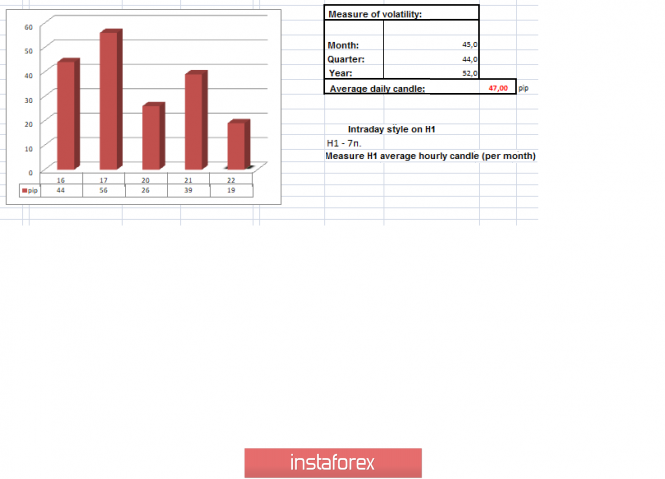
| Trading recommendations on EUR/USD for January 22 Posted: 22 Jan 2020 03:42 AM PST Using complex analysis, we can see a bolt within the range of 1.1080. Attempts to raise activity were noticed, but it did not lead to any drastic changes. In fact, pent-up interest directly signals that short positions prevail in the market. Otherwise, the rebound from the control level would have been more significant. Comparing historical data, we see that the level of 1.1080 carries a significant role in the market. Interaction of quotes with the coordinator was seen more than ten times, indicating its exceptional strength. However, although it is considered the point of interaction, this does not mean that the price can not break through it. On the contrary, we can later see subsequent strengthening there. Looking at the market in general terms, the EUR / USD and GBP / USD currency pairs, which have a high correlation with each other, once again reaffirmed their "fellow" status during the European session yesterday. The most notable point was that the EUR / USD pair, unlike that of the pound, fully recovered by the end of the trading day. It returned to the pivot point, which strengthened the judgment that downward interest prevails in the market. In terms of volatility, we have an acceleration of 50%, as compared to the day before. However, in terms of the daily average, we have recorded a weakness of 17%. Analyzing the past day by the minute, there is an upward surge during 9: 30-13: 00 London time. The subsequent movement was in terms of recovery, which almost reflected the analogy of the previous movement. As discussed in the previous review, traders took a wait-and-see position, using the "Break / Rebound" method, where the 1.1110 point was locally touched by the quote, but did not bring the proper income, thereby reducing the position. Downward trades, which were considered the main ones, were not opened, since the price failed to fix below 1.1060. Looking at the trading chart, we can see the price focusing on the first stage of the recovery process relative to the oblong correction. The news background of the past day did not have any relevance on Europe and the United States statistically, however, due to the correlation, the macroeconomic statistics of Britain pulled the single currency. This is purely a technical factor though, as we have written at the beginning of the article. In terms of information background, the annual world economic forum was launched in Davos yesterday, where participants discussed key bilateral issues, including trade, energy and cooperation in the field of technology. The greatest interest, as always, was the speech of US President Donald Trump, who indicated serious intentions to impose duties on car imports from EU, if the parties fail to conclude a trade agreement on terms that suit Washington. "They know that I'm going to impose duties if they don't make a deal that is fair," the White House chief said. He did not give a specific deadline for when negotiations should end. At the same time, Mr. Trump did not forget to criticize the actions of the Federal reserve, believing that the management policy was chosen incorrectly, since the rate was inflated very quickly, and the decline is very slow. "We have to compete with countries that get negative rates, something very new, that is, they are paid to borrow money, which I can get used to very quickly. I like it," said Donald Trump Today, in terms of the economic calendar, we have data on the real estate market in the United States, where sales in the secondary market can grow by 1.3%. Further development Analyzing the current trading chart, we can see an attempt to rebound from the level of 1.1080. However, the price move is uncertain, so the pressure of the nearby level remains. In fact, there is a restrained nature, which can be attributed to the plus, due to the fact that accumulation is being made. This can result to an impulse or acceleration. In terms of the emotional component of the market, we can see the very restraint of participants, where literally everyone is at a low start, and, of course, trading volumes may increase at the moment. Detailing the available trading day every minute, we see that the night flat, with an amplitude of about 10 points, was broken at the start of the European trading session by local rising candles. Because of this, traders have a small amount of long positions, but a restrictive order is attached to them. The analysis of the quote behavior and price fixing points is still underway, with special attention being paid to the value of 1.1060. It is likely that the ambiguous fluctuation within the range of 1.1080 will continue in the market. Trading tactics remain the same "Break / Rebound" relative to the control level. Amendment is worth making, as the goal is to identify the main move, not the local oscillation. Based on the above information, we will output the following trading recommendations: - Buying positions are available in a small volume. topping up is possible if the exit is higher than 1.1125, not before. - Sell positions will be considered if the price fixes below 1.1060. Indicator analysis Analyzing the different sectors of timeframes (TF), we can see that the indicators on minute time intervals alternately slide due to the accumulation process along the control level. Hour and day periods, on the other hand, hold downward interest, citing the earlier measures. Volatility for the week / Volatility measurement: Month; Quarter Year The volatility measurement reflects the average daily fluctuation, and is based on the calculation for the Month / Quarter / Year. (January 22 was based on the time of publication of the article) At the moment, volatility is at 19 points, which is a low indicator for this time interval. It is likely to assume that as long as we are marking time at the control level, volatility will remain low, however, as soon as there is a breakdown or rebound, we will see the long-awaited acceleration. Key levels: Resistance zones: 1,1080 **; 1,1180; 1.1300 **; 1.1450; 1.1550; 1.1650 *; 1.1720 **; 1.1850 **; 1,2100 Support areas: 1,1080 **; 1,1000 ***; 1.0900 / 1.0950 **; 1.0850 **; 1,0500 ***; 1.0350 **; 1,0000 ***. * Periodic level ** Range level *** Psychological level ***** This article is based on the principle of conducting a transaction, with daily adjustments. The material has been provided by InstaForex Company - www.instaforex.com |
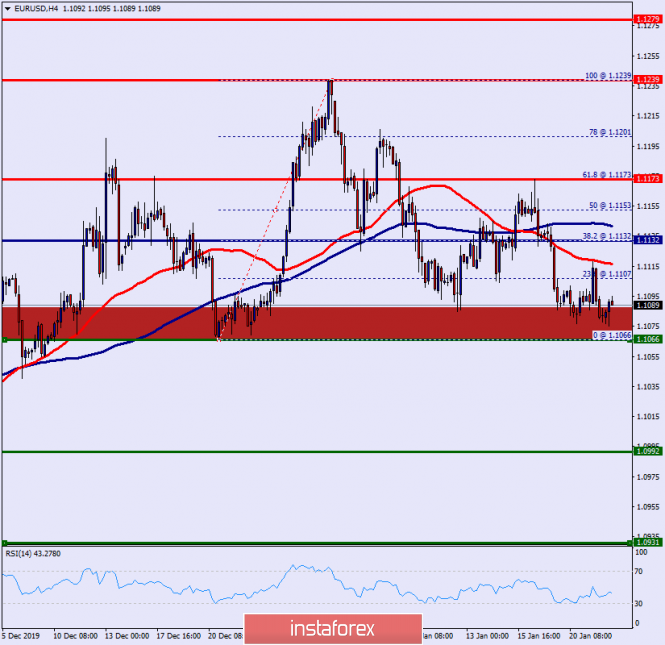
| Technical analysis of EUR/USD for January 22, 2020 Posted: 22 Jan 2020 03:00 AM PST Overview: The EUR/USD pair continues to move downwards from the level of 1.1239, which represents the double top in the H4 chart. Yesterday, the pair dropped from the level of 1.1173 to the bottom around 1.1080. Today, the first resistance level is seen at 1.1173 followed by 1.1239, while daily support is seen at the levels of 1.1066 and 1.0992. According to the previous events, the EUR/USD pair is still trapping between the levels of 1.1132 and 1.0992. Hence, we expect a range of 140 pips in coming hours. The first resistance stands at 1.1132. If the EUR/USD pair fails to break through the resistance level of 1.1132, the market will decline further to 1.1066. This would suggest a bearish market because the RSI indicator is still in a negative area and does not show any trend-reversal signs. The pair is expected to drop lower towards at least 1.0992 in order to test the second support (1.0992). On the contrary, if a breakout takes place at the resistance level of 1.1239 (the double top), then this scenario may become invalidated. The material has been provided by InstaForex Company - www.instaforex.com |
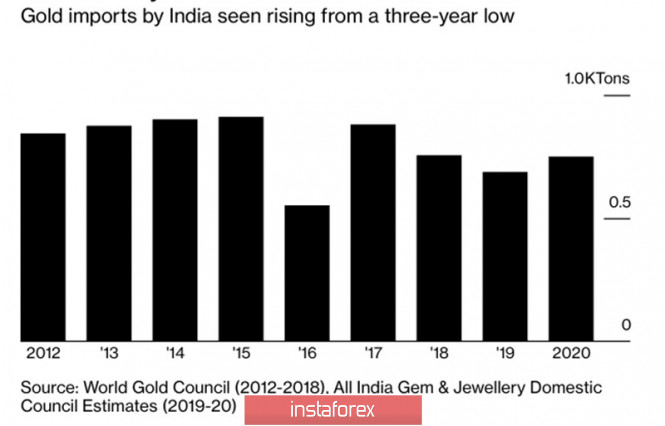
| Posted: 22 Jan 2020 02:36 AM PST After a rough start due to the conflict in the Middle East, gold calmed down and recovered. The precious metal quotes have chosen the consolidation range of $1545-1570 per ounce, and investors are weighing all the pros and cons of restoring the bullish trend. The external background for XAU/USD buyers remains favorable: despite the signing of a trade agreement between Washington and Beijing, tariffs on $360 billion of Chinese imports remain in force, Britain has not yet left the EU, and Donald Trump is dissatisfied with a significant deficit in American foreign trade and threatens Brussels with higher duties on car deliveries from the Old World. However, the "bears" for gold are not born yesterday. The combination of a strong economy and the US dollar, as well as stock indexes that feel comfortable near historical highs, do not allow the "bulls" to seriously count on the return of the initiative. This requires adjustments to the S&P 500 and the USD index, including those caused by a slowdown in US GDP. Many gold fans believe this. No matter how much Donald Trump praises the US economy at the world economic forum in Davos, they ask provocative questions: if everything is good, why is the Fed lowering rates? Why does the Central Bank launch QE and claim that it is not a quantitative easing program? Because it is about buying bonds? In my opinion, Jerome Powell's persistent reluctance to link the Fed's balance sheet expansion to QE is due to concerns about increased market turbulence due to the exit from the program. In the end, the balance will have to be brought back to normal, and as history shows, hints of curtailing the quantitative easing program unnerve investors. Information about China's first reduction in gold consumption over the past three years and the drop in Indian imports of precious metals to a 3-year low is twofold. There is a logical explanation for this dynamic: in the conditions of a slowing economy and rising prices, it makes sense to expect a reduction in gold consumption. According to the All India Jewelry Council, imports will increase from 690 tons to 750 tons in 2020. Dynamics of Indian gold imports
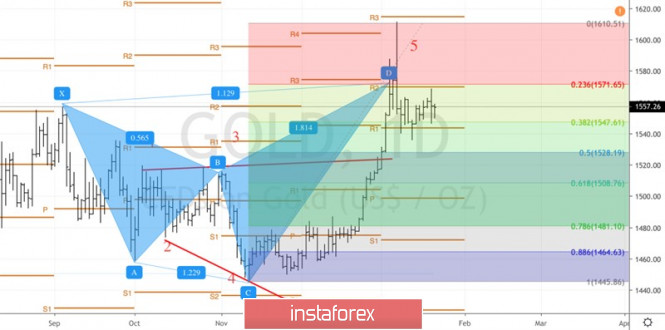
In my opinion, the decline in demand for the precious metal from the largest consumers is the result of the XAU/USD rally, and not the reason. If the welfare of the population under the influence, including trade wars, decreases, and prices rise, interest in purchases fades. According to the OECD, the World Bank and the IMF, the world economy will recover very slowly in 2020. At first glance, this is good news for gold, but in fact, everything will depend on the US. If the US GDP continues to please, the USD index will resume its rally, which will adversely affect the positions of the precious metal. Technically, the daily gold chart shows the formation of the "surge and shelf" pattern. A breakthrough of the upper limit of the consolidation range ("shelf") of $1545-1570 per ounce will create prerequisites for the recovery of the upward trend. On the contrary, a successful storm of support at $1545 will increase the risks of developing a corrective movement in the direction of $1525 and $1505. Gold, the daily chart
|
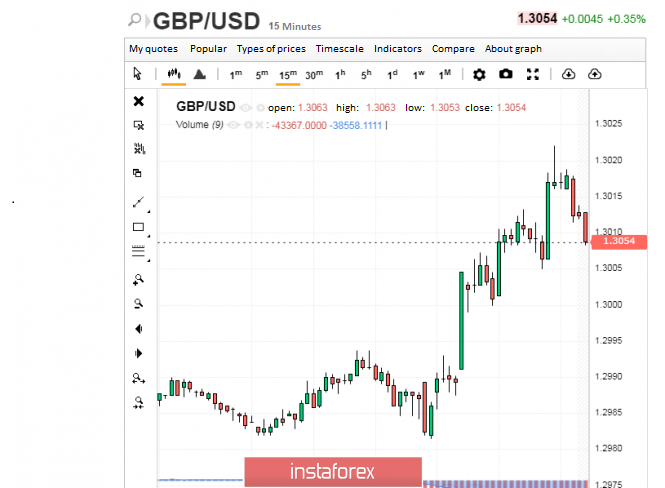
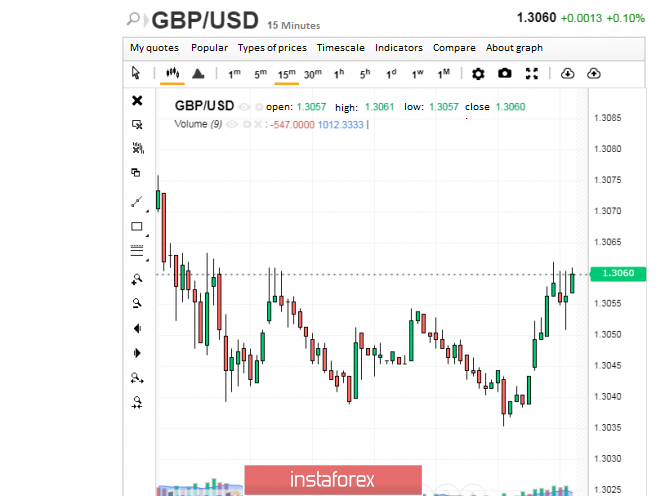
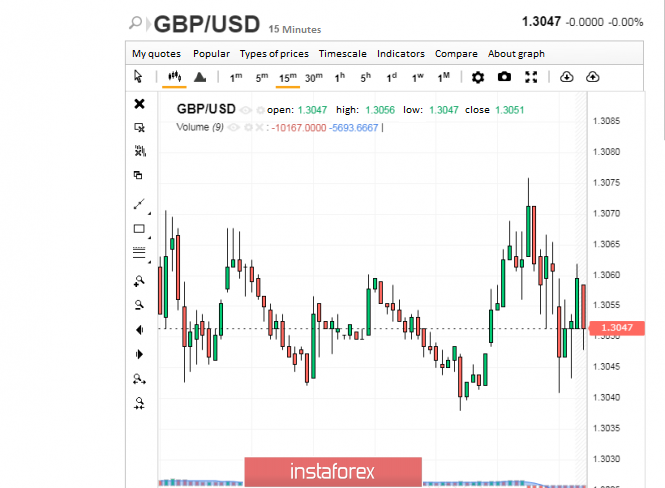
| Is the Pound a candidate for outsiders? No! Posted: 22 Jan 2020 02:25 AM PST Observing the current price "swing" of the pound, many analysts predict its defeat. However, like most market participants, their opponents do not agree with this position. The British currency is quite stable, and it does not threaten to be at the fringes of the financial world, experts reassure. A number of political factors, primarily related to Brexit, undermine the pound but macroeconomic data provide strong support. Analysts were pleasantly surprised by the current UK labor market results. Despite the significant number of applications for unemployment benefits, its level did not leave record low limits, amounting to only 3.8%. Note that the number of applications did not exceed 14,900, although analysts expected 22,600. At the same time, the level of salaries in Foggy Albion remained at around 3.2% despite forecasts for a decrease to 3%. The current situation allowed the GBP / USD pair to achieve a small correctional growth on Tuesday, January 21, which then continued on Wednesday. Yesterday, the GBP / USD pair left the low range at 1.3005, decisively moving up. The efforts of the tandem were rewarded as by the end of the day, the pair reached 1.3054–1.3055, maintaining an upward momentum until the next day. Morning of January 22, began positively for the pound, but the GBP / USD pair could not gain a foothold at this level after having reached 1.3060. The takeoff was expected to be followed by a recession. The tandem collapsed to a critical value of 1.3046–1.3047, rushing to the bottom. With a tremendous effort, the GBP / USD pair managed to stay afloat. However, the tandem later entered a rising spiral overcoming the attraction of the bottom. According to experts, the long-term weakness of the British economy was slightly offset by increased macroeconomic statistics, which is good news for the market. For the first time in a long time, sterling received powerful economic recharge, in the wake of which it has grown a little. However, experts believe that it is too early to talk about the upward trend in the pound. Analysts warned against excessive euphoria regarding macroeconomic data pleasing the market, believing that their importance for the dynamics of the "British pound" is greatly exaggerated. The concern of investors and traders is caused by the difficult situation that has developed around Britain's exit from the EU. The current uncertainty about a trade deal with Brussels worries participants and shakes the position of the British currency. Recall that in late January, Britain should leave the European Union, after which another round of trade negotiations is expected, which can last until December 2020. One can only guess about their outcome. Another traumatic factor for the "British pound" is the likelihood of monetary easing by the Bank of England. The catalyst for this decision may be the weak employment data in the UK for November-December of 2019. According to preliminary forecasts, the average wage may deteriorate, and the unemployment rate in the country will not leave the 3.8% mark. Recall that for revenge months in a row, the growth rate of British salaries has been declining, and this gives the regulator an opportunity to lower interest rates. Changes in monetary policy by the Bank of England can be prompted by such negative factors as a reduction in inflation, a noticeable decline in the industrial sector and a deterioration in economic growth indicators, which have not been observed over the past 8 years. According to experts, this brings the UK closer to the economic recession and puts extreme pressure on the national currency. Many market participants fear that a combination of negative factors could send the GBP/USD pair to outsiders in the foreign exchange market. According to analysts, global fundamental factors are not in favor of the British currency. Pressure on the pound remains both from the side of geopolitics particularly, Brexit issues and very elusive support from the USA, and from the side of macro-statistics which is the current reports on the UK economy. Sterling tries not to fall under the yoke of negative factors, and in most cases, it succeeds. Experts cleared, in the short term, we are not talking about victory but it's premature to write the pound to outsiders of the market. The material has been provided by InstaForex Company - www.instaforex.com |
| AUD/USD drop in progress. Further drop expected! Posted: 22 Jan 2020 01:34 AM PST
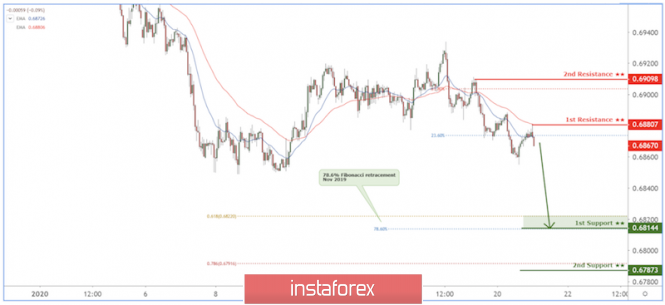
Trading Recommendation Entry: 0.68807 Reason for Entry: Horizontal swing high Take Profit : 0.69255 Reason for Take Profit: 78.6% Fibonacci retracement, 61.8% Fibonacci extension, Horizontal swing high Stop Loss: 0.69098 Reason for Stop loss: 61.8% Fibonacci retracement The material has been provided by InstaForex Company - www.instaforex.com |
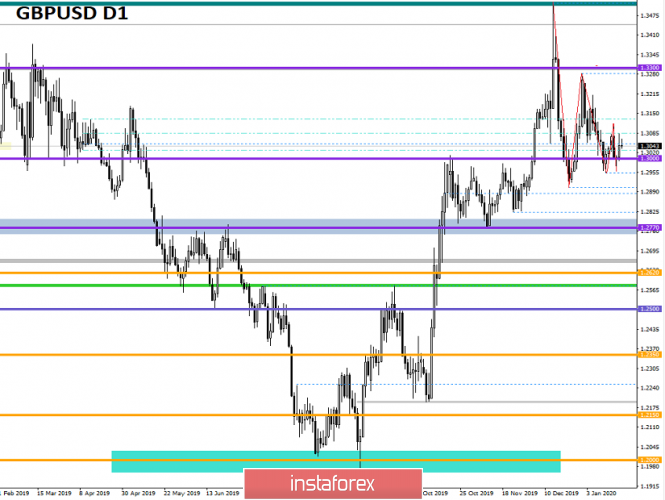
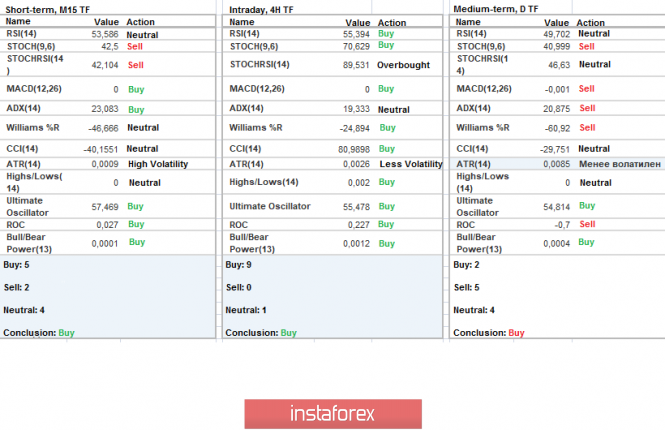
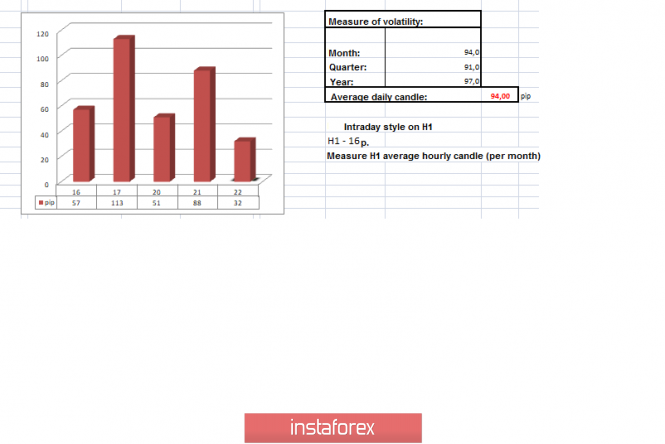
| Trading recommendations for GBP/USD on January 22 Posted: 22 Jan 2020 01:27 AM PST From the point of view of complex analysis, we see another rebound from the range-psychological level of 1.3000, where the quote locally returned to the point of interaction of the previous correction move. In fact, the value of 1.3080 plays the role of a variable level of resistance again, locally slowing buyers and forming a rebound. Another regularity that we encountered reflects the repetition of the fluctuation of the period of January 14–16. Now, the question arises whether the similar downward movement that took place in the past period can be repeated. To answer this, we have a theory of the Zigzag-shaped model, which sequentially forms phases. The structure of the model has three correction phases, where each subsequent phase is expressed by compression. [The first phase - 609 points, 12/13/19 (High) 12/23/19; The second phase - 329 points, 12/31/19 (High) 01/14/20; The third phase - 155 points, 01/17/19 (High) 01/20/20] The pulsed phases confirm the theory of compression, having approximately 50% development of the previous phases. Regarding the psychological level, we see obvious pressure on the quote, where traders assume the formation of a local flat together with the theory of slowdown. In terms of volatility, we see an insignificant acceleration compared to the day before, but it is still not enough to talk about cardinal changes. Analyzing the past minute by minute, we see the process of rebound from the control level, where the main impulses occurred during the period 8:30–12:00 [UTC+00 time on the trading terminal]. The subsequent move was in terms of deceleration and reverse. As discussed in a previous review, speculators considered local long positions from 1.3215 in terms of the next beat of the Zigzag-shaped model. Considering the trading chart in general terms [the daily period], we see an increasingly significant slowdown relative to fluctuations from the beginning of the new year, where virtually everything that happens is at the peak of the medium-term upward trend. The news background of the past day included statistics for the UK, where unemployment at 3.8%, as well as the number of applications for unemployment benefits, did not have significant changes. The driver for the pound sterling was employment data, where the growth was 208 thousand, taking into account the forecast of 104 thousand. Moreover, a decline in the positive was also the average wage excluding premiums, where the slowdown was 3. 4%, instead of slowing from 3.5 to 3.3% The market reaction to macroeconomic statistics was lightning fast and the pound sterling rushed into a local impulse move. In terms of the general informational background, we have a fuss over the long-playing Brexit. The Britain itself still cannot approve the withdrawal agreement, while the European Commission is discussing possible sanctions in case of non-compliance with the rules of the future agreement. In turn, the House of Lords, where the Brexit deal is currently under negotiation, is literally delaying approval, insisting on amendments regarding the status of foreigners with EU citizenship after Brexit. Yet, it is worthwhile to understand that the House of Lords has no authority to cancel the bill, it can only return it back to the Lower House as amended, so there is no need to worry. In turn, Boris Johnson said that he was preparing a change in the migration system during the British-African Investment Summit, which would become more equitable after the country's exit from the EU. Let me remind you that the system is now designed so that British companies cannot offer work to a resident of a non-European country without first considering applications from applicants from EU countries. That is, the criteria for knowledge of English, the presence of a sponsor company and the level of salary bypassed EU residents. Today, in terms of the economic calendar, we have data on borrowings in the public sector in Britain, the volume of which can be reduced by 4.6 billion pounds. In the afternoon, data on the real estate market in the United States, where sales in the secondary market may grow by 1.3%, will be released. Further development Analyzing the current trading chart, we see an obvious stop, having a small amplitude of fluctuation. In fact, the quote feels a periodic ceiling above itself, which is reflected from the past measure. In turn, the Zigzag-shaped model continues to compress, possibly having a fourth correction phase. In view of the already full compression, the new phase can transform into a flat, where the psychological level will remain the control level [1.3000] In terms of the emotional mood of the market, we see restraint, but this is all due to the slowdown that is evident. By detailing the per minute portion of time, we see a sluggish recovery with a small amplitude of about 40 points, where there are actually 1.3035 / 1.3080 boundaries. In turn, speculators with local long positions fixed them yesterday, having received a small profit. Now, the strategy is aimed at identifying the main impulses, where they operate on the current range, as well as on control levels. Having a general picture of actions, it is possible to assume that the fluctuation within the boundaries of 1.3035 / 1.3080 will not last long and we will definitely see a breakdown. Thus, the trading strategy is divided into local moves and the main ones, that is, when one or another breakdown is broken, we do not enter the full volume, after which we focus on the coordinates and fixation points relative to 1.2950 and 1.3180. Based on the above information, we derive trading recommendations: - Buy positions are considered in terms of the local move, in case of price fixing higher than 1.3090, with a move towards 1.3115-1.311-1.3180. Further actions are taken after fixing the price higher than 1.3140. - Sales positions are considered in terms of the local move, in case of fixation lower than 1.3030, with a move in the direction of 1.3000-1.2980. Further actions are taken after fixing the price lower than 1.2950 Indicator analysis Analyzing a different sector of timeframes (TF), we see that the indicators of technical tools have turned around locally, having a buy signal due to the recent phase. The medium-term period invariably retains downward interest. Volatility per week / Measurement of volatility: Month; Quarter; Year Measurement of volatility reflects the average daily fluctuation, calculated for the Month / Quarter / Year. (January 22 was built taking into account the time of publication of the article) The current time volatility is 32 points, which is an extremely low indicator. It is likely to assume that even a breakdown of the current range can give activity to the market, and the volatility will easily exceed the daily average if the Zigzag-shaped model is completed. Key levels Resistance zones: 1.3180 **; 1.3300 **; 1.3600; 1.3850; 1.4000 ***; 1.4350 **. Support Areas: 1,3000; 1.2885 *; 1.2770 **; 1.2700 *; 1.2620; 1.2580 *; 1.2500 **; 1.2350 **; 1.2205 (+/- 10p.) *; 1.2150 **; 1,2000 ***; 1.1700; 1.1475 **. * Periodic level ** Range Level *** Psychological level **** The article is built on the principle of conducting a transaction, with daily adjustment The material has been provided by InstaForex Company - www.instaforex.com |
| You are subscribed to email updates from Forex analysis review. To stop receiving these emails, you may unsubscribe now. | Email delivery powered by Google |
| Google, 1600 Amphitheatre Parkway, Mountain View, CA 94043, United States | |





No comments:
Post a Comment