
Forex analysis review |
- Overview of the GBP/USD pair. February 12. Scotland's First Minister Nicola Sturgeon is starting a war with Boris Johnson
- Overview of the EUR/USD pair. February 12. Christine Lagarde calls on EU countries to stimulate economy and ignores coronavirus
- Forecast for AUD/USD on February 12, 2020
- Forecast for EUR/USD on February 12, 2020
- Forecast for GBP/USD on February 12, 2020
- Fractal analysis of the main currency pairs for February 12
- Comprehensive analysis of movement options of #USDX vs AUD/USD vs USD/CAD vs NZD/USD (H4) on February 12
- GBP/USD. February 11. Results of the day. Great Britain's GDP was very surprising, but not industrial production
- EUR/USD. February 11. Results of the day. No surprises in Jerome Powell's speech. Euro may start correction
- GBPUSD: pound and UK in for good times, just needs to wait. UK GDP report encourages investors
- Evening review 02/11/2020 EURUSD. Strong correction for the euro is possible
- Dollar strengthens onslaught, potential for pulling down the euro and pound has not yet been exhausted
- February 11, 2020 : GBP/USD Intraday technical analysis and trade recommendations.
- February 11, 2020 : EUR/USD Intraday technical analysis and trade recommendations.
- GBP/USD: plan for the US session on February 11. Buyers of the pound are satisfied with the GDP data for December 2019, but
- EUR/USD: plan for the US session on February 11. The bears are trying to break the level of 1.0905
- Technical analysis for USD/CHF on February 11, 2020
- Trading recommendations for the GBPUSD currency pair on February 11
- Analysis of EUR/USD and GBP/USD on February 11. Speeches by Jerome Powell and Christine Lagarde may stir up the market
- Fractal analysis for major currency pairs as of February 11
- Gold 02.11.2020 - Watch for selling opportunities due to the down cycle
- GBP/USD 02.11.2020 - Multi pivot at the prrice of 1.2950, watch for prrice action around it to confirm furrher direction
- BTC analysis for 02.011.2020 - Mini sell signal due to breakout of Pitchfork upward channel, watch for test of $9.060
- Technical analysis of AUD/USD for February 11, 2020
- Trading recommendations for EUR/USD on February 11
| Posted: 11 Feb 2020 08:08 PM PST 4-hour timeframe
Technical details: Higher linear regression channel: direction - upward. Lower linear regression channel: direction - downward. Moving average (20; smoothed) - sideways. CCI: 18.9795 The GBP/USD currency pair continues to adjust on February 12, as evidenced by the Heiken Ashi indicator. At the moment, the pair's quotes have worked out the moving average line and could not gain a foothold above it. Thus, in the event of a rebound from the moving average, the downward movement can resume, which is quite logical from a fundamental point of view. Yesterday's macroeconomic reports from the UK were interpreted by many traders as positive. Approximately the same reaction of market participants was to the results of the Bank of England meeting at the end of January when nothing changed for the better, but the pound began to rise in price amid the absence of a new negative. The same situation was observed yesterday when the preliminary GDP values for the fourth quarter did not fall but remained at the levels of the previous quarter. It was this fact that provoked the continued strengthening of the pound, and the report on industrial production was ignored, which not only showed another reduction but also turned out to be worse than forecasts. There will be no more macroeconomic information coming out of the UK this week, so traders can only look closely at the US reports. Today, the US Congress will host the second consecutive speech by the head of the Fed, Jerome Powell, but it is unlikely to be more interesting than yesterday. Meanwhile, Scotland's First Minister Nicola Sturgeon has sent an official letter to London criticizing Boris Johnson's refusal to allow Edinburgh to hold a second independence referendum. Recall that the Prime Minister of Great Britain motivated his refusal by the fact that such an event as a referendum can happen once in a hundred years, and it was already held in 2014 in Scotland. Then, in 2014, the majority of Scots were in favor of maintaining the Union with London. However, in 2016, a general referendum on leaving the EU was held and the majority of Scots voted "against" it. This is what motivates Nicola Sturgeon's desire for a second referendum, whose party won unconditionally in the last parliamentary elections. "The tories are terrified that Scotland has the right to choose its future. They know that if we are given the chance, we will choose independence. In addition, the UK's position is unreasonable, it is completely destructive," the letter says. Ms. Sturgeon also said that the longer London resists the referendum, the more the equality of members of the "Westminster Commonwealth" is called into question. Already this month, the head of the Scottish National Party intends to raise the issue of a referendum in the British Parliament again. It should also be noted that the desire to remain in the EU is not just the desire of the Scottish government. The Scottish people do support this decision, holding rallies against leaving the European Union in major cities. Nicola Sturgeon herself has promised to return to the European Union as an independent state. Thus, in February, a new epic associated with the UK called the "referendum in Scotland" may begin, and in March, Britain will face negotiations with the European Union on a trade deal, which begins very badly.
The average volatility of the pound/dollar pair has decreased to 85 points over the past 5 days, and the volatility illustration clearly shows that the indicator continues to fall. According to the current volatility level, the working channel on February 12 will be limited to the levels of 1.2863-1.3033. Given the fundamental background, a resumption of the downward movement would be very logical on Tuesday. Nearest support levels: S1 - 1.2939 S2 - 1.2878 S3 - 1.2817 Nearest resistance levels: R1 - 1.3000 R2 - 1.3062 R3 - 1.3123 Trading recommendations: The GBP/USD pair continues its upward correction. Thus, traders are now advised to wait for its completion (a rebound from the moving average) and resume selling the pound with targets of 1.2878 and 1.2817. It is recommended to consider buying the British currency after fixing the price above the moving average line with the first targets of 1.3000 and 1.3062. In addition to the technical picture, you should also take into account the fundamental data and the time of their release. Explanation of the illustrations: The highest linear regression channel is the blue unidirectional lines. The lowest linear regression channel is the purple unidirectional lines. CCI - blue line in the indicator window. Moving average (20; smoothed) - blue line on the price chart. Murray levels - multi-colored horizontal stripes. Heiken Ashi is an indicator that colors bars in blue or purple. Possible variants of the price movement: Red and green arrows. The material has been provided by InstaForex Company - www.instaforex.com |
| Posted: 11 Feb 2020 07:48 PM PST 4-hour timeframe Technical details: Higher linear regression channel: direction - down. Lower linear regression channel: downward direction. Moving average (20; smoothed) - down. CCI: -85.0948 The upward correction for the EUR/USD pair has begun. At least this is now evidenced by the Heiken Ashi indicator, which turned up. The correction at the moment is characterized as very weak, but there are chances for its development. Over the past day, no important macroeconomic report has been published in the eurozone or the United States. But the speeches of Christine Lagarde and Jerome Powell took place. If we spoke about the speech of the Fed chief before the US Congress in the previous article on EUR/USD, then the speech of the ECB chairman was not affected. Namely, her speech was potentially more interesting, since everything is fine with the US economy at the moment, which is confirmed by recent reports, but the European Union continues to stall. The indicators of the state of the US economy remain much higher than the European ones, so Lagarde's speech should have been more dovish. However, the ECB president, in a speech to the European Parliament, managed to avoid a frankly dovish rhetoric. Lagarde said on Tuesday that an overly soft monetary policy negatively affects savings income and increases the cost of various assets. Once again, the ECH head called on European governments to stimulate economic growth. This primarily concerns, of course, the largest states, where the signs of economic slowdown are least visible. However, for such states (Spain, the Netherlands, Germany, France), the situation is such that they must drag the whole EU along, which, of course, is not pleasant to the governments of these countries and so far no one has heeded the calls first of Mario Draghi, and now Lagarde. The head of the ECB also said that "the longer the stakes are at" ultra-low "values, the greater the likelihood that negative effects will manifest themselves more." Also, Lagarde noted that central bank economists are now focused on finding the answer to the question "is it necessary to lower the inflation target?" At the moment, it remains at the level of "slightly below 2%" and the consumer price index cannot reach this target for the past eight years. This refers not to a one-time exit at 2%, but a long-term inflation rate at this level. Furthermore, Lagarde, unlike Powell, did not touch on the topic of the coronavirus in China. It would probably be worth it to touch on this topic. According to the latest experts, the epidemic has begun to slow down. The infection growth rate is falling, a certain number of infected people have recovered. Firstly, this means that the virus is not fatal in all cases. Secondly, with existing drugs in some cases, the patient can recover. Thirdly, it is possible that the spread of the epidemic was localized. Of course, it is too early to open champagne, but the news is certainly good. On this occasion, Donald Trump himself spoke out, who predicted the death of the virus in April. According to Trump, the coronavirus is afraid of the heat and, accordingly, in April, when the warm season begins in China, the virus will not be able to cope with the changing climatic conditions. I'd like to believe in it. To date, another Powell statement in Congress is planned, which, in our opinion, is unlikely to be too different from yesterday. Thus, the Fed chief, most likely, will again focus on positive theses that have long been known to everyone. Also on Wednesday, February 12, industrial production in the European Union for December is set to be published. And although this indicator is not the most important in itself, we have repeatedly noted its high significance at the present time. As can be seen from the graph above, industrial production has been in a deep negative in the last 13 months. And tomorrow, most likely, we will see a decline in the indication for the 14th consecutive month. Judging by experts' forecasts, December may not only end with another reduction in industrial production, but also outperform the rate of decline of the past 11 months, amounting to -2.8% y/y. In monthly terms, a reduction from -1.6% to -2.0% is expected. However, in any case, it is precisely about reduction. It is difficult to say whether weak production in the EU will cause the euro to fall. It is likely that it is not, since the euro currency has been falling non-stop in the last few days and there should still be a correction. However, we still recommend paying attention to the fast indicator Heiken Ashi, which may indicate the completion of the correction. We remind you that the common fundamental and macroeconomic backgrounds remain on the side of the US currency. The average volatility of the euro/dollar currency pair is still 46 points per day. The correction has finally begun, but so far it is very weak. Thus, on Wednesday we expect movement between the boundaries of the volatility band of 1.0869 - 1.0961. We expect continued correctional movement. Nearest support levels: S1 - 1,0864 S2 - 1,0803 S3 - 1.0742 The nearest resistance levels: R1 - 1,0925 R2 - 1.1047 R3 - 1,1108 Trading recommendations: The euro/dollar began to adjust. Thus, selling the euro is currently relevant while aiming for 1.0869, but after the reversal of the Heiken Ashi indicator back down. It is recommended to buy the pair no earlier than when the bulls overcome the moving average line, which will change the current trend to an upward one, with the first target of 1.1047. In addition to the technical picture, fundamental data and the time of their release should also be taken into account. Explanation of illustrations: The highest linear regression channel is the blue unidirectional lines. The smallest linear regression channel is the purple unidirectional lines. CCI - blue line in the indicator window. Moving average (20; smoothed) - a blue line on the price chart. Murray levels - multi-colored horizontal stripes. Heiken Ashi is an indicator that colors bars in blue or purple. Possible price movements: Red and green arrows. The material has been provided by InstaForex Company - www.instaforex.com |
| Forecast for AUD/USD on February 12, 2020 Posted: 11 Feb 2020 07:22 PM PST AUD/USD On Monday and Tuesday, the Australian dollar worked out our previously assumed correction range of 0.6713/37 and then it stopped waiting for further market signals. These signals will come from foreign markets, since the aussie did not react to the consumer confidence index for February, the index showed an increase of 2.3% against -1.8% in January. The next event, minutes from the last meeting of the RBA, will be published on the 18th. Foreign markets also have a three-day lull - commodities are in a small and short range, the dollar index fluctuates in Monday's range. Today's RBNZ meeting was also calm, no changes have occurred. The Australian dollar retains the potential for continued correctional growth to the level of 0.6780, to the area of convergence of the downward price channel line and the Fibonacci level of 138.2%. The level also corresponds to the peak of January 29th. The convergence on the Marlin oscillator is not great, but can still continue to operate. A price reversal from the achieved level of 161.8% is also possible. The signal for the development of such a scenario will be to consolidate price under the MACD line on a four-hour chart, below 0.6700. Continued growth is possible if the price is consolidated above yesterday's high. The material has been provided by InstaForex Company - www.instaforex.com |
| Forecast for EUR/USD on February 12, 2020 Posted: 11 Feb 2020 07:04 PM PST EUR/USD After a continuous six-day fall in the euro, yesterday I decided to take a break in the indicated consolidation range of 1.0880-1.0925. Today, the decline may continue since data on the industrial production of the euro area for December is published, the forecast is -1.8%. After the collapse of the Italian industrial production, which was shown on Monday (-2.7% m/m against the forecast of -0.5%), we are waiting for today's worse than expected European index. The purpose of pulling down the euro to 1.0880 is the October 1 low. The second target is the Fibonacci level of 161.8% at the price of 1.0840. This is the main scenario. The scenario with the continuation of the correction has a probability of 35%. Here, when prices are consolidated above yesterday's high, it is possible to grow to the Fibonacci level of 110.0% at the price of 1.0970. On a four-hour chart, the price is staying in the 1.0880-1.0925 range, making it possible for the Marlin oscillator to discharge before a new wave of decline. A short-term price exit above the upper limit of this range is possible. At this price scale, the alternative scenario looks more distinct with growth - the MACD line and a correction of 38.2% of the decline branch from January 31 converge at this level. The material has been provided by InstaForex Company - www.instaforex.com |
| Forecast for GBP/USD on February 12, 2020 Posted: 11 Feb 2020 07:02 PM PST GBP/USD Yesterday, quite good economic indicators came out in Great Britain and the pound sterling grew by 36 points. GDP for the quarter showed the expected 0.0%, but there was an increase of 0.3% in December. On an annualized basis, GDP was 1.1% against expectations of 0.8%. The trade balance increased from -4.9 billion pounds to 0.85 billion against a pessimistic forecast of -10.0 billion pounds. The trade balance is noteworthy in that it is the first case of a surplus in 35 years. Industrial production turned out worse than expected, which is not surprising in the general European recession: total Industrial Production in December added 0.1% against the expected 0.3%, year-on-year decline of -1.8% against the expected -0.8%. Until the end of the week, the main role will now be played by the US CPI statistics on Thursday (forecast for January 0.2%) and Friday's data on industrial production and retail sales. On the daily chart, the price is testing the resistance of the Fibonacci level of 161.8%. The general trend in the indicators is downward. The target is the Fibonacci level of 138.2% at the price of 1.2820. On a four-hour chart, the price may still be noted on the resistance of the MACD line (1.2982). The signal line of the Marlin oscillator slows down in growth. A trend reversal is likely. The material has been provided by InstaForex Company - www.instaforex.com |
| Fractal analysis of the main currency pairs for February 12 Posted: 11 Feb 2020 06:53 PM PST Forecast for February 12: Analytical review of currency pairs on the scale of H1:
For the euro / dollar pair, the key levels on the H1 scale are: 1.0969, 1.0938, 1.0922, 1.0902, 1.0888 and 1.0864. Here, we are following the development of the descending structure of January 31. Short-term downward movement is expected in the range 1.0903 - 1.0888. The breakdown of the last value will lead to a movement to a potential level of 1.0864. Upon reaching which, we expect a pullback to the top. Short-term upward movement is possibly in the range 1.0922 - 1.0938. The breakdown of the last value will lead to an in-depth correction. Here, the target is 1.0969. This level is a key support for the downward structure. The main trend is the descending structure of January 31 Trading recommendations: Buy: 1.0922 Take profit: 1.0936 Buy: 1.0940 Take profit: 1.0967 Sell: 1.0902 Take profit: 1.0889 Sell: 1.0886 Take profit: 1.0866
For the pound / dollar pair, the key levels on the H1 scale are: 1.3070, 1.3013, 1.2970, 1.2932, 1.2889, 1.2847 and 1.2754. Here, we are following the development of the descending structure of January 31. Short-term downward movement is expected in the range of 1.2889 - 1.2847. The breakdown of the last value should be accompanied by a pronounced movement to the bottom. In this case, the potential target is 1.2754. We expect consolidation, as well as a pullback to the top near this level. Short-term upward movement is possibly in the range of 1.2970 - 1.3013. The breakdown of the latter value will lead to an in-depth correction. Here, the target is 1.3070. This level is a key support for the downward structure. The main trend is the descending structure of January 31 Trading recommendations: Buy: 1.2970 Take profit: 1.3011 Buy: 1.3015 Take profit: 1.3070 Sell: 1.2889 Take profit: 1.2848 Sell: 1.2845 Take profit: 1.2756
For the dollar / franc pair, the key levels on the H1 scale are: 0.9858, 0.9826, 0.9810, 0.9781, 0.9759, 0.9744 and 0.9719. Here, we are following the development of the ascending structure of January 31. The continuation of the movement to the top is expected after the breakdown of the level of 0.9781. In this case, the target is 0.9810. Price consolidation is in the range of 0.9810 - 0.9826. For the potential value for the top, we consider the level of 0.9858. We expect a pullback to the bottom upon reaching this level. Short-term downward movement is possibly in the range of 0.9759 - 0.9744. The breakdown of the latter value will lead to an in-depth correction. Here, the target is 0.9719. This level is a key support for the upward structure. The main trend is the upward cycle of January 31 Trading recommendations: Buy : 0.9782 Take profit: 0.9810 Buy : 0.9826 Take profit: 0.9858 Sell: 0.9759 Take profit: 0.9745 Sell: 0.9742 Take profit: 0.9720
For the dollar / yen pair, the key levels on the scale are : 110.80, 110.47, 109.99, 109.62, 109.41 and 109.07. Here, we are following the development of the ascending structure of January 31. The continuation of the movement to the top is expected after the breakdown of the level of 110.00. In this case, the target is 110.47. Price consolidation is near this level. For the potential value for the top, we consider the level 110.80. Upon reaching which, we expect a pullback to the bottom. Short-term downward movement is possibly in the range of 109.62 - 109.41. The breakdown of the last value will lead to an in-depth correction. Here, the goal is 109.07. This level is a key support for the top. Main trend: upward structure of January 31 Trading recommendations: Buy: 110.00 Take profit: 110.45 Buy : 110.49 Take profit: 110.80 Sell: 109.60 Take profit: 109.42 Sell: 109.38 Take profit: 109.10
For the Canadian dollar / US dollar pair, the key levels on the H1 scale are: 1.3389, 1.3337, 1.3312, 1.3271, 1.3240 and 1.3195. Here, we are following the development of the upward cycle of January 22. Short-term upward movement is expected in the range of 1.3312 - 1.3337. Hence, there is a high probability of a turn to the bottom. For the potential value for the top, we consider the level of 1.3389. We expect movement to this level after the breakdown of the level of 1.3337. Short-term downward movement is possibly in the range of 1.3271 - 1.3240. The breakdown of the last value will lead to an in-depth correction. Here, the target is 1.3195. This level is a key support for the top. The main trend is the local ascending structure of January 22 Trading recommendations: Buy: 1.3313 Take profit: 1.3335 Buy : 1.3337 Take profit: 1.3387 Sell: 1.3370 Take profit: 1.3242 Sell: 1.3238 Take profit: 1.3195
For the Australian dollar / US dollar pair, the key levels on the H1 scale are : 0.6731, 0.6707, 0.6688, 0.6654, 0.6618, 0.6574, 0.6545 and 0.6505. Here, we are following the formation of the descending structure of February 5. The continuation of movement to the bottom is expected after the breakdown of the level of 0.6654. In this case, the target is 0.6618. Price consolidation is near this level. The breakdown of the level of 0.6618 will lead to the development of pronounced movement. Here, the target is 0.6574. Short-term downward movement, as well as consolidation is in the range of 0.6574 - 0.6545. For the potential value for the bottom, we consider the level of 0.6505. Upon reaching which, we expect a pullback to the top. Short-term upward movement is possibly in the range of 0.6688 - 0.6707. The breakdown of the latter value will lead to an in-depth correction. Here, the target is 0.6731. This level is a key support for the downward structure. The main trend is the descending structure of February 5 Trading recommendations: Buy: 0.6708 Take profit: 0.6730 Buy: 0.6733 Take profit: 0.6772 Sell : 0.6654 Take profit : 0.6620 Sell: 0.6616 Take profit: 0.6576
For the euro / yen pair, the key levels on the H1 scale are: 120.72, 120.45, 120.21, 119.91, 119.75, 119.38 and 119.12. Here, we are following the formation of the descending structure of February 5. The continuation of movement to the bottom is expected after the price passes the noise range 119.91 - 119.75. In this case, the target is 119.38. For the potential value for the bottom, we consider the level of 119.12. Upon reaching this value, we expect consolidation, as well as a rollback to the top. Short-term downward movement is possibly in the range of 120.21 - 120.45. The breakdown of the last value will lead to an in-depth correction. Here, the goal is 120.72. This level is a key support for the downward structure. The main trend is the descending structure of February 5 Trading recommendations: Buy: 120.21 Take profit: 120.43 Buy: 120.47 Take profit: 120.70 Sell: 119.75 Take profit: 119.40 Sell: 119.36 Take profit: 119.12
For the pound / yen pair, the key levels on the H1 scale are : 142.42, 141.87, 140.97, 140.62, 140.10 and 139.81. Here, we are following the development of the descending structure of February 5. Short-term downward movement is expected in the range of 140.97 - 140.62. The breakdown of the last value should be accompanied by a pronounced downward movement. Here, the target is 140.10. For the potential value for the bottom, we consider the level of 139.81. Upon reaching which, we expect consolidation, as well as a rollback to the top. Short-term upward movement is possibly in the range of 141.87 - 142.42. The breakdown of the latter value will lead to the formation of initial conditions for the upward cycle. In this case, the potential target is 143.26. The main trend is the descending structure of February 5, the correction stage Trading recommendations: Buy: 141.90 Take profit: 142.40 Buy: 142.45 Take profit: 143.20 Sell: 140.95 Take profit: 140.65 Sell: 140.58 Take profit: 140.10 The material has been provided by InstaForex Company - www.instaforex.com |
| Posted: 11 Feb 2020 03:31 PM PST Minuette (H4) Let's consider what will happen to commodity currency instruments from February 12, 2020. So, here's a comprehensive analysis of the development options for the movement #USDX vs AUD / USD vs USD / CAD vs NZD / USD. ____________________ US dollar index The movement of the #USDX dollar index from February 12, 2020 will be determined by developing and the direction of breakdown of the boundaries of the equilibrium zone (98.63 - 98.83 - 99.05) of the Minuette operational scale forks. We look at the movement markings inside this zone on the animated chart. In case of breakdown of the lower boundary of ISL61.8 (support level of 98.63) of the equilibrium zone of the Minuette operational scale forks, it will lead to the development of the downward movement of the dollar index and be directed to the boundaries of the equilibrium zone (98.20 - 97.92 - 97.64) of the Minuette operational scale forks. On the contrary, If the upper boundary of ISL61.8 (resistance level of 98.40) of the equilibrium zone of the Minuette operational scale forks and the final line FSL (resistance level of 99.12) of the Minuette operational scale forks are broken down, the upward movement #USDX can continue to the warning line UWL38.2 (99.60) of the Minuette operational scale forks and FSL Minuette end line (99.75). The markup of #USDX movement options from February 12, 2020 is shown on the animated chart. ____________________ Australian dollar vs US dollar The development and direction of the breakdown of the boundaries of 1/2 Median Line channel (0.6699 - 0.6715 - 0.6731) of the Minuette operational scale forks will determine the development of the movement of the Australian dollar AUD / USD from February 12, 2020. The marking the development of the above levels are shown on the animated chart. The breakdown of the upper boundary of the 1/2 Median Line Minuette channel - resistance level of 0.6731 will lead to the Australian dollar reaching the equilibrium zone (0.6739 - 0.6764 - 0.6787) of the Minuette operational scale forks with the prospect of further development of the AUD / USD movement in the 1/2 Median Line channel (0.6780 - 0.6830 - 0.9875) of the Minuette operational scale forks. A sequential breakdown of the lower boundary of the 1/2 Median Line channel of the Minuette operational scale forks - support level of 0.6699 and the 1/2 Median Line Minuette 0.6690 will determine the continuation of the development of the downward movement of the Australian dollar towards the goals: - the initial SSL Minuette line (0.6655); - control line LTL Minuette (0.6644); - lower boundary ISL61.8 (0.6625) equilibrium zone of the Minuette operational scale forks; with the prospect of reaching warning lines - LWL38.2 (0.6615) and LWL61.8 (0.6590) of the Minuette operational scale forks. We look at the layout of the AUD / USD movement options from February 12, 2020 on the animated chart. ____________________ US dollar vs Canadian dollar The development of the movement of the Canadian dollar USD / CAD from February 12, 2020 will continue to be determined by developing the boundaries of the equilibrium zone (1.3225 - 1.3276 -1.3333) of the Minuette operational scale forks. We look at the movement markings inside this zone on the animated chart. The breakdown of the lower boundary of ISL38.2 (support level of 1.3225) of the equilibrium zone of the Minuette operational scale forks will continue the development of the downward movement of the Canadian dollar towards the goals: - lower boundary of ISL61.8 (1.3200) equilibrium zones of the Minuette operational scale forks; - final Schiff Line Minuette (1.3185); with the prospect of reaching the final line of the FSL Minuette (1.3115). On the other hand, a combined breakdown of the upper boundary of the ISL61.8 (resistance level of 1.3333) equilibrium zone of the Minuette operational scale forks and the control line UTL Minuette (1.3345) will make the achievement of USD / CAD warning lines - UWL23.6 (1.3365) - UWL38.2 (1.3390) - UWL61.8 (1.3410) and UWL100.0 (1.3455) of the Minuette operational scale forks, relevant. We look at the markup of USD / CAD movement options from February 12, 2020 on the animated chart. ____________________ New Zealand dollar vs US dollar The development of the movement of the New Zealand dollar NZD / USD from February 12, 2020 will depend on the development and direction of the breakdown of the range :
In case of breakdown of the resistance level of 0.6390, the NZD / USD movement will continue in the 1/2 Median Line Minuette channel (0.6390 - 0.6460 - 0.6525), and if the upper boundary (0.6525) of this channel is broken, the price of the instrument will continue to move in the equilibrium zone (0.6525 - 0.6575 - 0.6622) of the Minuette operational scale forks. Alternatively, in case that the breakdown of the support level of 0.6420 takes place on the control line of the LTL of the Minuette operational scale forks, then it will be relevant to reach the New Zealand dollar reaching the boundaries of the equilibrium zone (0.6350 - 0.6255 - 0.6155) of the Minuette operational scale forks. We look at the layout of the NZD / USD movement options from February 12, 2020 on the animated chart. The review is made without taking into account the news background. Thus, the opening of trading sessions of major financial centers does not serve as a guide to action (placing orders "sell" or "buy"). The formula for calculating the dollar index: USDX = 50.14348112 * USDEUR0.576 * USDJPY0.136 * USDGBP0.119 * USDCAD0.091 * USDSEK0.042 * USDCHF0.036. where the power coefficients correspond to the weights of the currencies in the basket: Euro - 57.6%; Yen - 13.6%; Pound Sterling - 11.9%; Canadian dollar - 9.1%; Swedish krona - 4.2%; Swiss franc - 3.6%. The first coefficient in the formula leads the index to 100 at the starting date - March 1973, when the main currencies began to be freely quoted relative to each other. The material has been provided by InstaForex Company - www.instaforex.com |
| Posted: 11 Feb 2020 02:47 PM PST 4-hour timeframe Amplitude of the last 5 days (high-low): 106p - 114p - 79p - 80p - 74p. Average volatility over the past 5 days: 91p (average). Tuesday, February 11, was supposed to be crucial for the British pound. Firstly, several important macroeconomic reports from the UK were planned for this day, and secondly, no data from the UK of an economic nature will be received by the end of the week. It should be noted that the pound has not resumed falling today, as many expected, but it has not risen too much either. By and large, the upward correction just continued and the price currently worked out the Kijun-sen line, from which it can rebound and resume moving down. Thus, in fact, no particularly strong reaction of traders to extremely important macroeconomic information has been followed today. Now the pound/dollar pair will try to overcome the critical line, and only in the event of a successful attempt to overcome the bulls can we expect the British currency to continue strengthening. The most significant publication of today, of course, was the publication of the Gross Domestic Product. Moreover, four variations of this indicator were published immediately. For example, the first indicator of GDP (monthly change) was +0.3% in December with a forecast of +0.2%. The NIESR growth rate estimate has not yet been published at the moment, and the other two indicators, in quarterly and annual terms, bearing preliminary values for the fourth quarter, can be called more optimistic than expected. In annual terms, GDP growth amounted to +1.1% against the forecast of +0.8%. It is small, but better than it could be. In quarterly terms, the increase was 0% with a similar forecast. Thus, in general, we can say that the values were higher than the forecasts of experts, but, in fact, they do not really change the picture of things. Firstly, the GDP indicator has not changed compared to the previous period, an increase of +1.1% was also recorded in the third quarter. Secondly, the absence of another fall is not a positive factor. Thus, today's strengthening of the pound can really be considered just a continuation of the correction. But the second indicator, no less significant than the first, industrial production for December showed a decrease of 1.8% y/y with forecasts of -0.8% y/y, and in monthly terms - an increase of +0.1% in the forecast + 0.3%. Thus, this figure was much worse than expectations of traders, but did not cause new sales of the British currency. You can also note a more secondary indicator such as production in the manufacturing industry, which fell in December by 2.5% instead of the expected fall of 1%. In general, despite a more or less positive GDP, we believe that the next package of macroeconomic information from Britain turned out to be weak. Thus, we expect the pound/dollar pair to resume falling, especially if today quotes rebound from the critical line Kijun-sen. It is also worth noting that perhaps a slight strengthening of the pound was provoked by Jerome Powell's speech. However, as we mentioned in the EUR/USD review, Powell did not disclose anything to the markets. His rhetoric was fully predictable and expected by traders. Today, a statement by the Chairman of the Bank of England Mark Carney in the Parliament of Great Britain is still planned. This statement could potentially be even more interesting than the statements made by Powell and Lagarde together, since the huge amount of speculation that went around the last meeting of the regulator ended with the BA leaving the key rate unchanged, and the number of members of the monetary committee who voted "for" it to decline not changed. Today, Mark Carney, who mentioned the recovery of Great Britain's economy last month, may make more resonant statements with respect to those that we heard at the end of January. Any hints of the need to soften monetary policy, the growing risks for the economy may result in new sales of the British currency. Although without such hints, it is clear that all the prospects for the British economy are now reduced to new reductions and decelerations. From a technical point of view, corrective movement continues, and the further direction of movement will depend on overcoming or not overcoming the Kijun-sen line. Thus, traders are now advised to carefully monitor the behavior of prices near this line, remembering that the "dead cross" remains relevant. Trading recommendations: GBP/USD continues to adjust against the dead cross. Thus, selling the British pound with the target support level of 1.2772 is still relevant, but after the completion of the current correction, which can be determined by the rebound from the Kijun-sen line or by turning the MACD indicator down. Purchases of a pair by small lots can be considered if the price overcomes the Kijun-sen line with the first goal of the Senkou Span B. line Explanation of the illustration: Ichimoku indicator: Tenkan-sen is the red line. Kijun-sen is the blue line. Senkou Span A - light brown dotted line. Senkou Span B - light purple dashed line. Chikou Span - green line. Bollinger Bands Indicator: 3 yellow lines. MACD indicator: Red line and bar graph with white bars in the indicators window. Support / Resistance Classic Levels: Red and gray dashed lines with price symbols. Pivot Level: Yellow solid line. Volatility Support / Resistance Levels: Gray dotted lines without price designations. Possible price movements: Red and green arrows. The material has been provided by InstaForex Company - www.instaforex.com |
| Posted: 11 Feb 2020 02:47 PM PST 4-hour timeframe Amplitude of the last 5 days (high-low): 54p - 50p - 43p - 43p - 49p. Average volatility over the past 5 days: 46p (average). The EUR/USD currency pair perfectly worked out the support level of 1.0893 on Tuesday, February 11 and rebounded from it, failing to gain a foothold below. Thus, the long-awaited correction could begin today, which we were waiting for on Friday and Monday. This is not to say that today the correction was expected, and the fundamental background contributed to its beginning, since the only important events that are planned at the moment are speeches of the ECB President Christine Lagarde in the European Parliament and Jerome Powell in Congress . Moreover, Lagarde's speech has not even begun. Not a single significant macroeconomic publication has been planned for today in either the United States or the European Union. Recently, we regularly focus traders on weak industrial production. This applies to the European Union and the United States. We also noted that Fed Chairman Jerome Powell stubbornly does not want to address in his speeches the subject of a drop in GDP growth rates and a reduction in industrial production. However, speaking to Congress, Powell could not ignore these topics. True, he illuminated them quite superficially. According to Powell, who spoke today to the House Financial Committee, the US economy is in excellent condition. The expansion has been going on for 11 years, which is a record for the country. Powell noted that in 2019, the economy staunchly confronted all global risks. Thus, according to the Fed chief, lowering the key rate in the near future is not required. The Fed chairman notes the stabilized global economic growth, as well as lowering trade uncertainties. However, Powell notes the seriousness of the spread of the "coronavirus." As we said in previous reviews, the coronavirus can cause a slowdown in the Chinese economy, which is closely linked with the US economy and many other economies. This is precisely the opinion held by Powell himself, believing that a pandemic is a dangerous factor for the global economy. In addition, the Fed chairman noted the good condition of the labor market, higher rates of the number of created jobs than expected. However, according to Powell, some problems in the labor market are still present, such as inequality between different racial and ethnic groups. But regarding productivity, Powell said that "it remained at a low level." Thus, according to Powell, the search for options to increase productivity should remain a national priority. In the second half of 2019, weak exports and investments, as well as industrial production, were noted due to uncertainty with trading partners. Powell also notes that inflation is not high enough in 2019 and hopes that it will approach the target of 2.0% in the coming months (we are talking about the consumer spending index for personal consumption). What conclusions can be drawn from Powell? Firstly, he did not surprise traders by delivering exactly the speech that they expected to hear from him. Secondly, tomorrow during the second speech to Congress, most likely, the rhetoric and content of Powell's speech will not change, respectively, and on February 12 you should not expect any market reaction to this event. Thirdly, Powell believes that the spread of the pneumonia virus in China can have a serious negative impact on the global economy, and the Fed itself is not going to interfere in monetary policy. From this we can also conclude that the Fed is satisfied with the current levels of GDP and industrial production, at least the regulator does not see anything dangerous for them in the economy. Powell also noted that the Fed will not go to change the key rate, only if key macroeconomic indicators begin to decline. Thus, in the near future you should not expect any action from the Fed. Now it remains only to wait for Lagarde's speech and ensure that her rhetoric will not differ from the expectations of the markets. The main thing is that there are no new ones among Lagarde's theses that reflect more serious concerns about the prospects for the EU economy. Any new tension may again lead to selling the euro. From a technical point of view, one cannot even say that the correction has begun. The pair rebounded from 1.0893, but a strong departure of quotations to the top has not yet occurred. The MACD indicator, however, has already turned up, reacting to a banal price drop. That is, the indicator has now begun to discharge. Trading recommendations: EUR/USD continues to move down. Thus, it is now recommended that you keep selling the euro while aiming for a support level of 1.0893. A price rebound from this level allows you to close sell positions. You can hold shorts with the target of 1.0864. It will be possible to consider purchases of the euro/dollar pair in small lots with the goal of the Senkou Span B line, if traders manage to gain a foothold above the Kijun-sen line, which is not expected in the near future. Explanation of the illustration: Ichimoku indicator: Tenkan-sen is the red line. Kijun-sen is the blue line. Senkou Span A - light brown dotted line. Senkou Span B - light purple dashed line. Chikou Span - green line. Bollinger Bands Indicator: 3 yellow lines. MACD indicator: Red line and bar graph with white bars in the indicators window. Support / Resistance Classic Levels: Red and gray dashed lines with price symbols. Pivot Level: Yellow solid line. Volatility Support / Resistance Levels: Gray dotted lines without price designations. Possible price movements: Red and green arrows. The material has been provided by InstaForex Company - www.instaforex.com |
| GBPUSD: pound and UK in for good times, just needs to wait. UK GDP report encourages investors Posted: 11 Feb 2020 02:47 PM PST A positive report failed to come out, which indicated that the British economy was able to maintain growth at the end of 2019, despite a decline in a number of sectors and a decline in investment, many skeptics immediately recalled the consequences of Brexit and the uncertainty surrounding the EU-UK trade deal . It is worth noting that, despite all the negativity, in December 2019 the UK's GDP was much higher than the growth of the economy of the same Germany or France. The start of 2020 promises to be even better. Of course, it is still too early to say that the UK has coped with the consequences of a reduction in industrial production and the technical recession, from which the economy has fought back throughout the past year. However, the trade conflict between the US and China is partially resolved, as is the situation with Brexit, which will clearly benefit companies and households. According to today's data from the UK National Bureau of Statistics, in 2019, GDP grew by 1.1% per annum after rising by 1.3% in 2018. The data turned out to be higher than forecasts of economists who expected GDP in 2019 by 0.8%. In the fourth quarter, compared with the third quarter, the UK GDP growth was at zero level, which fully coincided with the forecasts of economists, but grew by 0.3% in December compared with November, when there was a decline of 0.3%. All emphasis is shifted to the results of negotiations between London and Brussels, which will begin in March this year. The parties will have to work hard to find a common language and make some compromises, agreeing on the conditions for future economic cooperation. British Prime Minister Boris Johnson aims to conclude a free trade deal with the EU until December 31, 2020, although many are skeptical about this. However, given the reduction in the uncertainty of political prospects, after the election results in December 2019, the UK economy will gradually gain strength and will demonstrate recovery in the 1st quarter of 2020. Of the other data that came out today in the UK, we should pay attention to the positive balance of foreign trade in goods, which amounted to 845 billion pounds in December 2019, while with countries outside the EU, the balance was only at 6.7 billion pounds. As for industrial production, it grew by 0.1% in December compared with November, but decreased by 1.8% year-on-year. Economists had forecast a larger growth of 0.7%. Production in the UK manufacturing industry increased by 0.3% in December and fell by 2.5% compared to December 2018. As I noted above, the reduction in investment by British companies in the fourth quarter continued. The indicator itself fell 1.0% in the fourth quarter compared to the third, but rose 0.9% year-on-year. The technical picture of the GBPUSD pair remained unchanged. A break of yesterday's high at 1.2940 will lead to the demolition of a number of stop orders of the bears and a larger restoration of the trading instrument in the area of 1.3000 and 1.3050. The material has been provided by InstaForex Company - www.instaforex.com |
| Evening review 02/11/2020 EURUSD. Strong correction for the euro is possible Posted: 11 Feb 2020 02:47 PM PST The Fed chief will make a report to Congress in the evening of February 11. You should not expect tough statements from the Fed chief - he will act on the principle of "do no harm" - everything is fine in the US economy, the dollar is strong - and there is no point in further strengthening the dollar's growth. Rather, it would be beneficial for the Fed to slightly pull down the dollar. EURUSD: The euro is at long lows and looks ready to try to break out 1.0880. However, one must be careful: the indicators on the day and H4 show a strong "oversold" - this requires some "unloading" of indicators: A strong bounce is possible upwards - up to 1.0960 or higher. We keep selling from 1.0990. Possible sales from 1.0960. The material has been provided by InstaForex Company - www.instaforex.com |
| Posted: 11 Feb 2020 02:47 PM PST The EUR/USD pair plunged to its lowest level in the last four months. It has become increasingly difficult for the euro to resist the strengthening of the greenback, which enjoys the support of its own defensive properties and strong statistics from the United States. Meanwhile, the eurozone's prospects are beginning to deteriorate. The December releases for German industrial production and retail sales in the eurozone, published last week, were disappointing, and these figures do not even reflect the effects of coronavirus. Data on GDP in Germany and the eurozone for the fourth quarter will be released this week. If none of these reports is positive, then EUR/USD could easily fall below the September low of 1.0879. Investors fear that the European Union will suffer greatly from the slowdown in China's economic growth and the British exit from the bloc. Recessions have so far been avoided, but Germany's largest industry decline over the past decade has heightened the likelihood that the ECB will have to take additional measures or convince national governments to provide budgetary incentives. Investors are also worried that the spread of coronavirus will affect the prospects for the global economy. "Since global growth is now under attack, the euro will suffer doubly: both from the weakness of the eurozone economy and the use of the single currency to finance carry trade operations due to low interest rates in the EU," TD Securities said. Many are now interested in the question of how much more the euro could fall. Anxiety and fear can be powerful drivers of foreign exchange flows. Obviously, the US economy is less vulnerable to coronavirus than the European one, and if the former weakened, it would have come from a higher base. This week, Federal Reserve Chairman Jerome Powell will address the US Congress with a semi-annual report on monetary policy. The coronavirus epidemic and concerns about its consequences for the global economy have forced traders to increase the number of possible interest rate cuts to two this year, but over the past few days, expectations of a second easing have been dispelled. After the Fed meeting in January, at which the regulator left the interest rate unchanged, Powell assured that the regulator was monitoring the situation with the new virus and called the current monetary policy optimal. Let's see if his position has changed. If the Fed chief maintains a positive outlook and does not focus on the impact of the epidemic, the dollar may strengthen even more, pushing EUR/USD to 1.08. However, if Powell notes the presence of significant risks for the US economy and increases the likelihood of easing the Fed's monetary policy, then EUR/USD will soar, despite the gloomy prospects of the eurozone. Meanwhile, the pound continues to suffer losses due to concerns about the future of British trade after Brexit. The British currency sank to 2.5-month lows in the region of 1.2870 against the US dollar. However, the GBP/USD pair recovered quite quickly, retreating from the 100-day moving average, and noted local highs near 1.2935. This week, the UK is publishing a large block of macro statistics, including fourth quarter GDP and industrial production for December. However, these data are likely to have a relatively small impact on the pound, as they cover periods prior to early MP elections. Apparently, traders will prefer to wait for a clean breakout with the GBP/USD pair below the 100-day moving average (near 1.2895) and only then will they bet on a further decline. In this case, the pair may rush in the direction of support 1.2830 and further to the level of 1.2800. The nearest strong resistance is located at 1.2950. Above is the 1.30 mark - broken support for the short-term upward trend. Further growth may stall around 1.3025. The material has been provided by InstaForex Company - www.instaforex.com |
| February 11, 2020 : GBP/USD Intraday technical analysis and trade recommendations. Posted: 11 Feb 2020 08:05 AM PST
On December 13, the GBPUSD pair looked overpriced around the price levels of 1.3500 while exceeding the upper limit of the newly-established bullish channel. On the period between December 18th - 23rd, bearish breakout below the depicted channel followed by temporary bearish closure below 1.3000 were demonstrated on the H4 chart. However, immediate bullish recovery (around 1.2900) brought the pair back above 1.3000. Bullish breakout above 1.3000 allowed the mentioned Intraday bullish pullback to pursue towards 1.3250 (the backside of the broken channel) where bearish rejection and a new wide-ranged movement channel were established between (1.3200-1.2980). Moreover, new descending highs were recently demonstrated around 1.3200 and 1.3080. During the past few days, signs of bullish rejection were temporarily manifested around 1.2980-1.3000 before obvious bearish breakdown could occur. Intraday technical outlook is supposed to remain bearish as long as the pair maintains its movement below 1.3080 (the most recently-established descending high). Conservative traders were advised to wait for bearish breakdown below 1.2980 as a signal for further bearish decline towards 1.2890 and possibly 1.2780. In the Meanwhile, Intraday traders were advised to watch price action carefully around 1.2890 where the lower limit of the movement channel comes to meet the pair. Since Yesterday, early signs of bullish rejection have been expressed allowing another bullish pullback to occur towards 1.3000 where price action should be watched carefully. On the other hand, any bearish decline towards the next key-level (around 1.2780) should be watched for bullish rejection and a valid BUY entry. The material has been provided by InstaForex Company - www.instaforex.com |
| February 11, 2020 : EUR/USD Intraday technical analysis and trade recommendations. Posted: 11 Feb 2020 07:05 AM PST
On December 30, a bearish ABC reversal pattern was initiated around 1.1235 (Previous Key-zone) just before another bearish movement could take place towards 1.1100 (In the meanwhile, the EURUSD pair has lost much of its bearish momentum). One more bullish pullback was executed towards 1.1175 where the depicted key-zone as well as the recently-broken uptrend were located. Evident signs of bearish rejection were demonstrated around 1.1175. That's why, quick bearish decline was executed towards 1.1100 then 1.1035 which failed to provide enough bullish SUPPORT for the EURUSD pair. Further bearish decline took place towards 1.1000 where the pair looked quite oversold around the lower limit of the depicted bearish channel. Hence, significant bullish rejection was able to push the pair back towards the nearest SUPPLY levels around 1.1080-1.1100 where a confluence of supply levels (including the upper limit of the channel) were located. Since then, the pair has been trending within the depicted bearish channel. Hence, further bearish decline was expected towards 1.0950 where (Fibonacci Expansion level 78.6%) and the lower limit of the channel are located. Bearish closure below 1.0950 allowed another bearish decline to occur towards the next key-level 1.0910 (Fibonacci Expansion level 100%). Intraday traders are advised to look for signs of bullish recovery around the price level of (1.0910) as a valid intraday BUY signal. Overall, The intermediate technical outlook remains bearish as long as bearish persistence below 1.1000 is maintained on the H4 chart. However, the EUR/USD pair looks quite overpriced after such a long bearish decline and if the current bullish recovery is maintained above 1.0910, further bullish advancement would be expected towards 1.0950 and probably higher (around 1.0990) if enough bullish momentum is expressed above 1.0950. On the other hand, any bearish breakout below 1.0880 invalidates the previous short-term bullish scenario. The material has been provided by InstaForex Company - www.instaforex.com |
| Posted: 11 Feb 2020 06:14 AM PST To open long positions on GBPUSD, you need: In the first half of the day, nothing changed for the pound, and buyers took advantage of a good report on the growth of the UK economy for the 4th quarter of 2019 and returned the pair to the resistance area of 1.2942, around which the main trade is currently being conducted. The bulls also achieved the formation of a false breakdown in the support area of 1.2906, which has now transformed into the area of 1.2895 and serves as the lower border of the new ascending channel, which I also described in detail in my morning forecast. A break above the resistance of 1.2942 in the second half of the day will lead to the continued growth of GBP/USD in the area of the highs of 1.2976 and 1.3007, where I recommend taking the profits. But do not forget that the North American session will feature a speech by the head of the Bank of England, Mark Carney, who may touch on the topic of interest rates. The return and breakthrough of the support of 1.2895 will cancel all buyers' plans to restore the pair. In this scenario, it is best to consider new long positions after an unsuccessful consolidation below 1.2870 or buy the pound immediately on a rebound from the minimum of 1.2830. To open short positions on GBPUSD, you need: Sellers will rely on hints from the Bank of England in the direction of easing monetary policy, which will weaken the position of the British pound. A break and consolidation below the level of 1.2895 will increase the pressure on the pair, which will lead to a sharp movement of the pound down to the support area of 1.2870, on which the further direction will depend. A break in this area will cause a larger drop in GBP/USD to the area of the lows of 1.2830 and 1.2799, where I recommend taking the profits. In the scenario of the pair's growth, you can look at short positions only after a false breakdown in the resistance area of 1.2942, but I recommend selling the pound immediately for a rebound only after testing the highs of 1.2976 and 1.3007. Signals of indicators: Moving averages Trading is conducted above the 30 and 50 daily averages, which indicates the likely formation of an upward correction of the pound. Bollinger Bands The lower border of the indicator has fulfilled its role of support today and now the bulls are aimed at breaking the upper border of the indicator in the area of 1.2942.
Description of indicators
|
| EUR/USD: plan for the US session on February 11. The bears are trying to break the level of 1.0905 Posted: 11 Feb 2020 06:14 AM PST To open long positions on EURUSD, you need: From a technical point of view, nothing changed in the first half of the day, except for the bears' attempt to break the support level of 1.0907, which I paid attention to in my morning forecast. The task of buyers is to form a false breakdown in the area of 1.0907, which will be a signal to open long positions. However, the more important goal is to break through and consolidate above the resistance of 1.0975. Only such a scenario will allow you to see a new major upward correction in the area of the highs of 1.1002 and 1.1022, where I recommend fixing the profits. If we gain a foothold in the second half of the day below the level of 1.0907, in this case, it is best to postpone new long positions until the test of the larger lows of 1.0878 and 1.0840. Given the speeches of the heads of central banks, including Fed Chairman Jerome Powell, the dollar may receive significant support. However, you should also pay attention to the divergence that is formed on the MACD indicator, which can lead to the end of the downward trend in the short term, allowing EUR/USD to form an upward correction. To open short positions on EURUSD, you need: Bears are trying to break below the support of 1.0907, however, the volume that is marked when this level is broken indicates more about the closing of short positions by large players than about the recruitment of new ones. Be very careful with sales below 1.0907, especially after the speech of the head of the Fed, Jerome Powell, as any return to this level can lead to a sharp upward correction. If the pressure on the euro continues in the second half of the day, the nearest target for sellers will be the minimum of 1.0878, as well as the support area of 1.0840, where I recommend fixing the profits. If EUR/USD rises above 1.0907 in the second half of the day, it is best to look at short positions after updating the maximum of 1.0936, on a false breakdown or sell the euro immediately on a rebound from the maximum of 1.0975. Signals of indicators: Moving averages Trading is conducted below the 30 and 50 moving averages, which indicates a predominance of sellers. Bollinger Bands Volatility has decreased, which does not give signals to enter the market.
Description of indicators
|
| Technical analysis for USD/CHF on February 11, 2020 Posted: 11 Feb 2020 06:14 AM PST Hello! The strengthening of the US dollar across the entire spectrum of the market at the auction on February 3-7 did not bypass the dollar/franc currency pair. In this article, all attention will be focused on the technical picture that is observed for this currency pair. We will consider as many USD/CHF charts as possible and, if we find interesting and technically sound options for opening trading positions, we will outline a trading plan for this currency pair. Weekly
Since the last week recently closed, and the current one is at its beginning, I will start the analysis with a weekly timeframe. It is immediately evident that the pair did not reach the previous lows last week and turned to strengthen, which turned out to be more than impressive. Another point worth paying attention to is the support area near 0.9611. Precisely, before reaching this level, there was a reversal in the north direction. At the moment of writing this article, the market for USD/CHF is resting. There is no movement or body of the candle at the moment of writing. I think we will soon find out that this is a consolidation before continuing the recovery or waiting for the speech of the Chairman of the Federal Reserve System (FRS) with the semi-annual report on monetary policy. Usually, this event has a noticeable reaction to financial markets. Let's see what happens this time. In my opinion, USD/CHF has reason to continue strengthening after such an impressive bullish candle. If this happens, the nearest targets on the weekly chart will be the 200 exponential moving average and the Kijun line of the Ichimoku indicator, which are right under the strong technical level of 0.9820. In the case of stronger growth, the pair will head to 0.9860 (89 EMA) and 0.9890, where 50 MA and both borders of the Ichimoku cloud are located. If the market chooses a downward scenario, the nearest target will be the Tenkan at 0.9728. The passage of this line may increase the pressure on the pair and open the way towards the past lows at 0.9628. Daily
A candle appeared on the daily chart yesterday, which can be considered a reversal in its essence. We see that attempts to continue growth are limited by the lower border of the Ichimoku indicator cloud, which acts as a strong resistance. Here, the situation is not as clear as on weekly. If the pair is unable to enter the Ichimoku cloud and another reversal candle appears, you should try selling with the nearest target at 0.9750. More distant targets are located in the area of 0.9710-0.9700, where the Tenkan and Kijun lines are located, respectively. If the bulls on the pair still manage to enter the limits of the Ichimoku cloud and gain a foothold in it, on the rollback to its lower border, you can try to buy the dollar/franc with goals at 0.9820-0.9830. However, you should not discount any other exhibitor. In order to gain a foothold within the cloud, you need a true breakdown of the 89 EMA, which will provide serious resistance to growth attempts. H4
At the 4-hour chart, the pair performed a corrective pullback to 38.2 Fibo from a decline of 1.0022-0.9611. What's next? In my opinion, there are two most likely scenarios. Correction to the area of 0.9735-0.9715, where the used moving averages are concentrated. From the selected zone, it is possible to resume growth. If this happens, it is a sin not to buy at such attractive prices. The second scenario is a continuation of the rise from current prices. In this case, I can recommend buying on the breakdown of the resistance of 0.9787, but this is only for those who use the breakdown strategy. For the rest, it is better to wait for the breakdown of the current local resistance at 0.9787, consolidate above this level, and buy on the rollback to it. There are no generated signals for opening short positions at the moment. You need to wait until they appear, and then sell. Good luck! The material has been provided by InstaForex Company - www.instaforex.com |
| Trading recommendations for the GBPUSD currency pair on February 11 Posted: 11 Feb 2020 05:04 AM PST From a comprehensive analysis, we see the formed stagnation after the quote approached the periodic level of 1.2885, and now about the details. Last week was extremely strong in terms of the downward trend, and the number of points passed (319 points) was not as important as the fact of the breakdown of the control levels of 1.3000-1.2900, which represented a break in the existing clock cycles. So, a new week has come, and stagnation comes with it, which reflected not the reverse course but a kind of price-fixing beyond all previously announced control levels. Do not forget that fixing the price at the value of 1.2885 reflects not only the area of autumn 2019 but also the average level of the range of 1.2770//1.2880//1.3000 where the quote came from. It turns out that we have returned to the stage of the range of 17.10.19-03.12.19, where the quote was suspended a period earlier. Thus, it is too early to talk about a full recovery, since only a breakdown of the level of 1.2770 would give the first signal, and a price fix lower than 50% relative to the cured of the entire medium-term upward move (1.1957-1.3513) would confirm this signal. Do not be discouraged, current achievements are worth a lot, together with external factors, and we still have a chance to see something more, on which we will be able to earn a lot. In terms of volatility, we see that the same activity is recorded for three consecutive days, which may signal several factors. So, one of the theories says that a kind of slowdown with characteristically similar activity can signal the confirmation of a breakdown of an important coordinate, where the price is fixed at new values. Another theory suggests the uncertainty of market participants who have not yet managed to believe in the breakdown of the control level. Volatility details: Thursday-131 points; Friday-125 points; Monday-215 points; Tuesday-105 points; Wednesday-112 points; Thursday-79 points; Friday-79 points; Monday-74 points. The average daily indicator relative to the volatility dynamics is 94 points (see the volatility table at the end of the article). Detailing the past day by the minute, we see the initial rebound from the area of 1.2885, just in this course we could see the entire daily activity, 10:30-15:30 (time on the trading terminal). The subsequent fluctuation was in terms of a partial return relative to the rebound, where the day ended with another consolidation. As discussed in the previous review, traders continue to hold short positions that were opened at the time of the break of the control levels. The logic of this retention is clear to me: everyone is waiting for more significant changes. In turn, speculators work on local jumps that appear on the market daily. Looking at the trading chart in general terms (daily period), we see the same price fixation below the control level of 1.3000, where the price moved to the next range of 1.2770//1.2880//1.3000. The news background of the last day did not include statistics on the United Kingdom and the United States. In terms of the general information background, we have a nagging fear of the upcoming negotiations between England and Brussels regarding trade relations. So, during a recent meeting in the European Parliament, a new tone was set for the upcoming negotiations, where members of the European Union believe that the UK should follow strict conditions on unfair competition, fishing, and human rights after the 11-month transition period after Brexit, according to the draft negotiating mandate of the European Union. At the same time, the EU wants to force the UK to continue to comply with EU rules in areas such as state aid, even if the bloc changes them in the future. These plans are tougher than those set out by the European Commission last week, and all these actions could lead to inflaming tensions with London ahead of the talks. "We are not ready to make a deal at any cost. We will defend the interests of the EU," EU chief negotiator Michel Barnier told reporters in Luxembourg on Monday. Today, in terms of the economic calendar, we had macroeconomic data for the UK, which locally supported the pound. So, GDP figures slowed from 1.2% to 1.1% with a forecast of 0.9%, the positive factor in the negative. After that, everyone paid attention to the trade balance, which is full of surplus and amounted to 7.7 billion pounds. Everything is positive since industrial production data show a deep slowdown of -1.8%. In the afternoon, we are waiting for data on vacancies (JOLTS) in the United States, the number of which should grow from 6.8 million to 7.0 million. Further development Analyzing the current trading chart, we see that the overnight consolidation was replaced by a local surge in the activity, which is normal if we also take into account the fact that the statistical data for Britain was published. It is worth noting that the oscillation frame of 1.2872/1.2960 is still standing, which signals that the quote is fixed and is a good sign. If we reduce everything to the fact that the tact has changed, then we fall into the framework of a new tact, which reflects the range of 1.2770//1.2885//1.3000. It turns out that the return of the price to the level of 1.3000 will not change the overall picture of a possible decline in the future. From market participants, we see a temporary restraint, possibly related to the price-fixing process. At the same time, speculative interest is still high. By detailing every minute of the period, we see the same consolidation, relative to which there were local bursts of activity, which did not disrupt the overall dynamics in any way. In turn, traders continue to work on the decline, although they do not exclude the fact that a rebound back to 1.3000 is possible in theory. Those who had excessive risk in positions partially came out at the average level of 1.2885, which was the right move. In terms of the speculative transactions, work on the jumps with the entrance on the market continues to bring profits. Having a general picture of the actions, it is possible to assume that the main focus is on the range of 1.2770/1.3000 as a new tact in development. At the same time, the fluctuation to the lower limit will occur if the price is fixed below 1.2870, and the change in the tact will be considered if the price is fixed below 1.2770, but this will be discussed in the following reviews. Based on the above information, we will output trading recommendations: - Buy positions are considered if the price is fixed higher than 1.2960, with the prospect of a move to 1.2980-1.3000. - Sell positions are already being held by traders towards the level of 1.2770. If we do not have positions, it makes sense to wait for a new move with the price closing lower than 1.2870. Indicator analysis Analyzing different sectors of timeframes (TF), we see that due to the process of fixing the price in the new cycle, the indicators of technical instruments on the minute and hour segments have a variable interest. At the same time, the medium-term period invariably signals sales. Volatility for the week / Volatility Measurement: Month; Quarter; Year. The volatility measurement reflects the average daily fluctuation, based on the calculation for the Month / Quarter / Year. (February 11 was based on the time of publication of the article) The volatility of the current time is 48 points, which is a low value for this period. It is likely to assume that if the fixing process continues, the volatility will remain at the level of the past three days. After the completion of the stage, fixing and moving to the development of a new tact can give the market activity. Key levels Resistance zones: 1.3000; 1.3170**; 1.3300**; 1.3600; 1.3850; 1.4000***; 1.4350**. Support zones: 1.2900*; 1.2885*; 1.2770**; 1.2700*; 1.2620; 1.2580*; 1.2500**; 1.2350**; 1.2205(+/- 10p.)*; 1.2150**; 1.2000***; 1.1700; 1.1475**. * Periodic level ** Range level *** Psychological level **** The article is based on the principle of conducting a transaction, with daily adjustments. The material has been provided by InstaForex Company - www.instaforex.com |
| Posted: 11 Feb 2020 05:04 AM PST EUR/USD On February 10, the EUR/USD pair lost another 35 basis points and thus continues to build the expected downward wave 3 or C. The first wave inside 3 or C turns out to be very long. If waves 3 and 5 are proportional to it, then the entire wave 3 or C will also turn out to be very long. An unsuccessful attempt to break through the 76.4% Fibonacci level can lead to an internal correction of wave 3 or C. The same effect can be achieved if an unsuccessful attempt to break through the 100.0% Fibonacci level. Fundamental component: The news background on Monday was almost absent, which did not prevent the markets from continuing to sell the euro currency. The decline of the euro/dollar instrument is gaining momentum and today may either strengthen or end. The second option is even preferable, based on the current wave markup, which involves building a correction wave. On February 11, the news calendar contains statements by two presidents of the Central Banks, Christine Lagarde and Jerome Powell. Both events are extremely important for the Forex market, and even more so for the euro/dollar instrument. However, for the markets, Lagarde or Powell must report something important, otherwise, the demand will not grow for either the US dollar or the euro currency, and the amplitude will remain the same. You can only expect a "dovish" performance from Christine Lagarde. Inflation, industrial production, GDP, retail sales – all these indicators remain at low values, eloquently showing that the EU economy needs a new stimulus. There are no signs of an acceleration in the European economy, so the ECB should either continue to simply monitor the situation from the outside (which may lead to an even greater drop in the economy) or again intervene with the help of monetary policy instruments. In the case of Jerome Powell, everything is much more optimistic, since the American economy is just showing signs of acceleration, which is undoubtedly good for the dollar. Thus, Powell's speech to Congress can just point out the strength of the US economy, the excellent state of the labor market, wages and employment levels. General conclusions and recommendations: The euro/dollar pair continues to build a downward set of waves. Thus, I recommend waiting for the correction wave to be built as part of 3 or C (since wave 1 is nearing its completion) and then selling the instrument with targets located near 1.0908 and 1.0850, which is equal to 76.4% and 100.0% for Fibonacci. GBP/USD The GBP/USD pair gained about 30 basis points on February 7, but such a small increase in the instrument's quotes did not affect the current wave markup in any way, which still involves building a wave 3 or C as part of a downward trend section. If the current wave markup is correct, then the decline in quotes will resume soon with targets located near the levels of 50.0% and 61.8% for Fibonacci. Fundamental component: The news background for the GBP/USD instrument on Monday was also absent for the "Briton". However, the overall trading amplitude of the instrument does not contradict the news background. The most interesting events for the pound occurred today. Quite unexpectedly for the markets, the GDP figure for the fourth quarter in Britain was + 1.1% y/y, although forecasts indicated a decline to 0.8%. In relation to the previous third quarter, there is no GDP growth – 0.0%. On the one hand, the pessimistic forecasts were not justified, and on the other hand, there is no improvement in the indicator. But there is a deterioration in the report on industrial production for December, which fell by 1.8% y/y instead of the 0.8% reduction that the markets expected to see. Every month, production increased by 0.1%, which is also worse than forecasts. There will also be a speech by Bank of England President Mark Carney in Parliament today, and everything will also depend on what the chairman will say, who will leave his post in March. General conclusions and recommendations: The pound/dollar tool continues to build a downward wave 3 or C. Thus, I recommend staying in the sales of the pound with targets located around the mark of 1.2764, which is equal to 50.0% for Fibonacci. A successful attempt to break this mark will lead to a further drop in quotes. The news background from the UK today is very strong, so I recommend that you carefully follow all the news and reports that may well lead to a strong increase in the instrument, contradicting the wave markup. The material has been provided by InstaForex Company - www.instaforex.com |
| Fractal analysis for major currency pairs as of February 11 Posted: 11 Feb 2020 05:04 AM PST Hello, dear colleagues. For the Euro/Dollar pair, we follow the downward structure from January 31 and the price is near the limit values. Therefore, there is a high probability of going into a correction. For the Pound/Dollar pair, we follow the formation of the medium-term downward structure from January 31 and the level of 1.2889 is the key resistance. For the Dollar/Franc pair, we follow the development of the ascending structure from January 31 and the level of 0.9781 is the key resistance. For the Dollar/Yen pair, we follow the ascending structure from January 31; the level of 110.00 is the key resistance and the level of 109.41 is the key support. For the Euro/Yen pair, we follow the development of the downward structure from February 5; the level of 119.75 is the key resistance and the level of 120.21 is the key support. For the Pound/Yen pair, we follow the development of the downward structure from February 5; the level of 140.97 is the key resistance and the level of 142.44 is the key support. Forecast for February 11: Analytical review of currency pairs on the H1 scale:
For the Euro/Dollar pair, the key levels on the H1 scale are: 1.0969, 1.0938, 1.0922, 1.0902, 1.0888, and 1.0864. Here, we follow the development of the downward structure from January 31. The short-term downward movement is expected in the range of 1.0903-1.0888 and the breakdown of the last value will lead to a movement to the potential level of 1.0864, after which we expect a pullback to the top. The short-term upward movement is possible in the range of 1.0922-1.0938 and the breakdown of the last value will lead to an in-depth correction. Here, the target is 1.0969 and this level is the key support for the downward structure. The main trend is the downward structure from January 31. Trading recommendations: Buy: 1.0922 Take profit: 1.0936 Buy: 1.0940 Take profit: 1.0967 Sell: 1.0902 Take profit: 1.0889 Sell: 1.0886 Take profit: 1.0866
For the Pound/Dollar pair, the key levels on the H1 scale are: 1.3070, 1.3013, 1.2970, 1.2889, 1.2847, and 1.2754. Here, we follow the development of the downward structure from January 31. The short-term downward movement is expected in the range of 1.2889-1.2847 and the breakdown of the last value should be accompanied by a pronounced downward movement. In this case, the potential target is 1.2754, near this level we expect consolidation, as well as a pullback to the top. The short-term upward movement is possible in the range of 1.2970-1.3013 and the breakdown of the last value will lead to an in-depth correction. Here, the target is 1.3070 and this level is the key support for the downward structure. The main trend is the downward structure from January 31. Trading recommendations: Buy: 1.2970 Take profit: 1.3011 Buy: 1.3015 Take profit: 1.3070 Sell: 1.2889 Take profit: 1.2848 Sell: 1.2845 Take profit: 1.2756
For the Dollar/Franc pair, the key levels on the H1 scale are: 0.9858, 0.9826, 0.9810, 0.9781, 0.9759, 0.9744, and 0.9719. Here, we follow the development of the ascending structure from January 31. We expect the continuation of the upward movement after the breakdown of the level of 0.9781. In this case, the target is 0.9810 and in the range of 0.9810-0.9826 is the price consolidation. We consider the level of 0.9858 to be a potential value for the top, upon reaching this value, we expect a pullback to the bottom. A short-term downward movement is possible in the area of 0.9759-0.9744 and the breakdown of the last value will lead to an in-depth correction. Here, the target is 0.9719 and this level is the key support for the ascending structure. The main trend is an upward cycle from January 31. Trading recommendations: Buy: 0.9782 Take profit: 0.9810 Buy: 0.9826 Take profit: 0.9858 Sell: 0.9759 Take profit: 0.9745 Sell: 0.9742 Take profit: 0.9720
For the Dollar/Yen pair, the key levels in the H1 scale are: 110.80, 110.47, 109.99, 109.62, 109.41, and 109.07. Here, we follow the development of the ascending structure from January 31. We expect the continuation of the upward movement after the breakdown of 110.00. In this case, the target is 110.47 and consolidation is near this level. We consider the level of 110.80 as a potential value for the top, upon reaching which, we expect a pullback to the bottom. A short-term downward movement is possible in the area of 109.62-109.41 and the breakdown of the last value will lead to a deep correction. Here, the target is 109.07 and this level is the key support for the top. The main trend is the upward structure from January 31. Trading recommendations: Buy: 110.00 Take profit: 110.45 Buy: 110.49 Take profit: 110.80 Sell: 109.60 Take profit: 109.42 Sell: 109.38 Take profit: 109.10
For the Canadian dollar/Dollar pair, the key levels on the H1 scale are: 1.3389, 1.3337, 1.3312, 1.3271, 1.3240, and 1.3195. Here, we follow the development of the upward cycle from January 22. The short-term upward movement is expected in the area of 1.3312-1.3337, hence there is a high probability of a reversal to the bottom. We consider the level of 1.3389 as a potential value for the top, and we expect a movement to this level after the breakdown of 1.3337. A short-term downward movement is possible in the range of 1.3271-1.3240 and the breakdown of the last value will lead to an in-depth correction. Here, the target is 1.3195 and this level is the key support for the top. The main trend is the local ascending structure from January 22. Trading recommendations: Buy: 1.3313 Take profit: 1.3335 Buy: 1.3337 Take profit: 1.3387 Sell: 1.3370 Take profit: 1.3242 Sell: 1.3238 Take profit: 1.3195
For the Australian dollar/Dollar pair, the key levels on the H1 scale are: 0.6731, 0.6707, 0.6688, 0.6654, 0.6618, 0.6574, 0.6545, and 0.6505. Here, we follow the formation of the descending structure from February 5. We expect a continuation of the downward movement after the breakdown of 0.6654. In this case, the target is 0.6618 and consolidation is near this level. The breakdown of 0.6618 will lead to the development of a pronounced movement. Here, the target is 0.6574 and in the area of 0.6574-0.6545 is the short-term downward movement, as well as consolidation. We consider the level of 0.6505 as a potential value for the bottom, upon reaching which, we expect a pullback to the top. A short-term upward movement is possible in the range of 0.6707-0.6731 and the breakdown of the last value will lead to the formation of initial conditions for the upward cycle. In this case, the potential target is 0.6774. The main trend is the downward structure from February 5. Trading recommendations: Buy: 0.6708 Take profit: 0.6730 Buy: 0.6733 Take profit: 0.6772 Sell: 0.6654 Take profit: 0.6620 Sell: 0.6616 Take profit: 0.6576
For the Euro/Yen pair, the key levels on the H1 scale are: 120.72, 120.45, 120.21, 119.91, 119.75, 119.38, and 119.12. Here, we follow the downward structure from February 5. We expect the continuation of the downward movement after the price passes the range of 119.91-119.75. In this case, the target is 119.38. We consider the level of 119.12 as a potential value for the bottom, upon reaching this value, we expect consolidation and a pullback to the top. A short-term downward movement is possible in the range of 120.21-120.45 and the breakdown of the last value will lead to an in-depth correction. Here, the target is 120.72 and this level is the key support for the downward structure. The main trend is the downward structure from February 5. Trading recommendations: Buy: 120.21 Take profit: 120.43 Buy: 120.47 Take profit: 120.70 Sell: 119.75 Take profit: 119.40 Sell: 119.36 Take profit: 119.12
For the Pound/Yen pair, the key levels on the H1 scale are: 142.42, 141.87, 140.97, 140.62, 140.10, and 139.81. Here, we follow the development of the downward structure from February 5. The short-term downward movement is expected in the range of 140.97-140.62 and the breakdown of the last value should be accompanied by a pronounced downward movement. Here, the target is 140.10. We consider the level of 139.81 as a potential value for the bottom, after reaching which we expect consolidation, as well as a pullback to the top. The short-term upward movement is possible in the range of 141.87-142.42 and the breakdown of the last value will lead to the formation of initial conditions for the upward cycle. In this case, the potential target is 143.26. The main trend is the downward structure from February 5, the correction stage. Trading recommendations: Buy: 141.90 Take profit: 142.40 Buy: 142.45 Take profit: 143.20 Sell: 140.95 Take profit: 140.65 Sell: 140.58 Take profit: 140.10 The material has been provided by InstaForex Company - www.instaforex.com |
| Gold 02.11.2020 - Watch for selling opportunities due to the down cycle Posted: 11 Feb 2020 04:18 AM PST Technical analysis:
Gold has been trading sideways at the price of $1.569. The price rejected of the rising trendline in the background, which is sign that buying looks risky. I see potential for the downside movement and test of $1.547 and $1.536. Watch for selling opportunities on the rallies with the first target at $1.547 MACD oscillator is showing neutral stance and oscillator is not that relevant under the trading range condition. Resistance levels are seen at $1.576 and $1.593 Support levels are seen at the price of $1.547 and $1.536 The material has been provided by InstaForex Company - www.instaforex.com |
| Posted: 11 Feb 2020 04:10 AM PST Technical analysis:
GBP has been trading sideways at the price of 1.2930. The price is near very important multi-swing pivot line at 1.2950. The breakout of 1.2950 to the upside would confirm test of 1.3065. Watch for buying opportunities in case of the strong upside breakout. MACD oscillator is showing bullish divergence in the background, which is good confirmation for further upside movement. Major pivot resistance is set at 1.2950 Support levels are seen at the price of 1.2893 and 1.2872 The material has been provided by InstaForex Company - www.instaforex.com |
| Posted: 11 Feb 2020 04:03 AM PST Industry news:
The infamous PlusToken Ponzi scam that resulted in investors losing over $3 billion in cryptocurrencies like Bitcoin [BTC] and Ethereum [ETC] has reared its ugly head again. After a short hiatus, the scam artists have re-surfaced and moved $117 million in Bitcoin, within their addresses. Technical analysis: BTC has been trading sideways at the price of $9.800. Another stronger rejection of the Pitchfork median line was the key for the recent downside movement together with the lack of demand around $10.000 Watch for selling opportunities if you see the breakout of $9.685 with targets at $9.060 and $8.220. MACD oscillator is showing decreasing on the buying power, which adds confirmation for further downside. Major resistance is set at the price of $10.185 Support levels are seen at the price of $9.060 and $8.220. The material has been provided by InstaForex Company - www.instaforex.com |
| Technical analysis of AUD/USD for February 11, 2020 Posted: 11 Feb 2020 03:27 AM PST Overview: Pair: AUD/USD. Pivot: 0.6719. The pair is trading below its pivot point. It is likely to trade in a lower range as long as it remains below the pivot point. The pivot point stands at 0.6719. The AUD/USD pair continues to move downwards from the level of 0.6775, which represents the double top in the H1 chart. The pair dropped from the level of 0.6775 to the bottom around 0.6663. Today, the first resistance level is seen at 0.6775 followed by 0.6800, while daily support is seen at the levels of 0.6689 and 0.6655. According to the previous events, the AUD/USD pair is still trapping between the levels of 0.6655 and 0.6775. Hence, we expect a range of 120 pips in coming hours. The first resistance stands at 0.6775, for that if the AUD/USD pair fails to break through the resistance level of 0.6775, the market will decline further to 0.6689. This would suggest a bearish market because the RSI indicator is still in a negative area and does not show any trend-reversal signs. The pair is expected to drop lower towards at least 0.6689 in order to test the second support (0.6655). Short positions are recommended with the first target at 0.6689. A break of that target will move the pair further downwards to 0.6655 . On the contrary, if a breakout takes place at the resistance level of 0.6820 (the double top), then this scenario may become invalidated. The material has been provided by InstaForex Company - www.instaforex.com |
| Trading recommendations for EUR/USD on February 11 Posted: 11 Feb 2020 02:24 AM PST Using complex analysis, we can see that the quote managed to go down to 1.0907, which means that the end of the recovery is already close. Our deduced theories began to bear fruit at the end of last year so, the recovery theory has already passed the stages # 1 [1,1080], # 2 [1,1000], # 3/1 [1,0950], where the last stage was the average, which led to an increase in the course. In fact, at the moment, we have completed 91% of working out the oblong correction [Low-1.0879; High-1.1239], which means that we can consider it as a completed model. However, be reminded that the resumption of the original trend will begin after the price fixes below the original pivot point at 1.0879. Afterwards, the quote will automatically be at the values of 2017, which means that we will face one of the strongest range of interaction between the price and market participants. I advise everyone to carefully analyze the time interval from March 2015-April 2017, as we will fall into the trap of speculation, where the fear of historical lows will prevail over everything. Moreover, from the point of view of regularity, the range of 1.0000 / 1.0500 pursues an increased speculative interest, where short positions come to naught when critical levels are reached. The only working element that can help break through the boundaries of interaction is the information background, if there is one in the market. from the point of view of regularity, the range of 1.0000 / 1.0500 pursues an increased speculative interest, where short positions come to naught when critical levels are reached. The only working element that can help break through the boundaries of interaction is the information background, if there is one in the market. from the point of view of regularity, the range of 1.0000 / 1.0500 pursues an increased speculative interest, where short positions come to naught when critical levels are reached. The only working element that can help break through the boundaries of interaction is the information background, if there is one in the market. In terms of volatility, we see stable indicators that have already managed to overcome the daily average by 7%. In this case, we see not just the characteristic acceleration that occurred at the moment of the second stage breakdown [# 2 - 1,1000], but the stability that indicates a healthy tact. Analyzing the past day by the minute, we see that at first, the quote was moving steadily at a horizontal direction, just along the step # 3/1 [1.0950], with an amplitude of about 15 points. The main surge in activity occurred at the start of the US trading session, where the main surge in short positions occurred between 14: 30-16: 30 London time [trading terminal time]. The movement after was in terms of point accumulation, garnering an amplitude of 7-8 points. As discussed in the previous review , traders have been working downwards, ever since the second stage has been passed, and trading forces regrouped around 1.0950. As a result, speculators simultaneously worked on local spikes, which brought additional income with minimal return. Looking at the trading chart in general terms [the daily period], we can almost see the end of the recovery. The news background yesterday did not contain statistical data in both Europe and the United States, so we relied in the technical environment, as well as in the external noise. In terms of general information background, we have a multi-faceted noise. The number of deaths from coronavirus has now exceeded the 1000 mark. This is negligible in terms of global risks, but in terms of fanning fear based on the media, it is enough, so the panic regarding it still remains. At the same time, the upcoming trade negotiations between Britain and Brussels are becoming more emotional, so the European Union intends to toughen its position during the negotiations, focusing on issues related to unfair competition, fishing and human rights. These factors put pressure on both the investors and the market dynamics. In terms of the economic calendar, we have open vacancies for JOLTS, where growth is expected from 6.8 M to 7.0 M. Moreover, Jerome Powell, head of the Federal Reserve System, will also speak today during a two-day meeting in the US Congress, where on the first day before the House Committee of Financial Services, Powell will present a semi-annual report on monetary policy. Further development Analyzing the current trading schedule, we can see an extremely strong slowdown in the area of 1.0905 / 1.0917, where the quote is building up during consolidation. In fact, this is a kind of accumulation within the reference point of support [1.0879], where everything can be expected. I have two scenarios in this case: First, due to the historical regularity, the quote may again find a foothold, where against the background of the recent inertial descent, long positions may appear and form a correction; On the other hand, in the second scenario, the lows of 1.0879 will be broken, and the level of consolidation will be the point of regrouping the trading forces. Of course, these two judgments may happen, and everyone can make money on this. Meanwhile, by detailing the available time period by the minute, we can see that the consolidation will end with a burst of activity. In terms of the emotional mood of market participants, we see an extremely high coefficient of speculative positions. This is understandable, as we have a strong support, historical lows, and consolidation. As a result, although traders are still holding short positions, they are already considering a consolidation. Speculators, on the other hand, are preparing for a surge in activity, regardless of the direction. There is a possibility that the first thing we will see is a local surge against the background of consolidation, where drastic changes may not occur, but a jump will. Further actions will be based on the behavior of the quote, where the pivot point is already available, and reflects the lows of 1.0879. Because of this, the alignment is based on the rebound / breakout method, which should be used when making a trading decision. Based on the above information, we will output the following trading recommendations: - Buy positions will be considered if the price fixes above 1.0920, along with the prospect of movement to 1.0950. Make local transactions. - Positions for sale are left for fixing. Further short positions will be considered after the price is fixed below 1.0879. Local positions [speculative] are considered from 1.0900 to 1.0880. Indicator analysis Analyzing the different sectors of timeframes (TF), we can see that the indicators of technical instruments mostly occupy a downward position. However, due to consolidation, we have an alternating signal on smaller periods. Volatility for the week / Volatility Measurement: Month; Quarter Year The volatility measurement reflects the average daily fluctuation, based on the calculation for the Month / Quarter / Year. (February 11 was based on the time of publication of the article) At the moment, volatility is at 12 points, which is an extremely low value in terms of the pair's dynamics. It is likely to assume that acceleration will occur when there is a local jump in activity, and the level of consolidation is broken down. Key level Resistance zones: 1,0900/1,0950**;1,1000***; 1,1080**; 1,1180; 1,1300**; 1,1450; 1,1550; 1,1650*; 1,1720**; 1,1850**; 1,2100 Support areas: 1,0850**; 1,0500***; 1,0350**; 1,0000***. * Periodic level ** Range level ***Psychological level ***** The article is based on the principle of conducting a transaction, with daily adjustments The material has been provided by InstaForex Company - www.instaforex.com |
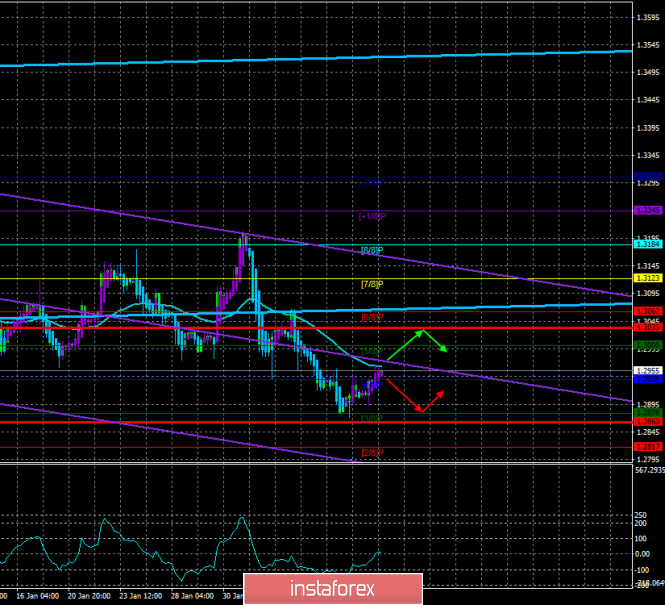
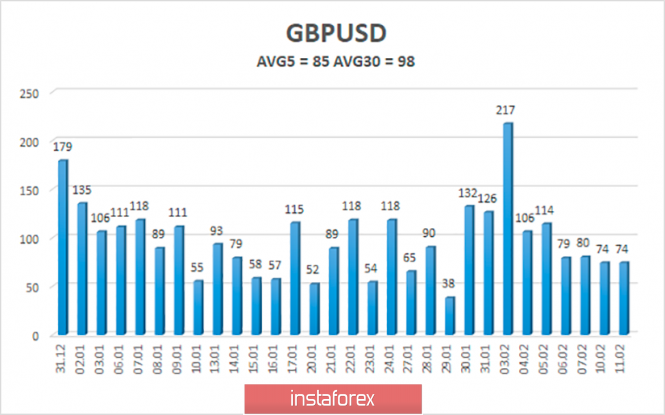
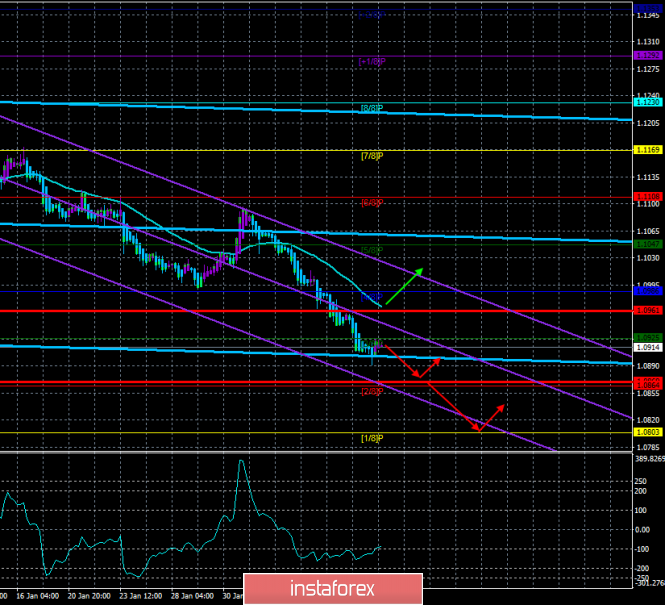
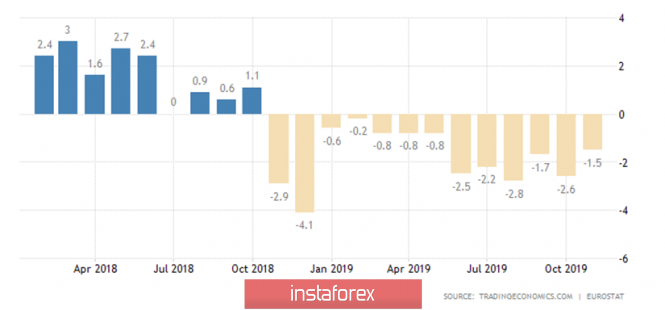
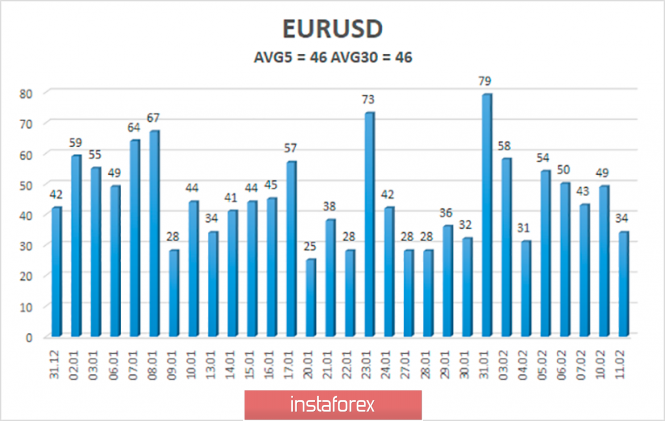
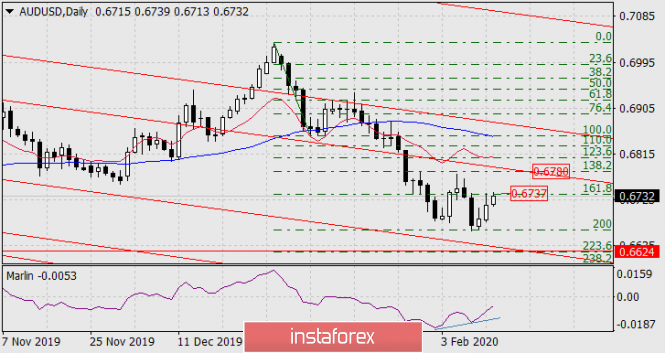
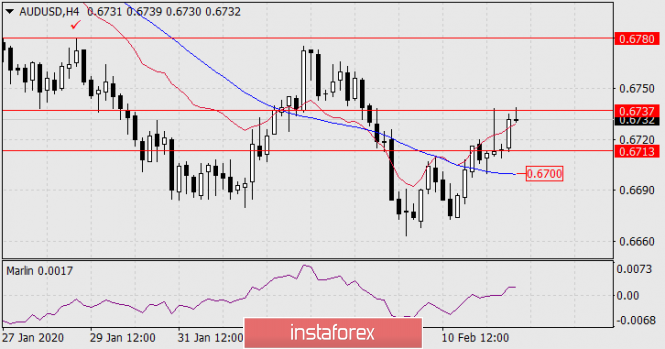
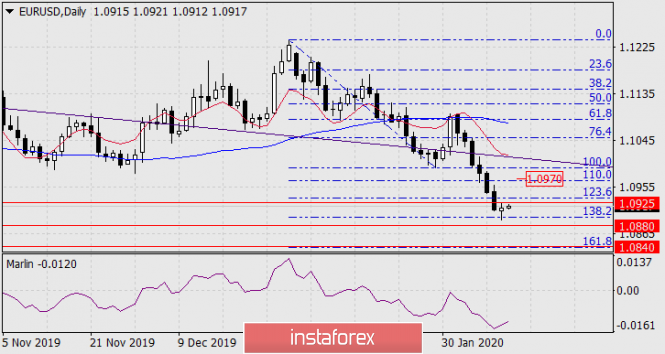
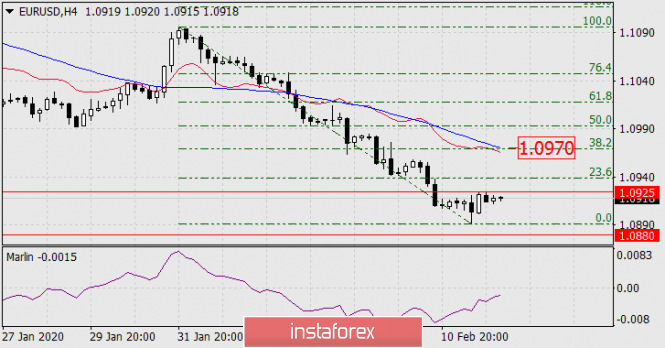
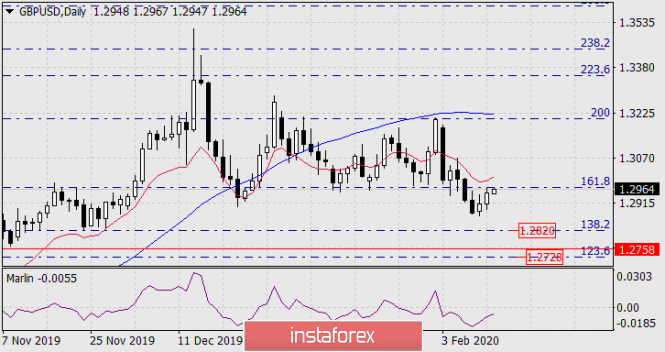
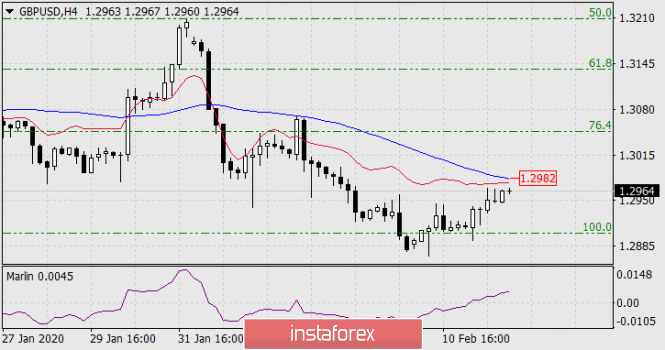
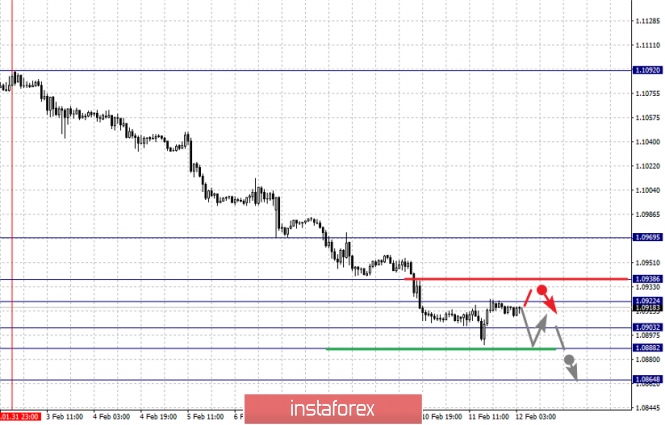
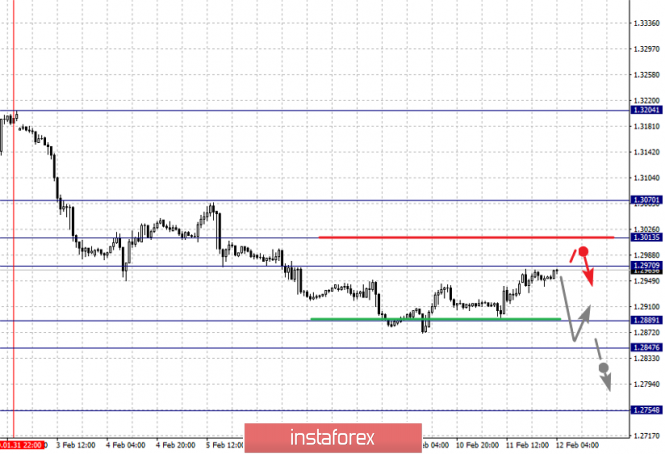
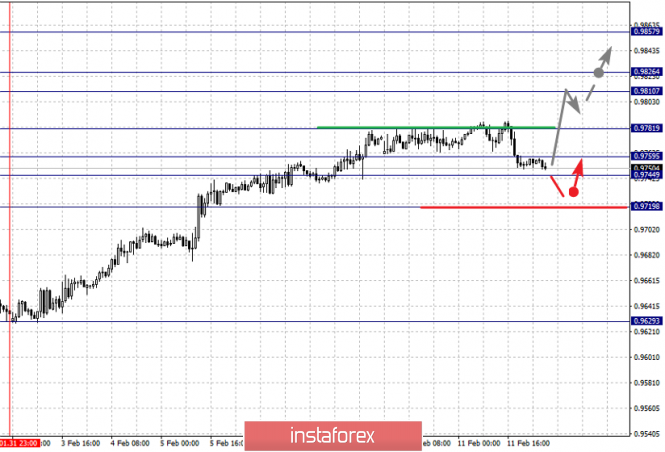
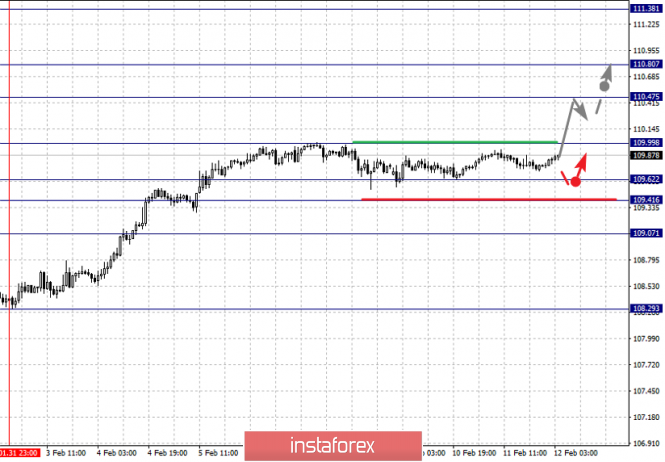
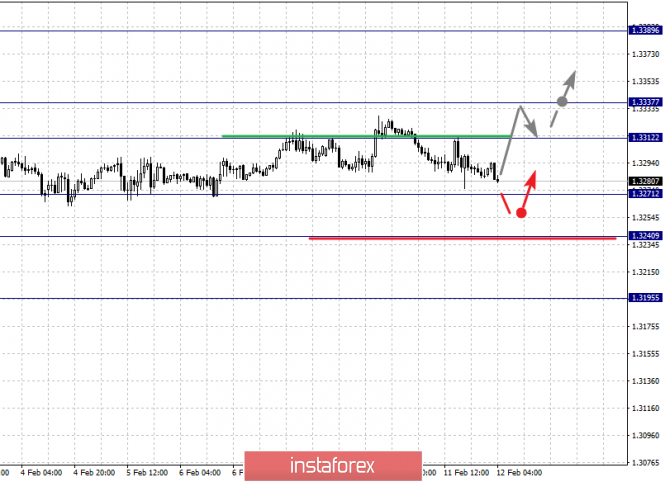
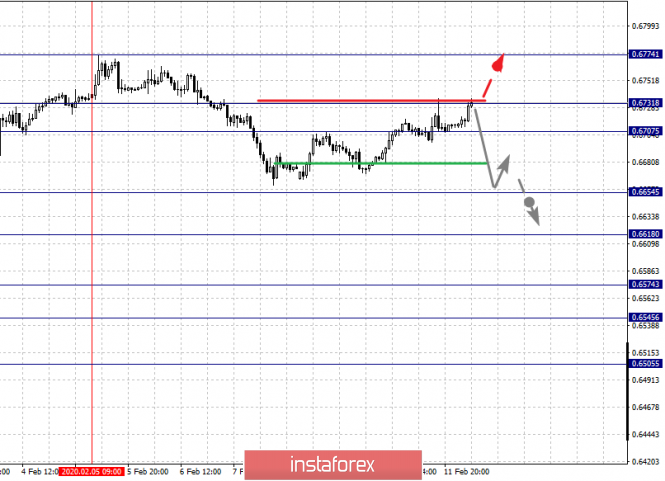
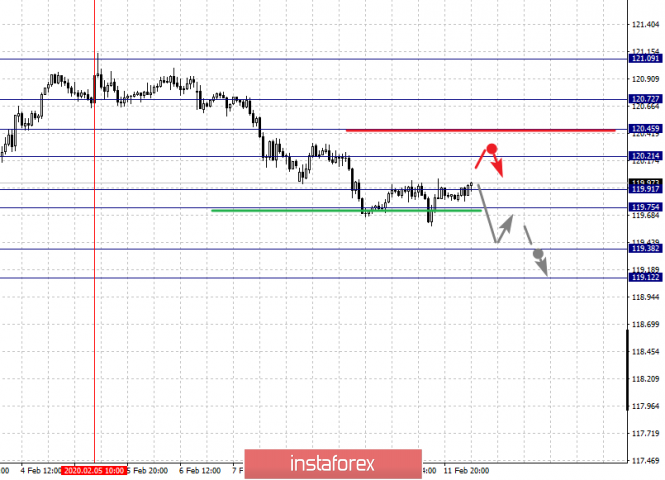
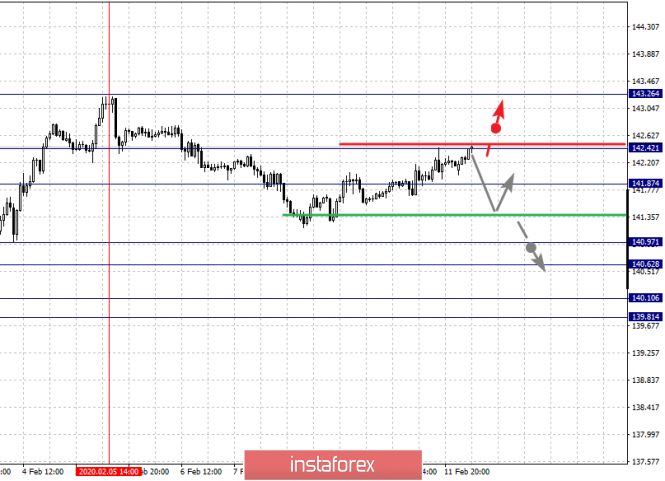
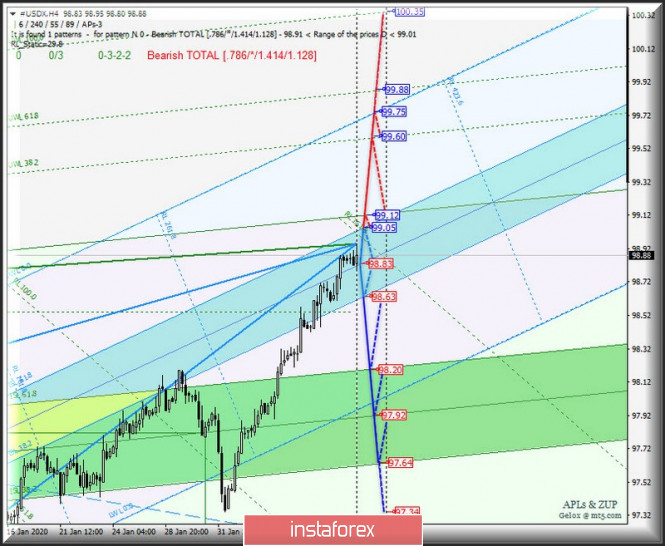
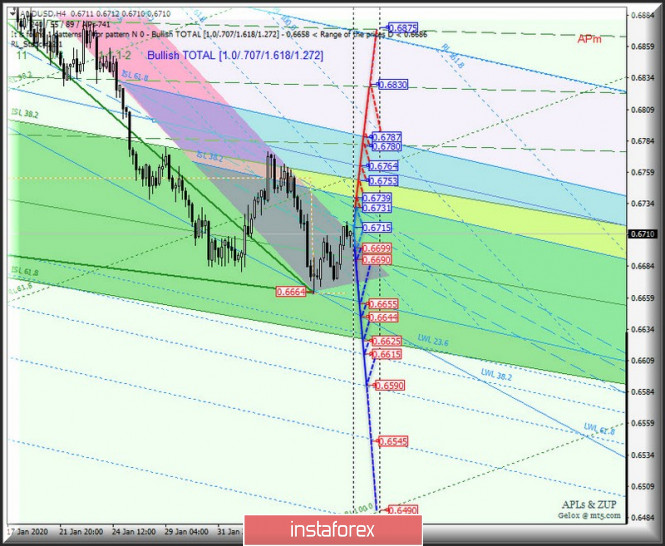
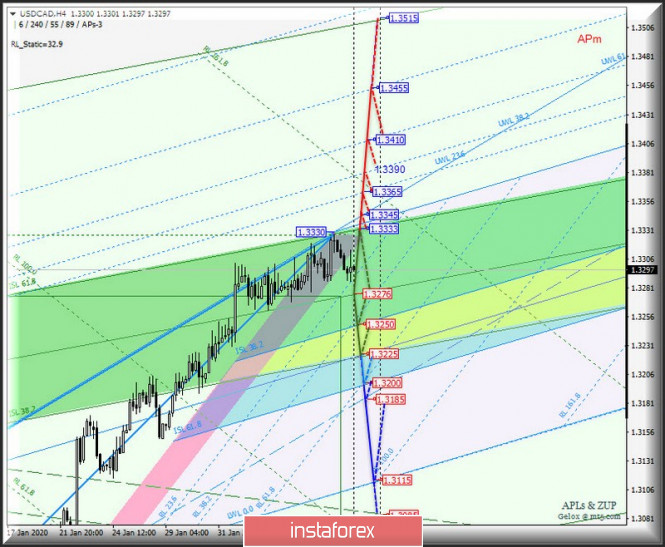
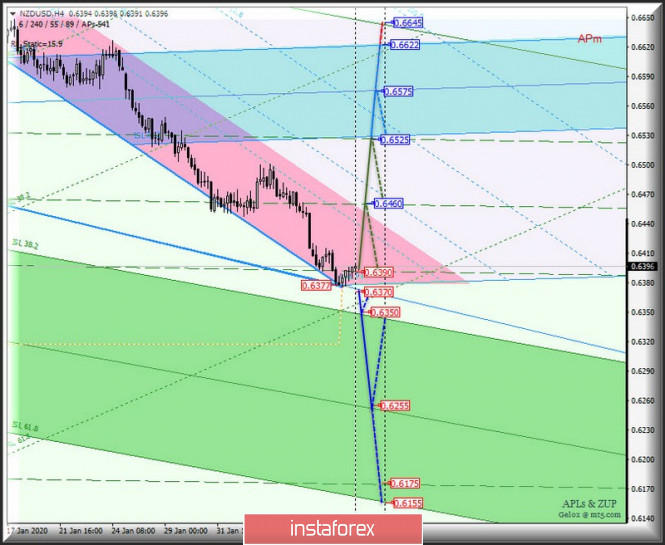
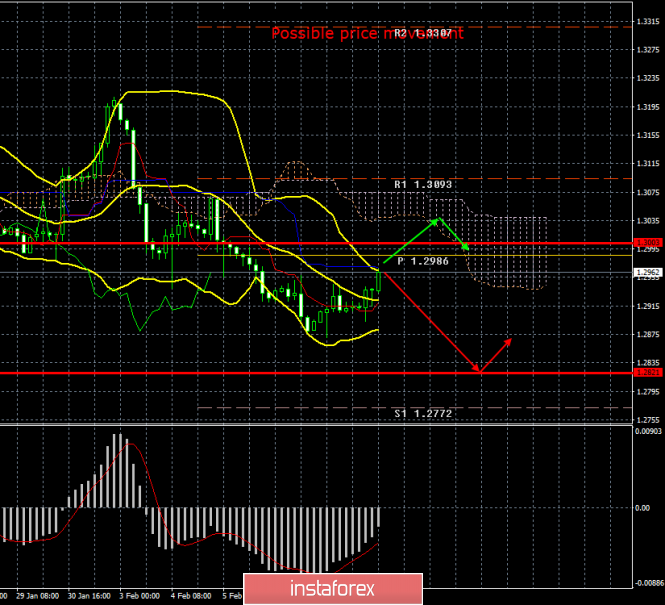
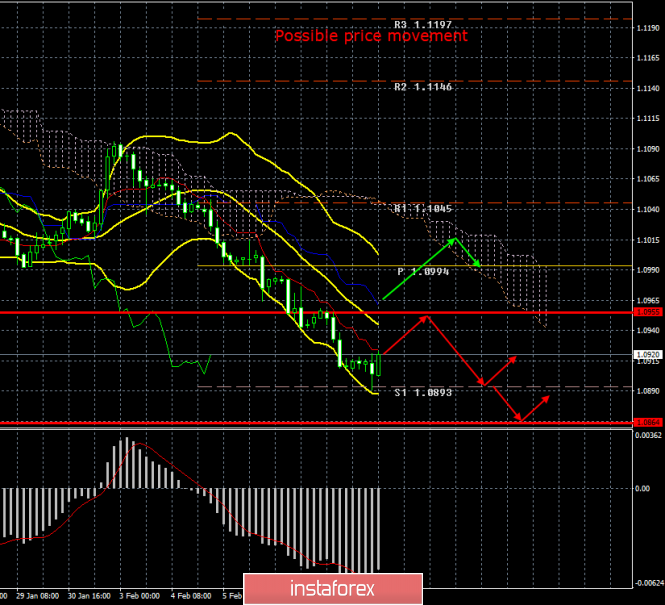

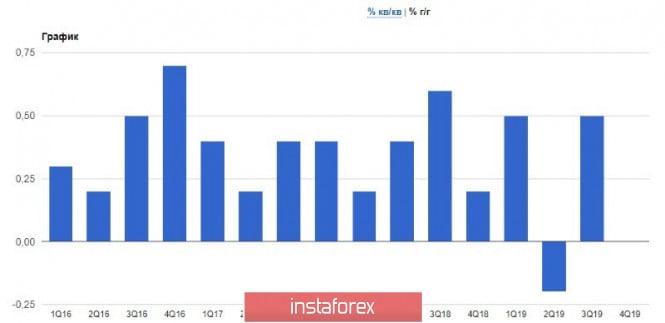
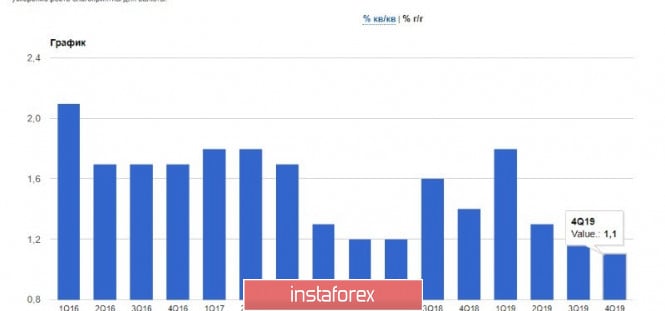
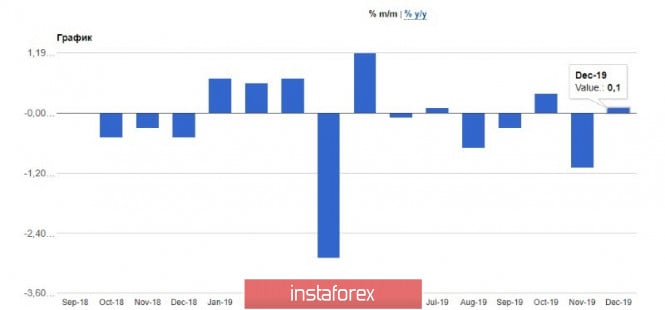
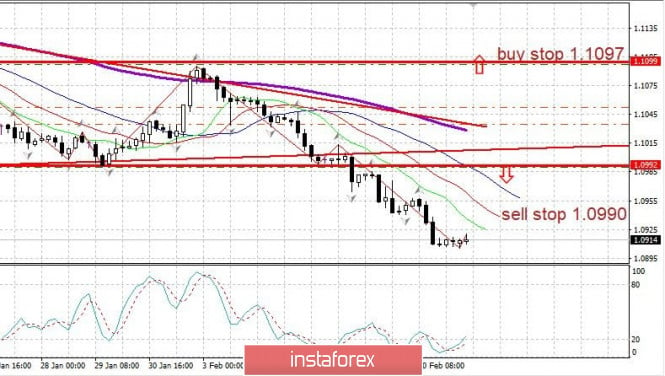

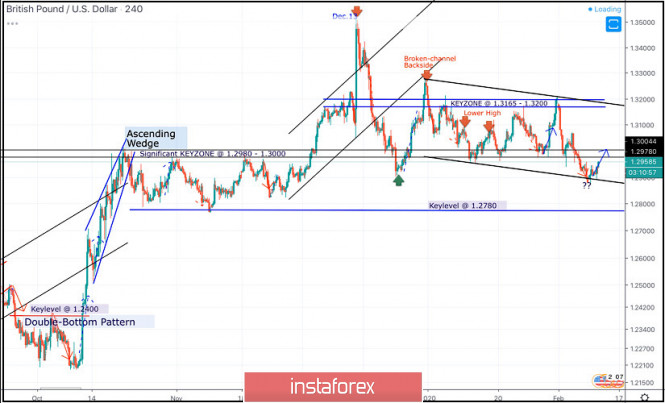
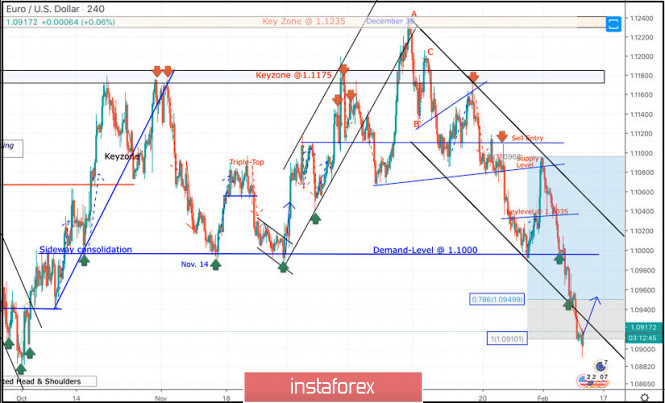
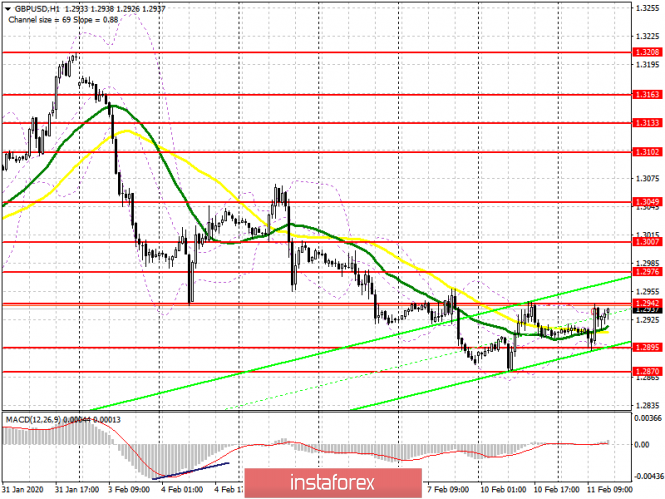
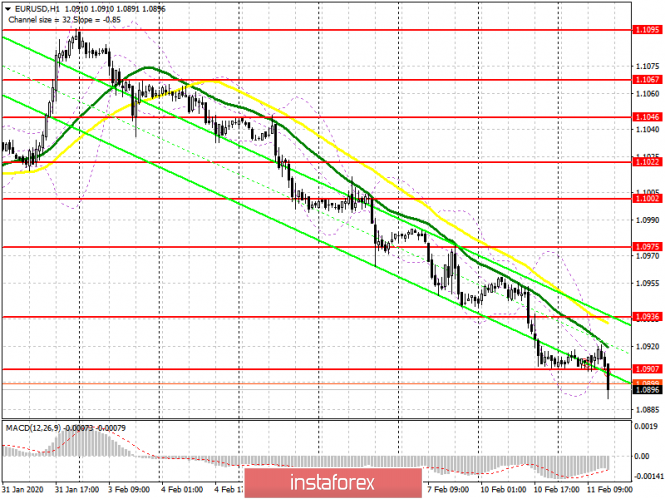
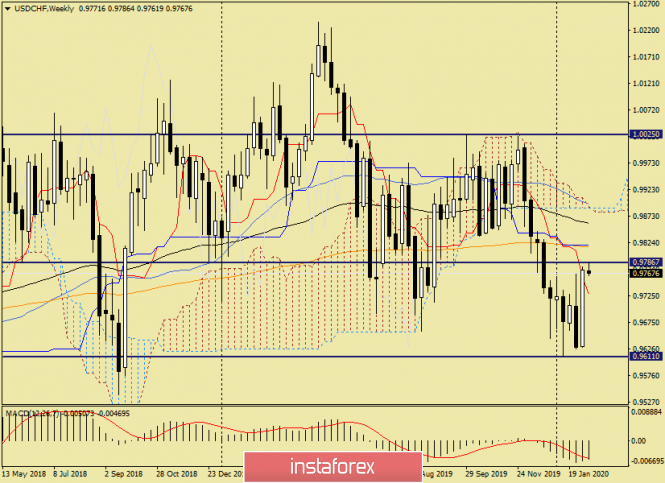
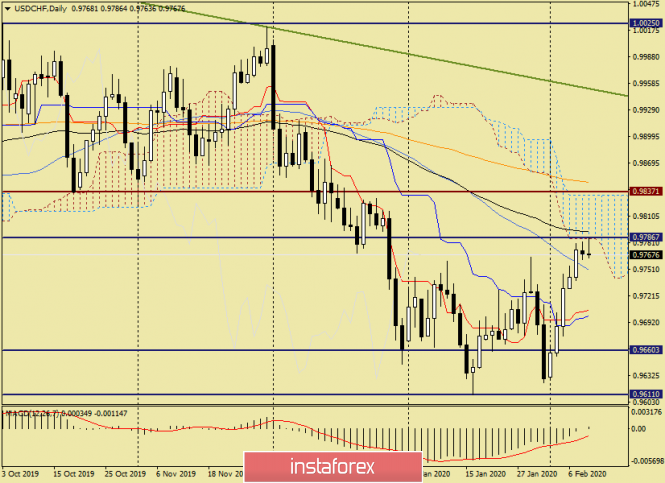
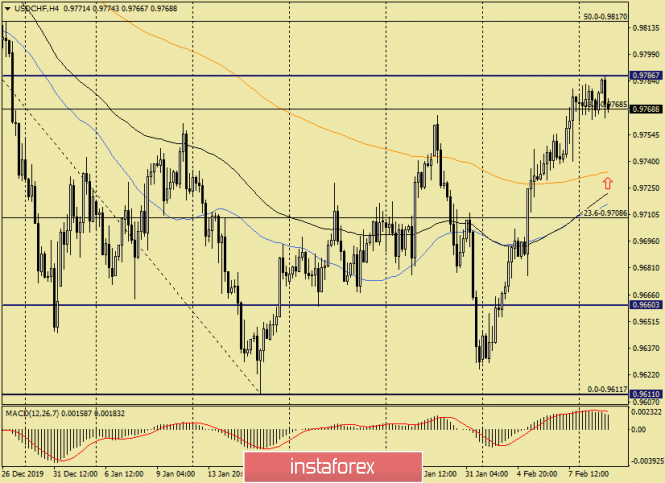
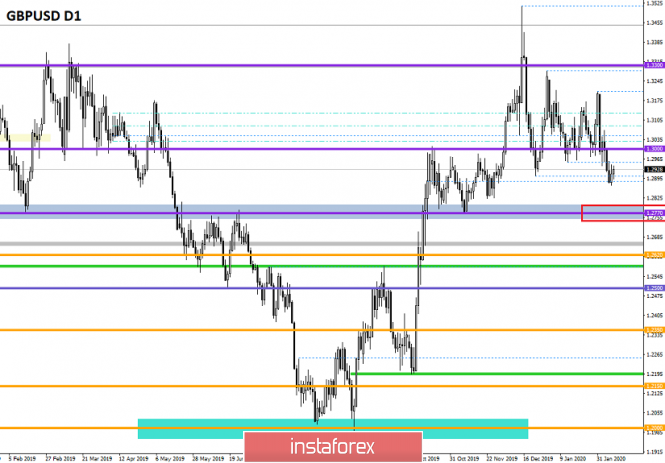
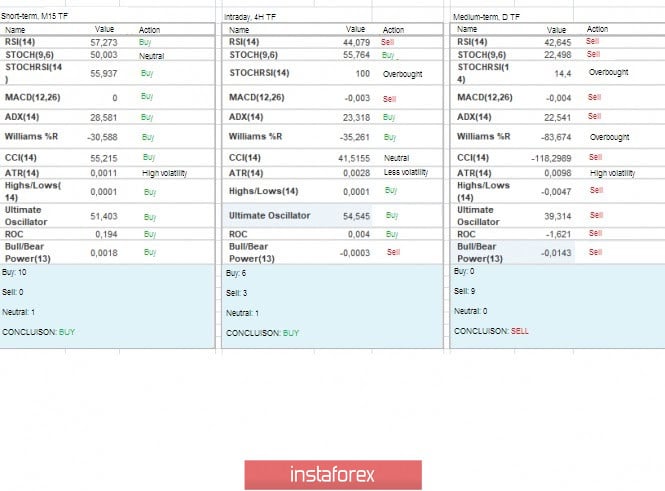
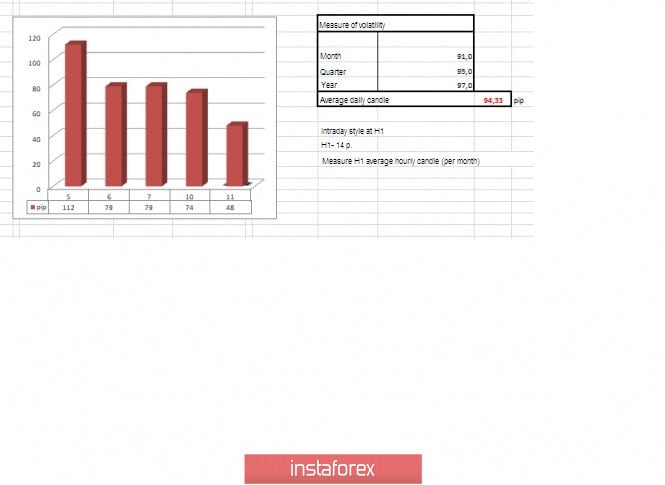
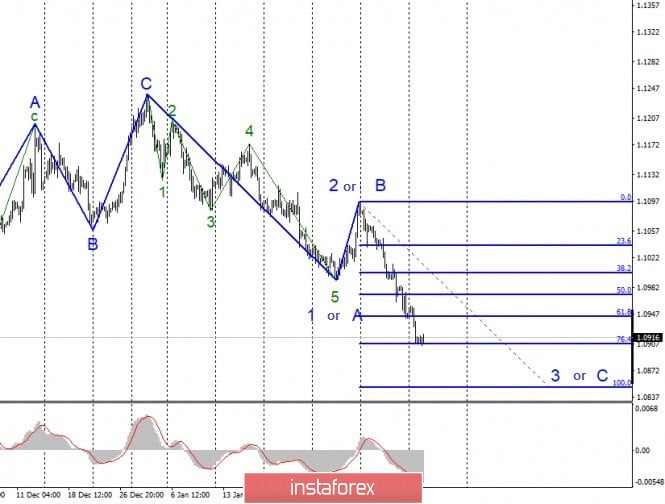
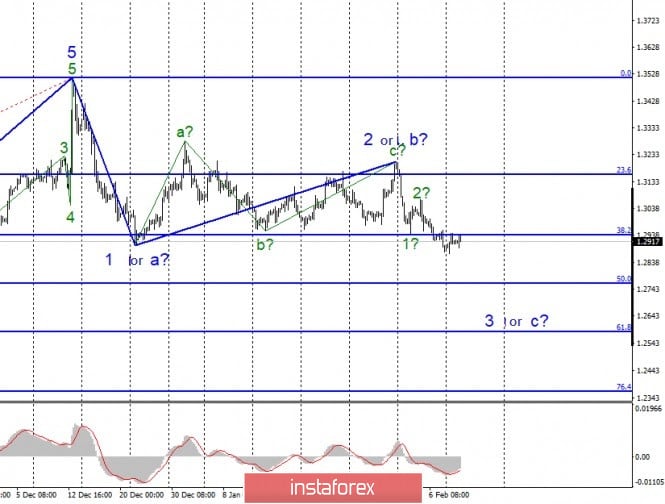
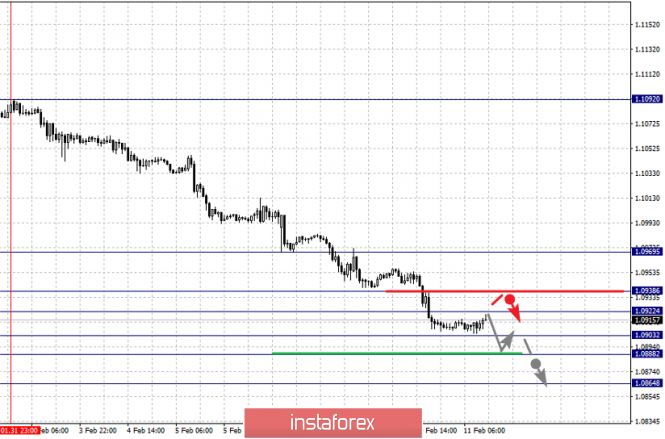
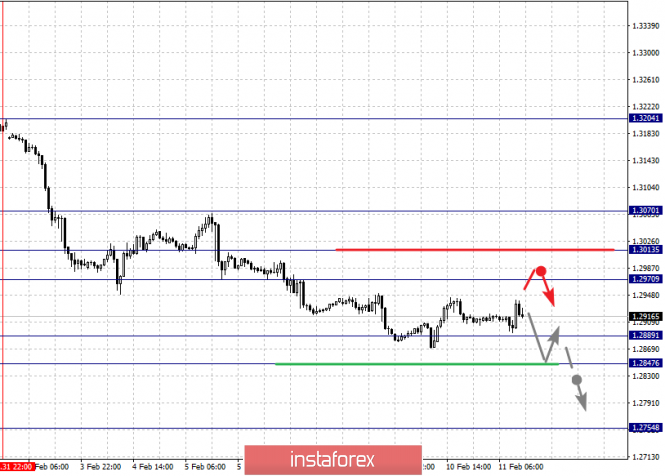
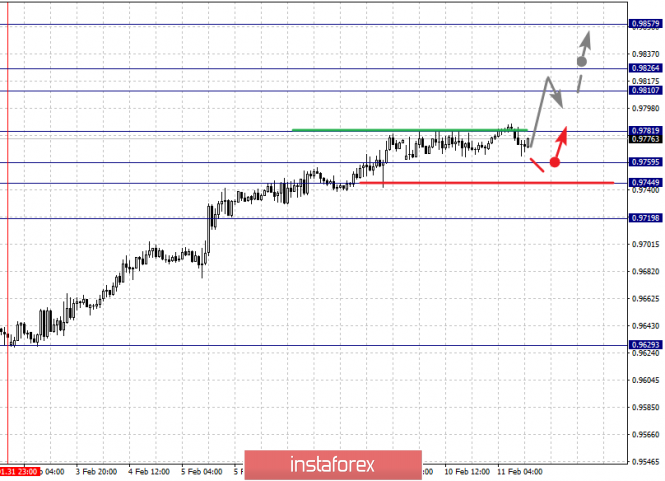
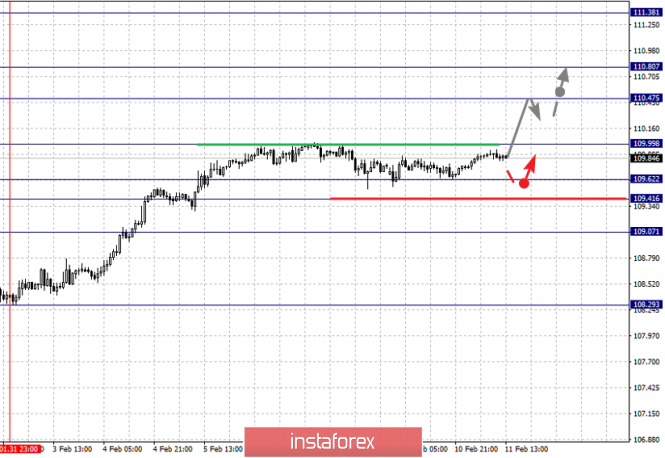
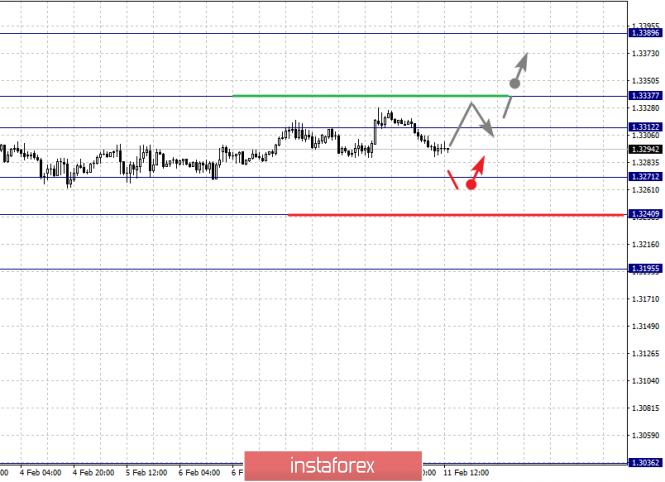
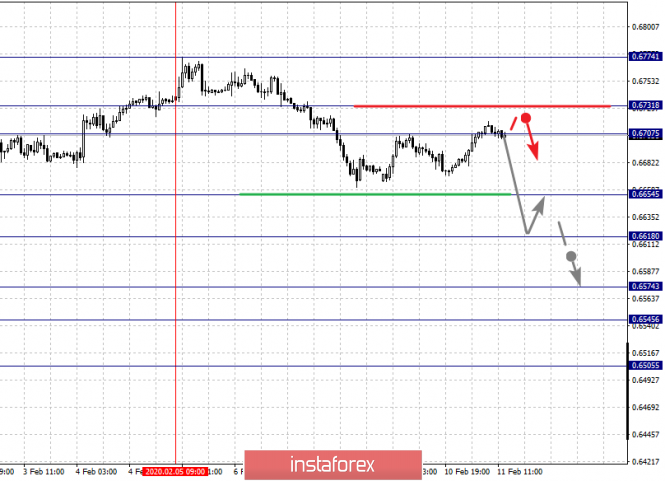
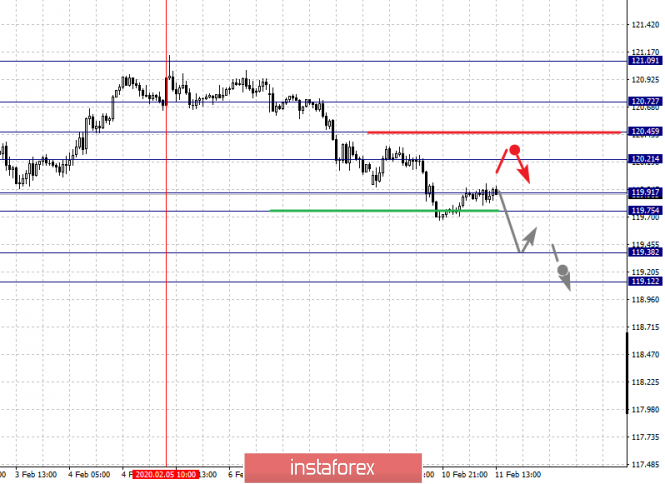
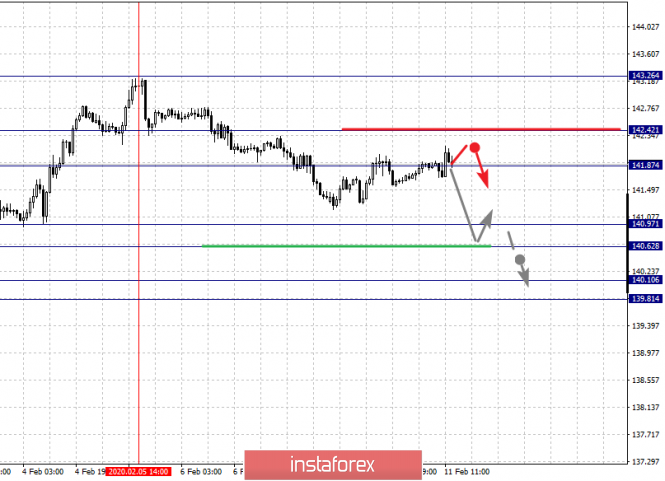
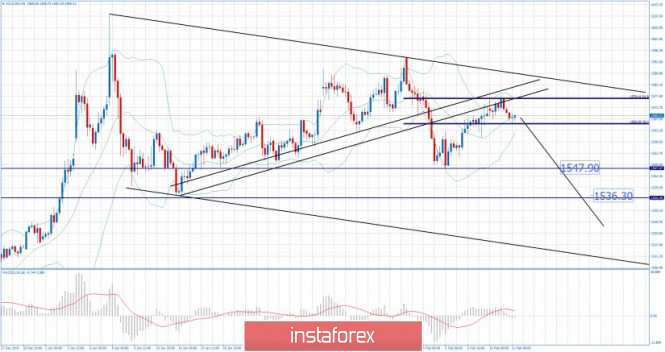
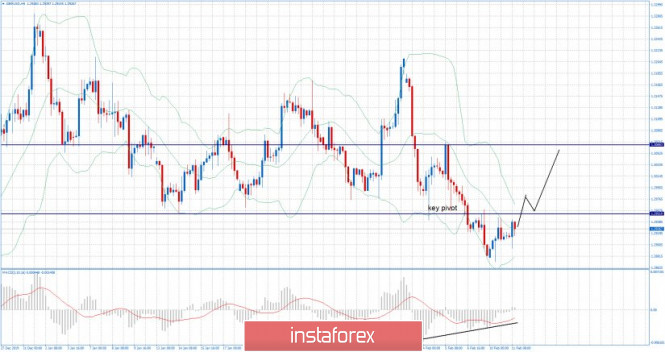
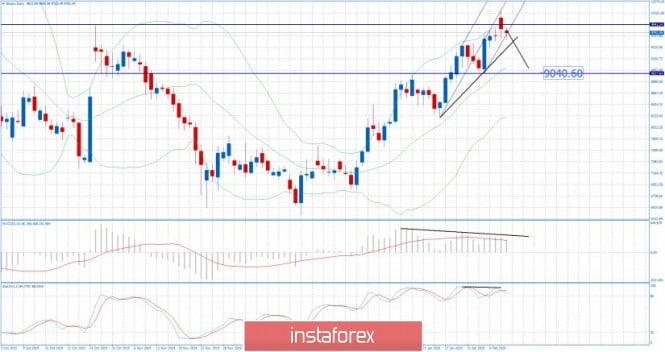
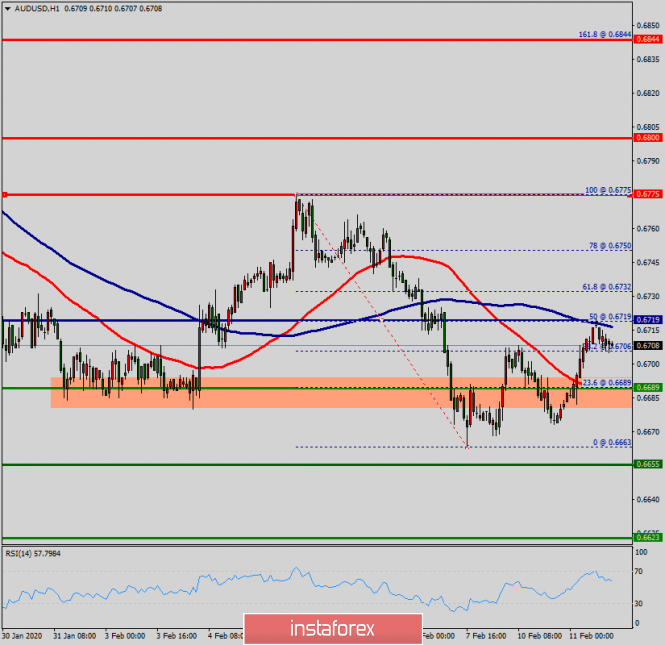
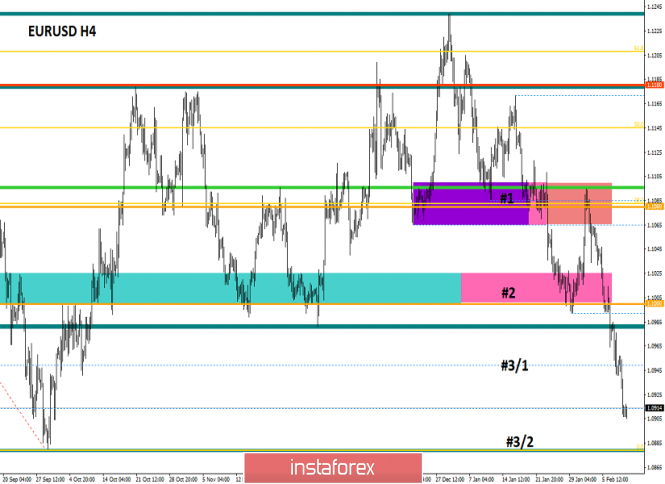
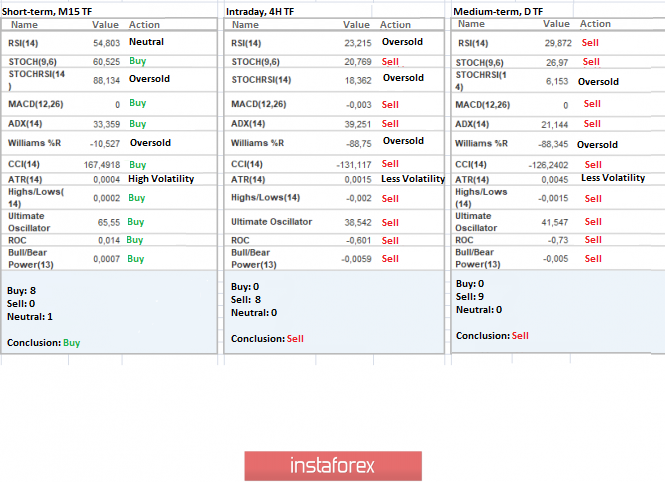
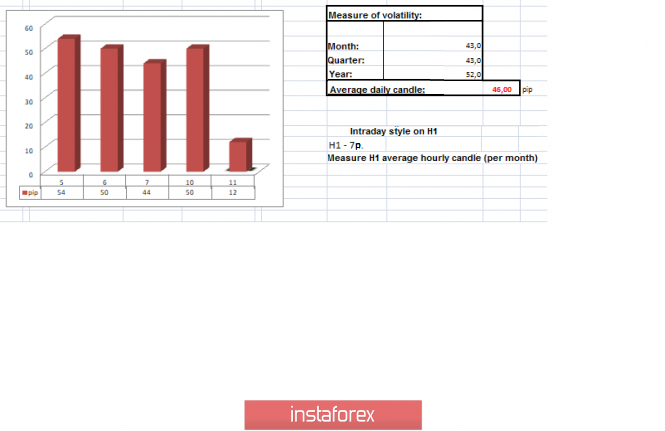
| You are subscribed to email updates from Forex analysis review. To stop receiving these emails, you may unsubscribe now. | Email delivery powered by Google |
| Google, 1600 Amphitheatre Parkway, Mountain View, CA 94043, United States | |
No comments:
Post a Comment