Forex analysis review |
- Forecast for EUR/USD on February 14, 2020
- Forecast for GBP/USD on February 14, 2020
- Forecast for AUD/USD on February 14, 2020
- GBP/USD. Pound is back on horseback: Boris Johnson revamped the government and ousted Javid
- Comprehensive analysis of movement options of #USDX vs Gold & Silver (DAILY) from February 14, 2020
- EURUSD: euro not pleased with the European Commission's future outlook for eurozone inflation. US inflation report will return
- Evening review EURUSD 02/13/2020. Euro continues to fall
- Kiwi: perfect flight
- February 13, 2020 : EUR/USD Intraday technical analysis and trade recommendations.
- February 13, 2020 : GBP/USD Intraday technical analysis and trade recommendations.
- Crude Oil analysis for 02.13.2020 - Buying opportutnieis preferrable with the main target at 52.50
- GBP/USD 02.13.2020 - Massive movement on the GBP to the upside and our major target at 1.3067 is very close. Buying opportuntiies
- Technical analysis of AUD/USD for February 13, 2020
- BTC analysis for 02.13.2020 - Watch for potential downside on the BTC due to overbought condition and rejection of the median
- Will gold come out of the shadow of the dollar?
- EUR/USD. February 13. The "bearish" mood persists in the market. There are small chances of growth in the area of 1.0954-1.0981
- GBP/USD: plan for the American session on February 13. Buyers of the pound have completed a very important task and ready
- GBP/USD. February 13. We are waiting for a new rebound from the correction line and the report on inflation in America
- EUR/USD: plan for the American session on February 13. The euro reacted with a fall to German inflation and the European
- Trading recommendations for the EURUSD pair on February 13
- AUD/USD. It's time to grow!
- EUR/USD: Strength of the buck
- Scary news from China unfurled gold
- Trading recommendations for the GBP/USD pair on February 13
- AUD/USD bounce above key support level!
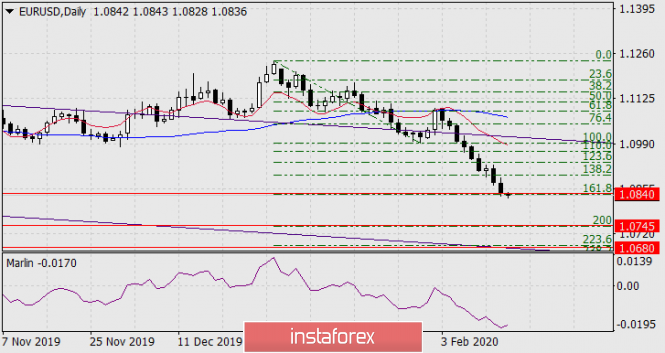
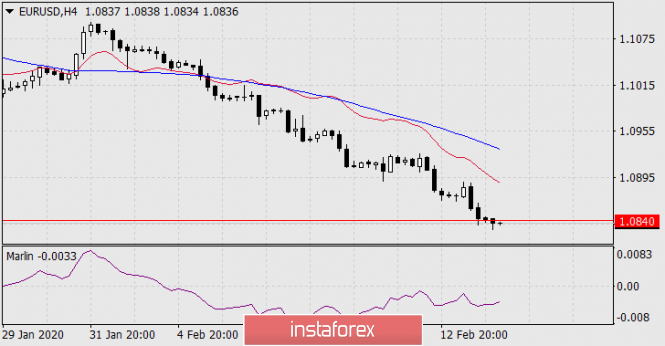
| Forecast for EUR/USD on February 14, 2020 Posted: 13 Feb 2020 07:59 PM PST EUR/USD On Thursday, the euro fell slightly more than 30 points and reached the next target of 1.0840 at the Fibonacci level of 161.8% on the daily chart. The euro shows its intent to decline further today in the Asian session. We believe this with pleasure since data on US retail sales will be released in the evening - the forecast is 0.3%. Data will also be released on industrial production: the forecast is -0.2%, but an indicator output of even -0.1% can strengthen the dollar simply because the US economy is much better than the European one. Now the target of the euro is the Fibonacci level of 200.0% at the price of 1.0745. Perhaps the goal will be achieved on Monday or even on Tuesday, since Monday is a public holiday in the US and ZEW indices in Germany are expected to worsen on Tuesday. On a four-hour chart, the Marlin oscillator is turning down. We are waiting for price consolidation below 1.0840. |
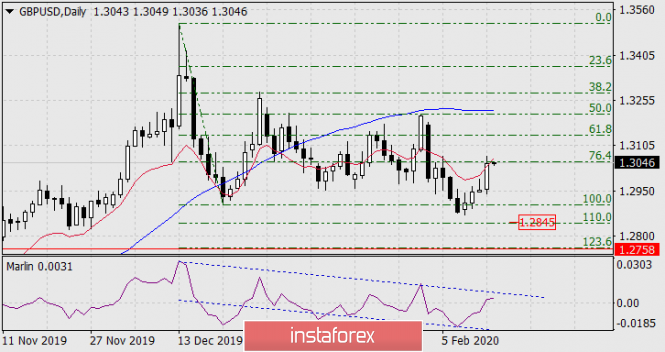
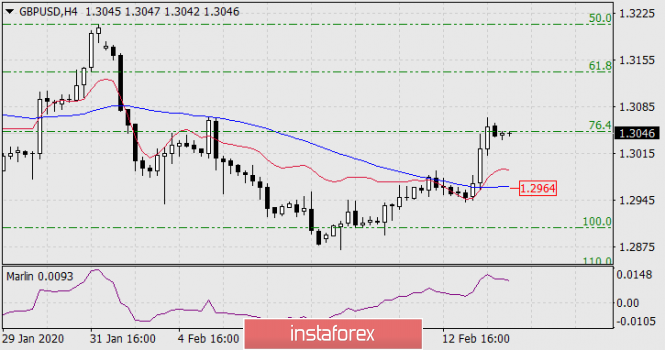
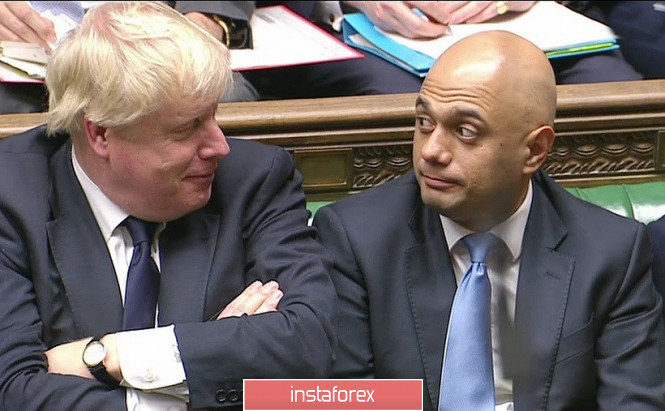
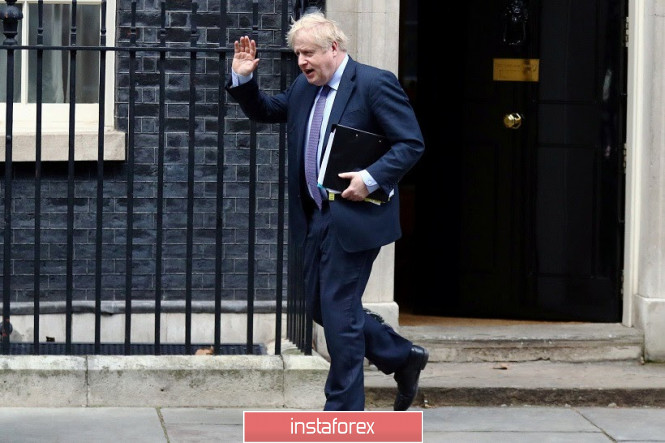
| Forecast for GBP/USD on February 14, 2020 Posted: 13 Feb 2020 07:58 PM PST GBP/USD On Thursday, Sajid Javid left the post of the Minister of Finance of Great Britain, and Deputy Rishi Sunak moved into his chair. He is considered to be an associate of Prime Minister Johnson and investors believe that together they will raise government spending through an increase in public debt. The pound grew 85 points. The pound's growth stopped at the Fibonacci level of 76.4%, the balance line provided additional resistance. The signal line of the Marlin oscillator came close to the upper boundary of its own channel. From current levels, we are waiting for the price to turn down. Help can come from today's data on retail sales and industrial production in the United States. The forecast for January retail sales is 0.3%. Industrial production is seen at -0.2%, but we expect it to be slightly better than expected. Even a -0.1% indicator can inspire traders to buy dollars for the simple reason that the US economy remains significantly better than the European one. We look forward to the pound's fall to the Fibonacci level of 110.0% at the price of 1.2845, which approximately corresponds to the lower boundary of the channel of the Marlin oscillator. But on the way to 1.2845, strong support can be found at 1.2960/70, which is formed by January lows. On the H4 chart, the MACD line (1.2964) is in this range. Consolidation under it, respectively, will strengthen the downward trend. The material has been provided by InstaForex Company - www.instaforex.com |
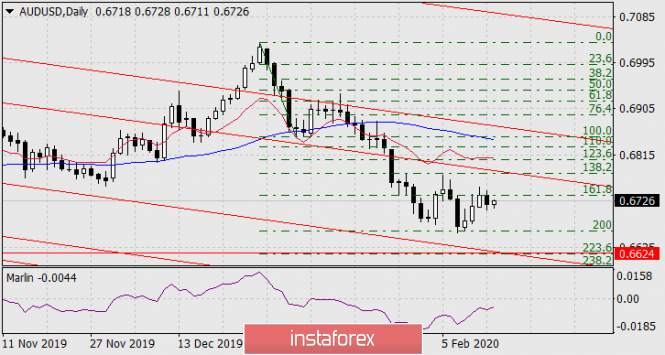
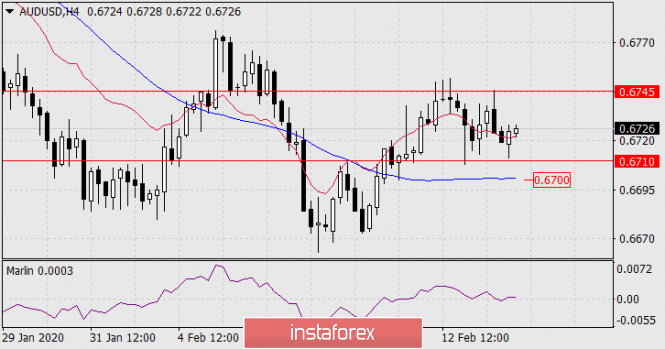
| Forecast for AUD/USD on February 14, 2020 Posted: 13 Feb 2020 07:56 PM PST AUD/USD As a result of yesterday, the Australian dollar fell by 17 points, reversing from the Fibonacci level of 161.8% on the daily chart. The Marlin oscillator is still in a growing position, which warns of a momentary reversal, even if it occurs. Trading was conducted in the 0.6710/45 range on the four-hour chart, most likely, the sideways mini-trend in this range will continue. The price of H4 is higher than both indicator lines, Marlin is in no hurry to penetrate into the negative zone. The consolidation of the falling trend will occur only after the price goes below the MACD line (0.6700). We are waiting for the price at the intersection of the Fibonacci level of 223.6% with the price channel line at the price of 0.6624 (daily). |
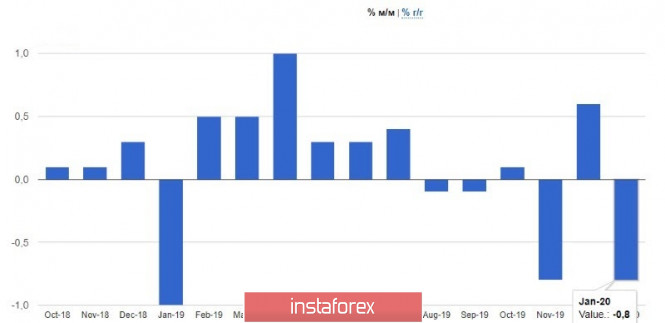
| GBP/USD. Pound is back on horseback: Boris Johnson revamped the government and ousted Javid Posted: 13 Feb 2020 02:51 PM PST The pound turned out to be a "tough nut": despite the general hegemony of the US dollar, the sterling in the GBP/USD pair is showing character. The bulls of the pair were even able to update the high of the week after reaching multi-month lows. Such "stress resistance" of the currency looks rather abnormal, given the burden of negative fundamental factors. But the fact remains: buyers of the pair use any reason to return in the region of 30 figures. Today, the round ended with the GBP/USD bulls - but this does not mean that they will be able to just as easily reverse the trend, offsetting the pressure of sellers. The fundamental background for the British currency has recently been controversial. In late January, the Bank of England made it clear that it was ready to maintain a wait-and-see attitude, but subject to the restoration of key parameters of the British economy. This plot twist turned out to be in favor of the pound, as most market participants expected an announcement of a rate cut at the next meetings. But the euphoria of the pair's buyers did not last long - after a few days the pound again fell under the wave of sales against the backdrop of political uncertainty. This time the "Scottish Question" emerged. The first minister of this region of Great Britain, Nicola Sturgeon, announced that Scotland intends to return to the European Union "as an independent nation." She specified that she would continue to seek a second referendum on independence, despite the categorical refusal of London. Prospects for political instability put pressure on the pound, and the pair plunged below the 1.3000 mark. At the beginning of this week, the pound again received a reason for its growth: data on the growth of the UK economy were slightly better than expected. Instead of falling to the level of 0.8% in the fourth quarter, the GDP growth indicator (in annual terms) reached 1.1% - that is, practically at the same level as in the third quarter. Speaking directly about the December growth, here the indicator also exceeded experts' expectations - the indicator left the negative area and reached 0.3%. But investors are not pleased with the volume of industrial production - in annual terms, the indicator remained in the negative area, while in monthly terms, although it crossed the zero line, it grew weaker than forecasts (up to 0.3% instead of 0.5%). But in general, the published figures made it possible to count on maintaining a wait-and-see position on the part of the English regulator. This fact extinguished the downward momentum of the pair, turning the pair 180 degrees. Today, the pair's growth has continued. The pound not only returned to the 30th figure, but also updated the high of the week. But in this case, macroeconomic statistics have nothing to do with it. The British currency reacts again to Downing Street's policy, which provokes more significant volatility than macro reports. The fact is that Boris Johnson revamps his Cabinet of Ministers today. In particular, Finance Minister Sajid Javid resigned. Initially, the pound reacted with caution to this fact. Javid previously voiced a rather controversial rhetoric regarding the prospects of the negotiation process with Brussels. For example, in Davos, he said that a trade deal with the EU could be concluded before the end of this year, that is, before the end of the transition period. The minister assured those present that the parties will be able to agree on a deal in both trade in goods and services. However, later he rather harshly and categorically assessed the prospects for negotiations. In other words, his departure was not a big loss for GBP/USD traders - neither for bulls, nor for bears. The participants in the foreign exchange market were interested in another question: in which direction does the pendulum of sentiment swing at Downing Street? Why did Johnson decide to "shuffle the cards"? As a result, the market came to the conclusion that the renewed team will work more closely, and this fact will increase the "negotiability" of the government in talks with the Europeans. It also turned out that Johnson had a personal conflict with Javid - for example, the head of the Ministry of Finance rejected the prime minister's request to remove his advisers and replace them with candidates proposed by the government. This incident allegedly became the "last straw", after which Johnson invited him to voluntarily leave the Cabinet. Treasury Secretary Rishi Sunak has been appointed the new Minister of Finance. Previously, he served as chief secretary, but was not a member of the cabinet. Sunak was not caught in "aggressive anti-European" rhetoric, although as a conservative and supporter of Johnson, he adhered to his political course. In general, the market came to the conclusion that Johnson's renewed team will be able to resolve the differences both in the Conservative Party and in the country as a whole. In addition, despite the dismissal of five cabinet ministers, key figures retained their posts. In particular, Foreign Minister Dominic Raab, Minister of the Interior Prity Patel and Minister Michael Gove remained in their posts. Thus, news from the British political front strengthened the pound, although these fundamental factors are short-term. Ahead are very difficult negotiations, which will continue to be accompanied by harsh comments by politicians, both from Brussels and from London. Therefore, the current growth of the pair is just a correction, which at the time of writing these lines has already stalled. Buyers could not overcome the resistance level of 1.3050 (the middle line of the Bollinger Bands indicator on the daily chart), therefore, a retreat to the bottom of the 30th figure is likely in the next day. The material has been provided by InstaForex Company - www.instaforex.com |
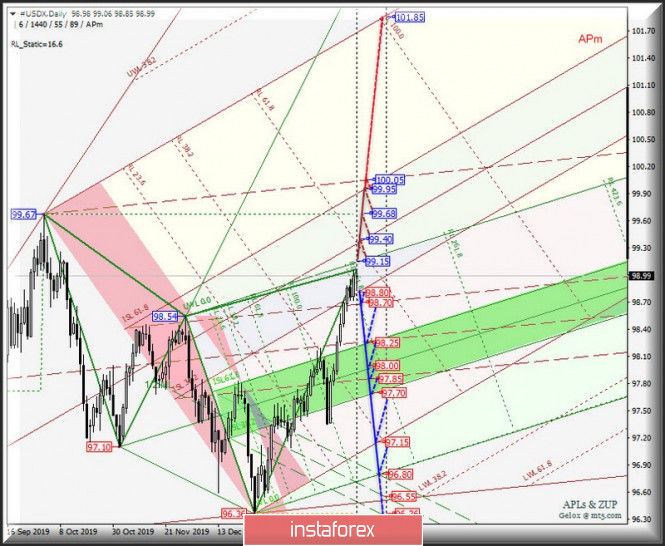
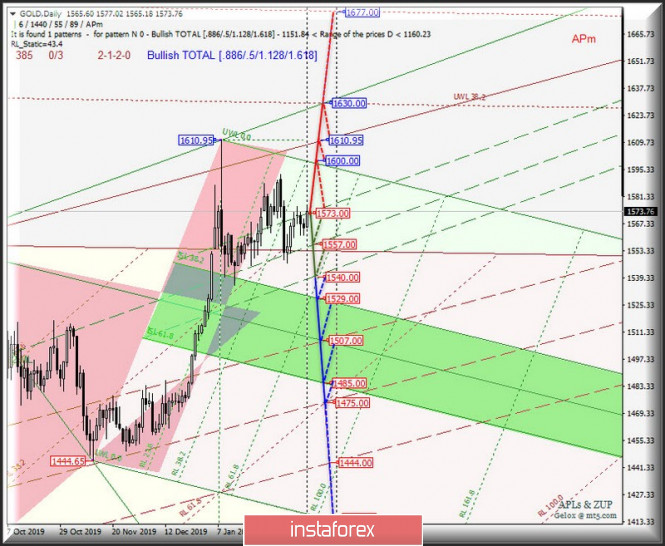
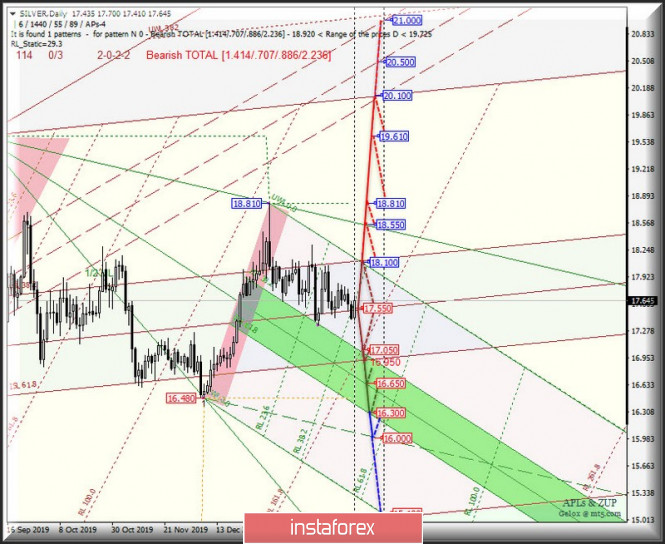
| Posted: 13 Feb 2020 02:51 PM PST People are dying for metal. So, here's Comprehensive analysis of movement options of #USDX vs Gold & Silver (DAILY) from February 14, 2020 Minor (daily time frame) ____________________ US dollar index The movement of the #USDX dollar index from February 14, 2020 will depend on the direction of the breakdown range : - resistance level of 99.15 - of the Minuette operational scale forks; - support level of 98.80 - the lower boundary of the ISL38.2 equilibrium zone of the Minor operational scale forks. . The breakdown of the lower boundary of the ISL38.2 (support level of 98.80) equilibrium zone of the Minor operational scale forks with subsequent breakdown of the upper boundary of the 1/2 Median Line Minor channel (98.70) will determine the development of the movement of the dollar index within the channel 1/2 Median Line Minor (98.70 - 98.25 - 97.85) and equilibrium zones (98.25 - 98.00 - 97.70) of the Minuette operational scale with the prospect of reaching the SSL Minor start line (97.15) and the SSL Minuette start line (96.80). On the other hand, the breakdown of the resistance level of 99.15 on the final line of the FSL forks of the operational scale Minute will make the continuation of the upward movement of #USDX to the targets relevant: - median line Median Line Minor (99.40); - maximum 99.67 ; - the upper boundary of ISL61.8 (99.95) of the equilibrium zone of the Minor operational scale forks; - the final Shiff Line Minor (100.05). The markup of #USDX movement options from February 14, 2020 is shown on the animated chart. ____________________ Spot Gold The development of the Spot Gold movement from February 14, 2020 will be determined by the development and direction of the breakdown of the boundaries of the 1/2 Median Line channel (1540.00 - 1557.00 - 1573.00) of the Minuette operational scale forks. See the details on the animated chart. In case of breakdown of the resistance level of 1573.00 (upper boundary of the 1/2 Median Line Minuette channel), the upward movement of Spot Gold will continue to the goals: - the initial line SSL Minuette (1600.00); - UTL control line (1610.95) of the Minor operational scale forks; - control line UTL (1630.00) of the Minuette operational scale forks. Alternatively, in case of a breakdown of the support level of 1540.00 on the lower boundary of the 1/2 Median Line Minuette channel, it will direct the movement of this instrument to the boundary of the equilibrium zone (1529.00 - 1507.00 - 1485.00)of the Minuette operational scale forks and 1/2 of the Median Line channel (1507.00 - 1475.00 - 1444.00) of the Minor operational scale forks. The details of the Spot Gold movement options from February 14, 2020 are shown in the animated chart. ____________________ Spot Silver The movement of Spot Silver from February 14, 2020 will continue to be determined by working off the boundaries of the equilibrium zone (16.950 - 15.550 - 18.100) of the Minor operational scale forks. Look at the details on the animated chart. In case of breakdown of the upper boundary of ISL38.2 forks of operational scale Minor - resistance level 18.100 - the upward movement of Spot Silver can be continued to the goals: - control line UTL ( 18.550 ) of the Minuette operational scale forks; - local maximums (18.810 - 19.610); - SSL start line (20.100) of the Minor operational scale forks. On the contrary, the breakdown of the lower boundary of the ISL61.8 (support level of 16.950) of the equilibrium zone of the Minor operational scale forks will confirm the further development of the movement of the instrument which will begin to occur already in the equilibrium zone (17.050 - 16.650 - 16.300) of the Minuette operational scale forks with the prospect of reaching the final Schiff Line Minuette (16.000). The details of the Spot Silver movement from February 14, 2020 can be seen on the animated chart. ____________________ The review is made without taking into account the news background. Thus, the opening of trading sessions of major financial centers does not serve as a guide to action (placing orders "sell" or "buy"). The formula for calculating the dollar index : USDX = 50.14348112 * USDEUR0.576 * USDJPY0.136 * USDGBP0.119 * USDCAD0.091 * USDSEK0.042 * USDCHF0.036. where the power coefficients correspond to the weights of the currencies in the basket: Euro - 57.6% ; Yen - 13.6% ; Pound sterling - 11.9% ; Canadian dollar - 9.1%; Swedish krona - 4.2%; Swiss franc - 3.6%. The first coefficient in the formula leads the index to 100 at the starting date - March 1973, when the main currencies began to be freely quoted relative to each other. The material has been provided by InstaForex Company - www.instaforex.com |
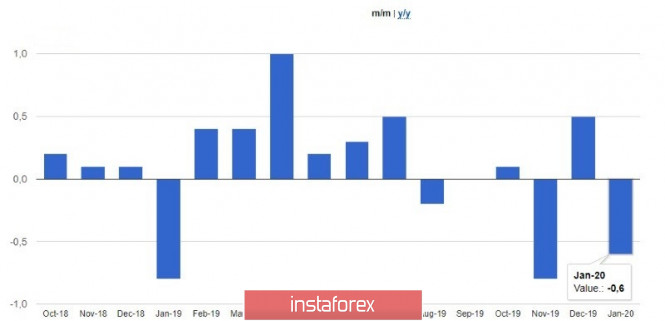
| Posted: 13 Feb 2020 02:50 PM PST The European currency was not very happy with the fact that consumer prices in Germany fell again in January, having justified all the forecasts of analysts, who put on another decline. The main decline in prices was due to a sharp drop in demand for tourism services, and there are reasons for this. According to the statistics agency Destatis, the final CPI of Germany in January 2020 fell by 0.6% compared to December and increased by 1.7% compared to the same period of the previous year. The data fully coincided with the expectations of economists. As for inflation harmonized by EU standards, the index decreased by 0.8% in January compared to December and increased by 1.6% compared to January 2019. As I noted above, the main reason is the sharp decline in prices for travel packages that occurred due to the outbreak of coronavirus in China. After a series of bad indicators released this and that week on the eurozone countries, many economists no longer consider future forecasts for Europe to be too optimistic. However, today, in the first half of the day, after a breakdown of the year's low in the region of 1.0865, the European Commission kept a report from a larger fall of the euro, in which a number of experts expected to see revised forecasts for economic growth and inflation. Let me remind you that the European Commission's previous forecast was presented in November 2019. So, in today's report, the European Commission continues to forecast eurozone GDP growth in 2020 at 1.2% and at a similar level in 2021. But the inflation forecast, on the contrary, was revised for the better. Now economists expect that inflation in the eurozone will be at 1.3% in 2020 against the previous forecast of 1.2%. For 2021, growth is expected at 1.4% against the previous forecast of 1.3%. So far, the main concern that will negatively affect the eurozone economy is coronavirus, which represents a new bearish risk. There is also a fairly high degree of uncertainty surrounding US trade policy, which is an obstacle to improving sentiment. And if the trade agreement between the US and China has somewhat reduced the bearish risks, what will happen when the White House again raises the issue of duties with the eurozone is still a question. The European Commission expects that economic growth will remain stable, and all emphasis is placed on domestic demand, while easing fiscal policies may support the economy in the future. The report also called for eurozone countries to pursue structural reforms aimed at boosting economic growth. As for the technical picture of the EURUSD pair, buyers of risky assets continue to actively fight for the level of 1.0865, having missed that on inflation data in the US, one can only hope for lows in the areas of 1.0840 and 1.0800. If the scenario of profit taking on short positions by large players justifies itself after the data, then the upward correction will be limited by the first intermediate resistance level of 1.0890, but larger highs are seen in the areas of 1.0925 and 1.0950. The material has been provided by InstaForex Company - www.instaforex.com |
| Evening review EURUSD 02/13/2020. Euro continues to fall Posted: 13 Feb 2020 02:50 PM PST The fall in EURUSD intensified after Wednesday released very poor data on industrial production in the eurozone. On Thursday, world markets received a new negative epidemic in China - it turned out that previous data on the spread of the virus were significantly underestimated by the authorities. In fact, there are now 60 thousand infected and 1300 dead from coronavirus. It is not yet clear what exactly is the reason for the euro's fall - perhaps major players consider the eurozone economy more dependent on China than the US or Britain. Perhaps the fall of the euro is reinforced by the break of important support at 1.0880. So far, the fact is that the rest of the world's major currencies do not fall as actively against the dollar as the euro - everything is steady (pound, franc, yen). EURUSD: We hold sales from 1.0990. New sales must be opened with a strong growth to the top - from 1.0940 or higher. The material has been provided by InstaForex Company - www.instaforex.com |
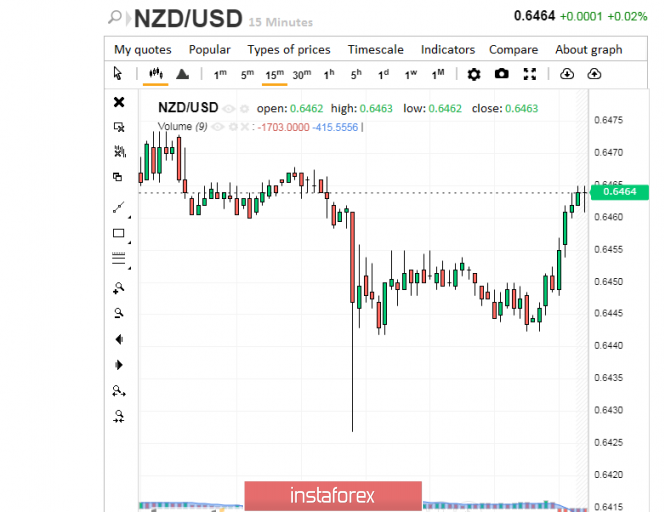
| Posted: 13 Feb 2020 02:50 PM PST The decision of the Reserve Bank of New Zealand (RBNZ) to maintain the interest rate provided significant support to the national currency. The New Zealand dollar, which previously fell, showed signs of growth. Experts believe that such growth will continue for some time. Recall that on Wednesday, February 12, RBNZ left the key rate unchanged at 1%. This rate, adopted in August 2019, is the lowest. The central bank of New Zealand does not see the need to change monetary policy, despite the risks associated with the coronavirus epidemic. According to Adrian Orr, managing director of the RBNZ, at the moment interest rates are low and stimulating, therefore it is not worthwhile to further reduce them because of the potential negative impact on the country's economy. The head of the regulator drew attention to the positive impact on the economy of fiscal measures taken earlier. According to Orr, this contributes to the normalization of current monetary policy and economic growth. According to some investors, maintaining the key rate indicates the likelihood of further tightening of monetary policy. According to the RBNZ's forecasts, an increase in the interest rate is possible if the negative consequences of the coronavirus epidemic do not have a significant impact on economic growth in the country. Keeping the interest rate at the current level had a positive effect on the dynamics of the kiwi. The New Zealand currency strengthened almost instantly, and the NZD/USD pair soared by 50 points. According to analysts, after a prolonged fall from the resistance level of 0.6770, the pair stopped near the level of 0.6377, and then reached the value of 0.6470. According to experts, this is 70 points higher than the kiwi's price at the beginning of trade on Wednesday. On Thursday, February 13, the NZD/USD pair slightly slowed down, falling to 0.6463–0.6464. Experts believe that the breakout of the short-term resistance level of 0.6450 that was recorded yesterday will help keep the NZD/USD pair in the upward trend for a long time. In the event that it goes beyond this level to lower values, expect a downward spiral in the NZD/USD pair. However, experts are counting on the implementation of another scenario: in this case, the NZD/USD pair will be able to rise to the level of 0.6525 and continue to grow to the level of 0.6535. This will be the finest hour of the kiwi, analysts said. The material has been provided by InstaForex Company - www.instaforex.com |
| February 13, 2020 : EUR/USD Intraday technical analysis and trade recommendations. Posted: 13 Feb 2020 08:40 AM PST
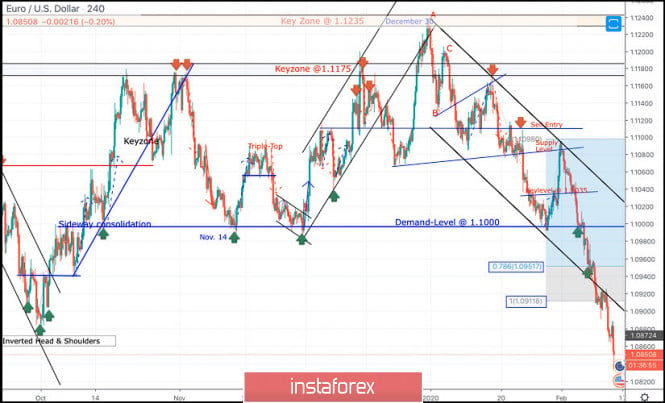
On December 30, a bearish ABC reversal pattern was initiated around 1.1235 (Previous Key-zone) just before another bearish movement could take place towards 1.1100 (In the meanwhile, the EURUSD pair was losing much of its bearish momentum). One more bullish pullback was executed towards 1.1175 where the depicted key-zone as well as the recently-broken uptrend were located. That's why, quick bearish decline was executed towards 1.1100 then 1.1035 which failed to provide enough bullish SUPPORT for the EURUSD pair. Further bearish decline took place towards 1.1000 where the pair looked quite oversold around the lower limit of the depicted bearish channel where significant bullish rejection was able to push the pair back towards the nearest SUPPLY levels around 1.1080-1.1100 (confluence of supply levels (including the upper limit of the channel). Since then, the pair has been down-trending within the depicted bearish channel until this week when bearish decline went further below 1.0950 and 1.0910 (Fibonacci Expansion levels 78.6% and 100%) establishing a new low around 1.0835. Currently, the EUR/USD pair looks quite overpriced after such a long bearish decline and if bullish recovery is expressed above 1.0870, further bullish advancement would be expected towards 1.0910 then 1.0950. That's why,Intraday traders are advised to look for signs of bullish recovery around the current price levels of (1.0830) as a valid intraday BUY signal. On the other hand, bearish persistence below 1.0830 may enable more bearish decline towards 1.0805 even down to 1.0755. The material has been provided by InstaForex Company - www.instaforex.com |
| February 13, 2020 : GBP/USD Intraday technical analysis and trade recommendations. Posted: 13 Feb 2020 08:10 AM PST
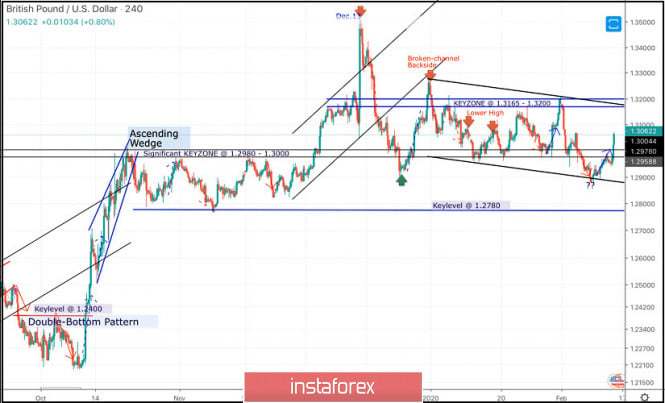
Recently, new descending highs were recently demonstrated around 1.3200 and 1.3080. However, temporary signs of bullish rejection were manifested around 1.2980-1.3000 before obvious bearish breakdown could occur. Intraday technical outlook was supposed to remain bearish as long as the pair maintained its movement below 1.3080 (the most recently-established descending high). Bearish breakdown below 1.2980 enhanced further bearish decline towards 1.2890 where Intraday traders were advised to watch price action carefully (the lower limit of the movement channel while the pair is being oversold). Since Monday, signs of bullish rejection have been expressed allowing the current bullish pullback to pursue towards 1.3000 which failed to offer any bearish resistance. Instead, bullish breakout above 1.3000 is enabling further bullish advancement towards 1.3100 and probably 1.3200 where the upper limit of the channel comes to meet the pair. This extensive bullish movement will probably occur provided that the current price level around 1.3080 gets breached to the upside soon enough. On the other hand, please note that any bearish decline towards the depicted demand-level (the lower limit of the channel @ 1.2890) will probably fail to provide bullish support for the pair this time. The material has been provided by InstaForex Company - www.instaforex.com |
| Crude Oil analysis for 02.13.2020 - Buying opportutnieis preferrable with the main target at 52.50 Posted: 13 Feb 2020 05:38 AM PST Technical analysis:
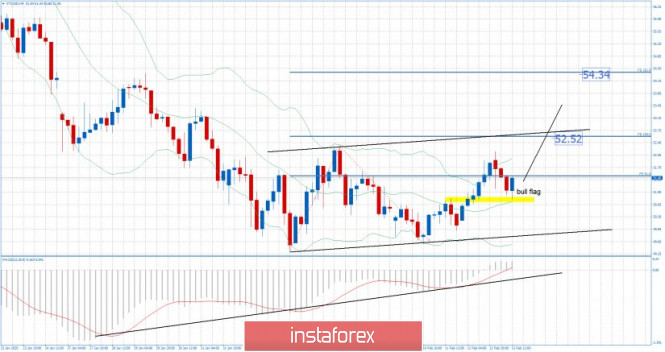
Crude Oil did setup perfect bull flag of the middle Bollinger band, which is good sign for the further upside movement. I expect further upside movement towards the levels at 52.50 and 54.30. Buying the dips on 1h-4H seems like great strategy according to the current condition. MACD oscillator did show big decreasing in momentum to the downside in the background and bull divergence, which is confirmation for our long bias. Resistance levels are set at 52.20 and 52.50 Short-term support levelis set at 50.80 The material has been provided by InstaForex Company - www.instaforex.com |
| Posted: 13 Feb 2020 05:27 AM PST Technical analysis:
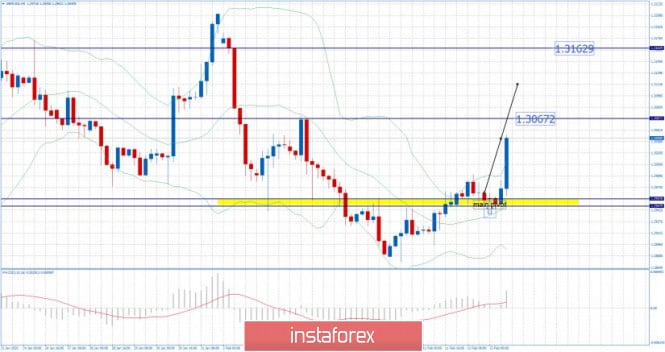
GBP did spike up to the level of 1.3050 and its heading towards our main upward target from yesterday at the price of 1.3067. My advice is still to watch for buying opportunities on the dips with the main targets at 1.3067 and 1.3162. You can exit half of the position at the current level and wait even 1.3162. MACD oscillator is showing big increase in the momentum to the upside, which adds good confirmation to our bullish view. Resistance levels are set at the price of 1.3067 and 1.3162 Support level is set at the price of 1.2650. The material has been provided by InstaForex Company - www.instaforex.com |
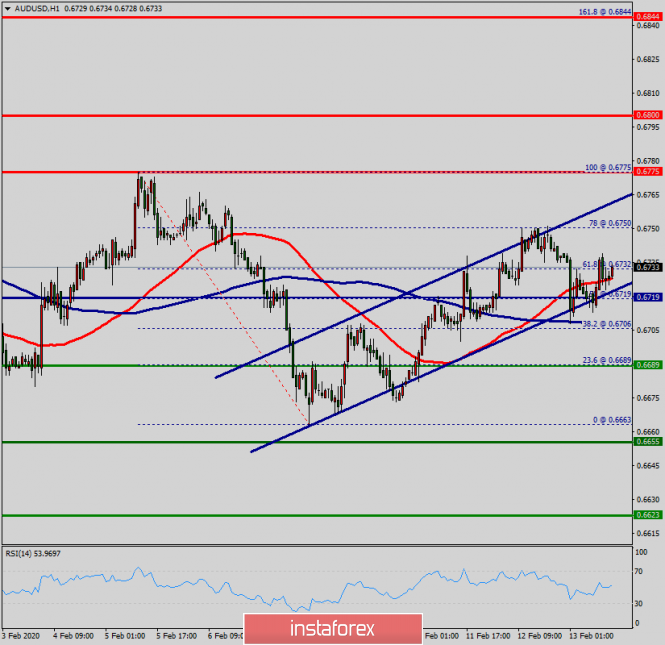
| Technical analysis of AUD/USD for February 13, 2020 Posted: 13 Feb 2020 05:17 AM PST Overview: The pair is trading below its pivot point. It is likely to trade in a lower range as long as it remains below the pivot point. The pivot point stands at 0.6719. The AUD/USD pair continues to move downwards from the level of 0.6775, which represents the double top in the H1 chart. The pair dropped from the level of 0.6775 to the bottom around 0.6663. Today, the first resistance level is seen at 0.6775 followed by 0.6800, while daily support is seen at the levels of 0.6689 and 0.6655. According to the previous events, the AUD/USD pair is still trapping between the levels of 0.6655 and 0.6775. Hence, we expect a range of 120 pips in coming hours. The first resistance stands at 0.6775, for that if the AUD/USD pair fails to break through the resistance level of 0.6775, the market will decline further to 0.6689. This would suggest a bearish market because the RSI indicator is still in a negative area and does not show any trend-reversal signs. The pair is expected to drop lower towards at least 0.6689 in order to test the second support (0.6655). Short positions are recommended with the first target at 0.6689. A break of that target will move the pair further downwards to 0.6655 . On the contrary, if a breakout takes place at the resistance level of 0.6820 (the double top), then this scenario may become invalidated. The material has been provided by InstaForex Company - www.instaforex.com |
| Posted: 13 Feb 2020 05:13 AM PST Industry news:
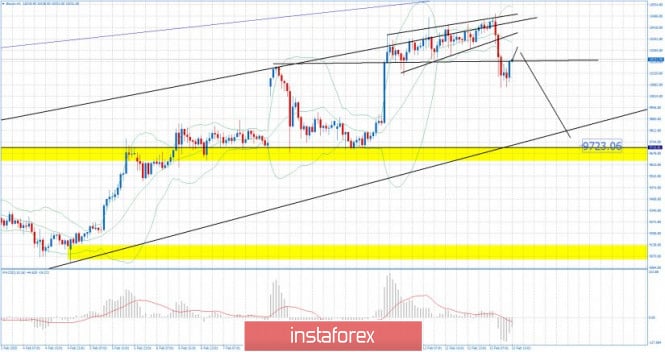
In 2019, the total volume of nine leading blockchain networks reached 10 billion US dollars, which is 158.5% of the values of 2018. At the same time, the number of active DApp users doubled in 2019 and reached 3.11 million, 89% of which are newcomers. On the one hand, this is excellent statistics: user awareness and engagement are increasing, but there is a problem with their return. Nowadays every second DApp is a representative of the gambling sector and it's the only type of DApp having over 1 million new users. Why did this happen and will this trend change in the near future? The gambling sector will likely continue to occupy one of the leading positions in this market. However, its main competitors are already clearly visible. Financial services such as lending DApps showed the greatest progress in 2019: the number of their users increased by 610% (while the number of gambling users increased by half less - 372%), transaction volume grew by 251% (the volume of gambling DApps increased by 98%). Such progress allowed finance DApps to become the second-largest sector of the whole DApp ecosystem. Technical analysis: BTC has been trading downwards as I expected yesterday. I found the breakout of the support trendline in the background and new momentum down on the oscillator, which is sign that sellers became active. Watch for selling opportunities and potential rotation down towards the $9.725.. MACD oscillator is showing increasing on the selling power, which adds confirmation for further downside. Major resistance is set at the price of $10.500 Support level and downward target is set at the price of $9.725. The material has been provided by InstaForex Company - www.instaforex.com |
| Will gold come out of the shadow of the dollar? Posted: 13 Feb 2020 05:13 AM PST Everything is mixed up in the financial market! Despite the panic over the coronavirus, US stock indices are rewriting historical highs, the MSCI index of world stocks is moving steadily upward, and gold ignores the strong dollar and intends to return above the mark of $1,600 per ounce. Only oil is experiencing serious problems due to slowing Chinese demand. The market is full of paradoxes because the S&P 500 rally is usually identified with an improvement in global risk appetite, and what increase in interest in profitable assets can we talk about if the rate of growth of global GDP risks a serious decline? Dynamics of assets
The fact that investors do not know what to do is evidenced by the situation in the futures market and the ETF market. If the reserves of specialized gold-oriented exchange-traded funds rewrote the historical maximum, increasing by 61.7 tons in January, according to the World Gold Council, speculators, on the contrary, reduced the net long positions on the precious metal to a two-month low. Most likely, they were scared by the strong dollar and US stocks. And this makes sense. Traditionally, both gold and the dollar are perceived as safe-haven assets, but if the US economy is strong and demand for assets issued in the States is high, the US currency pulls the blanket over itself. That is, it tries to take away the status of asylum from the precious metal. Something similar is happening now. Jerome Powell, in his speech to Congress, said that there is no reason to believe that the most record-breaking economic expansion in the United States, which is already in its 11th year, will stop. Due to the low share of exports to China and Asia as a whole in GDP, Americans will not experience serious pain due to the coronavirus. For Germany and the eurozone, it is scarier than for the US. Share of Chinese and Asian exports in GDP
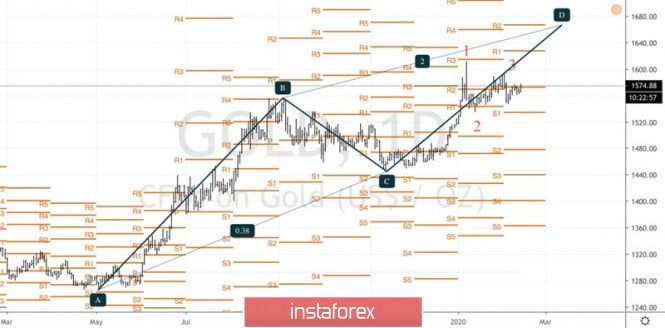
Add to this the S&P 500's relentless rewriting of historical highs, and the reasons for capital inflows to the New World and the associated strength of the dollar will become clear. Gold is still content with leftovers from the table of the "American", however, as soon as the macro statistics for the States begin to disappoint, the "bulls" for XAU/USD will get a new reason to attack. In this regard, the releases of data on inflation and US retail sales deservedly attract the attention of investors. In my opinion, there is such an element in the rally of American stock indices as the desire of speculators to jump into the last car of the train going North. The economy is slowing, the Fed has no intention of cutting rates, and a strong dollar is dragging down corporate profits. The S&P 500 correction will be a major catalyst for the upward trend in gold. Technically, the bears' inability to break below the resistance at $1540-1550 per ounce and activate the 1-2-3 reversal pattern was a sign of their weakness. The bulls are trying to seize the initiative and to continue the rally in the direction of the 200% target on the AB=CD pattern, they need to storm the resistance at $1595. Gold, the daily chart
|
| Posted: 13 Feb 2020 04:46 AM PST EUR/USD – 24H.
EUR/USD – 4H.
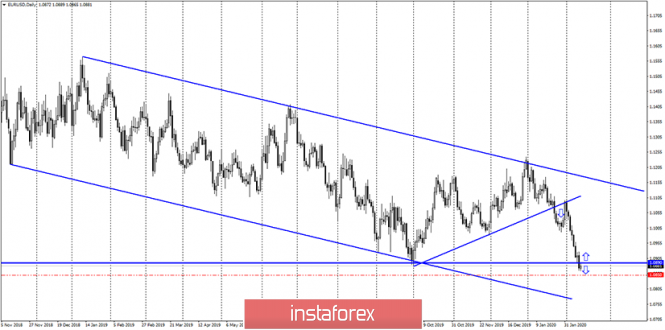
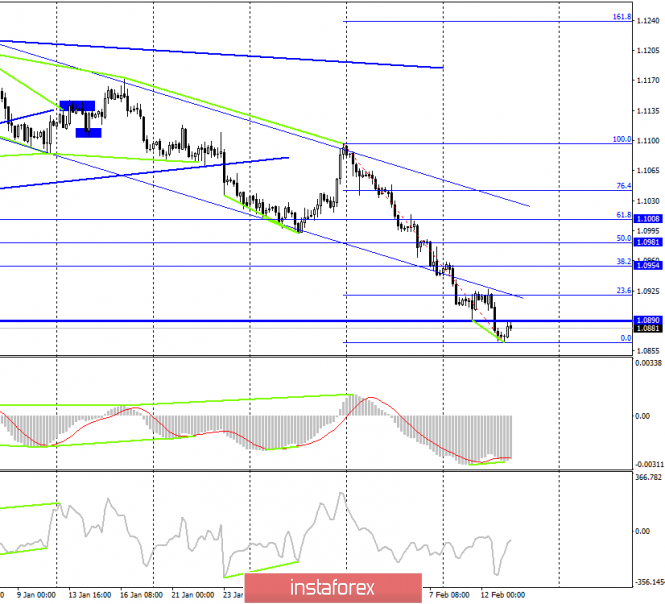
Good day, dear traders! The current situation is as follows. On the two most important time charts, descending trend corridors are clearly visible. On the 4-hour chart, the pair's quotes even closed under the lower border of the corridor. This means only one thing: the "bearish" mood is fully preserved for the euro/dollar pair. In such circumstances, it is not entirely appropriate to open buy orders despite the fact that the signals can be very attractive. For example, on the 4-hour chart, there is a signal from the bullish divergence of the MACD indicator, which allows you to count on a reversal in favor of the European currency and some growth in the direction of the corrective levels of 38.2% (1.0954), 50.0% (1.0981) and 61.8% (1.1008). However, as last time, bear traders can safely continue to sell the European currency if the information background remains as weak for the euro currency. Today, the report on inflation in Germany did not please traders, although it did not disappoint since the indicator coincided with the forecast - 1.7% y/y and -0.6% m/m. In the second half of the day, a report on US inflation is expected, which in case of its weakness can support bull traders. However, traders may open any purchase orders in the current situation at their own risk. On the 24-hour chart, on February 12, the EUR/USD pair closed under the important support of 1.0890, which increases the probability of a further drop in quotes to the lower border of the downward trend corridor. Forecast for EUR/USD and trading recommendations: The trading idea is to buy the euro with the targets of 1.0954 and 1.0981. However, I must say that the trading idea is counter-trend, which means that it has increased risks. Stop Loss - short - below the level of 0.0% (1.0864), the potential profit can be many times greater than the possible losses. Alternative option: closing below the Fibo level of 0.0% will allow small sales "on trend". Watch out for the US inflation report! The material has been provided by InstaForex Company - www.instaforex.com |
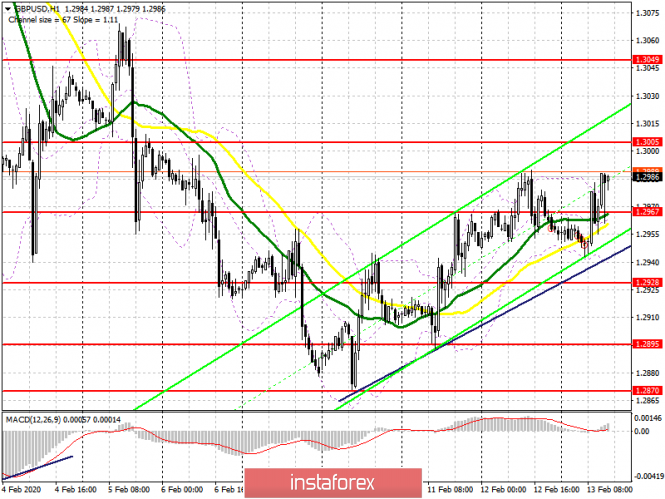
| Posted: 13 Feb 2020 04:46 AM PST To open long positions on GBPUSD, you need: The upward trend is maintained. In the morning review, I paid attention to the level of 1.2967, which was a serious obstacle in the way of buyers of the pound. The test and breakdown of this area in the first half of the day was a clear signal to buy and continue the growth of the pound, which I paid attention to in my morning forecast. While trading is conducted above the range of 1.2967, and the confirmation of the presence of buyers was its top-down test on the volume in the first half of the day, you can expect to continue strengthening the GBP/USD with the release of new highs in the area of 1.3005 and 1.3049, where I recommend fixing the profits. Only very good data on inflation in the US can break the upward trend, and only a return to the support of 1.2967 will lead to a downward correction of the pair. In this case, it is best to open new long positions at the lower border of the ascending channel in the area of 1.2928 or buy the pound immediately on a rebound from the minimum of 1.2895. To open short positions on GBPUSD, you need: Sellers of the pound missed the level of 1.2967, which breaks all hope for a decline in the pair and a reversal of the upward correction in the short term. Only the formation of a false breakdown in the resistance area of 1.3005 in the second half of the day will be a signal to open short positions, otherwise, it is best to wait for the test of the highs of 1.3049 and 1.3102, and sell the pound from there immediately on the rebound. An equally important task will be the return of GBP/USD and consolidation under the support level of 1.2967, which will once again increase the pressure on the pound and lead to an update of the lows of 1.2928 and 1.2895, where I recommend fixing the profits. Signals of indicators: Moving averages Trading is conducted above the 30 and 50 daily averages, which indicates the likely formation of an upward correction of the pound. Bollinger Bands A break of the upper border of the indicator in the area of 1.2990 will lead to a new wave of pound growth.
Description of indicators
|
| Posted: 13 Feb 2020 04:43 AM PST GBP/USD – 4H.
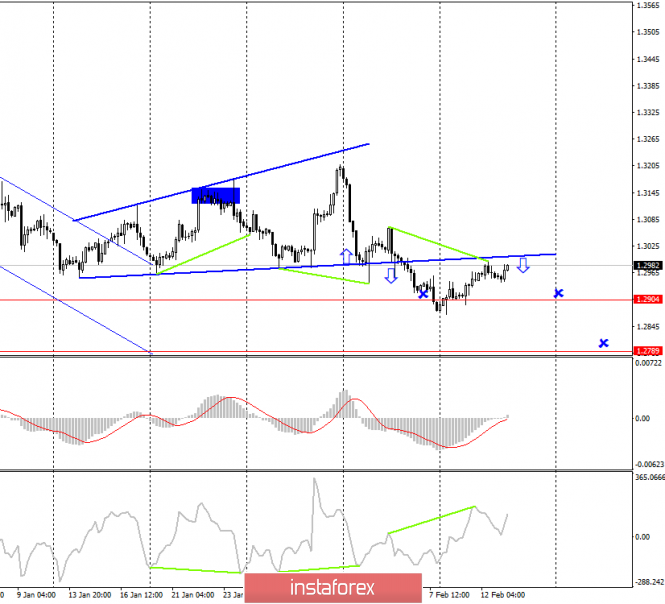
Good day, dear traders! As seen on the 4-hour chart, the "Briton" performed a reversal in favor of the US dollar after the formation of a bearish divergence in the CCI indicator, however, a long-term drop in quotes did not work. The growth process has been restored in the direction of the global correction line, from which I expect a rebound with the resumption of the fall in the direction of the low levels of 1.2904 and 1.2789. The same report on US inflation that I mentioned in the EUR/USD survey will also have a high value for the GBP/USD pair. Strong US inflation will trigger new sales from bear traders. Thus, it turns out that the euro and the pound may show a high degree of correlation during today's day, and much will depend on the information background from America. Weak data will allow traders to expect the pair to continue growing and close above the correction line, which will further increase the chances of further growth of the pound. Forecast for GBP/USD and trading recommendations: The new trading idea is to sell the pound with targets of 1.2904 and 1.2789 when rebounding from the correction line (marked with a down arrow). If this condition is met, I recommend selling the pound/dollar pair again. The material has been provided by InstaForex Company - www.instaforex.com |
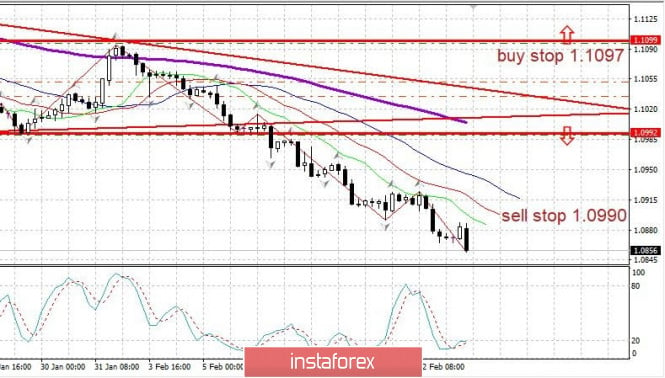
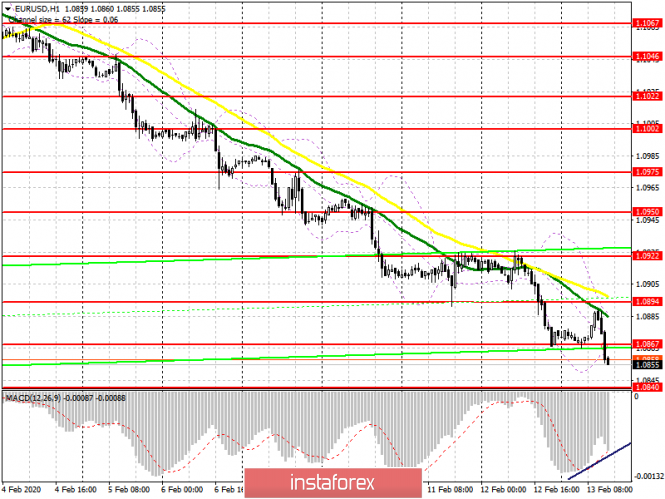
| Posted: 13 Feb 2020 04:35 AM PST To open long positions on EURUSD, you need: Even in the morning forecast, I drew attention to the German inflation report, which indicated a decline in the consumer price index in January of this year, which completely coincided with the expectations of economists. A failed attempt by buyers to regain the level of 1.0894 turned into a sale of the euro, which led to a breakdown of the support of 1.0867 and a test of another annual low. The primary task of the bulls in the second half of the day will be the formation of a false breakdown in the area of 1.0867 and the divergence that is formed on the MACD indicator can help in this. In the scenario of a return of 1.0867, which may occur after the US inflation data, you can count on a repeat test of the daily maximum of 1.0894, and then a larger jump of the euro up to the area of 1.0922, where I recommend fixing the profits. If the pressure on the euro persists in the North American session, then it is best to look at purchases at the test of the minimum of 1.0840 or open long positions immediately for a rebound from the area of 1.0804. To open short positions on EURUSD, you need: Sellers waited for the next weak data on the European economy and continued to push the euro down by using the level of 1.0894. The report of the European Commission, in which the forecasts remained unchanged, did not help buyers much. Currently, the bears are trying to gain a foothold below the minimum of 1.0867, which may lead to a larger sale of the euro in the area of 1.0840 and 1.0804, where I recommend taking the profits. However, as I mentioned in the morning forecast, all the attention will be paid to data on US inflation available to the big players, and with good indicators to take profits on short positions in EUR/USD, which will lead to a rebound in the pair. When the resistance returns to 1.0867, it is best to consider short positions from the daily high of 1.0894 on a false breakdown or sell immediately on a rebound from 1.0922. It is also difficult to expect a large drop below 1.0867 due to the emerging divergence on the MACD indicator, which may indicate the end of a short-term downward trend. Signals of indicators: Moving averages Trading is conducted below the 30 and 50 moving averages, which indicates a further decline in the euro trend. Bollinger Bands The bears have tested the lower limit of the indicator, and the market is still under their control.
Description of indicators
|
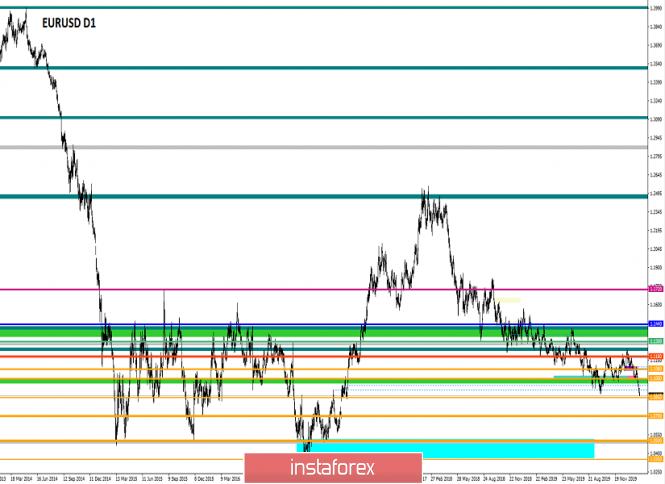
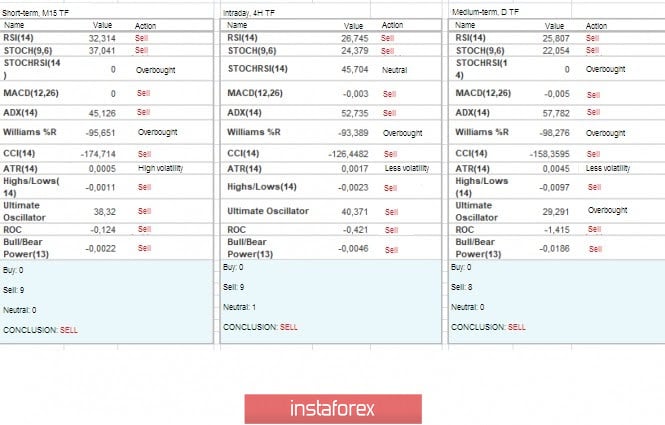
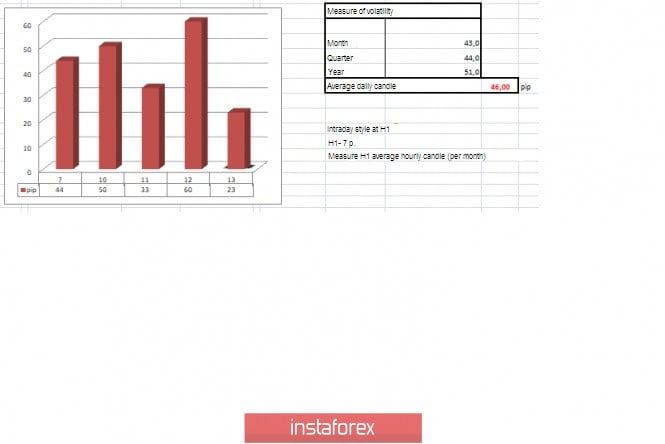
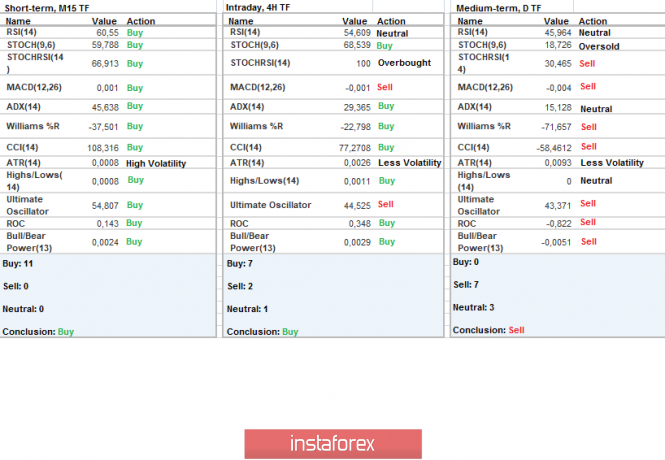
| Trading recommendations for the EURUSD pair on February 13 Posted: 13 Feb 2020 04:35 AM PST From a comprehensive analysis, we see a breakdown of the 2019 minimum, where the quote managed to be fixed below the value of 1.0879, and now about the details. So, this is the moment when the oblong correction was fully worked out, which lasted almost 4.5 months. During this time, many traders have lost faith in the original trend, even though their judgment was wrong in the end. Is it worth waiting for the continuation of the banquet? Yes, it's worth it and we already wrote about this in the previous review. Here we should not rush to conclusions since the characteristic pressure from psychological ranges cuts all rash speculative interest to the root. In this case, we should work with the entire external background that is gathering in the vast eurozone. It is about the deterioration of macroeconomic indicators, paired with the pressure of the information background. In this case, the technical component will play an excellent role as a sight, where exactly we will go down. If we talk about high, then we have ambitious plans for reducing, so special attention is paid to the following ranges: 1.0700/1.0850; 1.0500/1.0700; 1.0000//1.0350//1.0500, where the price will consistently interact with the cardinals, forming certain amplitudes. There is no need to wait for a fleeting descent or reaction in the next few days and this prospect is for the whole of 2020 if our theory is fulfilled. At the same time, no one can guarantee that the quote will fall as low as 1.0000, where everyone will give one euro for one dollar. Also, there is a fine line of geopolitics, and only the market knows how the leaders will behave in this situation. All that remains for us is to observe from the side and skim the cream at the right time, which we have been doing for a long time. In terms of volatility, we see a characteristic acceleration, about 30% relative to the daily average and 88% compared to the day before. In this case, the acceleration is due to the final breakdown of the minimum of 1.0879. Analyzing the trading chart every minute, we see that the quote moved conditionally horizontally for 45 hours, having a variable range of 20-30 points, where there was an acceleration in the end, which broke the last year's minimum of 1.0879. You can understand how much pressure was on market participants if we stayed in the same place for almost two days. The minimum was still passed, which means that it is still possible, including visits to the psychological ranges. Details: 45 hours stagnation - 1.0905/1.0925; Acceleration - 16:30-21:00 (12.02.20); the minimum mark during the breakdown - 1.0865. As discussed in the previous review, traders mostly fixed previously opened short positions at the moment of 45-hour standstill due to the risk of a rebound from a minimum of 1.0879. The subsequent gulf in short positions was expected at the time of the passage of the area of 1.0880-1.0850. At the same time, speculators could not miss such a long stagnation and waited for such a development. For this reason, we emphasize trading on the breakdown, which brought a little profit. Looking at the trading chart in general terms (the daily period), we see that the quote is on the verge of collision with psychological ranges, where the values of 2017 have already been set. The news background of the previous day was absent in terms of statistics from Europe and the United States. In terms of the general information background, we have interesting facts about the long-term prospects of the European economy. So, following a recent statement by the head of the European Commission, Ursula von der Leyen, Brexit will form a hole in the European budget of 75 billion euros in the period between 2021 and 2027. At the same time, the head of the European Central Bank (ECB), Christine Lagarde, speaking in the European Parliament the other day, spoke about the side effects of the ECB's soft monetary policy, which negatively affects the income from savings and pushes up asset prices. "We are fully aware that a low interest rate environment affects savings income, asset valuations, risk appetite, and house prices. The ECB is closely monitoring the potential for negative side effects so that they do not negate the positive impact of our measures on credit conditions, job creation and wages," said Christine Lagarde. The head of the ECB also called on the governments of the eurozone to take measures to stimulate economic recovery. I think you understand everything. The foundation is on the downward trend side. Today, in terms of the economic calendar, we have data on inflation in the United States, which is projected to grow from 2.3% to 2.4%. In fact, this is a signal that the Fed will not lower the rate. USA 14:30 London time - Inflation Further development Analyzing the current trading chart, we see that after a slight fluctuation, the quote returned to the minimum of the previous day, while showing a desire to resume the downward course. In fact, the breakdown of the value of 1.0865 is a convention. And we are more interested in the coordinates of 1.0850 since fixing (H4) behind its aisles would give a signal about furthermore significant progress. Detailing the available period every minute, we see that the overnight consolidation of 1.0865/1.0876 was initially broken in the upward direction, which was quite normal due to the regrouping of trade forces, paired with data on inflation in Germany. After that, everything returned to normal, where a small impulse moves us again at the minimum values. In terms of the emotional mood of market participants, we see not just a speculative mood but a general one, where new prospects opened up due to the breakdown of the 2019 minimum, followed by market excitement. In turn, traders are waiting for the price to be fixed below the value of 1.0850 since there will be good prospects for a decline. It is likely to assume that the characteristic pressure will torment market participants, and there is no escape from it, even after the breakdown of the mark of 1.0850. Now we are more interested in how the quote will behave, how long the fixing process will take, and when we will see the passage of the mark of 1.0850. You understand that everyone is at a low start, and the prospects are considerable, as well as the possible income. Based on the above information, we will output trading recommendations: - Buy positions will be considered in case of local jumps, which will be interesting for speculators. The possible entry point is 1.0900, with a perspective of 1.0925. - We consider selling positions if the price is fixed below 1.0850 (H4), the main positions. Speculative positions from 1.0864 to 1.0850. Indicator analysis Analyzing different sectors of timeframes (TF), we see that the indicators of technical instruments unanimously signal sales, thus reflecting the general background of the market. Volatility for the week / Volatility Measurement: Month; Quarter; Year. The volatility measurement reflects the average daily fluctuation, based on the calculation for the Month / Quarter / Year. (February 13 was based on the time of publication of the article) The volatility of the current time is 23 points, which is a low value but everything is just beginning. It is likely to assume that against the background of the accumulation, as well as data on inflation in the US, we can see a local acceleration with a rise in volatility. Key levels Resistance zones: 1.0900/1.0950**;1.1000***; 1.1080**; 1.1180; 1.1300**; 1.1450; 1.1550; 1.1650*; 1.1720**; 1.1850**; 1.2100. Support zones: 1.0879*; 1.0850**; 1.0500***; 1.0350**; 1.0000***. * Periodic level ** Range level *** Psychological level ***** The article is based on the principle of conducting a transaction, with daily adjustments. The material has been provided by InstaForex Company - www.instaforex.com |
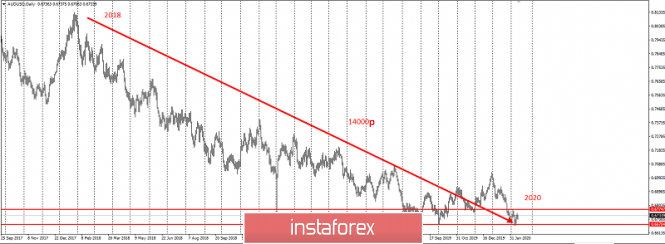
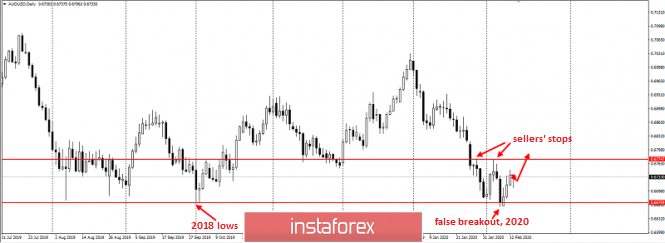
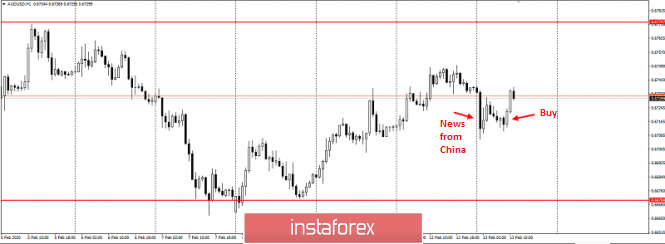
| Posted: 13 Feb 2020 02:31 AM PST Good day, dear traders! I present you, a trading idea for AUD/USD. Perhaps, AUD/USD is currently the most oversold instrument of all the "majors". This is because it has passed more than 1400p since the end of 2018: Recently though, it has been showing a slowdown, updating the January highs with a false breakout, and exposing the target in the footsteps of sellers - a platform near the level of 0.67800: Today, against the background of news from China regarding the increase in the number of victims of the coronavirus, the AUD/USD pair sank during the European session. It compensated losses, indicating a bullish sentiment: This is probably the only trading instrument sensitive to Chinese news, as it has reacted this way (compared to gold and oil). We recommend you to look attentively at the longs, in order to break the level of 0.67800. Good luck in trading and control your risks! The material has been provided by InstaForex Company - www.instaforex.com |
| Posted: 13 Feb 2020 02:16 AM PST
At the beginning of the year, many experts predicted the weakening of the American currency and bet on the growth of EUR / USD against the background of a cease-fire in the trade war between the US and China, hopes for the recovery of the global and European economies, as well as expectations for the ECB's departure from a super soft monetary policy. However, the fall in the Euro against the US dollar in the past six weeks has cast doubt on these forecasts. When everything is relatively calm in the world, exchange rates are sensitive to the monetary policy of central banks. When some external stimulus appears, they begin to assess the degree of stability of the national economy to its effects. In this regard, the year 2019 is indicative. Even against the background of a more aggressive easing of the Fed's monetary rate compared to the ECB, the greenback strengthened against the euro due to the reluctance of the American economy to cave in under the weight of the trade war in Washington and Beijing, which was particularly expressed in the steady growth of US stock indices. The Eurozone could not boast of this. A similar picture is observed now, where only the conflict in the Middle East took the place of the stimulus, and then the outbreak of coronavirus in China. According to the calculations of Deutsche Bank specialists, the economic growth in China during the first quarter will slow down by 1.5%, to 4.6% due to the epidemic. World GDP is short of 0.5%, and Germany will lose more than the United States, given the degree of influence of the Chinese economy on the German. Everyone remembers what happened to the latter due to the impact of trade wars. German GDP for the fourth quarter of 2019 will be released next Friday. Deutsche Bank predicts that the country's economic growth in the reporting period, as well as in the next quarterly quarter, will be negative, and this is already a technical recession. Accordingly, such economic statistics should force the ECB to go for additional stimulation, which is not the best news for the euro.
If the coronavirus reaches its peak in February, then in March-April everyone will safely forget about it, and the Chinese GDP will accelerate sharply in the second quarter. However, in the short term, the eurozone economy will continue to receive negative from the epidemic, which creates the preconditions for a further reduction in EUR / USD. The European Economic Surprise Index has reached its lowest level in the last four months, while its American counterpart is at its five-month peak. We need not wonder why the fall of the main currency pair reached below 1.09. "The euro will only be able to sustainably strengthen after the eurozone economy shows more concrete signs of recovery," Wells Fargo's currency strategists said. They revised the forecast for EUR / USD at the end of the first quarter of 2020 downward from 1.1200 to 1.0900. The day before, the euro against the US dollar sank to its lowest level since May 2017 in the region of 1.0870. "Technical analysis hints at the continuation of the bearish trend in the specified currency pair in the short term," Wells Fargo noted. According to experts, a pause in the monetary policy of the Fed, as well as the fact that the economic prospects for the rest of the world look much more complicated than for the US, support the dollar. Thus, until the euro fans have serious arguments to return to the idea of restoring the global and European economies, no one will guarantee that the main currency pair will not renew its three-year lows. Obviously, no one wants to "catch falling knives." Only an increase in EUR / USD above 1.0980 will bring the "bulls" to life. The material has been provided by InstaForex Company - www.instaforex.com |
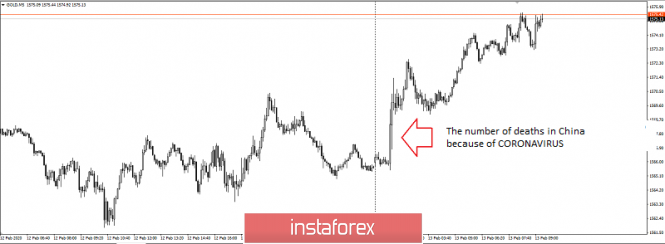
| Scary news from China unfurled gold Posted: 13 Feb 2020 01:32 AM PST Chinese authorities have reported a new outbreak of coronavirus infection in Hubei Province, as well as an increase in the number of deaths associated with this virus. According to experts, the number of newly infected in Hubei province has increased to almost 15,000 people. This outbreak occurred exactly after the Director-General of the World Health Organization, Dr. Tedros Adhanom Ghebreyesus announced "stabilization" of the growth in the number of new infected coronavirus infections in China. Normally, such news cannot be overlooked by the market. Yesterday, against the background of the stabilization of the situation with the Chinese epidemic, we recommended selling gold, but at night on the news, gold added in the price: We recommend that you refrain from long positions until the evening news on inflation in the USA: Success in trading and control the risks! The material has been provided by InstaForex Company - www.instaforex.com |
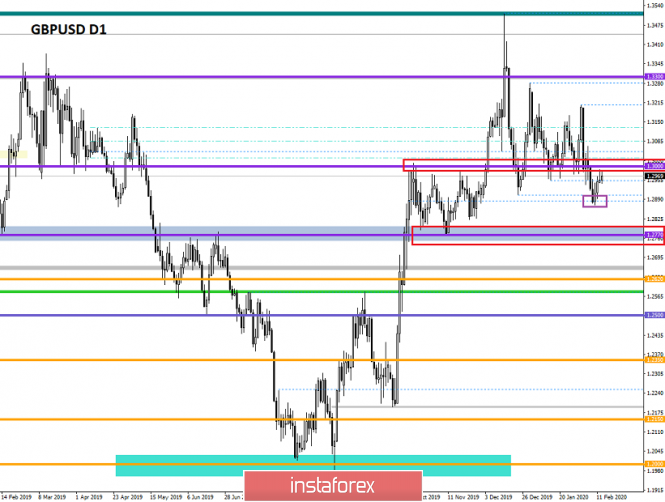
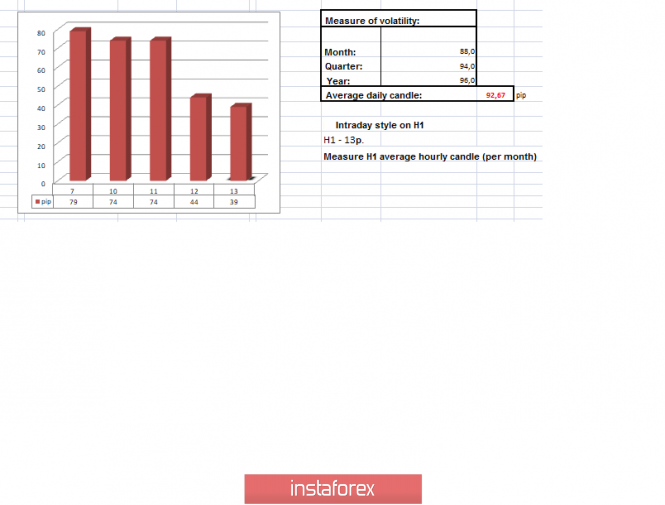
| Trading recommendations for the GBP/USD pair on February 13 Posted: 13 Feb 2020 01:26 AM PST From the point of view of a comprehensive analysis, we see the price movement within the established framework, where the concentration of trading forces reached its destination, and now, let's discuss the details. After changing the clock component, the quote declined into the scope of the earlier fluctuation 1.2770 // 1.2885 // 1.3000, where the amplitude between the middle level and the upper border was chosen due to fixing. Thus, we were ready for this development on Monday [February 10], predicting this kind of oscillation, since changing the clock component is not an easy task and we need an initial platform. The first round was obtained, that is how many traders reason, considering the oscillation between the two coordinates [1.2885 // 1.3000]. In fact, everyone is preparing for more significant changes than the breakdown of the psychological level of 1.3000. In theory, there is a decline to the border of 1.2770, as a minimal prospect, in an ideal plot, restoration is considered relative to the medium-term upward trend. We discussed this development theory in a previous review where the global trend was taken as the basis and where downward interest is invariably maintained. At the same time, the fundamental component has a considerable number of signals that confirm the theory of a downtrend. The most significant factor is the decrease in the interest rate, which will soon move off the ground, but we also have a long process of economic transition after Brexit, which will not have the best effect on the economy, which, as a fact, will affect the English currency. An interesting point is that, we see a similar situation as we analyze the EUR/USD currency pair. The downward trend has been and remains on the market, and thus, there is a positive correlation between trading instruments. For a general understanding, I advise you to read my previous article on the euro. In terms of volatility, we see a slowdown, where at first we encountered an anomaly in the form of the same indicators, and then a sharp decline in activity to 44 points. In fact, we have confirmation of fixing quotes in a new phase, where the process is not so fast, but changing cycles is not an easy task. Details of volatility: Thursday - 131 points; Friday - 125 points; Monday - 215 points; Tuesday - 105 points; Wednesday - 112 points; Thursday - 79 points; Friday - 79 points; Monday - 74 points; Tuesday - 74 points; Wednesday - 44 points. The average daily indicator relative to the dynamics of volatility is 92 points [see table of volatility at the end of the article]. Detailing the past minute by minute, we see a local rapprochement with the level of 1.3000, where the price did not reach the control value of some 10 points. The subsequent fluctuation was in terms of developing, returning the quote almost to the opening point. Moreover, activity was low and almost no local bursts were noticed. As discussed in the previous review, traders adhere to strategic positions for sale, where there are still no large volumes, since everything is just beginning and there is a risk of failure of the recovery theory. Speculators, in turn, continue to work at local races, where the past day was relatively calm compared to the days earlier. Considering the trading chart in general terms [the daily period], we see that there are still a considerable number of points before the recovery status. At the same time, the quote is still concentrated within the area of the previous measure. The news background of the past day did not have statistical data for Great Britain and the United States, thereby emphasizing the technical part. In terms of the general informational background, we see continued noise regarding the transitional period of Brexit, where the parties, even before the start of negotiations, tighten their positions, which leads to a wave of fear among investors. This factor exerts both direct and indirect pressure on the pound sterling, but it is likely that the situation will become even worse from the moment the negotiation process begins. Today, in terms of the economic calendar, we have data on inflation in the United States, which is projected to increase from 2.3% to 2.4%. In fact, this will be another reason for the Fed not to lower the rate. If the expectations coincide, we will receive a signal to strengthen the dollar. Further development Analyzing the current trading chart, we see that the quote continues to concentrate within the level of 1.3000, forming an accumulation. In fact, we still have a signal of a possible future recovery, since there has already been a fracture of ticks, as well as local lows. Thereby, we need to consolidate and a new round of short positions. However, do not unnecessarily panic if the quote moves within the level of 1.3000 [+/- 50 pip], since this is the process of becoming. From the point of view of the emotional mood of market participants, we are restrained, but it also reflects readiness for future actions. By detailing the time segment that we have every minute, we see that there was a local surge in activity at the start of the European trading session, which returned the quote to the area of last day's maximum. In turn, traders continue to follow the theory of the downward movement, where the behavior of quotes is carefully analyzed. Speculators, in turn, work at the races, which has already brought a small income. With a total picture of action suggests that the variance of the level of 1.3000 continues, where in case of a small change in the interests of trade, possibly vone inflation data, can occur round of short covering. The first goal is to return prices to the mid-range area of 1.2885, after which we follow the fixation points, then the path to 1.2770. Based on the above information, we derive trading recommendations: - Local buy positions were already considered in case of fixing a price higher than 1.3000, where the local move is in the direction of 1.3050. - Positions for sale are already being conducted by traders in the direction of the level of 1.2770, a conservative volume per transaction. If we do not have positions, it makes sense to wait for a new move with price fixing lower than 1.2870. Indicator analysis Analyzing a different sector of timeframes (TF), we see that there is a variable upward interest in the minute and hour sections due to the fixing process. On the other hand, the medium-term outlook is unchanged, which signals sales. Volatility per week / Measurement of volatility: Month; Quarter; Year Measurement of volatility reflects the average daily fluctuation, calculated for the Month / Quarter / Year. (February 13 was built taking into account the time of publication of the article) The volatility of the current time is 39 points, which is a low value, in comparison with the past day there is a characteristic acceleration. It is likely to assume that if the fixation process is completed, we can see the acceleration within the daily average. Key levels Resistance Zones: 1.3000; 1.3170 **; 1.3300 **; 1.3600; 1.3850; 1.4000 ***; 1.4350 **. Support Areas: 1.2900 *; 1.2885 *; 1.2770 **; 1.2700 *; 1.2620; 1.2580 *; 1.2500 **; 1.2350 **; 1.2205 (+/- 10p.) *; 1.2150 **; 1,2000 ***; 1.1700; 1.1475 **. * Periodic level ** Range Level *** Psychological level **** The article is built on the principle of conducting a transaction, with daily adjustment The material has been provided by InstaForex Company - www.instaforex.com |
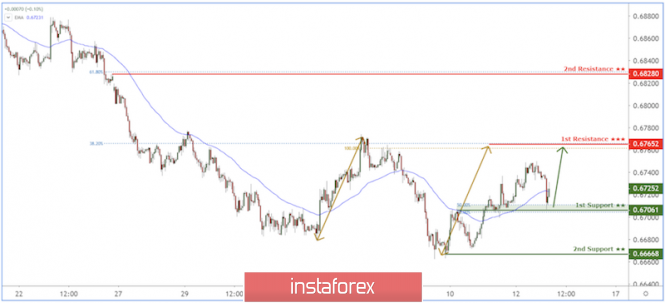
| AUD/USD bounce above key support level! Posted: 13 Feb 2020 01:17 AM PST
Trading Recommendation Entry: 0.67061 Reason for Entry: 50% Fibonacci resistance, Graphical overlap Take Profit : 0.67652 Reason for Take Profit: 38.20% Fibonacci retracement, 100% Fibonacci extension Stop Loss: 0.66668 Reason for Stop loss: Horizontal swing low The material has been provided by InstaForex Company - www.instaforex.com |
| You are subscribed to email updates from Forex analysis review. To stop receiving these emails, you may unsubscribe now. | Email delivery powered by Google |
| Google, 1600 Amphitheatre Parkway, Mountain View, CA 94043, United States | |











No comments:
Post a Comment