Forex analysis review |
- Overview of the EUR/USD pair. February 10. Corrective Monday and preparation for Jerome Powell's speech in Congress
- Forecast for EUR/USD on February 10, 2020
- Forecast for GBP/USD on February 10, 2020
- Control zones of USD/CHF on 02/10/20
- Forecast for AUD/USD on February 10, 2020
- Fractal analysis for major currency pairs on February 10
- GBP/USD. Preview of the new week: Britain's GDP data, Boris Johnson's attitude and US statistics may bury the pound
- EUR/USD. Preview of the new week: Jerome Powell's speeches in Congress, inflation and industrial production
- GBP/USD. February 8. Results of the week. The first quarrel between Johnson and Trump; Disagreement with Brussels
- EUR/USD. February 8. Results of the week. NonFarm Payrolls and industrial production in Germany "buried" the eurocurrency
| Posted: 09 Feb 2020 07:43 PM PST 4-hour timeframe
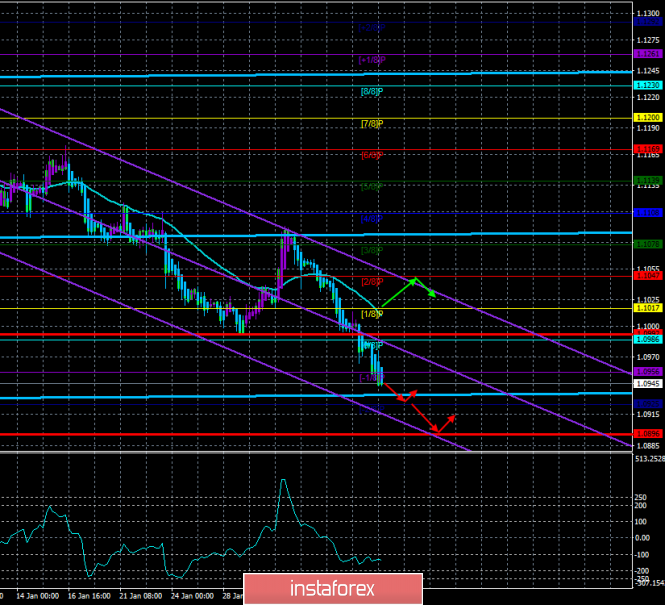
Technical details: Higher linear regression channel: direction - sideways. Lower linear regression channel: direction - downward. Moving average (20; smoothed) - down. CCI: -138.7153 At the end of the last trading week, the euro fell even more, and hopes for a correction finally collapsed when macroeconomic statistics were published in the United States, which showed the excellent state of the labor market. Thus, the fall of the EUR/USD currency pair continues, at least this is what the Heiken Ashi indicator signals, painting the bars blue. On Monday, February 10, there will be no important macroeconomic publications either in the European Union or in the United States. However, during the rest of the week, there will be quite a large number of important statistics and events. Thus, traders can use Monday to partially fix profits on short positions. After all, on Tuesday, Jerome Powell will make his first speech to Congress, which will clearly address the issues of the economy, monetary policy, and global risks. Thus, if the markets receive any new information, the reaction can follow immediately. We do not expect "dovish rhetoric" from Jerome Powell, respectively, and the fall of the US currency on the basis of this event – either. However, it should be understood that such a high-profile event can be used to manipulate the dollar exchange rate. Recall that in the first two years of his cadence, Donald Trump regularly stated that he did not need an "expensive dollar" and would make every effort to devalue the national currency. It failed to depreciate because other central banks also worked synchronously to reduce the exchange rate of their currencies, so the following events began: criticism of Jerome Powell, "hawkish" monetary policy, and regular calls to lower the key rate, which, according to Trump, would lead to a cheaper US currency in the foreign exchange market. The Fed lowered the rate three times, however, this did not lead to a special fall in the dollar. The US economy was stimulated and began to accelerate again. Also, the rise in the price of the dollar resumed. Thus, there may be surprises in Jerome Powell's speech, although the probability of this is extremely low. We believe that Powell will simply repeat in Congress all the theses that he regularly repeats after the Fed meetings, respectively, no new information will be available to traders. Thus, a correction may begin today, which is likely to continue on Tuesday. Of course, we recommend not to guess the possible reversals of the currency pair but to react to the readings of the fastest indicator – Heiken Ashi. Moreover, there are no macroeconomic publications scheduled for Monday, which means that there will be no influence on the fundamental background. In general, we still recommend working out all sell signals, since the general fundamental background clearly remains on the side of the US currency. Keeping in mind only the "paradoxical situation", that only 60 points remain to the pair's two-year lows. But even in the case of another difficult-to-explain reduction in dollar positions on the approach to the minimum level of 1.0879, the Heiken Ashi indicator will turn up and indicate a round of corrective movement. Meanwhile, trade tensions between the United States and China are slowly easing. It is reported that China is lowering duties on several goods from America for a total of $75 billion from February 14. However, as in the case of American duties, most of the restrictive measures continued to operate. However, the countries are gradually moving towards the point of a complete truce. Instead, Washington expanded duties on imports of steel, aluminum from other countries, as well as many products from this raw material, including nails, paper clips, wire, and cables. Contrary to the effect that Trump wanted to achieve by imposing duties on these categories of raw materials, imports to the United States only increased. This time, Trump has accused absolutely all countries importing steel and aluminum into the United States, allegedly they bypass duties and deliver goods not included in the initial list to the United States. Well, Trump is only confirming the opinion that sooner or later he will start trade wars with all his trading partners. The European Union is next...
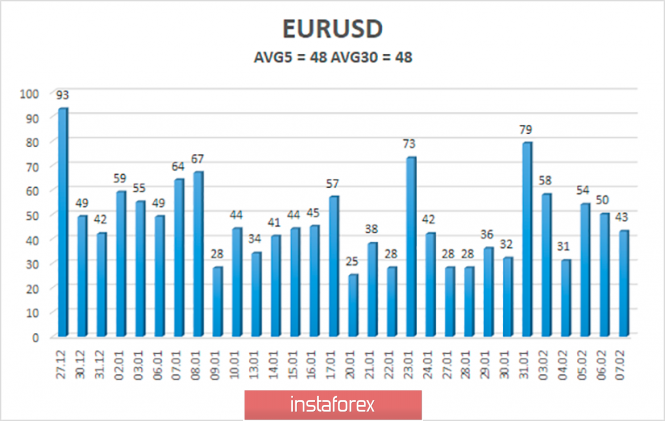
The average volatility of the euro/dollar currency pair has decreased slightly but is stable at 50 points per day. For the euro currency, this is an average and absolutely normal indicator. Thus, on Monday, we expect movement between the borders of the volatility range of 1.0896-1.0992. However, most likely, a correction will begin, which can be determined by the reversal of the Heiken Ashi indicator to the top. Nearest support levels: S1 - 1.0925 Nearest resistance levels: R1 - 1.0956 R2 - 1.0986 R3 - 1.1017 Trading recommendations: The euro/dollar pair continues to move down. Thus, sales of the euro currency with the targets of 1.0925 and 1.0896 remain relevant now, until the Heiken Ashi indicator turns up. It is recommended to return to buying the EUR/USD pair not before the bulls cross the moving average line, which will change the current trend to an upward one, with the first targets of 1.1047 and 1.1078. In addition to the technical picture, you should also take into account the fundamental data and the time of their release. Explanation of the illustrations: The highest linear regression channel is the blue unidirectional lines. The lowest linear regression channel is the purple unidirectional lines. CCI - blue line in the indicator window. Moving average (20; smoothed) - blue line on the price chart. Murray levels - multi-colored horizontal stripes. Heiken Ashi is an indicator that colors bars in blue or purple. Possible variants of the price movement: Red and green arrows. The material has been provided by InstaForex Company - www.instaforex.com |
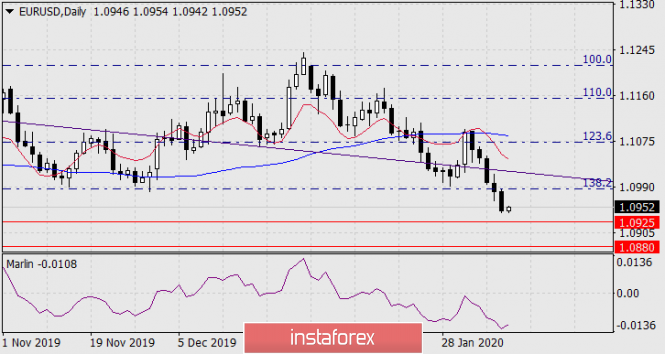
| Forecast for EUR/USD on February 10, 2020 Posted: 09 Feb 2020 07:43 PM PST EUR/USD Friday's data on employment in the United States exceeded even optimistic forecasts; 225,000 jobs were created outside the agricultural sector in January against expectations of 163,000, the December figure was revised up to 147,000 from 145,000, the November Non-Farm Employment Change increased by 5,000, and the average hourly wage increased for the month by 0.2%. At the same time, the volume of consumer lending almost doubled – from 11.8 billion dollars to 22.1 billion. As a result, the euro fell by 36 points. The reduction targets remain: 1.0925 - minimum on September 3 and 12, 2019, and 1.0880 - minimum on October 1.
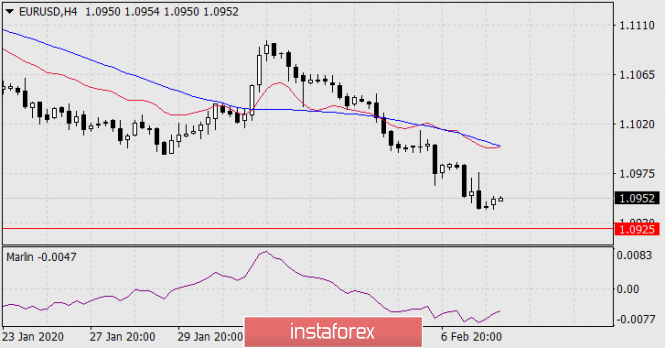
On the four-hour chart, the signal line of the leading Marlin oscillator is directed upwards, which indicates that the indicator is likely to discharge and consolidate the price before a further decline.
|
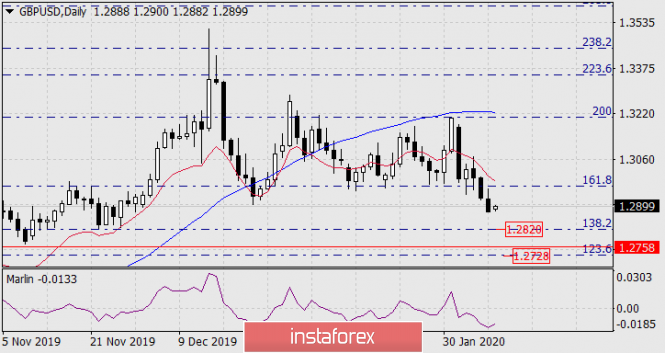
| Forecast for GBP/USD on February 10, 2020 Posted: 09 Feb 2020 07:43 PM PST GBP/USD On Friday, the British pound fell by 45 points under pressure from the overall strengthening of the dollar with the release of good labor data in the US. Non-Farm Employment Change for January amounted to 225,000 against the expectation of 163,000. Today, a large block of British economic data will be released. Expectations are mixed: GDP for the 4th quarter may show zero growth, the trade balance for December may deteriorate from -5.3 billion pounds to -10.0 billion, and the volume of production in the construction sector for December is expected to be -0.4% against 1.9% a month earlier. Industrial production is expected to grow by 0.3%, however, the previous fall was -1.2%. Also, manufacturing production may show an increase of 0.5%, but against the background of November's -1.7% growth does not look very optimistic. In part, the pound may grow slightly today (depending on the released data), but in the short term, there are no events that could return the pound to medium-term growth or deep short-term growth, as the main factor (the topic of Brexit) is becoming more and more unpleasant for British negotiators. Negotiations on the deal will begin in March, and the EU is already putting forward conditions for the UK to reduce sanitary standards for agricultural products and continue the primacy of European law. All this shows that the upcoming negotiations are definitely difficult.
The nearest targets for the pound remain: the Fibonacci level of 138.2% at the price of 1.2820, the range of 1.2728/58 formed by the Fibonacci level of 123.6% and the maximum on June 12, 2019.
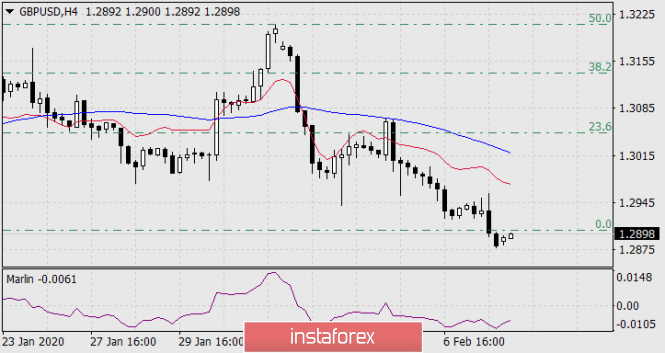
There are no graphical or indicator reversal patterns on the four-hour chart. The material has been provided by InstaForex Company - www.instaforex.com |
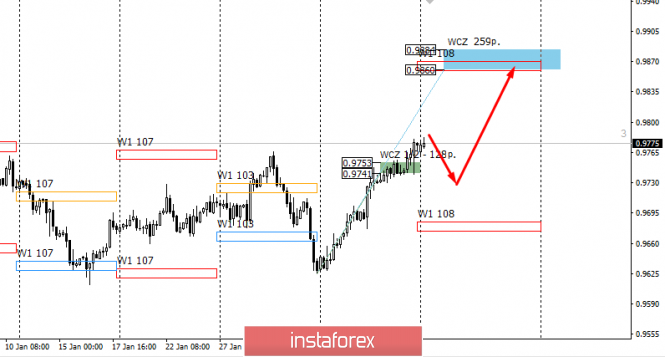
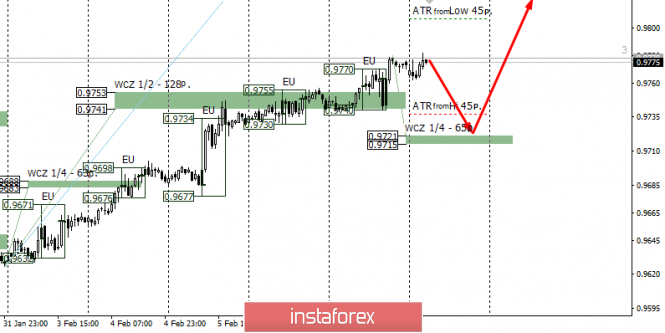
| Control zones of USD/CHF on 02/10/20 Posted: 09 Feb 2020 07:29 PM PST he main direction of trading for the current week is upward. The reversal pattern was formed on Friday. On the other hand, closing trades occurred above the Weekly Control Zone 1/2 0.9753-0.9741, which led to the cancellation of the bearish medium-term model. The probability of growth has increased to 75%. The main goal of the upward impulse is the weekly control zone 0.9884-0.0860. Meanwhile, purchases from current levels are not profitable, as the pair is trading at the extreme of last week, which increases the probability of the formation of a correctional model. To obtain favorable prices for the purchase of this instrument, a reduction to one of the support zones will be necessary. The first zone is the Weekly Control Zone 1/4 0.9721-0.9715. Testing this zone will allow you to enter a long position with a growth prospect of more than 130 points. On the contrary, if you set a stop of no more than 30 points, you can get a risk-to-profit ratio that significantly exceeds the required 1 to 3. Daily CZ - daily control zone. The zone formed by important data from the futures market that changes several times a year. Weekly CZ - weekly control zone. The zone formed by the important marks of the futures market, which change several times a year. Monthly CZ - monthly control zone. The zone that reflects the average volatility over the past year. The material has been provided by InstaForex Company - www.instaforex.com |
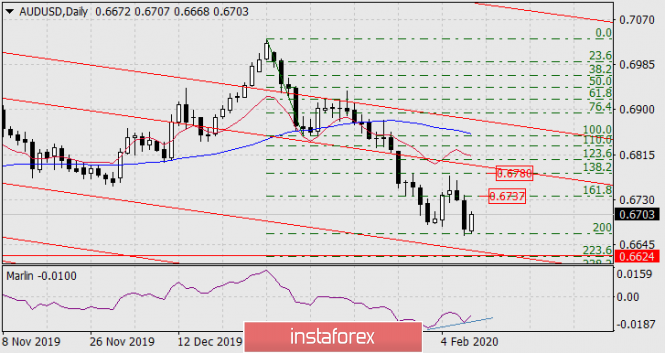
| Forecast for AUD/USD on February 10, 2020 Posted: 09 Feb 2020 06:56 PM PST AUD / USD On Friday, the Australian dollar lost 55 points, reaching a minimum of the day of the Fibonacci reaction level of 200.0% on the daily chart. Today, the "Australian" currency is slightly correcting upward during the Asian session, but this growth was enough to show the first signals of the convergence formation on the Marlin oscillator on the daily scale. However, the convergence is not strong, so we do not expect a price above the Fibonacci level of 161.8% (0.6737) in the main scenario.
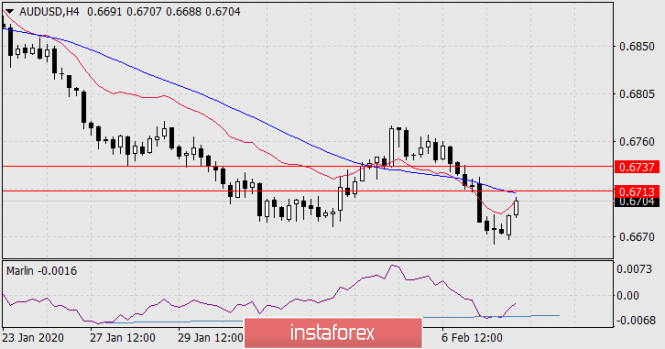
On the four-hour chart, an extended double convergence was formed, which is a stronger signal than on the daily chart. Perhaps, the price will decline into a wide range for a week. The potential of the upper boundary of this range of 0.6780 is the Fibonacci level of 138.2%. On the other hand, we are waiting for the development of the price range 0.6313 / 37 (the resistance of the MACD line is the Fibonacci level of 161.8%) in the local situation.
|
| Fractal analysis for major currency pairs on February 10 Posted: 09 Feb 2020 05:57 PM PST Forecast for February 10: Analytical review of currency pairs on the scale of H1:
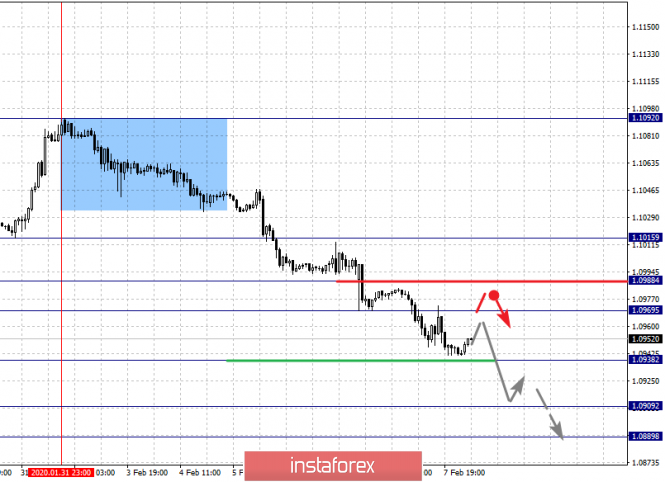
For the euro / dollar pair, the key levels on the H1 scale are: 1.1015, 1.0988, 1.0969, 1.0938, 1.0909 and 1.0889. Here, we are following the development of the descending structure of January 31. The continuation of the movement to the bottom is expected after the breakdown of the level of 1.0938. In this case, the target is 1.090. Price consolidation is near this level. For the potential value for the bottom, we consider the level of 1.0889. After which, we expect a correction. Short-term upward movement is possibly in the range 1.0969 - 1.0988. The breakdown of the latter value will lead to an in-depth correction. Here, the target is 1.1015. This level is a key support for the downward structure. The main trend is the descending structure of January 31 Trading recommendations: Buy: 1.0969 Take profit: 1.0987 Buy: 1.0989 Take profit: 1.1015 Sell: 1.0936 Take profit: 1.0910 Sell: 1.0908 Take profit: 1.0890
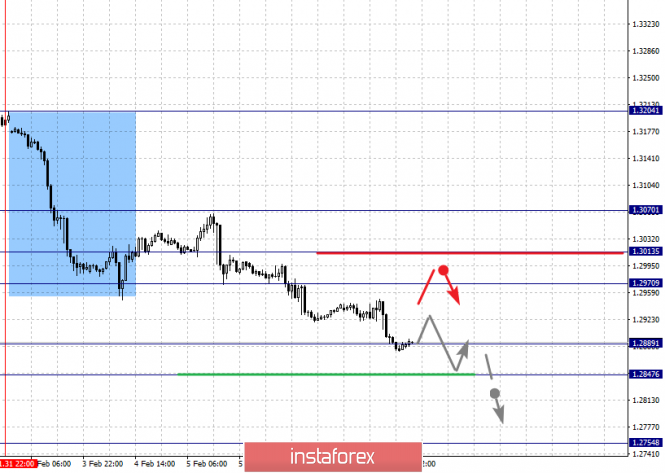
For the pound / dollar pair, the key levels on the H1 scale are: 1.3070, 1.3013, 1.2970, 1.2932, 1.2889, 1.2847 and 1.2754. Here, we are following the development of the descending structure of January 31. Short-term downward movement is expected in the range of 1.2889 - 1.2847. The breakdown of the last value should be accompanied by a pronounced movement to the bottom. In this case, the potential target is 1.2754. We expect consolidation, as well as a pullback to the top near this level. Short-term upward movement is possibly in the range of 1.2970 - 1.3013. The breakdown of the latter value will lead to an in-depth correction. Here, the target is 1.3070. This level is a key support for the downward structure. The main trend is the descending structure of January 31 Trading recommendations: Buy: 1.2970 Take profit: 1.3011 Buy: 1.3015 Take profit: 1.3070 Sell: 1.2889 Take profit: 1.2848 Sell: 1.2845 Take profit: 1.2756
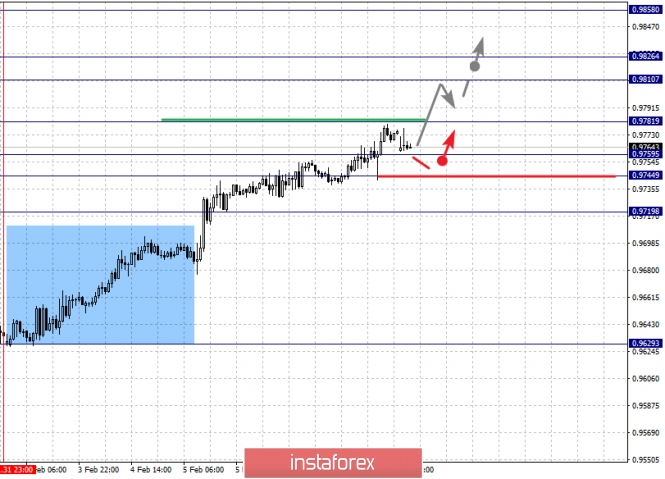
For the dollar / franc pair, the key levels on the H1 scale are: 0.9858, 0.9826, 0.9810, 0.9781, 0.9759, 0.9744 and 0.9719. Here, we are following the development of the ascending structure of January 31. The continuation of the movement to the top is expected after the breakdown of the level of 0.9781. In this case, the target is 0.9810. Price consolidation is in the range of 0.9810 - 0.9826. For the potential value for the top, we consider the level of 0.9858. We expect a pullback to the bottom upon reaching this level. Short-term downward movement is possibly in the range of 0.9759 - 0.9744. The breakdown of the latter value will lead to an in-depth correction. Here, the target is 0.9719. This level is a key support for the upward structure. The main trend is the upward cycle of January 31 Trading recommendations: Buy : 0.9782 Take profit: 0.9810 Buy : 0.9826 Take profit: 0.9858 Sell: 0.9759 Take profit: 0.9745 Sell: 0.9742 Take profit: 0.9720
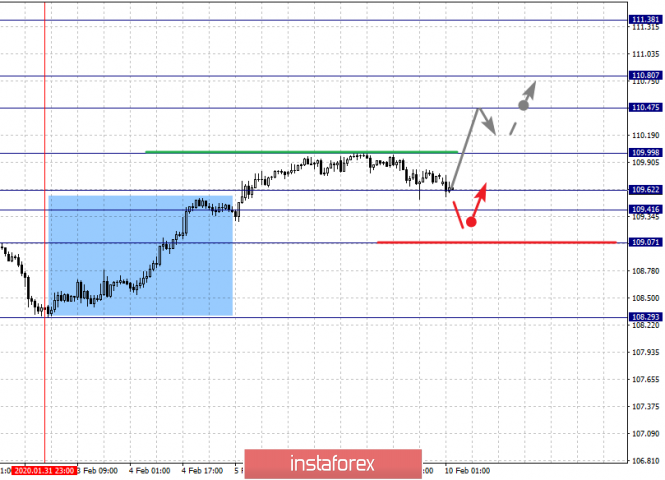
For the dollar / yen pair, the key levels on the scale are : 110.80, 110.47, 109.99, 109.62, 109.41 and 109.07. Here, we are following the development of the ascending structure of January 31. The continuation of the movement to the top is expected after the breakdown of the level of 110.00. In this case, the target is 110.47. Price consolidation is near this level. For the potential value for the top, we consider the level 110.80. Upon reaching which, we expect a pullback to the bottom. Short-term downward movement is possibly in the range of 109.62 - 109.41. The breakdown of the last value will lead to an in-depth correction. Here, the goal is 109.07. This level is a key support for the top. Main trend: upward structure of January 31 Trading recommendations: Buy: 110.00 Take profit: 110.45 Buy : 110.49 Take profit: 110.80 Sell: 109.60 Take profit: 109.42 Sell: 109.38 Take profit: 109.10
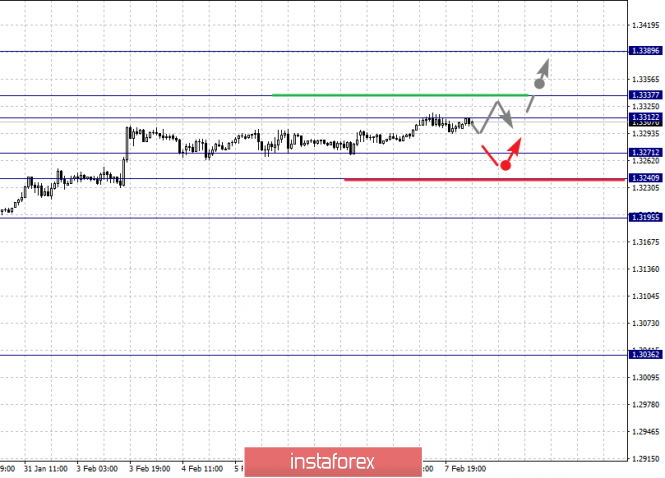
For the Canadian dollar / US dollar pair, the key levels on the H1 scale are: 1.3389, 1.3337, 1.3312, 1.3271, 1.3240 and 1.3195. Here, we are following the development of the upward cycle of January 22. Short-term upward movement is expected in the range of 1.3312 - 1.3337. Hence, there is a high probability of a turn to the bottom. For the potential value for the top, we consider the level of 1.3389. We expect movement to this level after the breakdown of the level of 1.3337. Short-term downward movement is possibly in the range of 1.3271 - 1.3240. The breakdown of the last value will lead to an in-depth correction. Here, the target is 1.3195. This level is a key support for the top. The main trend is the local ascending structure of January 22 Trading recommendations: Buy: 1.3313 Take profit: 1.3335 Buy : 1.3337 Take profit: 1.3387 Sell: 1.3370 Take profit: 1.3242 Sell: 1.3238 Take profit: 1.3195
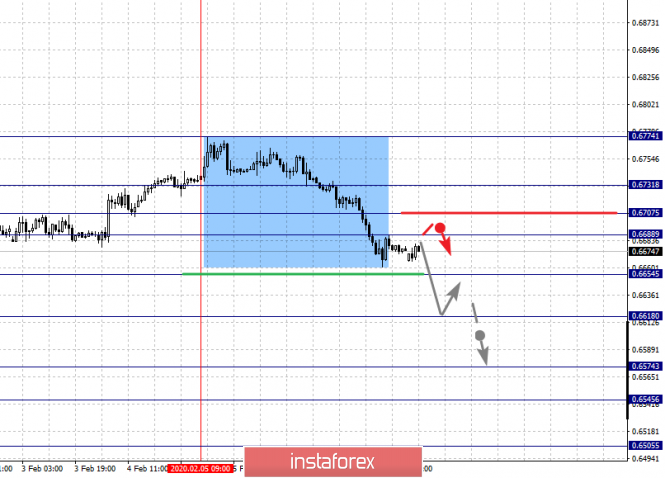
For the Australian dollar / US dollar pair, the key levels on the H1 scale are : 0.6731, 0.6707, 0.6688, 0.6654, 0.6618, 0.6574, 0.6545 and 0.6505. Here, we are following the formation of the descending structure of February 5. The continuation of movement to the bottom is expected after the breakdown of the level of 0.6654. In this case, the target is 0.6618. Price consolidation is near this level. The breakdown of the level of 0.6618 will lead to the development of pronounced movement. Here, the target is 0.6574. Short-term downward movement, as well as consolidation is in the range of 0.6574 - 0.6545. For the potential value for the bottom, we consider the level of 0.6505. Upon reaching which, we expect a pullback to the top. Short-term upward movement is possibly in the range of 0.6688 - 0.6707. The breakdown of the latter value will lead to an in-depth correction. Here, the target is 0.6731. This level is a key support for the downward structure. The main trend is the descending structure of February 5 Trading recommendations: Buy: 0.6688 Take profit: 0.6706 Buy: 0.6708 Take profit: 0.6730 Sell : 0.6654 Take profit : 0.6620 Sell: 0.6616 Take profit: 0.6576
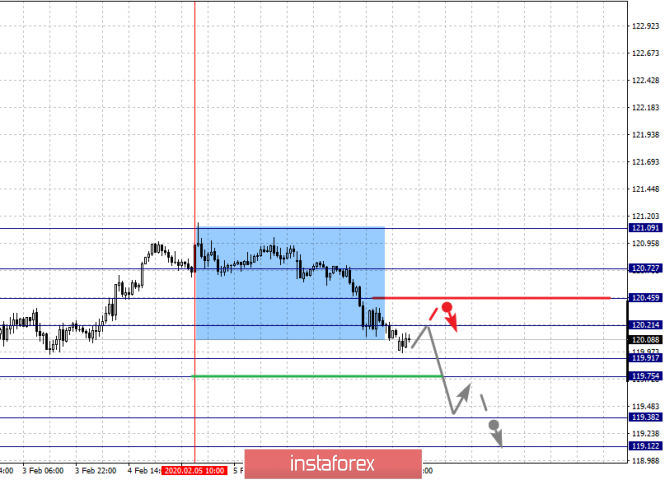
For the euro / yen pair, the key levels on the H1 scale are: 120.72, 120.45, 120.21, 119.91, 119.75, 119.38 and 119.12. Here, we are following the formation of the descending structure of February 5. The continuation of movement to the bottom is expected after the price passes the noise range 119.91 - 119.75. In this case, the target is 119.38. For the potential value for the bottom, we consider the level of 119.12. Upon reaching this value, we expect consolidation, as well as a rollback to the top. Short-term downward movement is possibly in the range of 120.21 - 120.45. The breakdown of the last value will lead to an in-depth correction. Here, the goal is 120.72. This level is a key support for the downward structure. The main trend is the descending structure of February 5 Trading recommendations: Buy: 120.21 Take profit: 120.43 Buy: 120.47 Take profit: 120.70 Sell: 119.75 Take profit: 119.40 Sell: 119.36 Take profit: 119.12
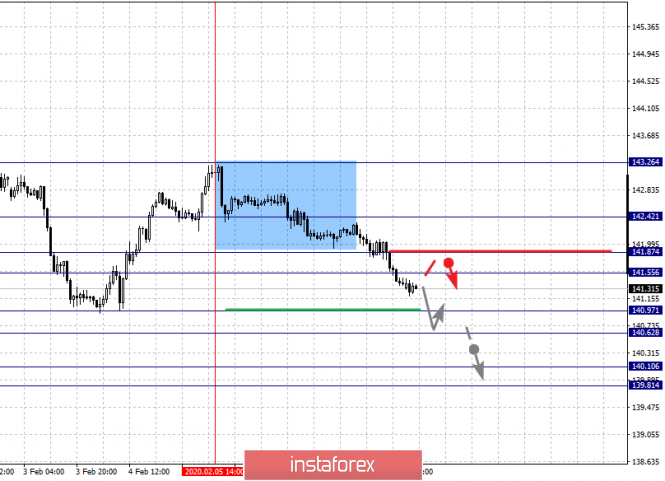
For the pound / yen pair, the key levels on the H1 scale are : 142.42, 141.87, 141.55, 140.97, 140.62, 140.10 and 139.81. Here, we are following the development of the descending structure of February 5. Short-term downward movement is expected in the range of 140.97 - 140.62. The breakdown of the last value should be accompanied by a pronounced downward movement. Here, the target is 140.10. For the potential value for the bottom, we consider the level of 139.81. Upon reaching which, we expect consolidation, as well as a rollback to the top. Short-term upward movement is possibly in the range of 141.55 - 141.87. The breakdown of the latter value will lead to an in-depth correction. Here, the goal is 142.42. This level is key support for the descending structure of February 5. The main trend is the descending structure of February 5 Trading recommendations: Buy: 141.55 Take profit: 141.85 Buy: 141.90 Take profit: 142.40 Sell: 140.95 Take profit: 140.65 Sell: 140.58 Take profit: 140.10 The material has been provided by InstaForex Company - www.instaforex.com |
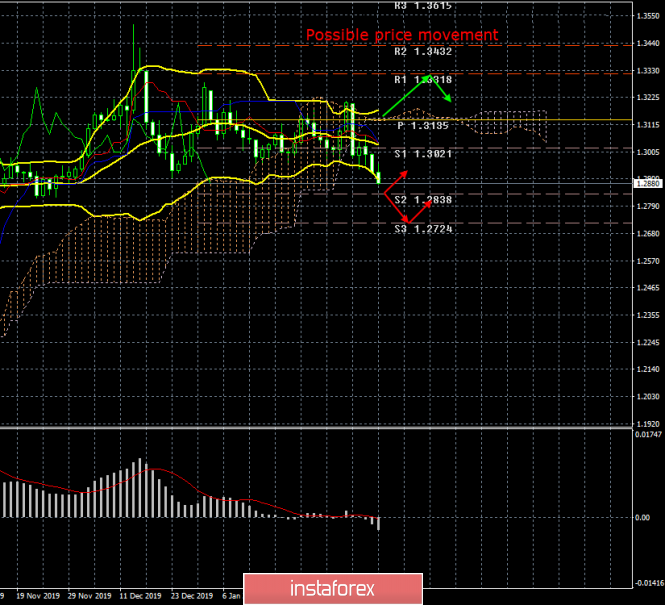
| Posted: 09 Feb 2020 03:41 PM PST 24-hour time frame The British pound remains at the mercy of a huge number of factors that put pressure on it. Last week, the decline of the British currency resumed, as Boris Johnson very "successfully" started commenting on negotiations that had not yet begun with Brussels, immediately declaring that London could withdraw from negotiations at any time if it realized that it could not get the "deal that wants". As a result, traders immediately rushed to sell the pound, as the UK economy continues to experience quite serious problems, which Mark Carney and the Bank of England tried to refute inappropriately at their last meeting in January, and if there is no deal with the European Union, it will just be sentence for the entire British economy. Essentially, this will mean Brexit without a deal, i.e. unordered. That is, that which the Parliament, and in particular the Labor Party, feared over recent years. The fact that the opposition forces diligently blocked, trying to prevent a destructive scenario for Britain. However, all power is now in the hands of conservatives and nothing can stop Boris Johnson from leading the country as he sees fit although it is difficult to assume what it is. Is the Prime Minister just bluffing to get the best possible deal with the EU? What is the real position of Johnson, who is ready to withdraw the country without an agreement? In any case, the pound began to decline and will continue it with virtually no options. Now as for macroeconomic statistics in the coming week, everything regarding American statistics has already been said in the next article on EUR / USD. Here, we will focus on British publications. On Monday, no important and interesting information will be received from the UK. But on Tuesday, traders will witness the publication of monthly GDP reports for December, quarterly and annual terms for the fourth quarter in a preliminary estimate, according to NIESR GDP growth rates, industrial production, and also the volume of commercial investments. What are our forecasts? Industrial production is projected to decline by 0.8% in annual terms, GDP in the fourth quarter may add 0%, and in annual terms, growth may decline from 1.1% to 0.8%, and commercial investment is likely to decline 1.3% y / y. So, investments are declining, industrial production is declining, GDP growth is falling, the UK economy continues to lose 70 billion a year. At the same time, Boris Johnson is ready to complete the transition period without a deal. Analysts believe that negotiations with Brussels and Washington will be extremely difficult and Foggy Albion may soon face problems of a geopolitical nature (Scotland, Gibraltar, Ireland). So, what are the options for the pound with such a set of fundamental grounds? No data is expected from the UK on Wednesday, Thursday and Friday. However, in order for the pound to continue to decline, there should be enough data from Tuesday, as well as the general fundamental background. Moreover, do not forget about American statistics, most of which are projected to increase. Do not also forget that the British currency spent the last few months either in growth or in unreasonably high positions for itself. Thus, even technical factors now speak in favor of the decline of this currency. From a technical point of view, the Bollinger Bands began to expand down on the 24-hour chart, and the sell signal from Ichimoku "dead cross" continues to be relevant. Thus, we can see a new fall in the British currency by 500-600 points in the future, unless the UK economy suddenly and unexpectedly pleases, and Boris Johnson does not begin to do everything in order not to finish off the British economy. Trading recommendations: In the 24-hour timeframe, the pound / dollar pair resumed its downward movement. Thus, at the moment, sales of the pound are recommended with targets of 1.2838 and 1.2724. Explanation of the illustration: Ichimoku indicator: Tenkan-sen is the red line. Kijun-sen is the blue line. Senkou Span A - light brown dotted line. Senkou Span B - light purple dashed line. Chikou Span - green line. Bollinger Bands Indicator: 3 yellow lines. MACD indicator: Red line and bar graph with white bars in the indicators window. The material has been provided by InstaForex Company - www.instaforex.com |
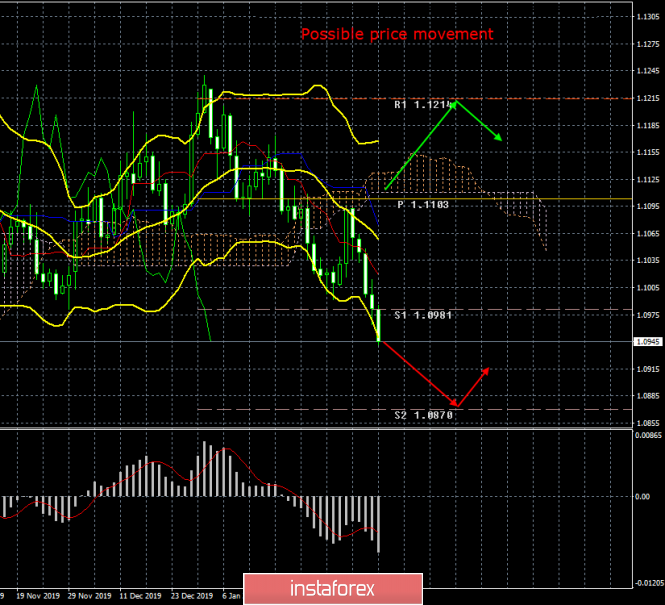
| Posted: 09 Feb 2020 03:41 PM PST 24-hour time frame In the past few weeks, we have questioned that the US economy continues to "feel good," as Fed Chairman Jerome Powell assured us in a recent speech. However, recent macroeconomic reports from across the world have indeed confirmed that most of the key indicators have increased compared to the previous period. Thus, these indicators can now begin to pull up and the rest, which cause the greatest number of questions. Last week, business activity indices in the US services and manufacturing sectors showed an increase, two labor market reports significantly exceeded expert forecasts, wages remained at a good level, and only the unemployment rate rose slightly to 3.6%, which, however, did not change the general picture of things. Thus, industrial production, GDP and inflation are still indicators that raise certain questions. However, the first indicator may begin to increase in the coming months, as business activity in this industry has recovered. On the other hand, inflation is already at a value of 2.3% y / y and the questions on it are only in what period of time the indicator will be able to maintain such values. The Fed wants to see inflation at around 2% over a long period of time. The most questionable indicator of GDP, which has been slowing down in the past year and a half and is now 2%. It can be recalled that the US dollar was growing "leaps and bounds' for the entire previous week, and next week, important data will be published in the United States, which will support the US currency again in case that it is strong. Moreover, several more or less important reports will be published in the European Union. On Monday, the calendar of macroeconomic events of the European Union will be completely empty. There will be absolutely nothing to pay attention to, so we believe that this is a good day and a good opportunity for the euro / dollar pair to roll back a bit and begin an upward correction. On Tuesday, Fed Chairman Jerome Powell will make a speech at the US Congress on economics and monetary policy. If we are wondering whether the topic of monetary policy will be affected before each speech of the head of the Central Bank, then in this case, it will be affected with a probability of 100%. As usual, Powell's rhetoric will be of great importance to the dollar, although after the latest macroeconomic reports it is unlikely to be a "dovish". Most likely, Powell will note the "good" state of the economy again, the strength of the labor market (especially against the background of ADP and NonFarm Payrolls reports), as well as a good state of inflation. And, of course, he is unlikely to avoid global risks, such as the "coronavirus". Thus, we potentially believe that Powell's speech may provide little support to the dollar. On Wednesday, Jerome Powell will make another speech all in the same Congress, during which he, for example, can discuss the topic of lowering / raising rates in 2020 and the issue of completing the Fed's securities buyback program ("non-QE"). Also on this day, industrial production for December in the European Union will be published with a forecast of -0.8% y / y. Even if this forecast just comes true, it is still negative for the euro. However, it can be assumed that industrial production in the Eurozone will decrease much more than by 0.8%, bearing in mind a similar report in Germany, which showed a decrease of 6.8% y / y. Naturally, this is another factor potentially putting pressure on the euro. On Thursday, we will find out the final January inflation figures for Germany and the United States. In Germany, the consumer price index may accelerate to 1.7% y / y, in the United States - up to 2.5%. From the point of view of forecasting, Thursday will be the most difficult day, since it is extremely difficult to predict what the real value of the CPI will be. Perhaps, American inflation will not reach the value of 2.5% y / y and on this day, the euro will receive a slight delay. Well, data on retail sales will be published on the last trading day in the United States, as well as the most important indicator of industrial production for January. It can be recalled that the last value of production was also negative, but it may recover in January due to increased business activity in this sector. Thus, in general, almost all the news from overseas may turn out to be positive, which may provoke new purchases of the American dollar by traders. In this regard, the euro currency can only hope that the statistics from overseas will not be as strong as we expect, and the "paradoxical situation". Quotes of the EUR / USD pair are now only 60 points from two-year lows, so theoretically, traders can stop buying the dollar at any time, despite the macroeconomic background. Trading recommendations: The trend for the euro / dollar pair remains downward. Thus, on the 4-hour timeframe, it is recommended to continue to consider short positions until signals about the beginning of an upward correction appear, which is also very likely in the following week. On a 24-hour timeframe, the pair may also begin to adjust, but it will be much more difficult to "catch" the correction here. Explanation of the illustration: Ichimoku indicator: Tenkan-sen is the red line. Kijun-sen is the blue line. Senkou Span A - light brown dotted line. Senkou Span B - light purple dashed line. Chikou Span - green line. Bollinger Bands Indicator: 3 yellow lines. MACD indicator: Red line and bar graph with white bars in the indicators window. The material has been provided by InstaForex Company - www.instaforex.com |
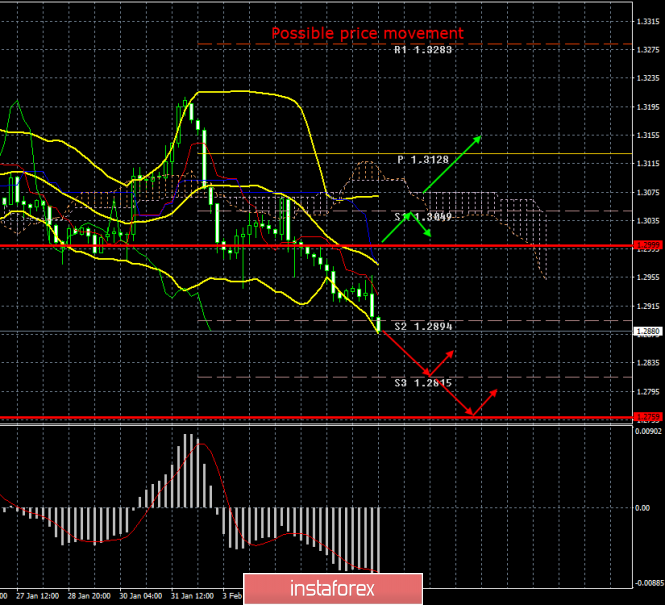
| Posted: 09 Feb 2020 03:41 PM PST 4 hour time-frame Amplitude of the last 5 days (high-low): 217p - 106p - 114p - 79p - 80p. Average volatility over the past 5 days: 120p (high). The pound, which has been somewhat afloat over the past few months against the US currency, continued to decline on Friday, February 7, and seems to have finally returned to a downward trend. Actually, we talked about this in recent months almost every day. The British currency has no reason for growth. The optimistic state in which traders were for several months before the parliamentary elections in the UK last year cannot be called justified. Yes, Boris Johnson's party won and yes, Brexit went to the final stage, which would not have happened if, for example, the Labor Party had won. But what has changed for the UK economy in connection with the victory of the conservatives? Nothing. What has changed for the British economy from that the country has finally stepped into the "transition period" and will now officially leave the EU in 11 months? Nothing. The country, as it lost business, companies, money in connection with this process, which began three and a half years ago, continues to do so. If the US and EU economies are affected by trade wars, the slowdown in global economic growth, and possibly the "coronavirus" in the near future, then Britain will be affected by the same factors and Brexit. As a result, the euro against the dollar continues to fall in price in "equal conditions". Now, what to expect from the pound, which has at least one reason to become cheaper? It is still unknown. Moreover, many analysts and experts believe that the pound is too cheap, that is, in other words, it is oversold. We believe that the pound is now overbought, since it significantly and unreasonably rose in price at the end of last year, which can no longer mean that it is oversold. Thus, in any case, the British currency will continue to become cheaper in the long run. Do not forget about such a factor as trade negotiations with the European Union and the States on free trade agreements will be concluded by Boris Johnson in 2021. The chances of this were initially few. Now, when Bloc and the Kingdom began to slowly comment on this matter, it became clear that the chances were not only not growing, but also diminishing. At the same time, there is already a lot of disagreement between Brussels and London. Boris Johnson wants a deal "the same as with Canada or Australia," with which negotiations were held for 7-8 years, for 11 months. The British Prime Minister only wants a negotiation, not a comprehensive one. The European Union wants to tie Britain to itself as much as possible, wants London to guarantee fair competition between European and British companies, and wants the UK adheres to European standards and norms in the areas of labor protection, the environment and government subsidies. In addition, Brussels also wants the European Court to be the highest court in resolving all disputed issues between the Alliance and Britain. As you can see, the negotiations have not even begun, and there are already so many disagreements that they are unlikely to be resolved in 10 months. 10 months because official negotiations will begin only in March. It should also be noted the lines once and the position of Boris Johnson himself, who has already stated that London will easily exit any negotiations if it does not get the agreement it wants. That is, Johnson is easily ready to return his country to the "tough" Brexit, which the Parliament has carefully blocked in recent years. We said right after Johnson's victory in the December election that it's very bad, when all the power in the country is concentrated in the hands of one person. In these conditions, opposition forces cannot block any Johnson's decision and cannot impose their proposals on him. We have also said that the optimism regarding a trade agreement between the United States and Britain is also not justified at this time. The fact that Donald Trump promised Johnson a "huge trade agreement" does not mean anything. We all know how the American president likes to give and take his words back. Therefore, there can be even more obstacles than in the case of Brussels when it comes to formal negotiations. Meanwhile, certain disagreements are already beginning to arise between the US and UK. For example, Trump criticized "his friend" because Johnson allowed the Chinese company Huawei to develop 5G networks in the UK. Trump had previously tried to convince Johnson not to partner with a Chinese company, but Johnson dared to disobey. From a technical point of view, the British pound continues to decline and overcame the second support level of 1.2894. There is no signal of the start of correction at the moment. It may start on Monday, but before receiving correction signals, closing short positions is not recommended. Trading recommendations: The GBP/USD pair continues to move down. Thus, sales of the British pound with a target support level of 1.2815 remain relevant today. On the other hand, purchases of a pair by small lots can be considered if the price returns to the area above the Kijun-sen line with the first targets 1.13049 and Senkou Span B. line. Explanation of the illustration: Ichimoku indicator: Tenkan-sen is the red line. Kijun-sen is the blue line. Senkou Span A - light brown dotted line. Senkou Span B - light purple dashed line. Chikou Span - green line. Bollinger Bands Indicator: 3 yellow lines. MACD indicator: Red line and bar graph with white bars in the indicators window. Support / Resistance Classic Levels: Red and gray dashed lines with price symbols. Pivot Level: Yellow solid line. Volatility Support / Resistance Levels: Gray dotted lines without price designations. Possible price movements: Red and green arrows. The material has been provided by InstaForex Company - www.instaforex.com |
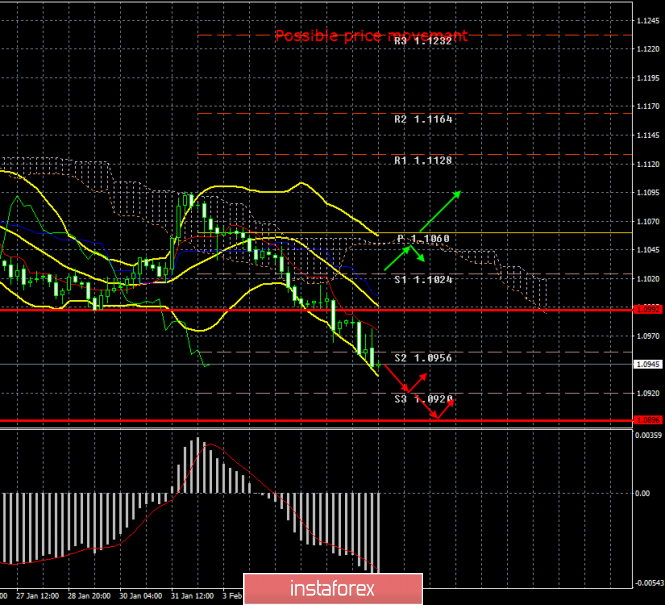
| Posted: 09 Feb 2020 03:41 PM PST 4 hour time-frame Amplitude of the last 5 days (high-low): 58p - 31p - 54p - 50p - 43p. Average volatility over the past 5 days: 48p (average). The EUR/USD currency pair completed the next trading week, and this week has become one of the most disastrous for the European currency in recent times. Throughout the entire week, traders got rid of the Euro currency. There was not a single correction or rollback and the total loss of the European Union currency amounted to 150 points. Perhaps, this is not very much at first glance, but we want to remind you that the euro has lost 550 points over the past 15 months, with the continuous downward trend. Therefore, 150 points of losses per week is still not a little. As for the reasons for the decline of the Euro, they generally remain the same. The European economy still looks much weaker than the US, the Fed's monetary policy is much stronger and more hawkish than the European one, and macroeconomic reports continue to come stronger from overseas than from the EU. That's all the reasons. Nevertheless, there were certain hopes for the growth of the euro, thanks to the "paradoxical situation", which saved the euro from new falls and collapses more than once, but this week, traders, in particular bears, sold the euro currency no matter what. The week ends at 62 points from two-year lows of the euro / dollar pair. On the last trading day of the week, quite several important macroeconomic reports were published. It all began, as usual, with Europe, and more precisely with Germany. Industrial production in the locomotive country of the entire European Union decreased by 6.8% in annual terms and by 3.5% in monthly terms. But a month ago, we believed that a decrease of 2.5% y / y is a lot and much worse. It turns out that there is room for this indicator to decline, and December is a confirmation of this. Actually, it was already possible to clearly realize on this report that the euro had no special prospects on Friday, February 7. If production in Germany is reduced, it means that it will decrease in the European Union with a high degree of probability. And many other indicators, such as, for example, GDP and economic growth, now depend on production. Thus, we can expect further deterioration from the next reports from the Eurozone, which is unlikely to add optimism to buyers of the Euro currency. However, more important macroeconomic data were expected from overseas. The first report (formally the first, since they were all published at the same time) turned out to be weak. The unemployment rate in January unexpectedly increased from 3.5% to 3.6%; however, this is not an indicator that can cause serious movements in the market. Moreover, the value of 3.6% is still an extremely low value for America, so this report is "weak" only formally. But the next report - NonFarm Payrolls showed a significant excess of the forecasted values (163,000) and amounted to as much as 225,000. It is clear that after such strong data on the state of the labor market (we add here the report from ADP on the change in the number of employees in the private sector), traders had no choice but to continue buying American currency. This is all that can be said on Friday's macroeconomic background. What else could happen to the euro on this day if the only report in the Eurozone failed miserably, and all the data from across the ocean turned out to be strong? Based on the general picture of things, we continue to lean towards the option in which the euro continues to slide towards price parity with the US dollar. In the past two years, we can say nothing else, except that the American economy looks much stronger than the European one. Yes, the US economy is also under pressure due to a slowdown in global growth rates, because of trade conflicts, and it can also respond to the "coronavirus" in the near future, which will reduce business activity in China, and therefore in many countries - partners of China. However, the European economy is slowing down in the same way and its rates are much lower than the US. Therefore, the euro can be adjusted in the long run and it can rebound to new areas of support. More so, it can even be in demand from time to time, but the general trend will remain downward. Accordingly, the trading strategy for the EUR / USD pair remains the same: working out all the sell signals. From a technical point of view, the pair overcame the second support level of 1.0956 this week, and on Monday, may finally begin to correct. However, we recommend waiting for a specific signal to identify the beginning of the correction. For example, the MACD indicator will turn up with a parallel price increase (the indicator is already at its minimum values and may just start to discharge). Trading recommendations: The EUR/USD pair continues to move down. Thus, it is recommended to remain in euro-currency sales with targets at levels 1.0920 and 1.0896, until the MACD indicator reverses or a rebound from any of the targets. It will be possible to consider the purchase of the euro / dollar pair with the goals of 1.1024 and 1.1060, if traders manage to gain a foothold above the Kijun-sen line, which is not expected in the near future. Explanation of the illustration: Ichimoku indicator: Tenkan-sen is the red line. Kijun-sen is the blue line. Senkou Span A - light brown dotted line. Senkou Span B - light purple dashed line. Chikou Span - green line. Bollinger Bands Indicator: 3 yellow lines. MACD indicator: Red line and bar graph with white bars in the indicators window. Support / Resistance Classic Levels: Red and gray dashed lines with price symbols. Pivot Level: Yellow solid line. Volatility Support / Resistance Levels: Gray dotted lines without price designations. Possible price movements: Red and green arrows. The material has been provided by InstaForex Company - www.instaforex.com |
| You are subscribed to email updates from Forex analysis review. To stop receiving these emails, you may unsubscribe now. | Email delivery powered by Google |
| Google, 1600 Amphitheatre Parkway, Mountain View, CA 94043, United States | |

No comments:
Post a Comment