By Jeff Clark, editor, Market Minute Just a little over two weeks ago, we took a look at the semiconductor sector and determined it was due for a pullback. The Semiconductor Index (SOX) was overbought. It was too far above its 50-day moving average (MA) line. And, several momentum indicators, like the Relative Strength Index (RSI) and Commodity Channel Index (CCI) were showing negative divergence. | Recommended Link | | 597x more powerful than iPhone technology?
You're looking at a new chip that's 597x more powerful than the one in the iPhone X. And it will soon unlock some amazing new "apps" on your phone or tablet. Like "virtual" assistants that are almost identical to humans… and can book your restaurant reservation while you play a round of golf.
One expert says it could be "the biggest breakthrough since the microchip in 1959." For investors, it means an incredible new opportunity…
A chance to participate in a $15.7 trillion boom. Alongside Google, Amazon, Oracle, and just about every major company in America. Click here to see details behind three stocks that could soar. | | | -- | As a reminder, negative divergence is when the various momentum indicators below the chart move opposite the price action at the top of the chart. When the divergence is negative, and the momentum is slowing while the price continues to rise, that’s generally bearish. So, when we spotted that negative divergence two weeks ago, we figured the semiconductor stocks were overdue for a break. Here’s an updated look at the chart I showed back then… 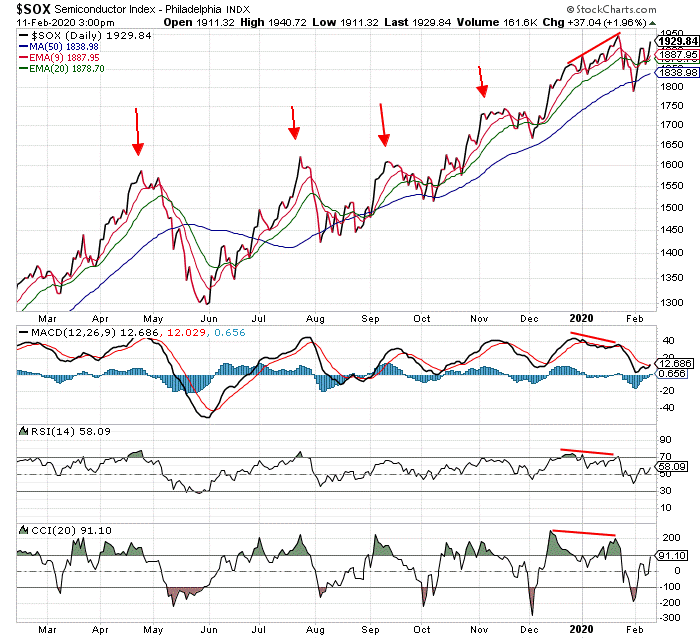
The sector dropped 8% in just a few days after we posted the chart. The index tagged its 50-day MA. And, it gave traders a brief chance to buy into the semiconductor stocks at a favorable price. The chart of the technology sector is now displaying a similar pattern. Take a look at this chart of the Technology Sector Select SPDR Fund (XLK)… 
XLK rarely strays more than 5% away from its 50-day MA. It closed Monday almost 8% above the line. It has been four months since XLK has tested its 50-day MA. And, the momentum indicators at the bottom of the chart are all showing negative divergence. In other words, as XLK has rallied over the past several weeks, the technical indicators have fallen. This negative divergence is often a warning sign of an impending pullback. So, just as we warned with the semiconductor sector two weeks ago, this current setup suggests that traders should probably wait before putting new money into the technology sector. The sector can use a break. There’s a good chance we’ll have a better chance to buy in the weeks ahead. Best regards and good trading, 
Jeff Clark P.S. A colleague of mine, Andy Krieger, is a legendary trader who first became famous for netting $300 million after shorting the New Zealand dollar in the late 80s… If you haven’t already, sign up to watch Andy’s first ever live interview on February 20 at 8 pm ET. … Where he’ll tell you about the rare
event he sees coming that you don’t want to miss… Reader Mailbag Today we hear kind words from Gerry, a Jeff Clark Trader subscriber… Please let Jeff Clark know that his frequent commentary is VERY much appreciated. – Gerry Thank you, as always, for your thoughtful comments. We look forward to reading them every day. Keep them coming at feedback@jeffclarktrader.com. In Case You Missed It… Is this Bitcoin's inventor, Satoshi Nakamoto? Is this the inventor of Bitcoin... Satoshi Nakamoto?! Here's what we know... This mysterious currency trader... First wrote about a one world currency in 1992. He's a programmer. His daughter's name is Shoshi. He trades Bitcoin. According to the front page of The Wall Street Journal... he once made $300 million on a single trade. But on Thursday, February 20th, he's breaking his silence... To show YOU how to beat the market with one big trade… 
| 


No comments:
Post a Comment