
Forex analysis review |
- Forecast for EUR/USD on March 31, 2020
- Forecast for AUD/USD on March 31, 2020
- Forecast for USD/JPY on March 31, 2020
- Comprehensive analysis of movement options of #USDX vs EUR/USD vs GBP/USD vs USD/JPY (DAILY) on March 31, 2020
- EUR/USD. EU domestic scandal, 2 trillion dollar support and pending reports
- EUR/USD and GBP/USD. March 30. Results of the day. Trump extends quarantine in the US, death toll can range from 100-200,000
- EURUSD remains in bullish trend.
- Short-term Ichimoku cloud indicator analysis of Gold
- Gold vs dollar: the fight for the title of king of the "safe haven" continues
- March 30, 2020 : EUR/USD Intraday technical analysis and trade recommendations.
- EURUSD and GBPUSD: Bulls rushed to close long positions on the euro. Traders of the pound are at a loss and do not know what
- GBP/USD: plan for the US session on March 30. The bears' attempt to break below 1.2335 was unsuccessful, but there were fewer
- EUR/USD: plan for the US session on March 30. Bears respond with active sales after Friday's growth. The next target is 1.0957
- Trading plan for GBP/USD for March 30, 2020
- Trading plan for WTI Crude for March 30, 2020
- Trading recommendations for EURUSD pair on March 30
- Analysis of EUR/USD and GBP/USD for March 30. America's losses from the "coronavirus" can range from 100 to 200 thousand
- BTC analysis for 03.30.2020 - I expect further drop on BTC towards the levels at $4.400 and $3.800. The gap breakout of the
- Trading plan for Gold for March 30, 2020
- GBP/USD analysis for 03.30.2020 - Completed downside correction, buying continuation very possible with main target at 1.2700
- Trading plan for EUR/USD for March 30, 2020
- Analysis for Gold 03.30.2020 - Buying still favorrarble because of the breakout of the Mini pitchfork channel. Upward target
- Yen has found a new ally
- Technical analysis of USD/CHF for March 30, 2020
- Technical analysis of USD/CHF for March 30, 2020
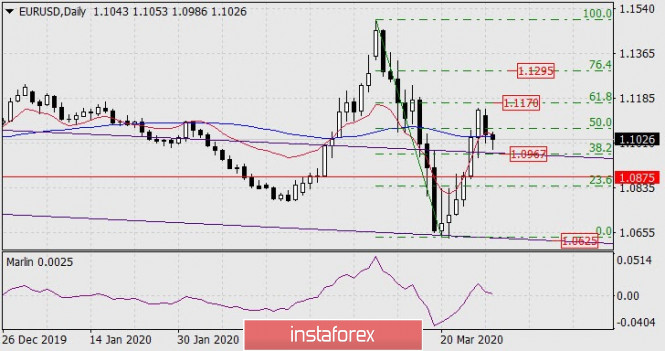
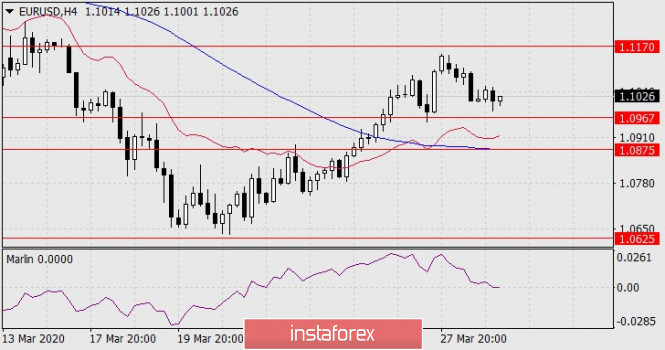
| Forecast for EUR/USD on March 31, 2020 Posted: 30 Mar 2020 08:00 PM PDT EUR/USD The euro begins to be determined with the choice of further movement after the previous six-day growth. On Monday, the support of the MACD line had been tested for strength on the daily chart, today it is broken down in the Asian session. To fix the decreasing condition, the price needs to go below the price channel line at 1.0967, at the point where this line coincides with the Fibonacci level of 38.2%. Overcoming the support opens the 1.0625 target - the line of the embedded channel, so vividly worked out on March 20-23. The signal line of the Marlin oscillator came close to the boundary with a decreasing trend. On the four-hour chart, overcoming the price of the first support at 1.0967 opens the intermediate target of 1.0875 - support of the MACD line. A pin below it opens a strategic target at 1.0625. The Marlin oscillator is already in the decline zone. It opens short positions with the price overcoming 1.0967, s/l above the high of the day (1.1053), t/p in front of the 1.0625 target. The material has been provided by InstaForex Company - www.instaforex.com |
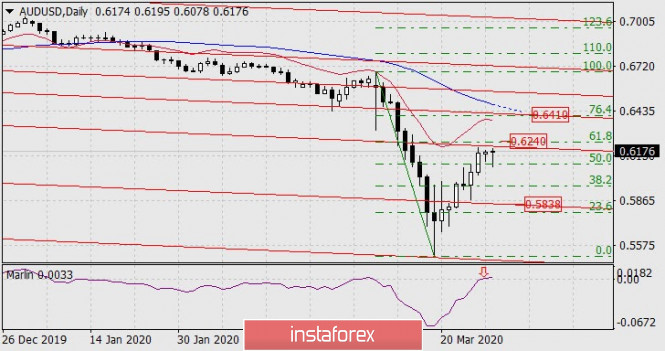
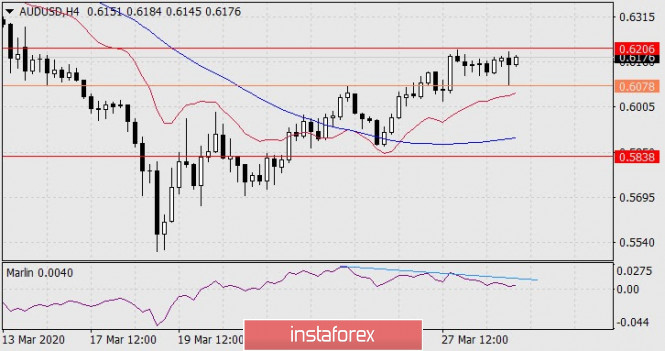
| Forecast for AUD/USD on March 31, 2020 Posted: 30 Mar 2020 08:00 PM PDT AUD/USD The Australian dollar rose by eight points on Monday, continuing to consolidate before the embedded line of the red price channel. The signal line of the Marlin oscillator has slightly moved into the zone of positive values, but while this is not a signal for growth, a reversal can occur directly at the boundary of trends or just above it by natural fluctuations. There are no other signs of an expected reversal. When the price overcomes the Fibonacci level of 61.8% (0.6240), the 0.6410 target opens – the point of intersection of three lines: the Fibonacci level of 76.4%, the price channel line and the MACD indicator line, where it now aims. In case of a reversal, the target of the movement is the embedded line of the price channel at 0.5838. The divergence across Marlin took place on the four-hour chart, but the price is in no hurry to follow it. A slight price growth is possible (limited by the Fibonacci level of 61.8% on the daily chart), and then the divergence will become double, which will further raise the downward pressure. With overcoming the signal level of 0.6078, it is possible to open short positions with the 0.5838 target, s/l above the top of the current day. Opening long positions is associated with increased risk, but is possible with the price taking above 0.6240, aiming for 0.6410, s/l below the low of the current day. The material has been provided by InstaForex Company - www.instaforex.com |
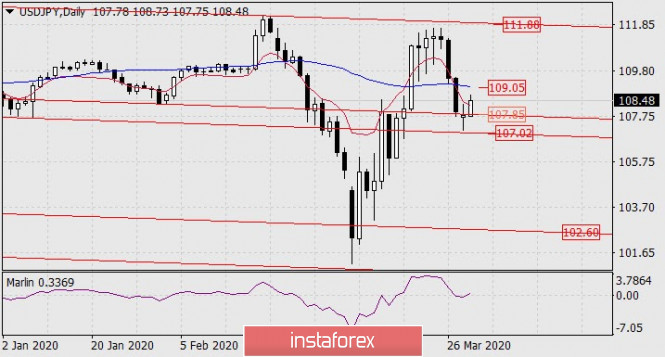
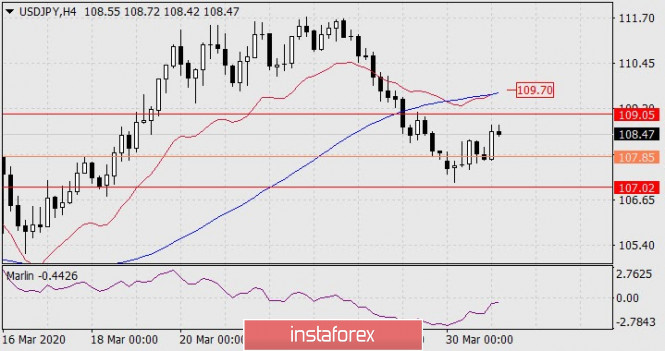
| Forecast for USD/JPY on March 31, 2020 Posted: 30 Mar 2020 07:46 PM PDT USD/JPY Today, the dollar is correcting up against the yen after the previous four-day fall. The closest and most powerful correction resistance is the MACD line on the daily chart on the price of 109.05. Departure of the price to support the price channel line at 107.02 opens the way to the lower channel line to the 102.60 area. Consolidating the price over the MACD line puts the dollar in a very difficult position of uncertainty of freely roaming in the 109.05-111.88 range, which in practice can mean that a certain range could form - a triangle or a flag. The situation is completely decreasing on the four-hour chart: the price is below the indicator lines, the Marlin oscillator is in the negative zone. From which, however, shows the intention to leave. Growth may continue to the MACD line at 109.70, which is higher than the resistance of the MACD line on the daily scale. Even in this discrepancy, uncertainty and possibility that the price could roam around begins. But all this uncertainty is related only to growth. Leaving the price below the linear support of 107.02 opens the way to a decrease to 102.60. |
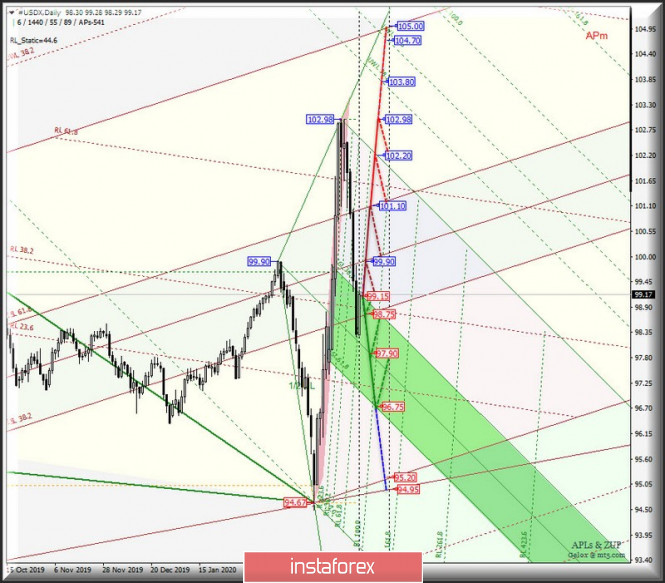
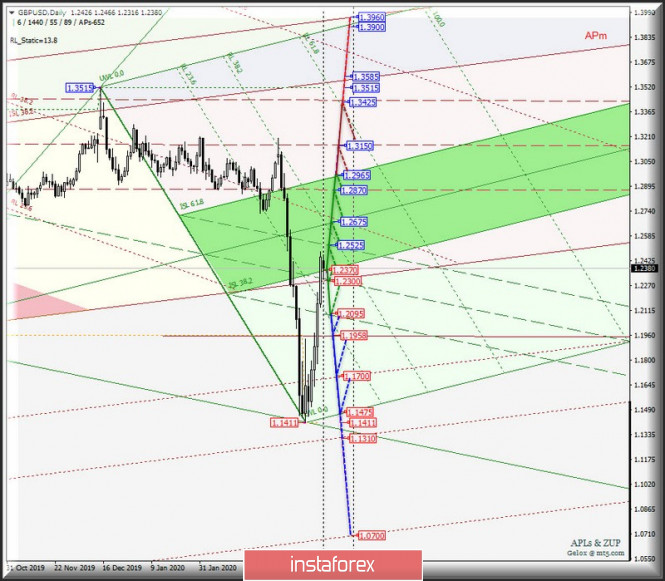
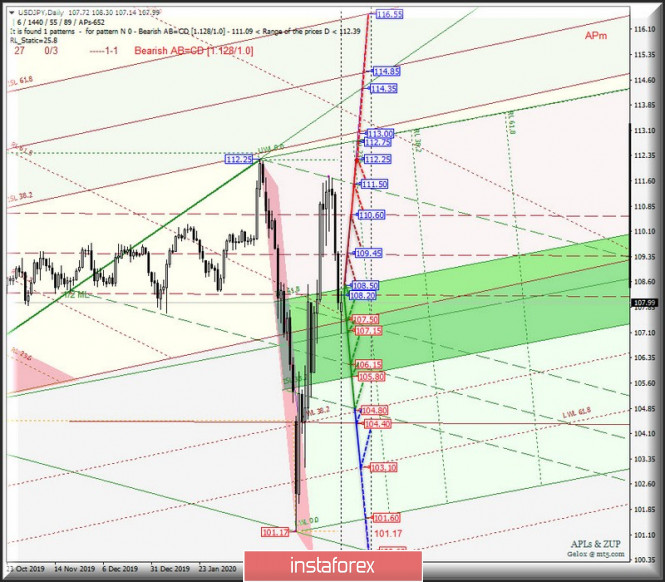
| Posted: 30 Mar 2020 06:54 PM PDT What awaits the main currency instruments in April? Variants of the movement of major currency instruments from March 31, 2020 #USDX , EUR / USD, GBP / USD and USD / JPY - DAILY . Minor operational scale (daily time frame) ____________________ US dollar Index Starting March 31, 2020, the movement of the dollar index #USDX will continue to develop within the equilibrium zone (98.75 - 99.90 - 101.10) Minor operational scale forks. The details of working out the above levels are presented on the animated chart. In case of breakdown of the upper boundary of ISL61.8 (resistance level of 101.10) of the equilibrium zone of the Minor operational scale forks, it will be possible to continue upward movement of the dollar index to goals: - the initial line of SSL Minuette (102.20); - maximum 110.60 ; with the prospect of reaching the warning line UWL38.2 (103.80) of the Minuette operational scale forks. On the other hand, if the lower boundary of ISL38.2 (support level of 98.75) is broken down in the equilibrium zone of the Minor operational scale forks, it will be confirmed that further development of the #USDX movement will occur in the equilibrium zone of the forks (99.15 - 97.90 - 96.75) of the Minuette operational scale forks with the prospect of reaching the initial SSL line (95.20) of the Minor operational scale forks. The markup of #USDX movement options on March 31, 2020 is shown on the animated chart.
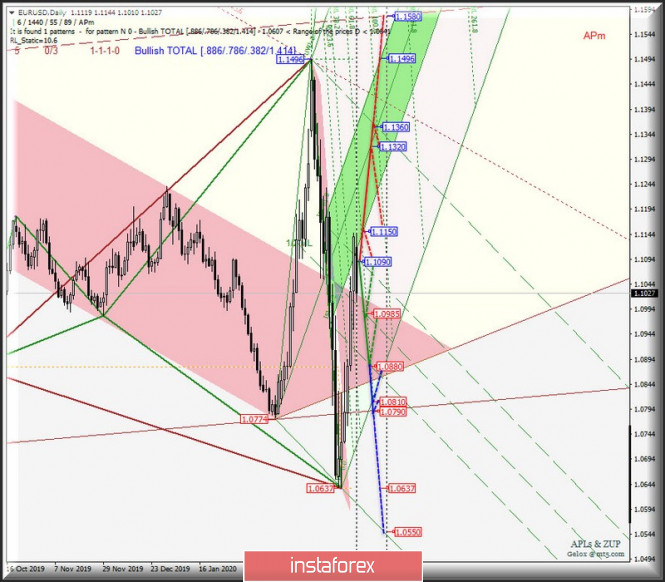
____________________ Euro vs US dollar From March 31, 2020, the single European currency EUR / USD will continue to develop the movement depending on the development and direction of the breakdown of the boundaries of 1/2 Median Line channel (1.0880 - 1.0985 - 1.1090) of the Minuette operational scale forks. The details are shown in the animated chart. In case of the breakdown of the lower boundary (support level of 1.0880) of the 1/2 Median Line channel of the Minuette operational scale forks, it will be possible to reach the initial SSL Minuette line (1.0810) and the LTL control line (1.0790) of the Minor operational scale forks, and in case of breakdown of these levels, the downward movement of EUR / USD will be directed to a minimum of 1.0637. Alternatively, the breakdown of the resistance level of 1.1090 on the upper boundary of the 1/2 Median Line Minuette channel will lead to the resumption of the upward movement of the single European currency to the boundaries of the equilibrium zone (1.1150 - 1.1320 - 1.1496) of the Minuette operational scale forks. The movement options of EUR / USD from March 31, 2020, depending on the development of the 1/2 Median Line Minuette channel, are shown on the animated chart.
____________________ Great Britain pound vs US dollar The development of Her Majesty's currency movement of GBP / USD / USD from March 31, 2020 will be determined by developing the boundaries of the 1/2 Median Line (1.2095 - 1.2300 - 1.2525) of the Minuette operational scale forks. The traffic marking details in this channel is shown on the animated chart. If there will be a breakdown of the lower boundary (support level of 1.2095) of the 1/2 Median Line channel of the Minuette operational scale forks, then the development of the downward movement of GBP / USD to the levels will become relevant : -1.1958 - control line LTL of the Minor operational scale forks; - 1.1700 - warning line LWL61.8 Minor; - 1.1475 - SSL Minuette start line. In contrast, the breakdown of the upper boundary (resistance level of 1.2525) of the 1/2 Median Line Minuette channel will confirm the further development of Her Majesty's currency movement in the equilibrium zone (1.2370 - 1.2675 - 1.2965) of the Minuette operational scale forks with the possibility of continuing it already in the 1/2 Median Line channel (1.2870 - 1.3150 - 1.3425) of the Minor operational scale forks. The movement options of GBP/USD from March 31, 2020 are presented on the animated chart.
____________________ US Dollar vs Japanese Yen The development and direction of the breakdown of the boundaries of the equilibrium zone (105.80 - 107.15 108.50) of the Minuette operational scale forks will determine the development of the USD / JPY currency movement of the country of the rising sun from March 31, 2020. The details of the processing of the above levels are presented on the animated chart. In case of breakdown of the upper boundary (resistance level of 108.50) of ISL61.8 of the equilibrium zone of the Minuette operational scale forks, then the upward movement of USD / JPY to the targets will become possible : - 1/2 Median Line (109.45) of the Minor operational scale forks; - upper boundary of the 1/2 Median Line Minor channel (110.60); with the prospect (after the breakdown of these resistance levels) to reach the final Schiff Line Minuette (111.50) and maximum 112.25. In case of breakdown of the lower boundary (support level of 105.80) of the equilibrium zone ISL38.2 of the Minuette operational scale forks, then there may be a continuation of the downward movement of the currency of the "country of the rising sun" to the goals: - control line LTL (104.40) of the Minor operational scale forks; - warning line LWL61.8 Minor (103.10). The markup of the USD/JPY movement options on March 31, 2020 is shown on the animated chart.
____________________ The review was compiled without taking into account the news background. Thus, the opening of trading sessions of major financial centers does not serve as a guide to action (placing orders "sell" or "buy"). The formula for calculating the dollar index : USDX = 50.14348112 * USDEUR0.576 * USDJPY0.136 * USDGBP0.119 * USDCAD0.091 * USDSEK0.042 * USDCHF0.036. where the power coefficients correspond to the weights of the currencies in the basket: Euro - 57.6% ; Yen - 13.6% ; Pound Sterling - 11.9% ; Canadian dollar - 9.1%; Swedish krona - 4.2%; Swiss franc - 3.6%. The first coefficient in the formula leads the index to 100 at the starting date - March 1973, when the main currencies began to be freely quoted relative to each other. The material has been provided by InstaForex Company - www.instaforex.com |
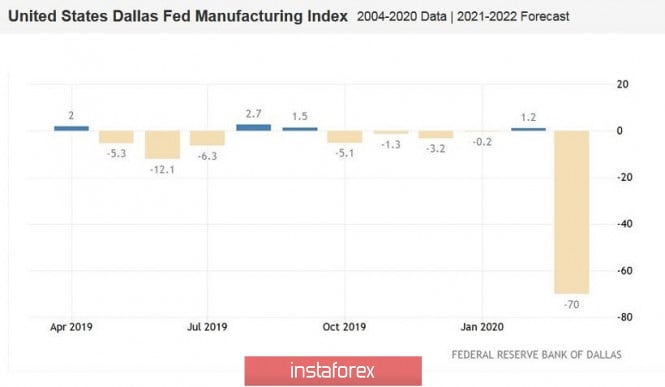
| EUR/USD. EU domestic scandal, 2 trillion dollar support and pending reports Posted: 30 Mar 2020 02:16 PM PDT Over the weekend, US President Donald Trump signed a bill to allocate two trillion dollars to help the economy. After a short political battle, this document was supported by both the House of Representatives and the Senate. The head of the White House approved the law almost immediately after its adoption, reminding reporters that these funds will be used for additional funding for the health care system, business support and direct payments to Americans. By and large, the market did not doubt that in the end US politicians would find a common denominator in this issue and agree on the proposed law. The Democrats did not resist for long, as a prolonged blocking of the bill could turn electoral losses against them. Despite the predictability of this scenario, dollar bulls positively assessed its implementation – the greenback in one way or another strengthened in almost all pairs at the beginning of the trading week. Let me remind you that the previous week was extremely unsuccessful for the dollar - the US currency was rapidly falling in price on all fronts, at the fastest pace in the last ten years. Therefore, the corrective pullback in the wake of a half-empty economic calendar and positive news from the White House looks quite logical. But here the key question is different: are we now dealing with a corrective price pullback or was last week's dynamics a moment of weakness for the greenback? Despite a slight increase in the dollar index (this indicator rose from 98.53 points to the current value of 99.30), dollar pairs react differently to its comeback. For example, the GBP/USD pair actually ignores the US strength, as does the AUD/USD pair. The loonie feels insecure (especially after the Bank of Canada's Friday decision), but the yen, coupled with the dollar, even tried to show character today. Against the backdrop of the above dollar pairs, the European currency looks the most affected. In the first half of today, the EUR/USD bears were able to push the pair under the support level of 1.1060 (the middle line of the Bollinger Bands indicator, which coincides with the Kijun-sen line). Now, sellers are actively trying to take the pair to the area of the ninth figure in order to strengthen their positions and return the general bearish mood to the market. And here it is worth noting that in the case of the EUR/USD pair, it is not so much about strengthening the dollar, but about weakening the single currency. As you know, Brussels could not conduct a blitzkrieg and implement the Marshall Plan to save the eurozone economy. By the way, last week the euro strengthened its position precisely due to optimism regarding the implementation of this scenario - the intentions of the head of the European Council Charles Michel sounded too ambitious. However, last Thursday, European Union leaders at an online summit failed to agree on the scale and tools to support the economy. The parties went to the corners of the ring, giving eurozone finance ministers two weeks to develop possible options. Initially, this fact could not change the optimistic mood of the European currency, but later in the press began to show facts indicating a serious split between the"South and North" of Europe. And this fact has already broken the EUR/USD bulls, especially against the backdrop of coordinated actions of congressmen in the US. As it turned out, the key stumbling block was the so – called "crown bonds" - a common debt instrument for all EU countries that would help finance the response to the coronavirus pandemic. The leaders of Italy and Spain, which are the countries where the most widespread outbreaks of the virus occurred, called for the early introduction of such bonds. In turn, the main opponents of the idea were Germany, the Netherlands and Austria. The leaders of these countries said that at the moment no one knows when the crisis will end, so the EU needs to keep certain tools to intervene later if necessary. However, Italian Prime Minister Giuseppe Conte continued to press his case, emotionally expressing his point of view. As a result, the summit lasted three hours longer than planned, but the parties were unable to find a consensus. The main opponent of the Italian leader - German Chancellor Angela Merkel - said that she prefers to use the European stabilization mechanism (ESM), which was created in 2012 for such purposes – to help the countries of the eurozone in serious financial crises. The arguments continued for six months!) hours, and, according to the European press, in some situations, the leaders of the countries did not restrain their emotions. As a result, the head of the European Council invited all participants of the meeting to return to the debate in two weeks, when all the proposals of the eurozone finance ministers will be considered. In other words, Europe has demonstrated an inability to act quickly, decisively and, most importantly, in a coherent manner. Italians took the current situation quite painfully (especially amid rising deaths from Covid-19 and a complete standstill of business in the country) - according to Conte, it is not just about the current differences between him and the German chancellor, but about a "hard and frank confrontation" regarding the future course of the EU. It is worth noting that political troubles in peacetime also exerted significant pressure on the euro – what can we say about today? Therefore, it is not surprising that the European currency reacted negatively to recent events – after all, the parties did not come to a common opinion, and after the summit, the rhetoric of politicians (both north and south) only tightened. This fundamental background contributes to a deep pullback of EUR/USD. But, in my opinion, until the bears have overcome the support level of 1.0880 (the lower boundary of the Kumo cloud on the daily chart), it is too early to talk about the resumption of the downward rally. Let me remind you that not only Nonfarms data will be released this week, but also other important US macroeconomic reports (ISM indices in the manufacturing and non-manufacturing sectors, the ADP report, the consumer confidence indicator). According to preliminary forecasts, all these indicators will be disappointing, showing anti-records. Last week, devastating data on the labor market were released (an increase in the number of applications for unemployment benefits by three million). A devastating indicator in the field of production was published today – the production activity of the Federal Reserve Bank of Dallas fell to a record low (-70 points). If the key indicators come out even weaker than the weak forecasts, the dollar may again be under pressure. Thus, in order to open short positions with an approximate target of 1.0880, traders need to ensure the strength of the downward movement. To do this, the bears need to overcome the upper limit of the Kumo cloud on the daily chart, that is, break through the 1.1005 mark, consolidating below. In this case, sellers will open a path to the lower boundary of the specified cloud – to the price target of 1.0880. Since at the moment the downward momentum has stalled, sales look risky – selling can only be considered in the area of 1.0990–1.0980. The material has been provided by InstaForex Company - www.instaforex.com |
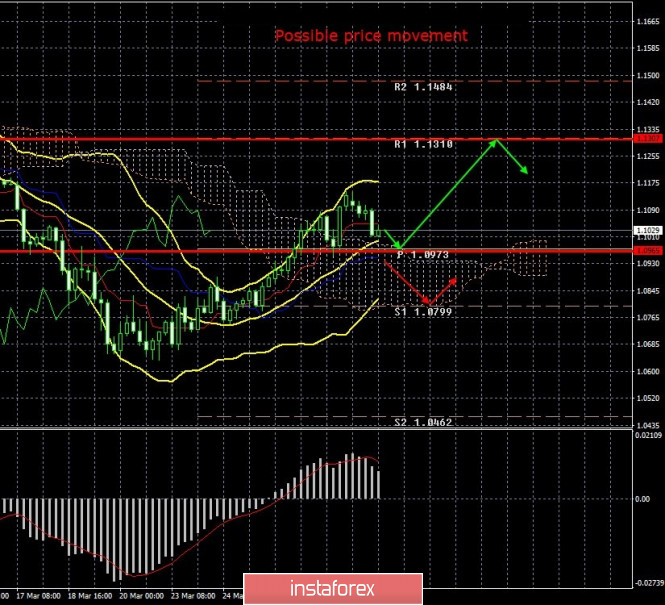
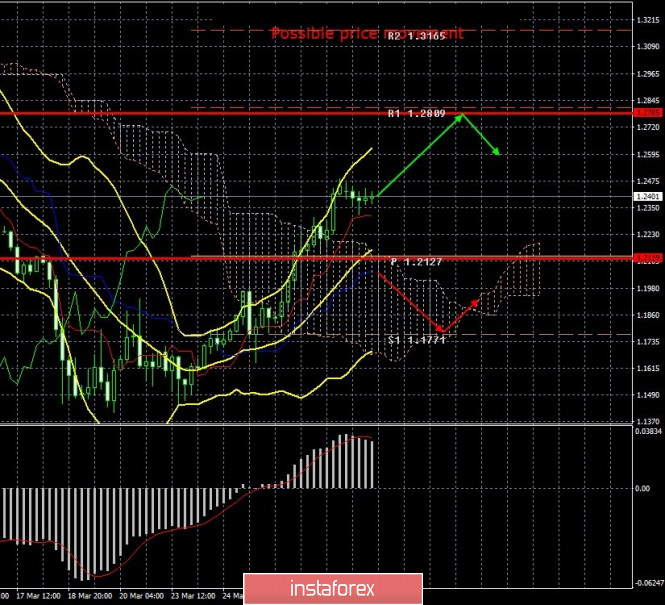
| Posted: 30 Mar 2020 02:16 PM PDT 4-hour timeframe Average volatility over the past five days: 171p (high). The EUR/USD pair ends the first trading day of the week with a downward correction. Today, the pair passed 134 points, and such a day can be considered a boring Monday in current conditions. Judge for yourself, no important macroeconomic statistics were published today. There were also no high-profile events or actions of governments and the central bank. So a correction is logical, but when was the last time the markets behaved logically? Today's correction, therefore, is not a sign that the markets are coming back to normal. We still believe that the entire currency market, every currency pair, and much of the world now depends on the rate of spread of the coronavirus and the results of the fight against the epidemic. Unfortunately, people still have nothing to brag about in the fight against the virus. The growth rate of the spread of the pandemic can be slightly moderated, but they are still exponential. And is it possible? After all, as before, in order to talk about more or less accurate numbers affected by the COVID-2019 virus, you need to simultaneously make tests for the entire population of the planet. Moreover, each country must provide truthful data on the number of cases, and this is also often a problem. In general, it's impossible to calculate exactly how many people in the world or in one country or another are infected. Simple logic suggests that if official numbers show that there are 740,000 who are sick, then the real statistics are much worse. It always happens. The United States is slowly approaching the 150,000 mark of patients. Not a single country in the world, except China, has so far announced that the growth rate of the epidemic is beginning to decline. Australia made a similar statement, but it is still too early to draw such conclusions. You need to wait at least a week or two, and if after this time the growth rate of the pandemic does not begin to grow again, then it can really be recognized that the disease is receding. In Europe and the United States, this moment is still very far away. US President Donald Trump believes that the peak of the epidemic will take place in two weeks. That is, for another two weeks, Americans will become infected with a new disease (which, according to the latest data, is not so new) at an exponential rate. It is easy to calculate that if the incidence per day is about 20%, then after eight days the total number of infected Americans will be 600,000. Trump also made a statement that is very difficult to perceive without surprise. He said that the work of the US government can be evaluated positively if 100 to 200 thousand Americans die from the COVID-2019 virus. According to the US president, if the authorities did not take any measures, then the mortality rate would be at least 2.2 million people. It's hard to say how Trump got these numbers. Moreover, the wording itself is strange. What does it mean "if the authorities hadn't done anything"? Why then do we need power? Moreover, at the moment, around 30,000 people have died from the coronavirus worldwide. Trump admits the loss of 100-200,000 Americans. If, considering that the mortality rate from the virus is on average 5%, then, according to Trump, approximately 2 to 4 million US residents will be infected. Also, Trump extended the restrictive measures in connection with the epidemic until April 30. Thus, on the one hand, the next forecasts from the US leader did not materialize (he previously stated that the coronavirus would not survive the warm season and that the United States would get rid of this scourge by Easter), on the other hand, American residents can breathe easy, no one is not going to drive to work yet. It seems that the US leader nevertheless took into account the absurdity of such a move. 4-hour timeframe Average volatility over the past five days: 333p (high). You could say that the GBP/USD pair is in one place. If you just look at the illustration, it is obvious that the pair practically did not move during the day. However, in fact, it went from the lowest to the highest of the day at 150 points. This is more than the usual volatility of the pound. Thus, despite a certain calm of the markets on Monday, we believe that it is still a long way to the conclusion that the panic is over. Meanwhile, the EU is increasingly starting to talk about extending the transition period for Brexit. David McAllister, who leads the European Parliament's Brexit group, said: "The EU is open to extend the transition." But the ball is now on the British side. So far, the UK government has rejected this option. However, in the current circumstances, London must reconsider its response on the extension." It is still difficult to say at all how the negotiations between Brussels and London will end, given the global pandemic. It seems that, despite the completion of the parties to continue negotiations in the audio and video conferencing modes, the negotiations are suspended. If so, it is likely that London will really have to extend the transition period by two years. In any case, the coronavirus pandemic must first be overcome. From a technical point of view, a microscopic correction began against an upward trend. The MACD indicator has turned down, but the correction is more lateral. The nearest targets and levels of volatility are quite far away. If volatility continues to decline, this will be great news for market participants, as it will mean that there will be some reassurance. Recommendations for EUR/USD: For long positions: The euro/dollar began to adjust on the 4-hour timeframe. Thus, it is recommended to buy the euro in case the MACD indicator turns up or bounces off the Kijun-sen line with the target level of 1.1310. For short positions: It will be possible to sell the EUR/USD pair no earlier than consolidating the price below the important lines of Senkou Span B and Kijun-sen. The first goal is the support level of 1.0799. Recommendations for GBP/USD: For long positions: The pound/dollar took a pause and did not start a downward correction. Thus, it is recommended to buy the British pound with the goal of a volatility level of 1.2785 after the MACD indicator turns up or to remain in longs until a more eloquent signal for correction. For short positions: It will be possible to sell the GBP/USD pair not earlier than when the bears overcome the critical line with the first goal, the support level is 1.1771 and in small lots, since the price will be inside the Ichimoku cloud at this time. The material has been provided by InstaForex Company - www.instaforex.com |
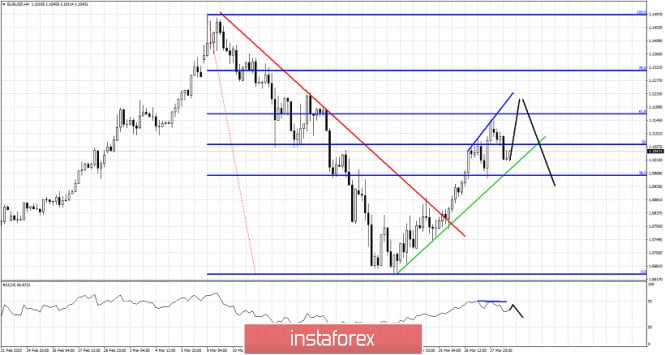
| EURUSD remains in bullish trend. Posted: 30 Mar 2020 01:02 PM PDT EURUSD has pulled back after reaching very close to our target at 1.1160. Price made a higher high at 1.1147 and has since then pulled back towards 1.1011 without making a lower low. The important short-term trend line support remains intact.
Blue lines - bearish divergence Black line -expected price path Green line - support trend line EURUSD remains above the green trend line confirming short-term trend is bullish. Price has made a new higher high but the RSI did not follow. This is a bearish warning. However I believe the most probable scenario would be for price to move for new higher high above the 61.8% Fibonacci retracement and then reverse to the downside breaking the green trend line and the previous higher lows. If price breaks below the green trend line before making a new higher high then we turn immediately bearish targeting 1.06-1.07 area for at least a test of recent lows. The material has been provided by InstaForex Company - www.instaforex.com |
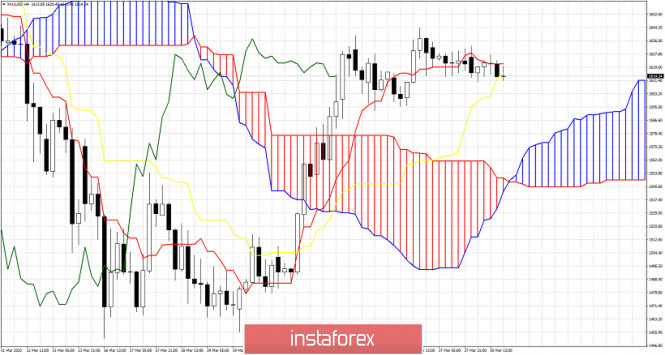
| Short-term Ichimoku cloud indicator analysis of Gold Posted: 30 Mar 2020 12:54 PM PDT Gold price seems to have stabilized its advance around $1,620. Price is moving mostly sideways the last couple of sessions, but I expect price to roll over downwards soon and break below $1,600 towards $1,570.
Gold price is above the 4 hour Kumo (cloud) but vulnerable to a move lower. Price is below the tenkan-sen (red line indicator). A 4 hour close below the kijun-sen (yellow line indicator) will increase chances of a move towards cloud support at $1,570. This is our first target if we see a solid close below $1,610.
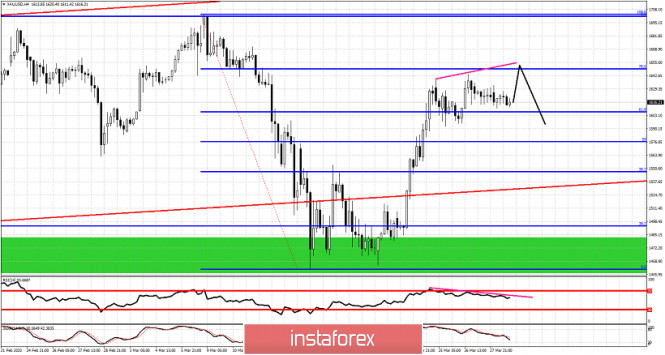
Black line -possible price path Blue horizontal lines - Fibonacci retracement levels Gold price is trading around the 61.8% Fibonacci retracement. As long as price holds above $1,600-$1,610, we favor a push towards $1,640-50 to complete a triple top bearish divergence....assuming the RSI does not make a higher high and gets rejected by the pink resistance trend line. Gold could make a new top at the 78.6% Fibonacci retracement but it is not necessary. In any case I'm expecting Gold to move lower over the next couple of weeks. The material has been provided by InstaForex Company - www.instaforex.com |
| Gold vs dollar: the fight for the title of king of the "safe haven" continues Posted: 30 Mar 2020 08:22 AM PDT
Gold, like all other assets, was hit hard during the panic and mass withdrawal of investors in the US dollar. Against this background, the precious metal fell by more than 14% relative to the March peak of $1,700 per 1 ounce, testing the mark of $1,460. After the Fed announced unlimited QE, the price of gold was able to return to the area of $1,600 per 1 ounce. Goldman Sachs believes that the precious metal is now at a turning point in the next twelve months and will reach the mark of $1,800. "We have long said that gold is the currency of last resort and acts as a hedging tool during a collapse in the foreign exchange market when politicians are trying to soften the blow to the economy and financial system," the bank's representatives said. They see a direct link between the increased availability of USD and the return of gold to the status of a safe haven asset, since investors will not have to sell off assets so aggressively to release cash. "The Fed's return to full-fledged quantitative easing, which actually provides markets with an endless stream of dollars and reduces the value of the US currency, is likely to again increase demand for gold from investors," Goldman Sachs reported. "In the following months, the financial market will see an influx of fiat money that is not backed by anything. This will become a supporting factor for the gold market in the future," Commerzbank believes. "The situation is the same as in 2008 and 2009 when governments and central banks turned on printing presses at full capacity," Sprott Asset Management specialists said.
"The Fed is ready to flood the markets with unlimited cash flow for bond repurchases and repo operations. This is what we call a "bazooka". In this context, expectations of lower inflation rates have finally found their place, thus stopping the growth of real rates. At the same time, the key rate is almost zero," said strategists at TD Securities. "Hedge funds stopped their program of selling gold and began to target long positions, which may give an impetus to further growth in the value of the precious metal," they added. According to experts, the volatility in the gold market will not disappear in the near future, but the US Central Bank was able to cope with the main headache – the pursuit of cash. The Federal Reserve's agreements with fourteen central banks on the exchange of payment flows have somewhat cooled the demand for the greenback. By the end of the week to March 25, five regulators received $200 billion from the Fed, compared with $45 billion listed a week earlier. "It's not clear whether the new swap lines will help rein in the dollar, but at least they make it more affordable," said HSBC analyst James Steele. "Interest rates are likely to remain at levels close to zero, and national governments will try to use fiscal policy to bring inflation back to target levels," said Jim Luke, Manager of the Schroders Fund. He sees the rise in consumer prices as a positive factor for gold. "Fiscal policy can take various forms, and we do not exclude direct interventions such as "helicopter money". Thus, it is difficult to imagine more "bullish" conditions for gold," the expert said. It is expected that interruptions in the supply of physical assets due to the coronavirus pandemic will lead to a "perfect storm", which will be a prerequisite for a sharp jump in the price of gold. The material has been provided by InstaForex Company - www.instaforex.com |
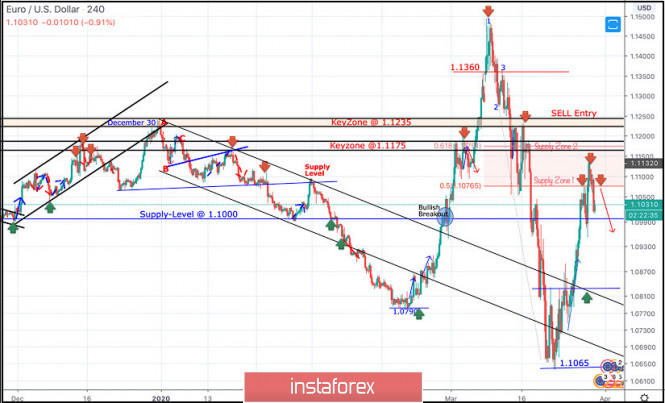
| March 30, 2020 : EUR/USD Intraday technical analysis and trade recommendations. Posted: 30 Mar 2020 07:51 AM PDT
Since December 30, the EURUSD pair has trended-down within the depicted bearish channel until few weeks ago, when a new low around 1.0790 was recently established where the EUR/USD pair looked OVERSOLD after such extensive bearish decline. On February 20, recent signs of bullish recovery were demonstrated around 1.0790 leading to the recent steep bullish movement towards 1.1000, 1.1175, 1.1360 and finally 1.1480 where a (123) bearish reversal pattern was initiated around. This turned the short-term technical outlook for the EURUSD pair into bearish when bearish persistence below the Keyzone of 1.1235 was maintained on a daily basis. Moreover, the mentioned intermediate-term bearish Head & Shoulders pattern has achieved all of its projection target levels. Earlier last week, the EURUSD pair has expressed significant bullish recovery around 1.1065 The recent bullish engulfing H4 candlesticks as well as the recently-demonstrated ascending bottoms indicated a high probability bullish pullback at least towards 1.0980 and 1.1075 (Fibonacci Level 50%). Key Supply-Levels in confluence with significant Fibonacci levels are located around 1.1075 (50% Fibonacci) and 1.1175 (61.8% Fibonacci) where bearish rejection is highly-expected. Moreover, a possible Head & Shoulders reversal pattern may be established around current price levels. Of which, the right shoulder is expected to exist around 50% Fibonacci Level (1.1075). Trade recommendations : Intraday traders can wait for another Intradaily bullish pullback towards the mentioned key-level around 1.1075 and look for some bearish rejection signs as valid SELL signals for short-term trades. S/L to be placed above 1.1130 while Initial T/P level to be located around 1.1000. The material has been provided by InstaForex Company - www.instaforex.com |
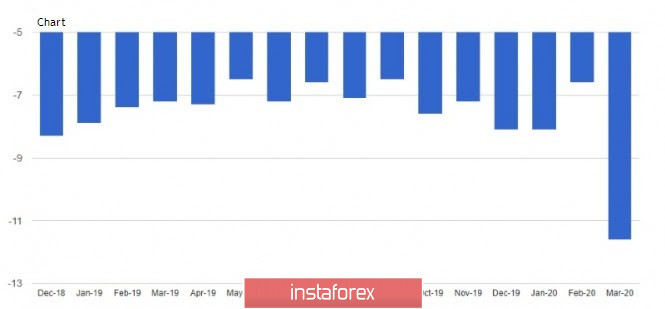
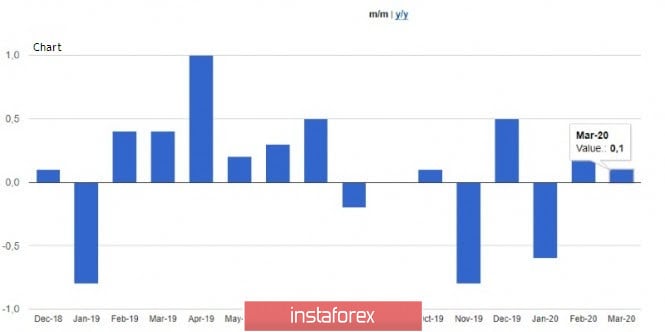
| Posted: 30 Mar 2020 07:41 AM PDT The European currency has lost more than 100 points since Monday's opening level against the US dollar, and the British pound has remained in one place. A weak report on the mood of companies and consumers in the eurozone could not pass for the market without a trace. The speech of US leader Donald Trump also instilled confidence in traders that the US economy will be able to withstand the impact of the coronavirus epidemic. During his interview, the US President said that his country should have enough equipment at the moment when the peak of cases of coronavirus infection occurs, and currently, the federal government is doing everything to provide the necessary amount of equipment to all those in need. Trump expects that the peak of cases of infection will be passed during the Easter period or around this time, and also believes that due to the measures taken in time, the number of deaths will be very low. Also during the interview, the US leader said that he plans to hold a telephone conversation with Russian President Vladimir Putin. The speech will focus on energy resources, trade, and coronavirus. Let me remind you that black gold prices continued to update their annual lows, and WTI crude is currently trading below $20 per barrel. As for fundamental statistics, as noted earlier, the indicator of the mood of companies and consumers in the eurozone collapsed in March against the background of the spread of the coronavirus and the tightening of measures related to its containment. According to the report of the European Commission, the index of sentiment in the eurozone economy, which includes the mood of companies and consumers, fell immediately to 94.5 points in March this year, against 103.4 points in February. The indicator of sentiment in the service sector fell to -2.2 points. The largest drop was observed in Italy, where the index fell from 101.3 points to 83.7 points. The most persistent was Spain, where the index fell from 102.7 points to 99.3 points. In Germany, the index fell by almost 10 points to 92.0. Given the current situation in many countries of the eurozone, it is too early to say that the indicators have reached their lows. Most likely, the April values will also show a large-scale fall. The expected slowdown in consumer price growth in Germany to almost zero once again confirms the fact that the eurozone is one step closer to recession. However, it is worth noting that the slowdown in growth is due to volatile factors, namely a sharp drop in energy prices. A report from the German Federal Bureau of Statistics showed that prices in March increased by 0.1% compared to the previous month, while economists expected a change of 0.0%. Compared to the same period of the previous year, prices increased by 1.4%. With regard to the harmonized standards of the EU indicator, it grew by only 1.3%. Economists had expected an annual price increase of 1.4%. However, the data is still preliminary, and the final report can be expected on April 16. After these data, Goldman Sachs changed its forecast for inflation growth in the eurozone. It is now expected that the consumer price index, harmonized according to EU standards, will grow by only 0.81% in March 2020 compared to the same period of the previous year, after an increase of 1.2% in February. Growth in core inflation may be slightly better at 1.08%. Today, the US Treasury Secretary made another speech, which continued the topic of loans for small businesses, stating that new preferential access to them will be opened in the near future. Steven Mnuchin expressed hope that the developed process of lending to small businesses will be simple, as the economy is facing a difficult quarter due to the suspension of activity due to the coronavirus. However, given the state of the economy before the spread of the pandemic, it is expected to grow sharply in the second half of the year. As for the technical picture of the EURUSD pair, you can see how the bears are gradually returning to the market, and the breakout of the morning support of 1.1050 allows you to count on a further decline in the trading instrument within the day. Sellers of risky assets will focus on the support of 1.0950, but the longer-term goal will be a minimum of 1.0870. GBPUSD The British pound remained trading in one place in the pair with the US dollar after news that the indicator of sentiment in the UK economy does not reflect the whole picture that is happening in the country after the spread of the coronavirus pandemic. According to the data, the index of sentiment in the UK economy in March this year fell only to 92.0 points from 95.5 points in February. Apparently, the data does not take into account the entire March period, when the UK economy stalled due to the pandemic. Therefore, it is not quite right to be optimistic about this indicator. Many experts expect a reduction in UK GDP in the 1st quarter by 1.5%, and in the 2nd quarter immediately by 10-13%. As for the technical picture of GBPUSD, it seems that traders are at a loss and do not know what to do next, since the desire to buy the pound after such rapid growth has decreased, but no one is in a hurry to sell it. A break in the support of 1.2330 will increase the pressure on the trading instrument and lead to its decline to the lows of 1.2150 and 1.1970. Growth is limited by the resistance of 1.2490, a break above which opens the way to the highs of 1.2690 and 1.2780. The material has been provided by InstaForex Company - www.instaforex.com |
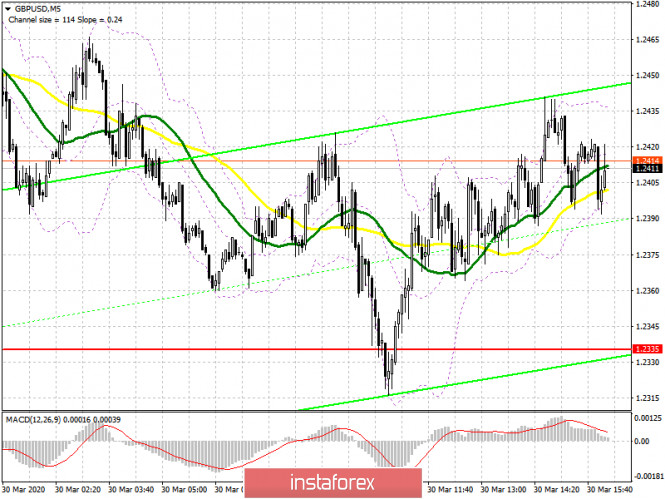
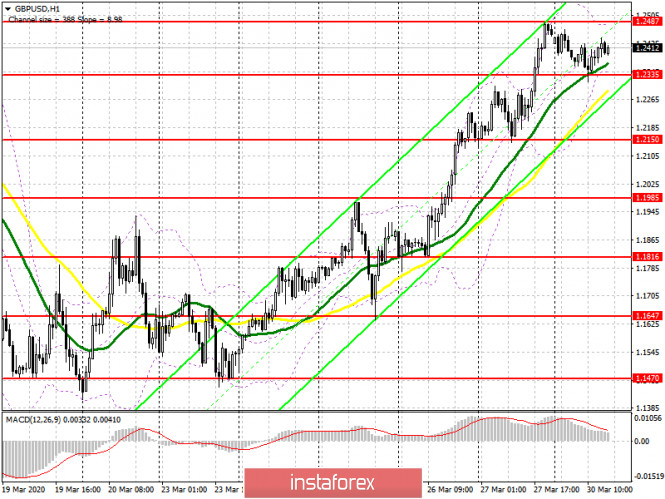
| Posted: 30 Mar 2020 06:38 AM PDT To open long positions on GBPUSD, you need: In the morning forecast, I paid attention to purchases from the level of 1.2335 when forming a false breakout, which happened. This is clearly visible on the 5-minute chart. Bears failed to cope with the task of fixing below this range, which interested speculative players who expect the pound to return to the resistance of 1.2487. Thus, from a technical point of view, nothing has changed in the market. At the moment, buyers will continue to be concentrated on keeping the support of 1.2335, and while the trading is above this level, the demand for the pound will remain that will lead to the continued growth of GBP/USD to the resistance area of 1.2487, a break of which will provide a direct route to the highs of 1.2605 and 1.2686, where I recommend taking the profit. In the scenario of a further correction of the pound to the level of 1.2335, you do not need to rush to open long positions. It is best to wait for the support test of 1.2150, just above which the 50-daily moving average passes, or buy immediately for a rebound from the minimum of 1.1985.
To open short positions on GBPUSD, you need: Sellers of the pound need to try to return the market under their control and to do this, it is necessary to consolidate below the support of 1.2335. The first attempt to do this was unsuccessful. A break of this level will lead to a larger sale of GBP/USD in the area of lows of 1.2150 and 1.1985, where I recommend fixing the profits. The support test of 1.1985 will also indicate the resumption of the bear market. In the scenario of an attempt by bulls to resume the upward trend, only the formation of a false breakout in the resistance area of 1.2487 will be the first signal to open short positions. Otherwise, it is best to sell the pound on a rebound from the highs of 1.2605 and 1.2686.
Signals of indicators: Moving averages Trading is conducted above the 30 and 50 daily averages, which indicates the probability of continuing the upward trend. Note: The period and prices of moving averages are considered by the author on the hourly chart H1 and differ from the general definition of the classic daily moving averages on the daily chart D1. Bollinger Bands A break in the lower border of the indicator around 1.2335 will increase the pressure on the pound and lead to its larger decline. Description of indicators
|
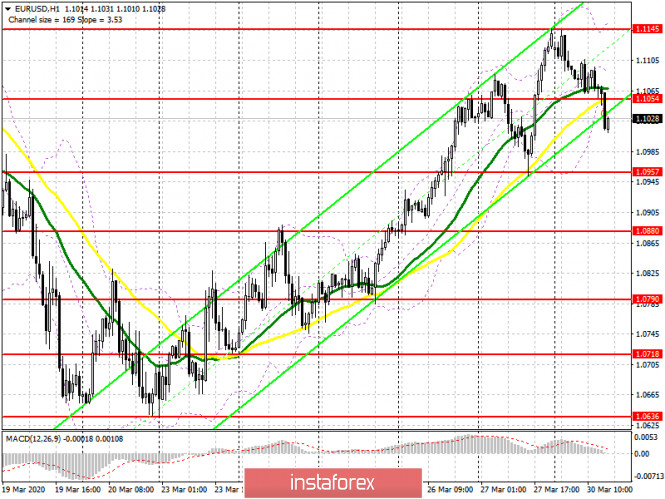
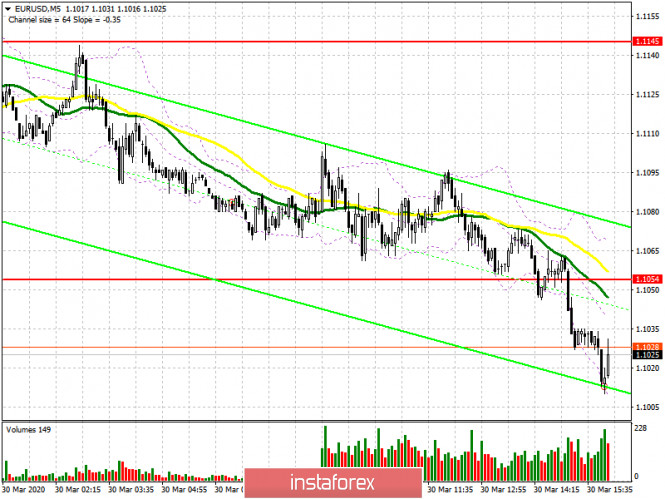
| Posted: 30 Mar 2020 06:30 AM PDT To open long positions on EURUSD, you need: Data on a sharp decline in consumer confidence in the eurozone and a slight increase in inflation in Germany failed to help euro buyers protect the level of 1.1054 in the first half of the day, although there were attempts. This can be seen on the 5-minute chart. After another test of this level, sellers achieved their goal and continued to put pressure on EUR/USD, blocking all Friday's growth. At the moment, the bulls need to return to the resistance of 1.1054, which will allow the pair to maintain an upward trend and lead to a repeated update of the maximum of 1.1145, where I recommend fixing the profits. In the scenario of a further decline in the pair, you can safely return to long positions on the support test of 1.0957, counting on a rebound of 40-50 points within the day, or buy EUR/USD from a larger minimum of 1.0880, the test of which will mean a break in the upward trend.
To open short positions on EURUSD, you need: Sellers coped with the task of reducing the pair to the support of 1.1054 and fixing the pair below this level, which I discussed in detail in the morning forecast, which led to a larger sale of the euro. However, at the reached level, the bears are unlikely to stop and their next goal will be larger support of 1.0957, where I recommend fixing the profits. More persistent players will expect the euro to return to the minimum of 1.0880, the test of which will completely cancel out the entire bullish trend observed since March 20. In the scenario of an upward correction of the pair in the second half of the day, you can still return to sales after a false breakout in the resistance area of 1.1145, but I recommend opening new positions immediately for a rebound only in the area of 1.1231.
Signals of indicators: Moving averages Bears have already achieved a breakout of the 30 and 50 daily moving averages, but it is still very early to talk about a trend reversal since the moving averages have not crossed with each other. Note: The period and prices of moving averages are considered by the author on the hourly chart H1 and differ from the general definition of the classic daily moving averages on the daily chart D1. Bollinger Bands In the case of an upward correction in the second half of the day, the upper limit of the indicator around 1.1150 will act as a resistance. Description of indicators
|
| Trading plan for GBP/USD for March 30, 2020 Posted: 30 Mar 2020 06:06 AM PDT
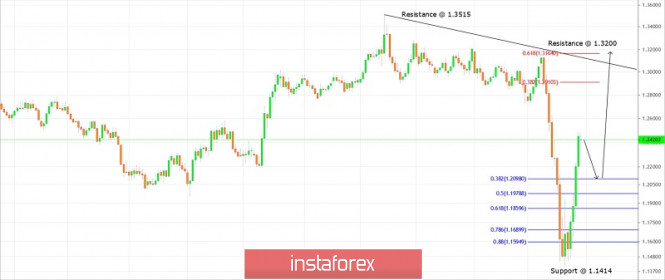
Technical outlook: GBP/USD has rallied sharply after printing lows around the 1.1414 levels last week. The single currency pair seems to have still more room left on the higher side, as bulls are targeting 1.3200 and 1.3500 levels in the immediate short term. The recent boundary that is being worked upon is between 1.1414 and 1.2485 respectively. Please note that fibonacci retracement/support begins from 1.2100 levels and extends up to 1.1850 levels, which s the 61.8% retracement of the above boundary. Aggressive traders should be entering long positions around 1.2100 with risk at 1.1414 and short term target as 1.3200 and 1.3500 respectively. Immediate price resistance is seen around 1.3200 levels, while support is seen at 1.1414 levels respectively. The overall structure remains bullish until prices stay above the 1.1414 levels, going forward. GBP/USD is looking good to be bought on dips from here. Trading plan: Buy @ 1.2100, stop @ 1.1414, target is 1.3500 Good luck! The material has been provided by InstaForex Company - www.instaforex.com |
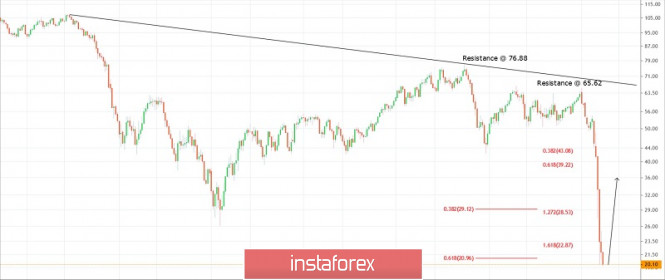
| Trading plan for WTI Crude for March 30, 2020 Posted: 30 Mar 2020 05:42 AM PDT
Technical outlook: WTI Crude has dropped below 20.00 levels today and is currently seen to be trading around 20.15/20 levels at this point in writing. The overall structure since 76.88 resistance might be complete on the downside and most traders would be surprised to witness a bullish reversal from here. The fibonacci extensions of the bearish boundary between 76.88 and 42.40 has been hit around the 20.80 levels as shown on the weekly chart here. Immediate resistance is seen at 65.62 levels, while interim support comes in around the 19.50/60 levels respectively. As WTI Crude hits major fibonacci extensions (acting as support), the commodity is expected to produce a bullish bounce from close to 20.10/20 levels, going forward. Also note that any bullish reversal should be sharp since prices have remained sideways over the last few trading sessions. A break above 25.00 would confirm that a meaningful low is in place around 20.00 levels. Trading plan: Remain long @ 20.10/20, stop below 18.00 target is open. Good luck! The material has been provided by InstaForex Company - www.instaforex.com |
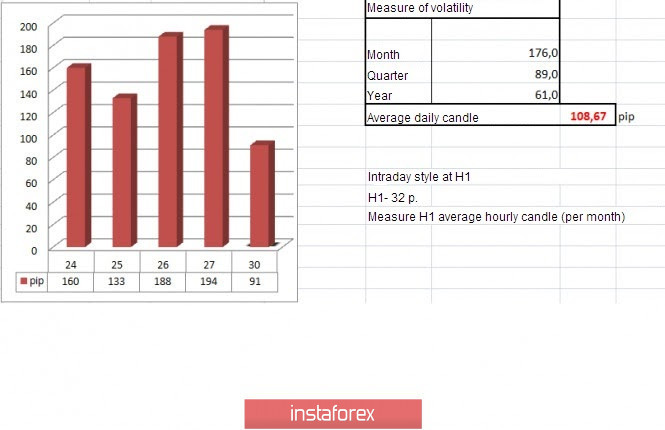
| Trading recommendations for EURUSD pair on March 30 Posted: 30 Mar 2020 05:31 AM PDT From a comprehensive analysis, we see a significant recovery of the quote relative to the downward rally since the beginning of March. And now about the details. Last week was in terms of an upward move, where the quote managed to rebound from the lows by more than 450 points, eventually returning us to the area of 1.1150. In fact, we got almost 60% working off relative to the inertia strokE, as a result of having a half-V-shaped model. Regarding trading approaches, we see that due to high activity and pressure from the external background, the tactic has been reconfigured towards local operations, where transactions are held for a day, if possible transferring them to the next period. It is not necessary to focus on trends because everything is changing very quickly at the current time. Now we are in upward momentum, and tomorrow we are flying down. Thus, work on the current situation is now most relevant, and most importantly profitable. In terms of volatility, we see that Friday's candle set a record of the week in terms of the activity of 194 points, which is 79% higher than the daily average. It is worth considering that we will soon pass the mark of two months, as the characteristic acceleration in the market continues. Volatility details: Monday-155 points; Tuesday-183 points; Wednesday-115 points; Thursday-278 points; Friday-166 points; Monday-151 points; Tuesday-234 points; Wednesday-243 points; Thursday-326 points; Friday-194 points; Monday-191 points; Tuesday-160 points; Wednesday-133 points; Thursday-188 points; Friday-194 points. The average daily indicator relative to the volatility dynamics is 108 points (see the volatility table at the end of the article). Analyzing the Friday day, we see two characteristic bursts of activity, where the first appeared at the start of the Europeans, which led to a local descent to the area of 1.0953, but at the start of the American trading session, the upward move resumed, updating the maximum of the day and reaching 1.1150. As discussed in the previous review, traders considered the coordinates 1.0950 and 1.1080 as reference points, that is, working on their breakdown, where they eventually received positions to buy. The trading recommendation from Friday coincided, having a solid profit in a short period of time. (Buy positions should be considered after fixing the price higher than 1.1090, with the prospect of a move to 1.1145-1.1180) Looking at the trading chart in general terms (daily period), we see a global downward trend, where the last two months of activity has grown at times, forming rapid price jumps both up and down. Friday's news background did not contain any noteworthy statistics on Europe and the United States, and the quote continued to follow the external noise. In terms of the general information background, we continue to record the terrible anti-records that the COVID-19 virus rages in the world. So, at this time, more than 722,000 cases of infection have been recorded, and in America alone, this figure is 142,328. Every day, growth in the world is 8-10% and this entails a new avalanche of panic and economic decline. So, the former head of the Fed, Ben Bernanke, who felt the crisis in 2008, said that the pandemic has a local character on the economy, and it does not bring a global recession. "Yes, the current situation has some superficial similarities with the great depression: a very sharp decline in production, an increase in unemployment, a fall in financial markets. But basically, this animal is a completely different breed. In 2008, problems began in the financial sector with bad mortgages, with a loss of confidence in the banking system and other lenders. This was followed by a panic in the financial system, which hit the real sector of the economy due to a lack of credit. Now the economy has no such problems, and the reason for the decline lies in the non-economic plane. In addition, the banking system was seriously strengthened following the 2008 crisis," the former head of the Federal Reserve told the publication Marketplace Today, in terms of the economic calendar, we have data on pending home sales in the United States, where they expect a strong decline from 5.7% to 1.5%. Further development Analyzing the current trading chart, we see a price fluctuation within the level of 1.1080, being in the stage of a pullback from the value of 1.1150. In fact, we see a temporary stop, during which there were no impulses or price jumps. The current range of 1.1050/1.1150 again plays the role of a stretch model, where traders carefully analyze the situation, since, in the shortest possible time, there will be another surge. In terms of emotional mood, we see that the panic formed on the basis of the spread of the virus and possible consequences forces market participants to take drastic actions in the form of an overflow of assets. Here there are speculators who begin to drive the quote. By detailing every minute the available period, we see that with the opening of a new week, the price movement had the form of a pullback. In turn, traders consider the values of 1.1050 and 1.1150 as reference points. We can assume that in the very near future there will be another jump again, where it is not excluded that the existing framework will still play on the market. In any outcome, focus on the coordinates of 1.1050 and 1.1150, working on their breakdown. Based on the above information, we will output trading recommendations: - Buy positions should be considered after fixing the price higher than 1.1105, with the prospect of a move to 1.1145. The next stage will occur after fixing the price higher than 1.1155, with the prospect of a move to 1.1180-1.1200. - We consider selling positions if the price is fixed below the 1.1045 area, with the prospect of a move to 1.1000-1.0950-1.0900. Indicator analysis Analyzing different sectors of timeframes (TF), we see that based on a significant upward move, the indicators of technical instruments on the hourly and daily periods have passed into a buy signal. Volatility for the week / Measurement of volatility: Month; Quarter; Year. Volatility measurement reflects the average daily fluctuation from the calculation for the Month / Quarter / Year. (March 30 was based on the time of publication of the article) The volatility of the current time is 91 points, which is already very close to the daily average. It is likely to assume that as soon as the set limits fall, there will be acceleration. Key levels Resistance zones: 1.1080**; 1.1180; 1.1300; 1.1440; 1.1550; 1.1650*; 1.1720**; 1.1850**; 1.2100. Support zones: 1.1000***; 1.0850**; 1.0775*; 1.0650 (1.0636); 1.0500***; 1.0350**; 1.0000***. * Periodic level ** Range level *** Psychological level The material has been provided by InstaForex Company - www.instaforex.com |
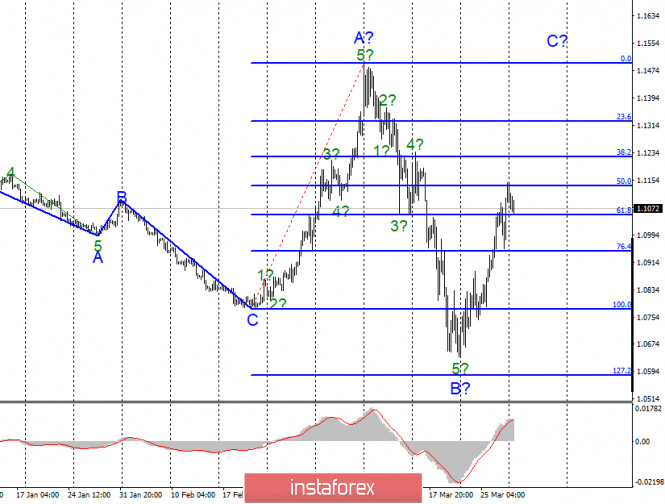
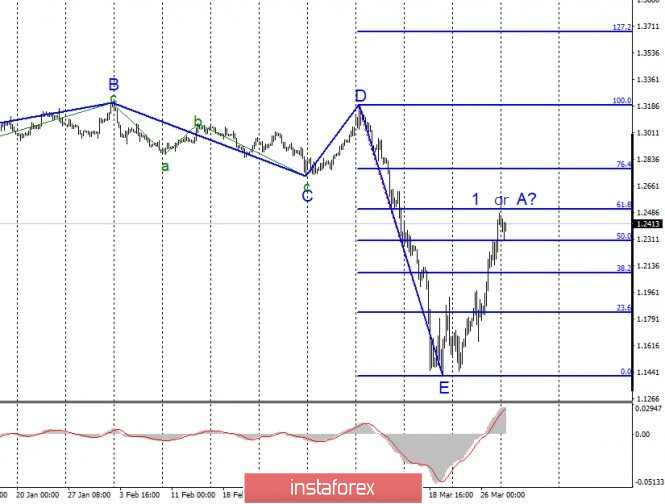
| Posted: 30 Mar 2020 05:00 AM PDT EUR/USD On March 27, the EUR/USD pair gained about 110 more base points and thus continues to build the expected wave C as part of an ascending or horizontal section of the trend that begins on February 20. An unsuccessful attempt to break through the 50.0% Fibonacci level indicates a possible departure of quotes from the reached highs, but the entire wave C does not yet look fully completed. After the past week and all the news, the mood of the markets has clearly not improved, so the shock state remains. Fundamental component: The news background for the EUR/USD instrument on March 27 remains strong. The problem is that it is very difficult to determine what exactly drives the currency market. There is a lot of news coming in now. The forecasts that are heard daily from medical experts and high-ranking officials are disappointing. According to them, the world (and therefore most of the world's countries) has not yet passed the "peak" of the epidemic. This applies even to the most infected Italy, where there are already more than 100,000 cases of the COVID-19 virus and more than 10,000 deaths. Consequently, the number of people infected with the pandemic will continue to grow in Europe. It is also good that the really high loss of human life is not observed everywhere, but only in a few countries (Spain, France), and, for example, in Germany and Switzerland, the death rate is much lower. The situation is no better in America, where the number of infected residents is already almost 150,000. President Donald Trump believes that if from 100,000 to 200,000 Americans die from the virus, it can be considered that the American government "did a good job". If the White House did nothing, the number of deaths would be more than 2 million, according to Trump. It is not known what calculations the US President made, but his speech looks like an attempt to justify potentially high losses from the epidemic. General conclusions and recommendations: The euro/dollar pair presumably continues to build an ascending wave C. The entire section of the trend, which originates on February 20, takes a horizontal form, and waves A-B-C can be approximately equal in size. So far, the main option for the development of events is the construction of the ascending wave C. You can carefully buy the instrument with stop-loss orders under the low of wave B. The final target is 1.1500. GBP/USD The GBP/USD pair gained about 300 more base points on March 27. Thus, the construction of the expected first wave as part of a new upward trend continues. If this assumption is correct, the increase in the instrument's quotes will continue. However, given the high activity of the market, it is difficult to say with certainty when the time will come to build a corrective wave. Fundamental component: The news economic background for the GBP/USD instrument on Friday was also reduced to general news about the spread of the COVID-2019 virus and measures taken by governments around the world. Other news, including economic news, is now poorly taken into account by the markets. In general, oil continues to fall in price, the US stock markets have recovered slightly, but, according to everyone, they have not yet passed the crisis phase. Thus, we can expect new collapses in the stock markets (not only in the US). Since the recession is just beginning, the global economy will continue to slow, and recovery will not begin until the end of the epidemic. According to the forecasts of the same Donald Trump, the American economy will begin to recover no earlier than June 1. In the UK, the number of cases is 20,000. General conclusions and recommendations: The pound/dollar instrument has also supposedly completed the construction of the downward set of waves and the last wave E. Thus, now you can buy the pound sterling based on the construction of a new upward set of waves with targets located near the 25th figure and with stop-loss orders under the low of wave E. Already today or tomorrow, the instrument can begin to build a correctional wave. The material has been provided by InstaForex Company - www.instaforex.com |
| Posted: 30 Mar 2020 04:55 AM PDT Corona virus news:
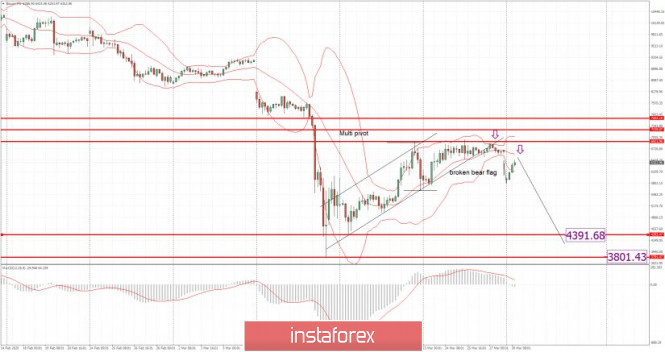
Stringent new international restrictions on movement introduced because of the coronavirus pandemic are threatening the lives of millions of people across the world already caught up in humanitarian emergencies. UN agencies, aid groups and international experts have warned that the new restrictions, which have closed borders and ports, and severely limited the movement of key staff from Africa to South America and Asia, threaten a "dramatic" knock-on effect in countries suffering from conflict, extreme climate events and other crises.Lola Castro, regional director of the World Food Programme (WFP) for southern Africa, said the interruption of food programmes for millions of people in the 12 countries that they cover, which have experienced three years of poor harvests because of drought, would have a "critical impact". Technical analysis: BTC has been trading downwards as I expected. There is the gap down tought the bearish flag pattern, which is strong sign of the sellers. My advice is still to watch for selling opportunities on the rallies. Downward targets are set at the price of $4.390 and $3.800. MACD oscillator is showing decreasing momentum and the slow line turned to the downside, which is another confirmation for our bearish bias. Resistance levels are set at the price of $7.000 and $7.500 Support levels and downward targets are set at the price of $4.390 and $3.800 The material has been provided by InstaForex Company - www.instaforex.com |
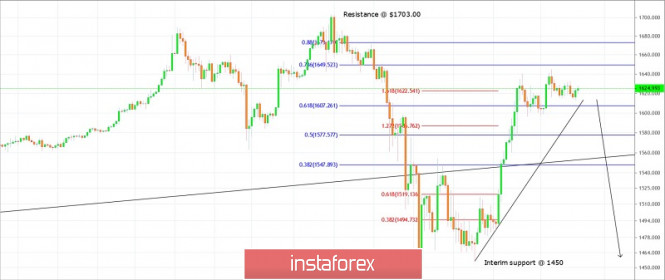
| Trading plan for Gold for March 30, 2020 Posted: 30 Mar 2020 04:54 AM PDT
Technical outlook: Gold remains vulnerable to resume lower again, until prices stay below $1,703 resistance. The recent boundary that is being worked upon is between $1,703 and $1,450 respectively. Please note that the yellow metal seems to have completed its counter trend rally as well towards the $1,620/25 levels. In fact, Gold has almost tested the fibonacci 0.786 retracement around $1,649 levels last week and bears should regain control any moment from here. On the flip side, only a break above $1,703 would nullify the above bearish view and continue further higher towards $1,750. Having said that, the probability for a break above $1,703 remains extremely low and traders must be looking to sell the counter trend rally. A break below the counter trend line shown here will accelerate downside and push prices towards $1,450 levels, going forward. Trading plan: Sell @ 1620/30 stop @ 1703. target is below $1450. Good luck! The material has been provided by InstaForex Company - www.instaforex.com |
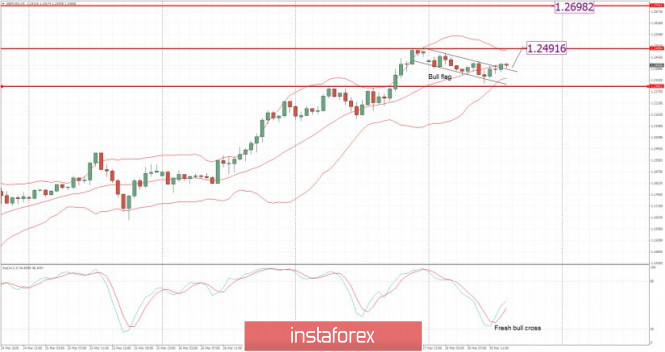
| Posted: 30 Mar 2020 04:35 AM PDT Corona virus news:
Planned negotiating rounds on the UK's future relationship with the EU have been abandoned as a result of the coronavirus pandemic, with Boris Johnson's government still to table a comprehensive legal text for both sides to work on.During a European commission briefing on Thursday, envoys for the EU capitals were told that holding negotiations via video-conferencing had so far proved impossible.The two sides are trying to find a way to maintain dialogue in the coming weeks and months to kickstart the talks, but a previous schedule for negotiating rounds, with weeks set aside for consultation and preparation, has been ditched. Technical analysis: GBP has been trading upwards. The pice tested the level of 1.2400. I found that there is the potential bullish continuation due to the breakout of the bullish flag patten and the strong upward trend condition. Watch for buying opportunities on the dips with the upward targets at the price of 1.2490 and 1.2700. Stochastic oscillator is showing fresh new bull cross and oversold condition, which is sign that further buying can continue. Resistance levels and upwards targets are set at the price of 1.2490 and 1.2700. Support level is set at the price of 1.2315. The material has been provided by InstaForex Company - www.instaforex.com |
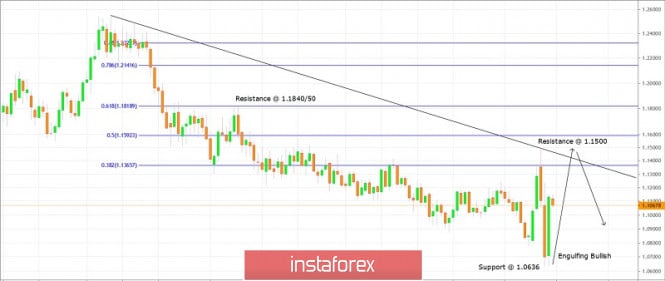
| Trading plan for EUR/USD for March 30, 2020 Posted: 30 Mar 2020 04:18 AM PDT
Technical outlook: EUR/USD has managed to produce an engulfing bullish candlestick patter over the weekly chart after dropping lower towards 1.0630/40 levels earlier. This could be a bullish reversal we have been calling for since last several weeks and the trend might change for the next several months to follow. Aggressive traders may want to go long against 1.0636 levels while a more conservative approach is to wait until resistance at 1.1500 has been taken out. This would confirm that bulls are back in control and buying dips can be considered a safe trading strategy. A two-year long trend line needs to break to trade with confidence on the long side. Interim support at this point in writing is at 1.0636 while resistance is at 1.1500 levels respectively. The overall structure remains bullish until 1.0636 support holds and short term potential target is seen above 1.1500 levels. Trading plan: Initiate long positions between 1.0830 and 1.0950, stop at 1.0636 and target is 1.1500, 1.2000. Good luck! The material has been provided by InstaForex Company - www.instaforex.com |
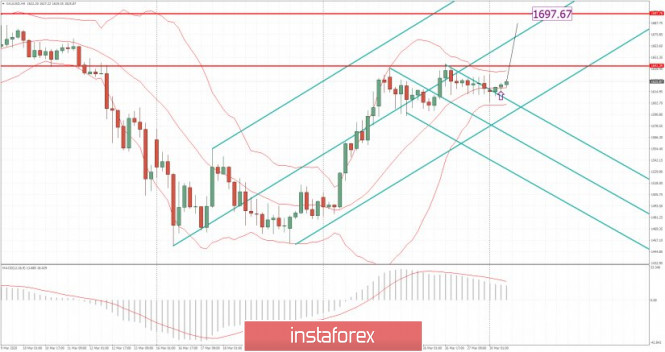
| Posted: 30 Mar 2020 04:15 AM PDT Corona virus news:
Donald Trump has extended America's national shutdown to at least the end of April, claiming his administration will have done a "very good job" if it keeps the US death toll from Covid-19 to fewer than 100,000. The government's top infectious disease expert, Dr Anthony Fauci, warned on Sunday that the pandemic could claim twice that number of American lives, while the top Democrat in Congress, Nancy Pelosi, said many deaths will be an indirect result of the president's denials and delays. Technical analysis: Gold has been trading sideways at the price of $1.625. Anyway, there is the breakout of the Pitchfork upper parallel line in the background, which is sign of the strong upside condition. Watch for buying opportunities with the upward targets at the price of $1.642 and$1.697. MACD oscillator is still showing positive reading above the zero and the slow line is flat. Resistance levels are set at the price of $1.642 and $1.697. Support levels are set at the price of $1.603 and $1.590. The material has been provided by InstaForex Company - www.instaforex.com |
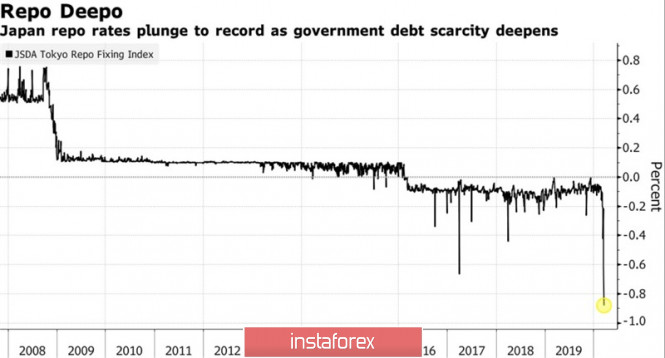
| Posted: 30 Mar 2020 04:10 AM PDT As a rule, Forex paradoxes are not of a long-playing nature, however, the fact that the Fed with the help of unlimited QE and a sharp decrease in the federal funds rate has changed the rules of the game can seriously affect the USD / JPY pair. Over the years, she has been sensitive to the dynamics of the American stock market: the S&P 500 rally was perceived as an improvement in global risk appetite and contributed to the purchase of the dollar against the yen and vice versa. Alas, at the present time, a high correlation of US stock indices and the analyzed pair is given up. The yen behaves inappropriately, and no one knows how long this will last. Reducing borrowing costs to almost zero, the Fed allowed the dollar to take away the status of the main asset-refuge from the yen, which in the face of panic provoked by the coronavirus in the financial markets led to a sharp increase in the USD index. The $ 2 trillion fiscal stimulus from the White House and the Fed's intention to buy as many treasury and mortgage bonds as needed turned everything upside down. The Fed's balance sheet began to grow by leaps and bounds and for the first time in history exceeded $ 5 trillion, and investor interest in the American currency faded sharply. As a result, the week of March 27 was the worst for her in a decade. Of course, the desire of investors to get away with the recently at the zenith of fame dollar is the main reason for the drop in USD / JPY quotes. However, there are other "bearish" drivers. The Bank of Japan is not able to follow in the footsteps of the Fed and buy up as many debt obligations as it wants. The reason for this is the high demand for local bonds. Rates on repo transactions with their use fell to -0.88%, which means that the buyer, the owner of cash, must pay for the transaction. Dynamics of repo rates on the Japanese bond market
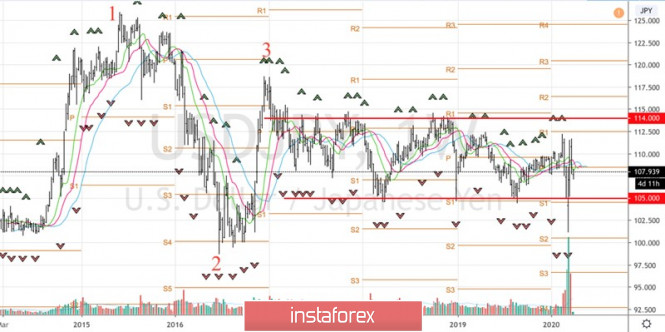
Japanese bonds are actively used by American dealers as collateral, so the high demand for them in the absence of a lack of liquidity is understandable. As a rule, when the monetary stimulus of one Central Bank is unlimited, and the second, on the contrary, has its limits, the currency of the latter grows in value. This is exactly the situation we are seeing in the pair USD / JPY. Interest in the yen is fueled by a busy economic calendar for the United States. In the week of April 3, data will be released on business activity in the manufacturing and non-manufacturing sectors from ISM, on employment in the private sector from ADP, on applications for unemployment benefits, as well as a report on the US labor market for March. Initially, experts issued pessimistic forecasts about a decrease in non-farm payrolls by 200 thousand and an increase in unemployment to 4%, but then the estimates were slightly improved, since the report would not take into account the full month. Most likely, a reduction in employment by 60-100 thousand will not force the S&P 500 to fall, and USD / JPY to grow. In this regard, the increase in the quotes of the pair with the subsequent rebound from the resistance by 108.8 and 109.25 makes sense to use for sales. Technically, the pair is still squeezed in the trading range 105-114 within the current "Splash and Shelf" pattern, which is not expected to be exited in the short term. USD / JPY weekly chart
|
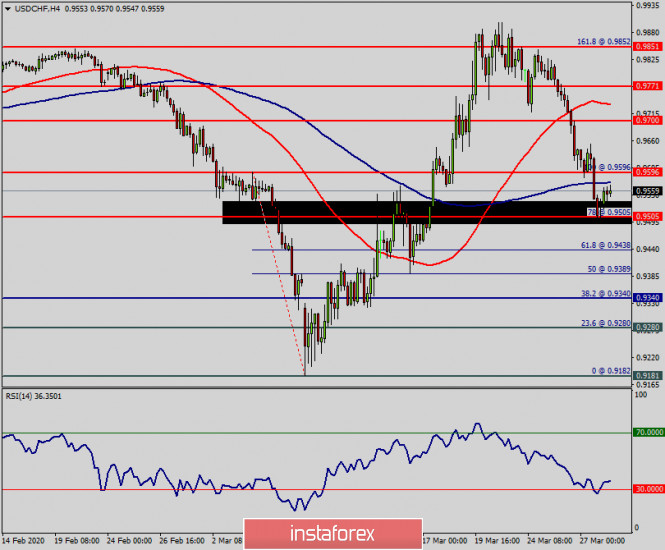
| Technical analysis of USD/CHF for March 30, 2020 Posted: 30 Mar 2020 03:57 AM PDT Overview: Coronavirus impacts on most of pair such as The USD/CHF pair. The Swissy slips as Coronavirus paralyzes Eurozone, for that it dropped from the top of 0.9860 to reach 0.9505 again today. Indicators: The Relative Strength Index (RSI) crossed above 30 highlighting the end of downtrend momentum and a possible start of uptrend move. A general review - summary The USD/CHF pair reached the lowest price at the 0.9182. But it rebounded from the point of 0.9182 towards the 0.9505. Today, the USD/CHF pair continues to move downwards from the level of 0.9505. Today, the first resistance level is seen at 0.9595 followed by 0.9700, while daily support 1 is found at 0.9340. Also, the level of 0.9340 represents a weekly pivot point for that it is acting as major support this week. Amid the previous events, the pair is still in a downtrend, because the USD/CHF pair is trading in a bearish trend from the new resistance line of 0.9596 towards the first support level at 0.9340 in order to test it. If the pair succeeds to pass through the level of 0.9441, the market will indicate a bearish opportunity below the level of 0.9441. Consequently, the market is likely to show signs of a bearish trend. In other words, sell orders are recommended below 0.9441 with the first target at 0.9340. Then, the pair is likely to begin an descending movement to 0.9282 mark. The level of 0.9282 will act as strong support in coming hours. However, if a breakout happens at the resistance level of 0.9596, then this scenario may be invalidated. The material has been provided by InstaForex Company - www.instaforex.com |
| Technical analysis of USD/CHF for March 30, 2020 Posted: 30 Mar 2020 03:57 AM PDT Overview: Coronavirus impacts on most of pair such as The USD/CHF pair. The Swissy slips as Coronavirus paralyzes Eurozone, for that it dropped from the top of 0.9860 to reach 0.9505 again today. Indicators: The Relative Strength Index (RSI) crossed above 30 highlighting the end of downtrend momentum and a possible start of uptrend move. A general review - summary The USD/CHF pair reached the lowest price at the 0.9182. But it rebounded from the point of 0.9182 towards the 0.9505. Today, the USD/CHF pair continues to move downwards from the level of 0.9505. Today, the first resistance level is seen at 0.9595 followed by 0.9700, while daily support 1 is found at 0.9340. Also, the level of 0.9340 represents a weekly pivot point for that it is acting as major support this week. Amid the previous events, the pair is still in a downtrend, because the USD/CHF pair is trading in a bearish trend from the new resistance line of 0.9596 towards the first support level at 0.9340 in order to test it. If the pair succeeds to pass through the level of 0.9441, the market will indicate a bearish opportunity below the level of 0.9441. Consequently, the market is likely to show signs of a bearish trend. In other words, sell orders are recommended below 0.9441 with the first target at 0.9340. Then, the pair is likely to begin an descending movement to 0.9282 mark. The level of 0.9282 will act as strong support in coming hours. However, if a breakout happens at the resistance level of 0.9596, then this scenario may be invalidated. The material has been provided by InstaForex Company - www.instaforex.com |


| You are subscribed to email updates from Forex analysis review. To stop receiving these emails, you may unsubscribe now. | Email delivery powered by Google |
| Google, 1600 Amphitheatre Parkway, Mountain View, CA 94043, United States | |
No comments:
Post a Comment