Forex analysis review |
- CADJPY holding below long term descending trendline and about to break short term trendline support!
- USD/CAD testing upside confirmation, potential bounce!
- Forecast for USD/JPY on April 23, 2020
- Overview of the GBP/USD pair. April 23. Donald Trump can cancel the trade deal with China if Beijing violates the terms of
- Overview of the EUR/USD pair. April 23. The EU may not agree on the sources of the 2 trillion euros needed for the economy
- EUR/USD and GBP/USD. Results of April 22. EU and US are preparing new stimulus packages for their economies. Most likely,
- Comprehensive analysis of movement options for #USDX vs EUR/USD, GBP/USD, and USD/JPY (Daily) on April 23, 2020
- What you should pay attention to when trading Bitcoin
- April 23 is an important day for traders of the EUR/USD pair
- EURUSD rejected once again near upper trading range boundary
- April 22, 2020 : EUR/USD Intraday technical analysis and trade recommendations.
- April 22, 2020 : GBP/USD Intraday technical analysis and trade recommendations.
- Gold challenges important short-term Fibonacci resistance
- Evening review for April 22, 2020. EURUSD. US Senate passes $480 billion cash assistance package
- Gold breaks all barriers
- EUR/USD. April 22. Panic in the oil market. The euro is trading in a narrow price range. Bears are waiting to overcome 1.0827
- EUR/USD: plan for the US session on April 22. The euro remains in the channel, but the bulls have regained their advantage
- GBP/USD. April 22. UK to start human trials of coronavirus vaccine. Pound remains volatile.
- GBP/USD. April 22. UK to start human trials of coronavirus vaccine. Pound remains volatile.
- GBP/USD: plan for the US session on April 22. The pound increased after the March inflation report. The new target for buyers
- Trading recommendations for GBP/USD for April 22, 2020
- Technical analysis of EUR/USD for April 22, 2020
- BTC analysis for 04.22.2020 - Resistance at the price of $7.000 is on the test. Watch for potential downside rotation
- EUR/USD analysis for 04.22.2020 - Watch for breakout of the trading range to confirm further direction
- Analysis for Gold 04.22.2020 - Strong rejection of the daily 20SMA and potential for bigger rally. Upside target is set
| CADJPY holding below long term descending trendline and about to break short term trendline support! Posted: 22 Apr 2020 08:21 PM PDT
Trading Recommendation Entry: 75.887 Reason for Entry: 50% Fibonacci retracement, ascending trendline support Take Profit : 75.407 Reason for Take Profit: Graphical swing low Stop Loss: 76.123 Reason for Stop loss: Graphical swing high, descending trendline resistance The material has been provided by InstaForex Company - www.instaforex.com |
| USD/CAD testing upside confirmation, potential bounce! Posted: 22 Apr 2020 08:19 PM PDT
Trading Recommendation Entry: 1.4165 Reason for Entry: Horizontal swing high, 38.2% fibonacci retracement Take Profit : 1.4292 Reason for Take Profit: 100% Fibonacci extension , 50% fibonacci retracement Stop Loss: 1.3996 Reason for Stop loss: 61.8% fibonacci retracement The material has been provided by InstaForex Company - www.instaforex.com |
| Forecast for USD/JPY on April 23, 2020 Posted: 22 Apr 2020 08:14 PM PDT USD/JPY The yen's situation has not changed. The price continues to stay under the balance indicator line on the downward price channel line on the four-hour chart. The signal line of the Marlin oscillator is preserved within the boundaries of its own wedge. But the general situation also kept declining, which does not change our forecast in which the price will fall in the medium-term in order to support the price channel in the area of 102.40. The first target of 106.85 is the closest embedded price channel line. The price leaving the MACD line of 108.35 will reverse the upward trend with the prospect of growth to 111.70. The price has clearly formed the trading range of 107.30-108.10 on the four-hour chart. The price is above the indicator lines, the Marlin oscillator is also in the growth zone. The signal line of the oscillator is in its own consolidation, in a horizontal trend, the exit of the line from it (as expected - down) will signal that a downward movement will begin to develop. At this moment, the price might be below the lower border of the trading range of 107.30-108.10, then you should wait for the price to go below the MACD line on H4 and overcome the first target of 106.85. On this, the last condition for a move up to 102.40 will be fulfilled. The material has been provided by InstaForex Company - www.instaforex.com |
| Posted: 22 Apr 2020 06:12 PM PDT 4-hour timeframe
Technical details: Higher linear regression channel: direction - downward. Lower linear regression channel: direction - upward. Moving average (20; smoothed) - downward. CCI: -82.4678 On April 23, the British pound as a whole continues to adjust against the downward trend that was formed a few days earlier. Although the last bars of the Heiken Ashi indicator is colored blue, we believe that the correction may continue to the moving average line. In general, we can not but note the too sharp decline in the pound the day before yesterday, which even looked like the beginning of a new wave of panic in the currency market. However, yesterday's trading showed that a new panic is still far away, but the US currency can start to rise in price quite freely. Against the background of the same sincere faith of most investors and traders in the dollar. Although we have already said several times that now the British currency is almost waiting for a fall, at least to the level of 1.1900. Both options, with the "correction against a correction" and with the formation of a new downward trend, suggest a decrease in the pair's quotes. And the fundamental background, which could have stopped the fall in normal, calm times and triggered a new upward movement, is not able to do this now. Both fundamental and macroeconomic backgrounds continue to be ignored by traders. This week we have already witnessed this when all reports from the UK were ignored. On Thursday, April 23, data on business activity for April will be received from the UK. As in the rest of the European Union, business activity in services and manufacturing may significantly decrease compared to March - to 29 and 42 points, respectively. Other more or less important data from Albion is not expected. And these reports are also unlikely to cause any reaction from market participants. On the other hand, information that is very interesting continues to come from the United States every day. Not even from the United States, but from the White House. At the last press conference, Donald Trump openly stated that he can "terminate the deal" with China if it does not comply with the terms of the agreement, which was signed in January this year. Washington allows an option in which China can refer to a clause in the agreement that involves new trade consultations between the countries in the event of a "natural disaster or unforeseen circumstances." Also, the US President during the press conference did not forget to mention that China has been robbing America for years and expressed outrage at the fact that previous presidents looked "through their fingers" at what is happening. After Trump said that under his rule, the trade deficit with China began to decline. "No one has ever been tougher with China than I have," the US leader said. However, this is not the only reason for the heating up of relations between the United States and China in recent times. The main one is, of course, the epidemic of "Chinese infection" all over the world. European countries also believe that the actions of WHO and China need to be checked, as there are suspicions of deliberate concealment of information by Beijing, thanks to which it would be possible to avoid the spread of infection around the world. It is difficult for us to say how the EU and the US will be able to conduct an investigation on the territory of China, however, if China's guilt is proven, then its relations may deteriorate not only with the US. The American President continues to insist that "if it was a mistake" and the virus got out of control in a Chinese laboratory by accident, "then fine." But if China deliberately hid the necessary information or deliberately released a virus, then Beijing must answer for it. The main questions now are: did China hide the number of cases on its territory? Why, if the epidemic began to unfold in China in November, did WHO only make an official statement in mid-December, and in the future did not attach the necessary significance to it? According to the charter of the same WHO, each member of the organization must immediately transmit statistical information in the field of health. All events that may pose an international threat must be reported by each country within 24 hours. Late provision of information or inaccurate data (not to mention deliberately false information) is considered an illegal action and in this case, WHO member countries can claim compensation. Thus, it is possible that the whole case will end up in the UN Court. Well, the prospects for the British pound now depend not on oil, not on China, and not on the scale of the COVID-2019 pandemic. We believe that technical factors still rule the market. More precisely, the reasons for major market players may have their own, this is not a macroeconomic statistics, but we can not predict the actions of major players, of course, we can not. But we can track the trend and trade "according to the trend", not against it. With the help of technical indicators. Thus, in the current conditions, we recommend waiting for signals about the end of the current round of correction and resuming trading on the downside. The senior linear regression channel supports a possible continuation of the downward movement.
The average volatility of the GBP/USD pair has stopped decreasing and is currently 126 points. In the last 20 trading days, the pair almost every day passes from 100 to 200 points. Therefore, we can say that volatility is now stable. On Thursday, April 23, we expect movement within the channel, limited by the levels of 1.2205 and 1.2457. A downward turn of the Heiken Ashi indicator will indicate the end of the upward correction within the downward trend. Nearest support levels: S1 - 1.2268 S2 - 1.2207 S3 - 1.2146 Nearest resistance levels: R1 - 1.2329 R2 - 1.2390 R3 - 1.2451 Trading recommendations: The GBP/USD pair started to adjust on the 4-hour timeframe. Thus, it is recommended that traders now consider selling the pound with the goals of 1.2268 and 1.2207, after the reversal of the Heiken Ashi indicator down (a third blue bar is needed). It is recommended to consider purchases of the British currency not before fixing traders above the moving average with the first goal of the Murray level of "4/8"-1.2451. The material has been provided by InstaForex Company - www.instaforex.com |
| Posted: 22 Apr 2020 06:12 PM PDT 4-hour timeframe
Technical details: Higher linear regression channel: direction - sideways. Lower linear regression channel: direction - downward. Moving average (20; smoothed) - downward. CCI: -164.7434 During the third trading day of the week, the euro/dollar currency pair again fell to the lower border of the side channel, limited by the levels of 1.0817 and 1.0900. Thus, the pair shows a persistent desire to overcome this level of support and continue the downward movement, possibly within the framework of a new downward trend. We believe that it is too early to start selling the euro currency until the level of 1.0817 is successfully overcome. And even if the quotes are fixed at 1.0817, the rather sluggish movement may continue. In the current situation, it is even difficult to say whether the sluggish movement of the euro currency in recent days is good or bad? On the one hand, it is bad, because it complicates the trading process. On the other hand, it is good, because there are no signs of a new wave of panic in the pair yet. But there is something to panic about. First, it is the oil market, which is now being talked about no less than in its time about bitcoin. Second, the "coronavirus", which, despite all the reports of slowing down the spread, continues to infect more and more people in all countries of the world. The first factor reflects what is happening in the economy of any country in the world. The lack of functioning of this very economy. If the demand for oil falls by almost 30 million barrels a day, it is obvious that the business and economic activity of any country in the world is now much lower than in quiet times. The second factor also shows that things are pretty bad in the world right now. The total number of infected people is already 2.6 million, and we repeat, this is just official data from the American Johns Hopkins Institute. They only take into account officially confirmed cases of "coronavirus". Thus, if a person did not pass the test or, for example, does not feel unwell (in this case, he may be a carrier of the COVID-2019 virus), then he is not counted in these statistics. Therefore, according to unofficial opinions of representatives of the medical field and experts, the total number of infected people on the planet may already be 10 million. Thus, we do not see any reason for joy yet. Meanwhile, the EU will hold a video summit today, the theme of which will be "assistance to the EU economy in the face of a pandemic". We have already written about 540 billion dollars that will be used to support small and medium-sized businesses (so that they do not lay off their employees), so-called "targeted compensation". Part of this money will also be sent to small and medium-sized businesses in the form of soft loans (about 200 billion euros). Another 240 billion will be used to support the countries most affected by the epidemic to avoid their default. However, this money will not be enough. The head of the European Council, Charles Michel, said on Tuesday that 540 billion euros will not be enough to restart the economy after its almost 2-month downtime. On the morning of the same day, European Commissioner for Internal Market Affairs Thierry Breton said that the program to restore the economy after the pandemic may require an additional 1.6 trillion euros. This amount is proposed to be collected by raising borrowed funds. However, it is not yet clear whether the idea of so-called "coronabonds", i.e. pan-European bonds, whose guarantors will be each EU country, will be implemented. We have already said that Germany, Austria, the Netherlands, and Finland are against this idea. These countries do not like the concept of going into debt for the sake of Italy, Spain, and others who have been most affected by the crisis. According to other information, the EU summit will consider proposals to assist with 2 trillion euros over the next 7 years. The so-called "plan for the long-term recovery of the EU economy". It is expected that the EU summit will fail, the parties will not come to a common denominator on the source of borrowed funds. As we can see, the alliance has problems in assisting its economy, since it requires the approval of the plan by 27 EU members at once, and in contrast to the same America, which very easily accepts any program to stimulate the economy. From our point of view, if the European Union does not come to a common opinion today, this may create pressure on the European currency. In addition to the fundamental background on April 23, the pair will be pursued by the macroeconomic one. To date, quite a large number of different statistics are planned. The day will start with the publication of business activity in the alliance countries. Unfortunately, nothing optimistic can be said about these reports. Preliminary values for April are likely to show another collapse in business activity indices. This applies to all countries and all areas of the economy. The most important indices for Germany and the European Union can be: 39 - the German manufacturing sector, 28.5 - the German services sector, 39.2 - the EU manufacturing sector, 23.8 - the EU services sector. In principle, nothing new can be said for these indicators. Market participants are unlikely to pay attention to this data. And after lunch, a report will be published in the United States that has been roiling markets in recent weeks. This is a report on applications for unemployment benefits in the United States. According to experts' forecasts, the actual value for the previous week will be equal to 4.2 million new applications. And the total number of unemployed in the United States will grow to 26 million (this is only in the last 5 weeks). A little later, the business activity indices in the services and manufacturing sectors will also be published by Markit, which is also forecast to decline. Unfortunately, all this interesting package of macroeconomic statistics is likely to be ignored by traders again. At least, you need to be prepared for this option. The first place will again be given to "technology", which should be very closely monitored since it is the technical factors that now work best in the market. "Technique" also suggests that the downward movement will continue after a few days of downtime. Above the moving average line, the pair failed to gain a foothold, so it continues to slide down. Both linear regression channels also continue to expand downward. We can only hope that the downward movement will not collapse, as at the beginning of the crisis.
The volatility of the euro/dollar currency pair as of April 23 is 74 points. So far, this indicator does not give cause for concern. 74 points is not even "strong" volatility. Today, we expect the pair's quotes to move between the levels of 1.0747 and 1.0895. If the level of 1.0817 is broken, it will show a strong desire of the bears to continue moving south. A reversal of the Heiken Ashi indicator upward, on the contrary, may indicate a new round of upward correction. Nearest support levels: S1 - 1.0742 S2 - 1.0620 S3 - 1.0498 Nearest resistance levels: R1 - 1.0864 R2 - 1.0986 R3 - 1.1108 Trading recommendations: The EUR/USD pair is trying to continue the downward trend. Thus, traders are advised to wait for the exit from the side channel, that is, fixing below the level of 1.0817, and again trade down with the goals of 1.0747 and 1.0742. It is recommended to consider buying the euro/dollar pair not before fixing the price above the moving average line with the goal of the Murray level of "2/8"-1.0986. The material has been provided by InstaForex Company - www.instaforex.com |
| Posted: 22 Apr 2020 02:11 PM PDT 4-hour timeframe Average volatility over the past five days: 84p (average). The EUR/USD pair was extremely calm and even aloof during trading on Wednesday. The euro/dollar pair was inside a narrow side channel for most of the trading day, which we have already discussed in previous articles, 1.0817 – 1.0900. There was no attempt to leave it during the day, and a relatively strong fall only began during the US session, which can lead quotes out of a narrow price range. No macroeconomic statistics were published today in either the United States or the European Union. Thus, even if traders wanted to react to statistics now, they did not have anything. Those who were interested in the euro/dollar pair only received data on the next aid packages to the economy. We are talking about an additional $480 billion in the United States, $340 of which will go to support small businesses in the form of cheap loans. $75 billion will be spent on medicine and $25 billion on tests for coronavirus. Thus, both the European Union and the United States continue to lend to businesses as soon as they can. However, you can not say that the economy is not bursting at the seams due to the pandemic and quarantine. All we see is that every week or two governments are sending more and more funds to support the economy, but how long will this continue? According to the latest data, the coronavirus will not be completely defeated in 2020, it will not be possible to create a vaccine and immediately treat the entire population of the planet with it. Thus, second waves and third waves are possible, and it is simply impossible to completely remove quarantine measures without the presence of medication. It is unlikely that the Covid-2019 virus will simply disappear by magic. It turns out that the EU and US governments will continue to flood their economies with money. Small and medium-sized businesses will get as many loans as they want, but they will also need to be returned, even if they are interest-free. Or, after the crisis ends, governments will simply need to write off all these debts. And we are talking about trillions of dollars and euros here. We believe that such measures can help businesses, citizens and the economy as a whole only for a short period of time, say up to six months. After that, either the economy could only stay afloat due to the support of further credit injections, and when the current crisis ends, a new one begins - mortgage and credit, or the economy will start to collapse without waiting for the coronavirus crisis to end, despite all the injections into the economy from governments and central banks. In any case, it is necessary to prioritize medicine in the fight against the current crisis. Unfortunately, its possibilities are not unlimited. It supposedly takes about a year to create a vaccine. If it takes 3-6 months to conduct clinical trials of a vaccine, then there is no escape from these numbers. You can not put the vaccine into mass production without studying its side effects. And side effects may not appear immediately, but after some time. Accordingly, time will matter in the vaccine testing phase. So, even theoretically in the near future we will not see a vaccine that could completely kill the virus and is also 100% safe for humans. 4-hour timeframe Average volatility over the past five days: 143p (high). The GBP/USD pair turned up and began a round of correctional movement. Correcting to the Kijun-sen critical line, the pair rebounded off this line and is now trying to resume downward movement. Volatility has slightly decreased compared to yesterday, which is encouraging since yesterday we believed that the second wave of panic had begun. Nonetheless, the total collapse of oil quotes cannot be called a factor that calms global markets. However, traders corrected the pair today and slightly decreased their activity. From a technical point of view, as we said earlier, the British currency will fall in almost any case. The first very likely scenario involves forming a new downward trend after 70% correction relative to the previous one. The second scenario assumes a "correction against correction", in which case we expect a downward movement to the 1.1900 level. At the same time, we do not recommend blindly placing Take Profit orders near this level. As before, we remind you that almost everything is possible on the Forex currency market. Even that which cannot be in principle. Oil quotes perfectly showed us that oil can also be traded at a negative cost. Thus, first of all, we carefully analyze the technical indications of indicators, after which we enter the market. The macroeconomic and fundamental backgrounds are just backgrounds for trading on almost all currency pairs. They have no effect on market participants or their mood. The UK consumer price index for March was published today. This is a very important indicator in normal quiet times, and it means almost nothing at this time of crisis. Inflation in Britain slowed to 1.5% in annual terms and to 0.0% in monthly terms. Thus, we can assume that the statistics today were on the side of the US currency, which... it was cheaper for most of the day. Yesterday, the British pound fell all day when the most important report on applications for unemployment benefits in Britain turned out to be much better than forecasts. In principle, this is all that traders need to know now about the impact of macroeconomic statistics on the movement of the pound/dollar pair. And another important factor that concerns both pair. The current crisis in the currency market began with an unprecedented growth of the US currency. There was only one reason for this. Investors and traders believed that in times of crisis, it was best to keep their money in dollars. Or to pour their capital into the most powerful economy, that is, the American one, which again requires dollars. Then, of course, there was a pullback, a correction, but in general, a second wave of growth of the US currency is now quite likely for the same reasons, given what is happening on the commodity market and huge aid packages to the European and American economies, which only limit their fall at most. Recommendations for EUR/USD: For short positions: The EUR/USD pair continues to adjust inside the side channel on the 4-hour timeframe, which it could not leave today. Thus, sell orders now formally remain relevant, but we recommend waiting for the price to be confidently fixed below the level of 1.0817 and only then should you sell the euro currency with the first goals of 1.0793 and 1.0762. For long positions: It is advised to return to euro purchases only when the price has been consolidated above the critical Kijun-sen line and the upper side channel line at 1.0900 with the first targets of 1.0930 and 1.0971. Recommendations for GBP/USD: For short positions: The pound/dollar began an upward correction today, which could already be completed near the Kijun-sen line. Thus, now we advise you to sell the pound with targets at 1.2276 and 1.2147, since a rebound occurred from the critical line. For long positions: It is recommended to consider new purchases of the GBP/USD pair not before consolidating the price above the Kijun-sen line in small lots with the first goal of pivot level 1.2517. The material has been provided by InstaForex Company - www.instaforex.com |
| Posted: 22 Apr 2020 09:09 AM PDT Minuette operational scale (Daily time frame) What awaits us in the last ten days of this month? Development options for the movement of major currency instruments #USDX vs EUR/USD, GBP/USD, and USD/JPY (Daily) on April 23, 2020. ____________________ US dollar index From April 23, 2020, the movement of the dollar index #USDX will continue to develop within the boundaries of the 1/2 Median Line channel (98.65-99.65-100.50) of the Minuette operational scale fork - details of working out the above levels are shown on the animated chart. If the lower border of the channel is broken 1/2 Median Line Minuette - support level of 98.65 - the development of the #USDX movement will be directed to the goals:
In case of breakdown of the upper boundary of the channel 1/2 Median Line of the Minuette operational scale fork - resistance level of 100.50 - an option for the development of the upward movement of the dollar index to targets:
The layout of the #USDX movement options from April 23, 2020 is shown on the animated chart.
____________________ Euro vs US dollar From April 23, 2020, the single European currency EUR/USD will continue to develop its movement within the 1/2 Median Line channel (1.0790-1.0890-1.0980) of the Minuette operational scale fork - details are shown on the animated chart. If the resistance level of 1.0980 is broken down at the upper boundary of the 1/2 Median Line Minute channel, the development of the upward movement of EUR/USD can continue to the SSL start line (1.1080) and the final Shiff Line (1.1260) of the Minuette operational scale fork. In case of breakdown of the lower boundary of the channel 1/2 Median Line of the Minuette operational scale fork - support level of 1.0790 - the downward movement of the single European currency will be directed to the goals:
The EUR/USD movement options from April 23, 2020, depending on the development of the channel 1/2ML Minute, are shown on the animated chart.
____________________ Great Britain pound vs US dollar The development of Her Majesty's currency movement GBP/USD from April 23, 2020 will be determined by working out the boundaries of the 1/2 Median Line channel (1.2020-1.2240-1.2460) of the Minuette operational scale forks - details of the movement markings in this channel are shown in the animated chart. The breakdown of the upper boundary of the channel 1/2 Median Line Minute - resistance level of 1.2460 - will confirm the further development of Her Majesty's currency movement in the equilibrium zone (1.2460-1.2750-1.3050) of the Minuette operational scale forks. If there will be a breakdown of the lower boundary of the channel 1/2 Median Line of the Minuette operational scale forks - support level of 1.2020 - then the downward movement of GBP/USD can be directed to the targets:
Starting April 23, 2020, we look at the GBP/USD movement options on the animated chart.
____________________ US dollar vs Japenese yen The development and direction of the breakdown of the boundaries of the equilibrium zone (106.50-107.35 - 108.75) of the Minuette operational scale forks will begin to determine the development of the currency movement of the "Land of the Rising Sun" USD/JPY from April 23, 2020 - details of the development of the above levels are presented in the animated chart. In case of breakdown of the lower border of the ISL61.8 equilibrium zone of the Minuette operational scale forks - support level of 106.05 - together with the breakdown 1/2 of the Median Line Minute (105.70) will become relevant to continue the development of the downward movement of the currency of the "Land of the Rising Sun" can be continued to the goals:
In case of breakdown of the upper limit of ISL38.2 equilibrium zone of the Minuette operational scale forks - resistance level of 108.75 - the upward movement of USD/JPY will be directed to the targets:
The markup of #USDX motion options since April 23, 2020 is shown on the animated chart.
____________________ The review is compiled without taking into account the news background, the opening of trading sessions of the main financial centers, and is not a guide to action (placing "sell" or "buy" orders). Formula for calculating the dollar index: USDX = 50.14348112 * USDEUR0.576 * USDJPY0.136 * USDGBP0.119 * USDCAD0.091 * USDSEK0.042 * USDCHF0. 036. Where the power coefficients correspond to the weights of currencies in the basket: Euro - 57.6 %; Yen - 13.6 %; Pound - 11.9 %; Canadian dollar - 9.1 %; Swedish Krona - 4.2 %; Swiss franc - 3.6 %. The first coefficient in the formula brings the index value to 100 on the starting date - March 1973, when the main currencies began to be freely quoted relative to each other. The material has been provided by InstaForex Company - www.instaforex.com |
| What you should pay attention to when trading Bitcoin Posted: 22 Apr 2020 08:29 AM PDT Here comes another article on cryptocurrency, and what has changed over these days and what you should pay attention to. For 20 days in a row, this is how the Bitcoin price hovered, showing a variable fluctuation in the range of 6500/7000 (7500). In fact, this is a kind of stagnation in the recovery phase, which came to us after the general collapse. I do not think it is worth considering it as a certain phase of the movement, where there is a sacred meaning, since it is all very similar to a kind of stabilization process, just after sharp changes in the quote. This process cannot continue permanently, but it is not so easy to interrupt this turn. Here you need a push that will encourage market participants to take action, whether it is the growth of the bitcoin exchange rate or a decline. Crypto enthusiasts try to think optimistically in terms of future development, hence various theories arise. So, one of the most popular assumptions is the growth of the bitcoin exchange rate based on the upcoming halving. The topic is outdated, but if you monitor Google Trends, you will be positively surprised by how popular this query is. Thus, if there is a demand, then there will be a supply, which will serve as a kind of platform for changing the existing mood. What are they waiting for? Everyone is waiting for growth, but they are considering it in terms of gradually increasing the cost. To be more specific, we are talking about 18 months after halving, where the bitcoin exchange rate will consistently update the existing highs. In other words, the borders of stagnation are broken (6500/7000(7500)), after which the current year's maximum is 10522, the crypto's maximum is 13868, and then the historical maximum is 19891. It is not necessary to run headlong and buy cryptocurrency because these are just theories. Personally, it would be an ideal development if we received a kind of support based on halving, which would limit the decline in the exchange rate. With this support, the exchange rate will break out of stagnation and form a new round of recovery. Halving is great, but it's not just the market that lives by it. So, the Federal Reserve Bank (FRB) Dallas conducted a study on the impact of the news background on the behavior of the cryptocurrency exchange rate. According to the study, a pattern was found among a number of news items, so the negative dynamics on the course provoked topics related to restrictive actions: - introduction of general prohibitions on working with digital assets; - introduction of regulatory restrictions on working with cryptocurrencies; - news about the fight against money laundering through the use of digital assets and the financing of terrorism; - introduction of restrictions on working with cryptocurrencies in regulated markets. Positive dynamics was demonstrated by news about topics: - creating a legal framework; - consideration of ETFs; - adaptation of cryptocurrencies in the residential environment; - ICO and IEO. Now we understand that despite the Fed's lack of direct ability to regulate the cryptocurrency, the regulator is able to exert pressure, which will entail a change in the exchange rate. Current development and prospects Looking at the current trading chart, we see the price movement in the range of 6500//7000//7500, where the activity gradually decreases, and the concentration of forces is in the value of 7000. It is worth noting that the compression process occurs within the boundaries of 6500/7500, which does not violate the integrity of the range, and the existing process can lead to the effect of a spring, which will already help provoke acceleration and breakdown of the established boundaries. On one technical analysis, you will not get far when trading cryptocurrency, thus you need a push from the outside. In this case, we are referring to external factors, and one of the strongest interactions with the market is just halving bitcoin. It turns out that if there are no other factors for comparable strength until May 12, then the BTC quote will continue to fluctuate within the range of 6500//7000//7500. We can assume that in the case of a positive reaction to the external background and fixing the price above 7500, the recovery process can be resumed with a gradual move to the levels of 8500-9500. General background of the crypto market Analyzing the total market capitalization, we do not see any drastic changes, this is understandable, the market is drifting, and the total capitalization is hovering around $ 200 billion. If we look at the volume chart in general terms, we will see that the variable ceiling remains at $ 210 billion, and the subsequent resistance is around $ 260 billion. The index of emotions, also known as fear and euphoria of the crypto market, is at the level of 19, which is considered a low indicator. Market participants are reluctant to join the trade and are still under pressure from the external background, as well as the March collapse of the BTC exchange rate. Indicator analysis Analyzing different sectors of timeframes (TF), we see that there is a buy signal relative to the main time periods, but it is worth considering that due to the fact that the price fluctuation is conducted in a side channel, the indicators of technical instruments are variable. |
| April 23 is an important day for traders of the EUR/USD pair Posted: 22 Apr 2020 08:24 AM PDT The euro-dollar pair continues to trade in the flat: traders have not left the eighth figure since last week, and more precisely, since April 16. Dollar bulls regularly take the initiative, but cannot gain a foothold below 1.0850. This fact makes it possible for buyers to control the situation and restrain the onslaught of EUR/USD sellers. Recent events in the oil market have not been able to provide significant support to the US currency, especially since the June futures for WTI and Brent are in positive territory. The oil market's anti-record could not provoke a rally in the dollar, although it dominated almost all of the dollar pairs at the beginning of the week. The EUR/USD pair was no exception here - since it descended to the bottom of the 8th figure, the bears updated the local low and they clearly intended to test the seventh price level. But in the end, they did not have enough information support - the fundamental background for the greenback is quite contradictory, while the situation in the foreign exchange market is changing with kaleidoscopic speed. For example, at the time of writing, June Brent futures were trading at $22 (although in the morning, there was a price low that was last recorded in 1999, when the price fell below $16), and WTI recovered to $15 (whereas it fell to $10 in the morning) . Of course, it's too early to talk about any turning point, but the dollar has currently lost its advantage. In addition, anti-risk sentiment declined in the foreign exchange market due to other fundamental factors. First, the spread of coronavirus is gradually slowing down. Doctors of key European countries declare the corresponding trends, albeit warning that it was only possible for the epidemic to recede due to social distancing. It also became known that scientists from around the world are moving forward in developing a vaccine for Covid-19 - for example, if Chinese virologists conduct experiments on monkeys, then British scientists have already begun testing the drug in humans. Secondly, it became known that tomorrow the leaders of the EU countries during a video conference will consider a plan for the long-term recovery of the community's economy that is worth 2.2 billion euros, which will complement the emergency program for 540 billion. According to Bloomberg, the corresponding draft agreement has already been prepared. The European currency is still showing very cautious optimism - because tomorrow, most likely, Italy and other South European countries will raise the issue of crown bonds (although EU finance ministers have already rejected this idea). According to unofficial information, European leaders will still come to a compromise tomorrow and agree on the above amount, but until these assumptions become a fact, the single currency is in no hurry to rise. Macroeconomic reports also provided additional support for the European currency. In particular, the report of the Centre for European Economic Research (ZEW) was better than expected. Positive dynamics were recorded both in Germany and in the entire eurozone, although indicators remained in the negative area. In particular, the German mood index in the business environment reached -28 points, although according to general forecasts it should have been much lower at around -40 points. Thus, in anticipation of tomorrow, you should not believe the price dynamics of EUR/USD. First of all, an online summit of EU leaders will take place tomorrow, and secondly, important macroeconomic reports will be published. We learn more about PMI indices for key countries in Europe. If these releases follow the ZEW trajectory (i.e. a slight recovery), then the euro will receive significant support. Although in general, analysts expect negative dynamics - especially in the provision of services. As for the manufacturing sector, a slowdown is also forecasted here relative to the previous month. The fact of a negative trend can strengthen bearish sentiment. The US will also release data by tomorrow. Here, the focus will be on the growth rate of the number of applications for unemployment benefits. Let me remind you that this indicator has been growing at an enormous rate for several weeks in a row. This figure jumped to three million on March 26, then it rose to almost seven million, afterwards, it reached 6.6 million the week before last. Last week, this indicator was also supposed to exceed the 6-million mark. But it did not do so, instead it reached 5.2 million. And although such a result is not a reason to be optimistic, nevertheless, dollar bulls retreated from the positions they won. In this case, millions of values are no longer frightening - the trend itself is important. According to the preliminary forecast, 4.5 million applications are expected this week. If the declared figures coincide with the real ones, then we can already talk about the downward trend. This fact could put pressure on the US currency, since the dollar has recently been used as the main defensive asset, and its well-being does not depend on the dynamics of key economic indicators, but on the level of anti-risk sentiment in the market. The index of business activity in the US manufacturing sector is another important indicator on Thursday. It crossed the 50-point border for the first time in many years, dropping to 48 points in March. A further decline of up to 36 points is also expected in April. Bears of the EUR/USD pair will receive support only if the indicator shows a weaker result. To summarize, it should be recalled once again that the EUR/USD bears have repeatedly tried to gain a foothold below the 1.0850 mark over the past week. But buyers seized the initiative every time. Sellers need a more powerful occasion to pull the price into the area of the seventh figure. EUR/USD bulls need a similar occasion (one that is positive) in order to return to the ninth price level. Therefore, trading this pair in the run-up to tomorrow is at least risky - the pendulum can swing in one direction on Thursday, determining the medium-term vector of the pair's movement. The material has been provided by InstaForex Company - www.instaforex.com |
| EURUSD rejected once again near upper trading range boundary Posted: 22 Apr 2020 07:31 AM PDT EURUSD tried earlier to push above 1.09 resistance. As we noted in our last analysis, EURUSD is mostly moving sideways between 1.09 and 1.08. Today bulls were unable to break resistance and the rejection near 1.09 brings price back to mid 1.08.
Red lines - trading range EURUSD is still inside the consolidation range. However price according to signals from the 4 hour and Daily charts continue to support the bearish scenario for a move towards 1.06 and lower. Trend might be neutral as price moves sideways the last couple of sessions, but down trend for the Daily chart has not changed.
Blue line - short-term support Our bearish medium-term view for a move below 1.06 has not changed as the recent highs in EURUSD are each time lower and lower. Confirmation of our scenario will come with the break below 1.0760. The material has been provided by InstaForex Company - www.instaforex.com |
| April 22, 2020 : EUR/USD Intraday technical analysis and trade recommendations. Posted: 22 Apr 2020 07:24 AM PDT
Since December 30, the EURUSD pair has trended-down within the depicted bearish channel until the depicted two successive Bottoms were established around 1.0790 then 1.0650 where the EUR/USD pair looked OVERSOLD after such extensive bearish decline. Few weeks ago, the EURUSD pair has expressed significant bullish recovery around the newly-established bottom around 1.0650. The following bullish engulfing H4 candlesticks as well as the recently-demonstrated ascending bottoms indicated a high probability bullish pullback at least towards 1.0980 and 1.1075 (Fibonacci Level 50%). Key Supply-Levels in confluence with significant Fibonacci levels are located around 1.1075 (50% Fibonacci) and 1.1175 (61.8% Fibonacci) where bearish rejection was highly-expected upon the latest bullish pullback that took place by the end of March. That was when the depicted Head & Shoulders pattern was demonstrated around the price levels of (1.1000 - 1.1075). Shortly after, further bearish decline was demonstrated towards 1.0800 where the nearest demand level to be considered was located near the backside of the broken channel (1.0800-1.0750). Early signs of Bullish rejection have been manifested around the price zone of (1.0800-1.0750) leading to the recent bullish spike up to 1.0990. The short-term technical bullish outlook remains valid as long as bullish persistence is maintained above the recently-established ascending Bottom around 1.0830. Further bullish advancement is expected to pursue towards 1.1000, 1.1075 then 1.1175 where 61.8% Fibonacci Level is located. Despite the recent bearish decline, the price zone of (1.0815 - 1.0775) stood as a prominent Demand Zone which has been providing bullish support for the pair. On the other hand, Please note that any bearish breakout below 1.0830 or 1.0770 (the recently established bottoms) invalidates the previously-mentioned bullish outlook. Trade recommendations : Intraday traders should be looking for valid short-term BUY trades around the price zone of 1.0815 - 1.0775. S/L to be placed below 1.0740 while T/P levels to be located around 1.0850, 1.0900 and 1.1075. The material has been provided by InstaForex Company - www.instaforex.com |
| April 22, 2020 : GBP/USD Intraday technical analysis and trade recommendations. Posted: 22 Apr 2020 07:20 AM PDT
Recently, the GBPUSD has reached new LOW price levels around 1.1450, slightly below the historical low (1.1650) achieved in September 2016. That's when the pair looked very OVERSOLD around the price levels of 1.1450 where a double-bottom reversal pattern was recently demonstrated as depicted on the chart. Technical outlook will probably remain bullish if bullish persistence is maintained above 1.1890-1.1900 (Double-Bottom Neckline) on the H4 Charts. Bullish breakout above 1.1900 (Latest Descending High) invalidated the bearish scenario temporarily & enabled a quick bullish movement to occur towards 1.2260. Next bullish targets around 1.2520 and 1.2680 were expected to be addressed if sufficient bullish momentum was maintained. However, early bearish pressure signs have originated around 1.2470 leading to the previous bearish decline towards 1.2265. That's why, H4 Candlestick re-closure below 1.2265 was needed to hinder further bullish advancement and enhance the bearish momentum on the short term. On the other hand, the recent bullish persistence above 1.2265 has enhanced another bullish pullback movement up to the price levels of 1.2520-1.2590 where early signs of bearish rejection were manifested. A bearish reversal pattern may be in progress. That's why, the current bearish decline below 1.2520 is probably confirming this reversal pattern. Bearish persistence below 1.2265 is needed to enhance another bearish movement towards 1.2100, 1.2000 then 1.1920 where price action should be evaluated again. Trade recommendations : Conservative traders should be looking for bearish breakout below 1.2265 as a valid SELL entry. T/P level to be located around 1.2100, 1.2000 then 1.1920 while S/L should be placed above 1.2400. The material has been provided by InstaForex Company - www.instaforex.com |
| Gold challenges important short-term Fibonacci resistance Posted: 22 Apr 2020 07:12 AM PDT Gold price has broken above the short-term bearish channel. This is a good sign. However Gold price is now challenging important Fibonacci resistance and cloud resistance. If Gold price turns lower from current levels, then the chances of breaking below $1,675 will increase dramatically.
Red lines - bearish channel Gold price is trading above $1,700 again and it is now challenging the 61.8% Fibonacci retracement of the decline from the 2020 highs. Breaking above $1,715 will open the way for a move towards recent highs and why not break them. This break out above the 61.8% Fibo will coincide with the break out of the 4 hour Kumo.
|
| Evening review for April 22, 2020. EURUSD. US Senate passes $480 billion cash assistance package Posted: 22 Apr 2020 06:27 AM PDT
The US Senate made a very important decision by passing a new package of economic assistance at $480 billion. Why is it important? The breakdown of the aid is as follows: 75 billion is allocated for medicine, 25 billion is for coronavirus testing while the rest which amounts to $340 billion is allocated to support for small businesses through loans. A business can get a loan of up to $10 million and the loan can not be repaid if at least 2/3 of the loan was spent on preserving jobs and creating new jobs. The United States and Europe took different paths in solving the crisis. EU countries emphasized business support by paying business' compensation for maintaining salaries of 70-80% under quarantine. While in the US, payments were sent directly to people, the businesses did not receive anything which provoked a massive reduction in workers to 22 million (judging by the weekly applications for unemployment benefits). A new package can significantly improve the situation. In Russia, many well-known economists and politicians appealed to the authorities with demands and calls to help people and businesses by paying money to people who are forced to follow quarantine rules, to compensate small businesses for the salaries of workers for forced downtime, and to cancel part of the utility bills (as poor Georgia did). In response to this, the government, Moscow Mayor Sobyanin, the Central Bank, as well as the heads of the largest banks (Sberbank, VTB, Otkrytie) all spoke out publicly against distributing money to the population saying that Russia's budget will not be able to carry this through and that it is not necessary to do so. My opinion is that the leaders of the banks and the authorities do not understand that giving money to small businesses (having to close the business at the request of the authorities) is not philanthropy. The business will go bankrupt and shut down, the economy will lose up to 10 million jobs. People who have not received help when they cannot go to work (as decided by the authorities) will cut consumption sharply, the economy will lose a significant part of demand and the production and trade will fall. This will cause a new wave of reductions, and tax revenues will drop sharply. The economy will roll back 10 years and will recover very long and slowly. Understanding all this, even such inveterate supporters of hard capitalism, like Trump and Republicans in the United States, go on free distribution of money to the population and small business. Otherwise, it will be bad and the crisis will stretch for 10 years. We will see the effect of this difference in crisis management policies when the global economy emerges from the crisis. EURUSD: Buy from 1.0900. Sell from 1.0810. The material has been provided by InstaForex Company - www.instaforex.com |
| Posted: 22 Apr 2020 05:21 AM PDT The collapse of the US WTI oil below zero USD urged investors to rush to safe-haven assets. This allowed gold to quickly restore ground, and traders were able to form long positions at the level of $1,665 per ounce. Commodity market remains highly volatile while US Treasuries keep holding at historically low levels. It seems that the US dollar is not going to surge even amid the drop of S&P 500. These conditions are perfect for the precious metal which is aiming at the target of $1,800. However, according to several major banks, the bulls are not going to stop here. BofA Merrill Lynch raised its 18-month outlook for gold from $2,000 to $3,000 an ounce. The estimates are 50% higher than the previous record reached in 2011. The Bank expects the gold to trade on average at $1,695 in 2020 and at $2,063 in 2010. The manufacturing activity is contracting worldwide, expenses are growing, and central banks' balance sheet may soon double. Under such conditions, the major world currencies will weaken whereas the XAU/USD quotes will rise. ETF supporters also believe in this scenario. The stocks of specialized exchange-traded funds have grown by 14% since the beginning of the year and reached their highest level since April 2019. They continue to increase over the past 21 days. The monthly fund flow to the ETF SPDR Gold Shares was the largest since 2016. Fund Flow at SPDR Gold Shares When the global economy entered the time when debts can be cashed in, world's central banks thought they could fully control this process. However, the history proved that is not always the case and the best way to stay on the safe side is to invest in gold. The XAU/USD quotes are appreciating now when the US dollar is stable. But what will happen when the US currency begins to weaken? Exactly! The precious metal will surge rapidly to its highest levels. Indeed, when the Fed buys $41 billion of debt every day, there is no reason to expect a slowdown in its balance sheet. It took some time for the Central Bank to return to more or less normal levels after the previous crisis. It took several years, actually. Now the process will go even slower, the balance may increase up to $9-12 trillion. So the gold is very likely to renew its historical high last seen in 2011. According to the Committee on Responsible Federal Budget, the US public debt in 2023 will reach 107% of GDP, which is higher than in the period after the Second World War. The budget deficit will expand to almost $4 trillion. The deteriorating financial situation in the country will slow the process of economic recovery which is bad news for the US dollar. Technically, a return of gold above the pivot levels of $1,700 and $1,725 per ounce will increase the risks of an uptrend. Then we can talk about the targets of 161.8% according to patterns AB = CD which correspond to the marks of $1,805 and $1,860. I would recommend holding the long positions formed on the rebound from the support level at $1,66 and increasing them on the rollbacks. Gold, daily chart |
| Posted: 22 Apr 2020 04:52 AM PDT EUR/USD – 1H.
Hello, traders! On April 21, the euro/dollar pair fall to the lower line of the sideways trend corridor, from which it was rebounded with a reversal in favor of the European currency and the beginning of growth in the direction of the upper line of the corridor. Thus, the mood of traders at this time remains neutral. The pair's quotes are limited to the levels of 1.0827 and 1.0892. Until traders are able to move the rate out of this corridor, I do not expect a resumption of the trend movement. In the world markets, meanwhile, a new panic began. At first, oil quotes (May supply contracts) fell in price to - $ 37, which has never happened before. Of course, this does not mean that for every barrel of oil that the buyer wanted to buy, he was paid an additional $ 37. This means that no one needed the May oil supply contracts and it was the contracts that were cheaper, not the oil itself. However, black gold continues to beat all the anti-record values. WTI has already fallen to $ 12, Brent - fell to $ 16, but now it has recovered to $ 20, the Russian Urals - fell below $ 10. In the near future, OPEC+ will hold a new emergency meeting to discuss the possibility of further reducing oil production. EUR/USD – 4H.
As seen on the 4-hour chart, the pair's quotes returned to the Fibo level of 23.6% (1.0840). The new downward trend line defines the mood of traders in the long term as "bearish". But for now, the currency market is relatively quiet. At least the euro/dollar pair. The pound is more active. Based on this, the further fall of the quotes in the direction of the corrective level of 0.0% (1.0638) is still questionable since the pair does not manage to close under the Fibo level of 23.6%. At the same time, there is also no rebound from this level, which would allow traders to buy euros. Fixing the pair's rate above the downward trend line will work in favor of the EU currency and change the current mood of traders to "bullish". EUR/USD – Daily.
On the daily chart, the euro/dollar pair fall to the Fibo level of 23.6% (1.0840) and continues to remain near it. I also built a new "triangle" that perfectly displays the decline in trader's activity in recent weeks. EUR/USD – Weekly.
On the weekly chart, the euro/dollar pair continues to trade near the bottom line of the "narrowing triangle". The rebound of quotes from this line still allows us to expect an increase in quotes in the long term in the direction of the level of 1.1600 (the upper line of the "triangle"). Closing the pair under the "triangle" will work in favor of the US currency and, possibly, a new long fall. Overview of fundamentals: On April 21, there was not a single important report or news in the European Union or in America. Thus, weak movements of the euro/dollar pair and the absence of a trend correspond to the information background. News calendar for the United States and the European Union: On April 22, the calendars of economic events in the European Union and the United States are empty again. Traders today will again have nothing to pay attention to. COT (Commitments of Traders) report:
A new COT report was released on Friday. It showed no major changes in the mood of hedgers and speculators. Major market players were again engaged in getting rid of long and short contracts. The first category lost 12,399 contracts during the week, while the second category lost 8,233. The increase was recorded only for long-term contracts of the "Non-commercial" group, i.e. speculators. However, these same speculators have been actively getting rid of short contracts in recent months, not believing that the dollar will become more expensive again. The overall advantage among major players remains on the side of short positions. Over the past week, the number of short-term contracts has decreased in absolute terms, so the probability of a fall in the euro currency is reduced. Forecast for EUR/USD and recommendations to traders: At this time, I recommend waiting for consolidation under the level of 23.6% (1.0840) on the 4-hour chart, as well as under the side corridor on the hourly, and then sell the euro with the goal of 1.0638. I recommend buying euros, since the lower line of the side corridor(1.0827) was rebounded, with the goal of the upper line of the corridor(1.0892). Terms: "Non-commercial" - major market players: banks, hedge funds, investment funds, private, large investors. "Commercial" - commercial enterprises, firms, banks, corporations, companies that buy currency, not for speculative profit, but to ensure current activities or export-import operations. "Non-reportable positions" - small traders who do not have a significant impact on the price. The material has been provided by InstaForex Company - www.instaforex.com |
| Posted: 22 Apr 2020 04:50 AM PDT To open long positions on EURUSD, you need: In the first half of the day, I paid attention to the importance of the level of 1.0851, around which the trade was conducted, and recommended opening long positions in the scenario of consolidation above this range, which passed. Fixing is clearly visible on the 5-minute chart. The next target for euro buyers is the upper limit of the side channel 1.0894 since only its break will strengthen the demand for the euro/dollar pair, which will lead to an update of the highs of 1.0937 and 1.0985, where I recommend fixing the profits. However, without good news on the EU summit, which will be held tomorrow, we can hardly expect such active growth. In the scenario of a decline in the pair in the second half of the day to the support area of 1.0851, it is best to open new long positions from there only after the formation of a false breakout, but I recommend buying the euro/dollar pair immediately on the rebound only from the lower border of the side channel 1.0814. Given that the release of important fundamental data is not planned for the North American session, it is likely that trading will remain on the channel.
To open short positions on EURUSD, you need: Sellers of the euro will not rush to return to the market and will most likely show themselves after updating the upper border of the side channel 1.0894. However, it is best to open short positions from there in the second half of the day only after a false breakout, as the bulls managed to turn the market in their direction, updating the highs of yesterday and not letting the euro below the support of 1.0851, which is just the first goal of the bears. A breakout and consolidation below this range will increase the pressure on the euro/dollar pair, which will push the pair to the lower border of the side channel 1.0814, where I recommend fixing the profits. In the scenario of no pressure on the euro from the resistance of 1.0894, short positions are best postponed until the test of a more recent high of 1.0937.
Signals of indicators: Moving averages Trading is conducted just above the 30 and 50 daily moving averages, which indicates that there are no people willing to sell euros in the current conditions. Note: The period and prices of moving averages are considered by the author on the hourly chart H1 and differ from the general definition of the classic daily moving averages on the daily chart D1. Bollinger Bands Volatility is decreasing, which indicates a wait-and-see attitude of traders before tomorrow's EU summit. Description of indicators
|
| GBP/USD. April 22. UK to start human trials of coronavirus vaccine. Pound remains volatile. Posted: 22 Apr 2020 04:50 AM PDT GBP/USD – 1H.
Hello, dear traders! On the hourly chart, the GBP/USD pair reversed, growing in the direction of the downward trend line, which is quite far from the current price level. The bearish bias persists mostly due to the trend line. Thus, a possible rebound from this line will enable the US dollar to assert strength. However, the quotes of the pair will drop again. If the pair consolidates above this line, the British pound will gain ground and the overall bias will become bullish. There is no fresh news from the UK save for the COVID-2019 epidemic. Over the past day, almost 1,000 people have died. It means that the country is still unable to reduce the death toll. Additionally, more than 130,000 people are infected. Human trials of the coronavirus vaccine have begun at the University of Oxford. If the vaccine gets efficacy results, it will be available by September. Earlier, there were reports that Britain had already started production of the vaccine, but it had not yet passed any tests. GBP/USD – 4H.
On the 4-hour chart, the GBP/USD pair consolidated under the correction level of 50.0% - 1.2303, but later it reversed in favor of the British currency and settled above this level. The pair may resume its rally on April 22 heading for the Fibonacci level at 61.8% - 1.2516. At the same time, the downward trend line on the hourly chart halts the upward moment of the pair. This line is now the most important signal for the future trajectory of the pair. Tomorrow, the pair is most likely to give more clear signals for its further movement, taking into account the downward trend line. GBP/USD – Daily.
On the daily chart, the pair reversed in favor of the US dollar consolidating under the correction level of 50.0% - 1.2463. Thus, the pair may continue to move down to the next correction level of 38.2% - 1.2215. GBP/USD – Weekly.
The economic calendar: There were no economic reports in the US on Tuesday. The UK unveiled data on the unemployment rate (up by 4%), on average wages (shown a decrease compared to February), and on claims for unemployment benefits (better than expectations). However, despite positive reports during the coronavirus the crisis, the pound sterling slid down against the US dollar. Notably, today the pound resumed its growth while many investors expected the British pound to lose ground amid weak inflation in the UK. The economic calendar for the US and the UK: UK consumer price index (08-00 GMT). COT report (Commitments of traders):
The fresh COT report published on Friday showed that demand for the pound advanced a little bit. The total increase was only about 3,000 contracts for both Short and Long deals. Thus, the pound seems to remain an extremely unattractive currency for large banks and companies. For example, speculators have now opened the minimum number of contracts for long positions – only about 80,000. The total number of contracts is now about 320,000. For comparison, the total number of contracts for the euro is more than a million. There were no major changes during the reporting week. For all categories of traders, changes are minimal plus or minus 2,000-3,000. The bulls are now holding the upper hand. The total number of long deals exceeds short deals by 7,000. Outlook for GBP/USD and trading recommendation It is recommended to open sell deals on the pound sterling with a target of 1.2095 if it closes under the correction level of 61.8% on the 4-hour chart. Buy deals can be opened at 1.2777 (and, consequently, closing all short deals) if the pair breaks above the trend line on the hourly chart. Terms: "Non-commercial" - major market players: banks, hedge funds, investment funds, private, and large investors. "Commercial" - commercial enterprises, firms, banks, corporations, companies that buy currency not for making a speculative profit, but to ensure current economic activities or export-import operations. "Non-reportable positions" – average traders who do not have a significant impact on the price. The material has been provided by InstaForex Company - www.instaforex.com |
| Posted: 22 Apr 2020 04:48 AM PDT To open long positions on GBPUSD, you need: In my morning review, I drew attention to the possible growth of the pound after the release of inflation data in the UK, but it was necessary to meet a number of conditions, which the bulls did well. Fixing above the resistance of 1.2302, which is clearly visible on the 5-minute chart with a test of this level from top to bottom, was a good signal to buy the pound/dollar pair. At the moment, the bulls have built interim support of 1.2350 and while trading will be conducted above this range, we can expect the pound to continue growing to the maximum of 1.2417, where I recommend fixing the profits. In the scenario of the pair returning under the resistance of 1.2350, I recommend to exit the long positions and wait for the minimum of 1.2298 to be updated, from where to buy the pound immediately for a rebound.
To open short positions on GBPUSD, you need: Sellers tried to return to the market several times after updating the resistance of 1.2331 and 1.2358, but nothing good came of it. At the moment, the bears will focus on returning the pair to the level of 1.2350, as a number of stop orders may be demolished below, which will quickly push the pound to the minimum of 1.2298, where I recommend fixing the profits. In the scenario of further growth of the pound/dollar pair, it is best to return to short positions only for a rebound from the resistance of 1.2417 with the goal of a downward correction of 30-40 points within the day.
Signals of indicators: Moving averages Trading is below the 30 and 50 daily averages, which indicates that the advantage of sellers of the pound remains. Note: The period and prices of moving averages are considered by the author on the hourly chart H1 and differ from the general definition of the classic daily moving averages on the daily chart D1. Bollinger Bands In the scenario of the pair's growth, the average border of the indicator around 1.2408 will act as a resistance. Description of indicators
|
| Trading recommendations for GBP/USD for April 22, 2020 Posted: 22 Apr 2020 04:41 AM PDT From a complex analysis perspective, we see a rapid downward movement, during which the quotes almost managed to work out the previous measure. The quotes managed to get 400 points in five trading days, in which the movement grew from a slight pullback, similar to an oblong correction. So, having a scale was enough to return the quotes to the flat formation area a period earlier, and only 96 points remained to the key level of 1.2150. Now we understand that a downward mood is not just an assumption, it is perhaps a development in terms of recovery. Regarding the theory of further development, we continue to talk about a downward course, since the first level of 1.2350 has already fallen, and the main coordinates of 1.2150 are not at such a great distance. Thus, the recovery theory regarding the movement of 03.20.20-14.04.20 takes place on the market, and as soon as the 1.2150 mark is reached, we will have a solid basis, and confirmation will occur at the level of 50% of mining [1.2000]. At the same time, while we do not have these levels, the tactics of local operations are preserved among market participants. Analyzing the past day in detail, you can see that a turn of meek positions was set during the Asian session, but the main acceleration came at 07: 30-16: 00, time at the trading terminal. The subsequent fluctuation occurred in terms of a pullback from 1.2246 to 1.2308. As discussed in the previous review, traders were actively working to lower even from the breakdown of the 1.2405 / 1.2520 corridor, resulting in a significant increase in the trade deposit. In terms of volatility, we see the first acceleration in three days, which exceeded the daily average by 30%. Activity is caused by the external background, as well as speculative activity. Details of volatility: Monday - 165 points; Tuesday - 245 points; Wednesday - 172 points; Thursday - 358 points; Friday - 359 points; Monday - 144 points; Tuesday - 271 points; Wednesday - 676 points; Thursday - 354 points; Friday - 522 points; Monday - 267 points; Tuesday - 296 points; Wednesday - 333 points; Thursday - 452 points; Friday - 352 points; Monday - 148 points; Tuesday - 227 points; Wednesday - 108 points; Thursday - 126 points; Friday - 198 points; Monday - 116 points; Tuesday - 217 points; Wednesday - 131 points; Thursday - 122 points; Friday - 42 points; Monday - 87 points; Tuesday - 146 points; Wednesday - 193 points; Thursday - 119 points; Friday - 114 points; Monday - 86 points; Tuesday - 198 points. Daily average Considering the trading chart in general terms [the daily period], we see the outlines of the graphic model "Head and Shoulders", where, with the existing fluctuation, it remains to form only the right shoulder. The news background of the past day contained data on the labor market in Britain, where they published figures on applications for unemployment benefits for March. Everyone was waiting for the repetition of the American plot and hundreds of thousands of applications, but as a result, they received some 12.5 thousand with a forecast of 272 thousand. What is the reason for the discrepancy in the statistical data? So, the indicators were collected on March 12, 11 days before the government introduced quarantine, which paralyzed most of the British economy, limiting its impact on economic prospects. Thus, everyone understands that when publishing subsequent data on applications, everyone will face reality, and it will be extremely cruel. Pound Sterling continued to decline, without focusing on locally positive statistics. At the same time, media sources, the Bloomberg resource, in particular, began to portion-launch information about problems with mortgage loans in Britain. Sources give a comparison with the 2008 crisis, where a similar mechanism could trigger a crisis in Britain, and we know very well how the real estate market in the United Kingdom has grown in recent years. That is, mortgage borrowers will not be able to fulfill the obligations in connection with quarantine measures, you caught the promise. In terms of general informational background, we have a statement by Bank of England chief economist Andy Haldane, who believes that the influence of the COVID-19 virus at the end of March will be quite strong, and this can lead to a reduction in the economy of Britain in the first quarter. Haldane also added that he did not rule out a sharp economic downturn in the second quarter, but recovery should not be expected quickly. "But even after quarantine is weakened, there is certainly a possibility that people themselves will not want to spend too much or go out and talk too much," the Bank of England chief economist said. Earlier this week, UK Treasury Chancellor Rishi Sunak launched a 1.25 billion pound company support package, so on the first day, more than 140 thousand companies sought help, where the total cost of requests was about 1 billion pounds. It is worth considering that the number of companies can still grow and the Chancellor of the Treasury is ready for this, in his words. Today, in terms of the economic calendar, we had inflation data in Britain, where the forecasts coincided and a decrease was recorded from 1.7% to 1.5%. Further, statistics are no longer expected. Further development Analyzing the current trading chart, we see a technical rebound after a significant downward move. In fact, the quotes again focused on the level of 1.2350, which may play into the hands of sellers if it is worked out in terms of resistance. Thus, the theory of downward development is still relevant, and we need to wait a bit until sellers manage to regroup trade forces. By analyzing the time interval per minute, we consolidate a round of long positions at the start of the European session, where the quotes managed to return to the area of 1.2350. In terms of the emotional mood of market participants, speculative positions are indisputable, but in the case of passing the 1.2150 mark, we will see a tide of medium-term participants. In turn, traders continue to consider short positions with the initial move in the direction of the local minimum of the past day. We can assume that in the case of working out the level of 1.2350 as resistance, we will quickly reach the area of 1.2250 / 1.2280, and after that, we will talk about touching the main level of 1.2150. Based on the above information, we derive trading recommendations: - Consider selling positions lower than 1.2330, towards 1.2280 - 1.2250. Major deals will go after prices consolidate lower than 1.2240. - Consider purchase positions in terms of alternative positions, in the case of keeping the mood and price consolidation higher than 1.2370. Indicator analysis Analyzing a different sector of timeframes (TF), we see that the indicators of technical instruments on hourly and daily periods signal a sale, which reflects a general interest. Volatility per week / Measurement of volatility: Month; Quarter year Measurement of volatility reflects the average daily fluctuation, calculated for Month / Quarter / Year. (April 22 was built taking into account the time of publication of the article) The volatility of the current time is 94 points, which is 38% below the daily average. It can be assumed that, given the speculative mood, there is a chance to disperse volatility to an average norm. Key levels Resistance zones: 1.2350 **; 1.2500; 1.2620; 1.2725 *; 1.2770 **; 1.2885 *; 1.3000; 1.3170 **; 1.3300 **; 1.3600; 1.3850; 1.4000 ***; 1.4350 **. Support Areas: 1.2280 (1.2240); 1.2150 **; 1.2000 *** (1.1957); 1.1850; 1.1660; 1.1450 (1.1411); 1.1300; 1,1000; 1,0800; 1,0500; 1,0000. * Periodic level ** Range Level *** Psychological level **** The article is built on the principle of conducting a transaction, with daily adjustment The material has been provided by InstaForex Company - www.instaforex.com |
| Technical analysis of EUR/USD for April 22, 2020 Posted: 22 Apr 2020 04:37 AM PDT Overview: The EUR/USD pair set above strong support at the level of 1.0813, which coincides with the double bottom (50% Fibonacci retracement level). This support has been rejected for four times confirming uptrend veracity. Hence, major support is seen at the level of 1.0813 because the trend is still showing strength above it. Accordingly, the pair is still in the uptrend from the area of 1.0813 and 1.0800. The Eur/USD pair is trading in a bullish trend from the last support line of 1.0813 towards the first resistance level at 1.0901 in order to test it. This is confirmed by the RSI indicator signaling that we are still in the bullish trending market. Now, the pair is likely to begin an ascending movement to the point of 1.0901 and further to the level of 1.0952. The level of 1.0990 will act as second resistance and the double top is already set at the point of 1.0990. At the same time, if a breakout happens at the support levels of 1.0813, then this scenario may be invalidated. But in overall, we still prefer the bullish scenario. The material has been provided by InstaForex Company - www.instaforex.com |
| Posted: 22 Apr 2020 04:35 AM PDT Corona virus summary:
Trump lays out parts of US immigration ban60-day ban on immigrants Technical analysis: BTC has been trading upwards. The price tested the level of $6,960. In my opinion BTC is at the important resistance trend-line and that sellers opportunities are preferable. I see potential for the further drop towards the levels at $6,550 and $6,465. Watch for selling opportunities using the intraday frames 15/30 minutes for better entry. Any downside rotation or bearish divergence in the momentum may be the good trigger for the downside. Support level is set at the price of $6,750. The material has been provided by InstaForex Company - www.instaforex.com |
| Posted: 22 Apr 2020 04:22 AM PDT Corona virus summary:
CDC chief warns of 'even more difficult' second wave of cases"even more difficult" for America to deal with Technical analysis: EUR/USD has been trading sideways at the price of 1,0885. I found the bracketing market between the price of 1,0813 and 1,0895. The eventual breakout of the trading range would confirm the direction. The EUR is much close now for the breakout of the resistance. Stochastic oscillator is going upside, which is sign that EUR is in mini up-cycle. The material has been provided by InstaForex Company - www.instaforex.com |
| Posted: 22 Apr 2020 04:13 AM PDT Corona virus summary:
The prospect of a prolonged worldwide impact has hardened after a survey of thousands of business leaders warned of a drawn-out recession, with many companies likely to fold. Around 60% of chief executives surveyed are preparing for a U-shaped recovery – a long period between recession and an upturn. "We have not seen a crisis like this for over a hundred years, and some household names will not survive," said Glenn Keys, executive chairman of Aspen Medical, a Singapore-based health services firm. Technical analysis: The material has been provided by InstaForex Company - www.instaforex.com |
| You are subscribed to email updates from Forex analysis review. To stop receiving these emails, you may unsubscribe now. | Email delivery powered by Google |
| Google, 1600 Amphitheatre Parkway, Mountain View, CA 94043, United States | |

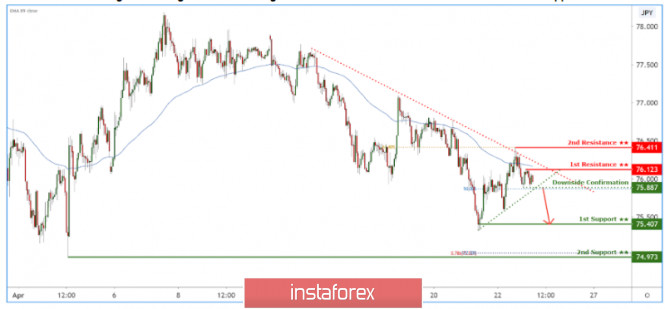
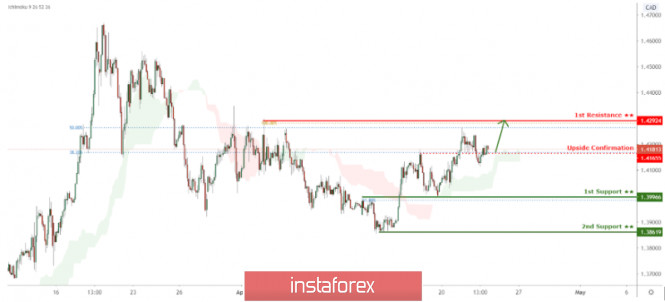
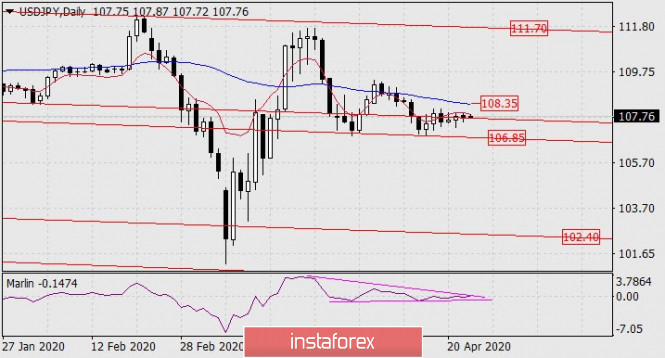
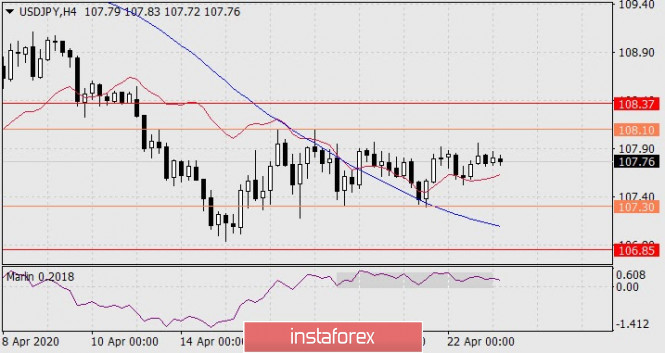
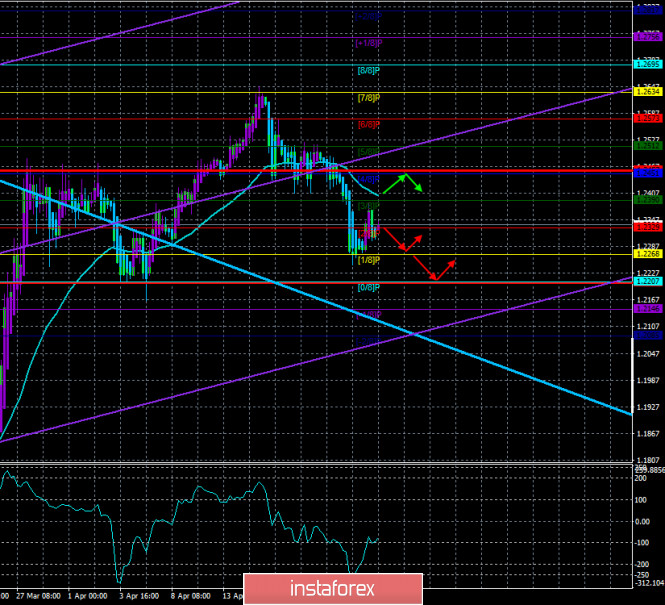
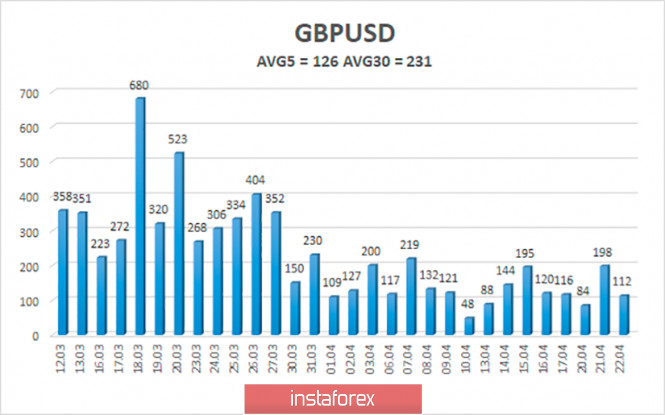
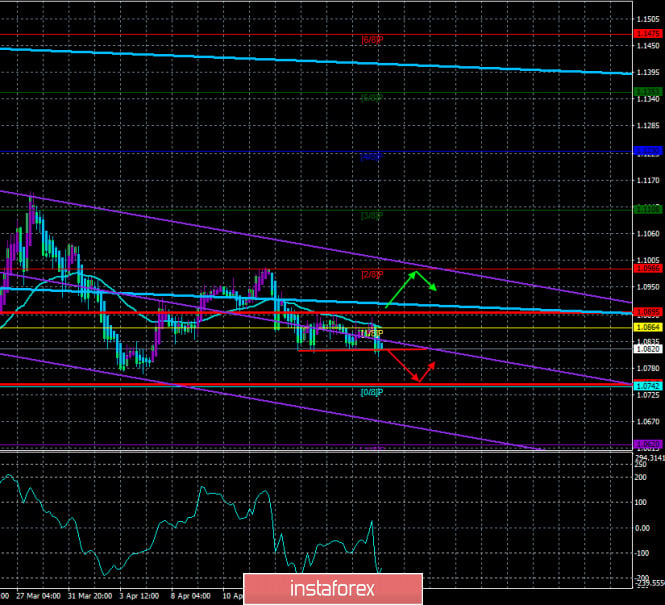
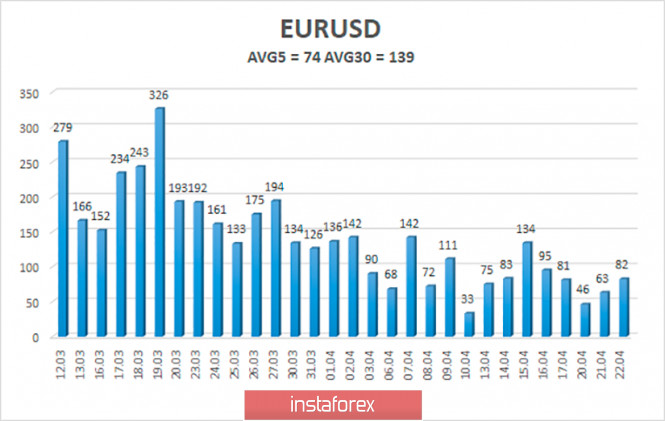
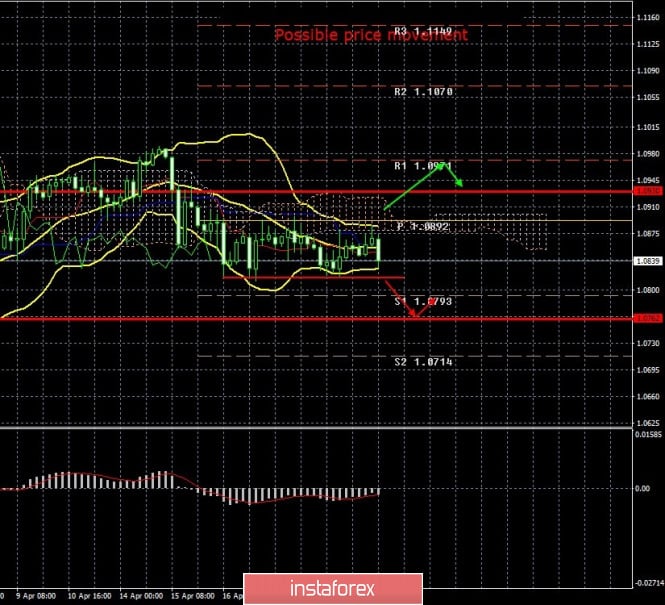
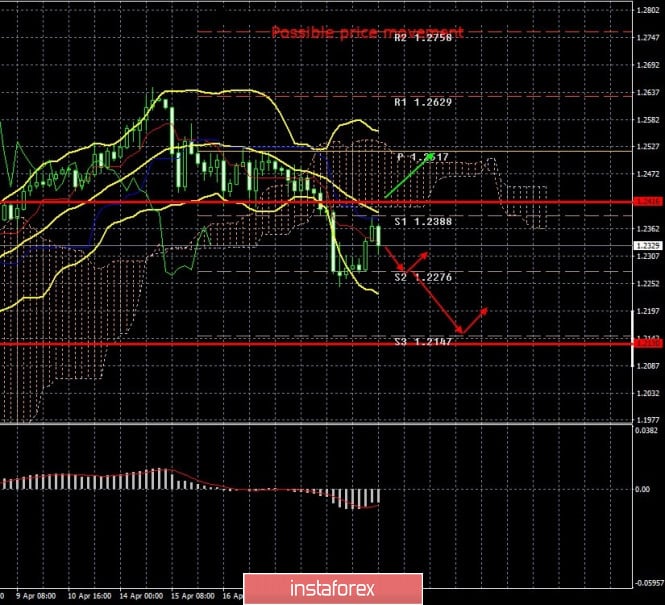
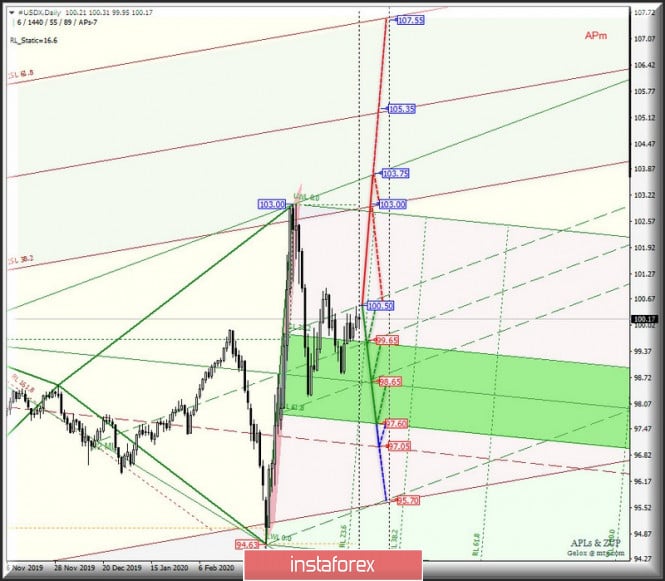
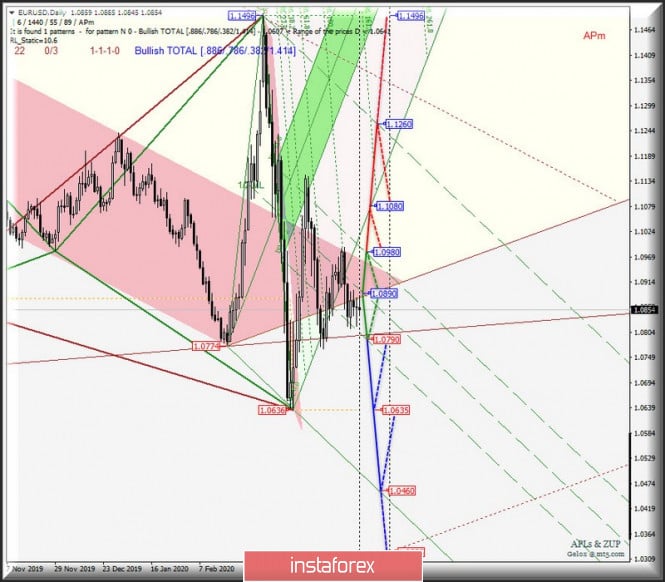
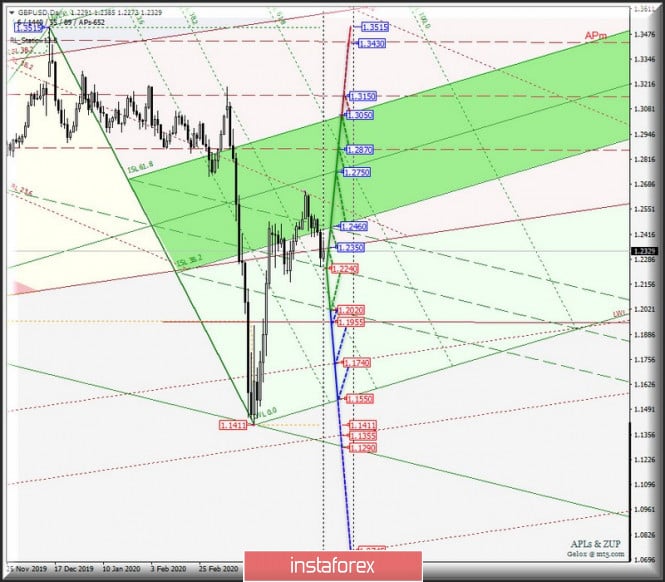
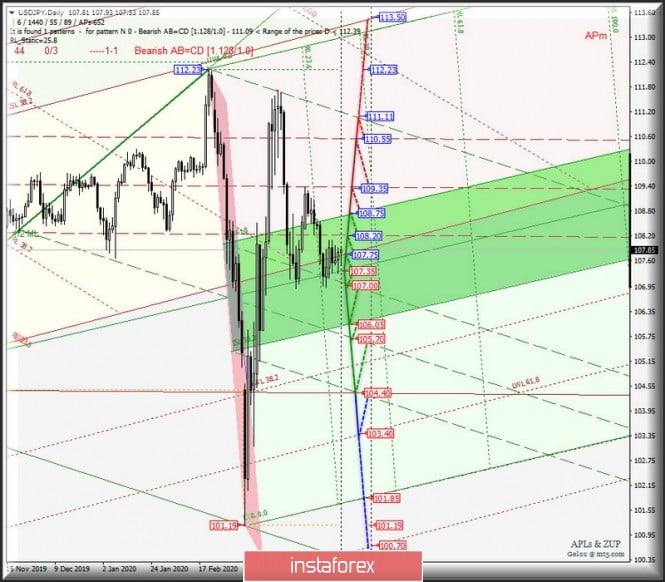

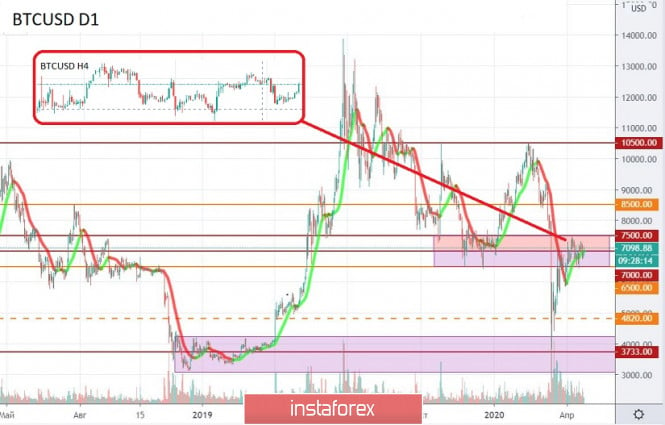
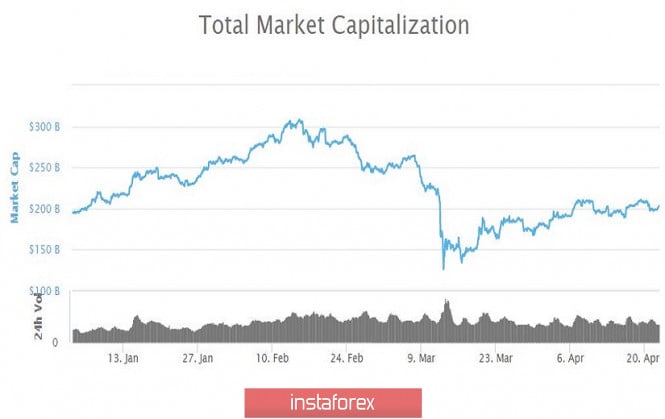
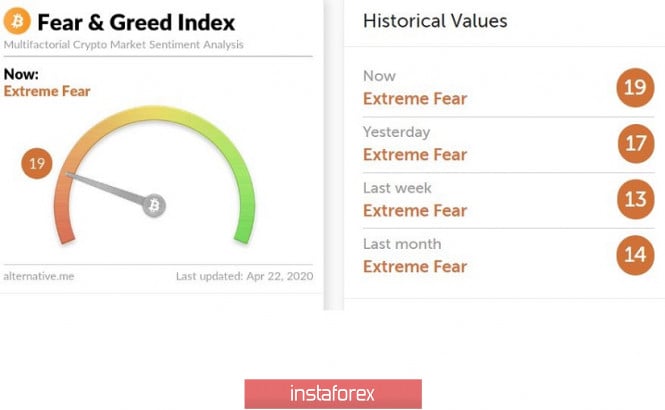
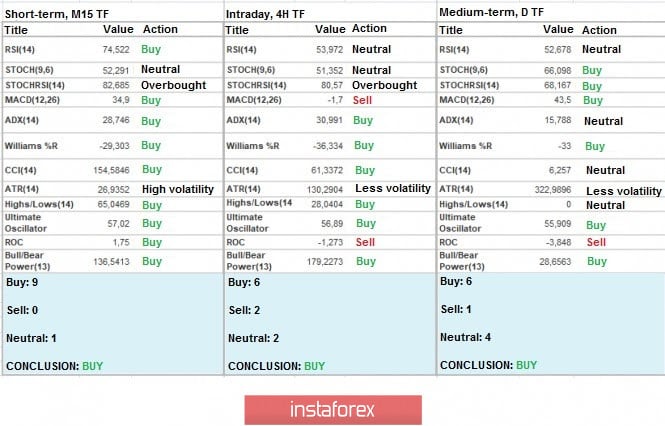
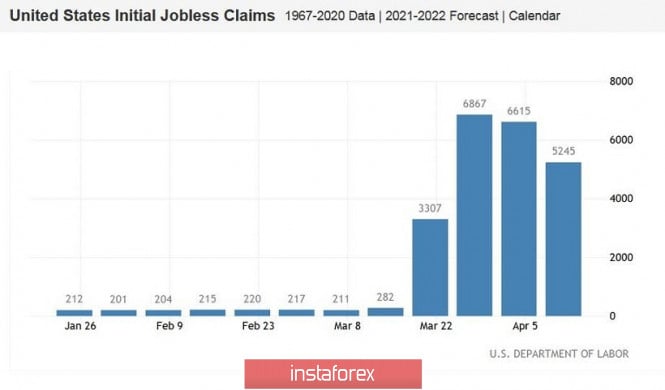
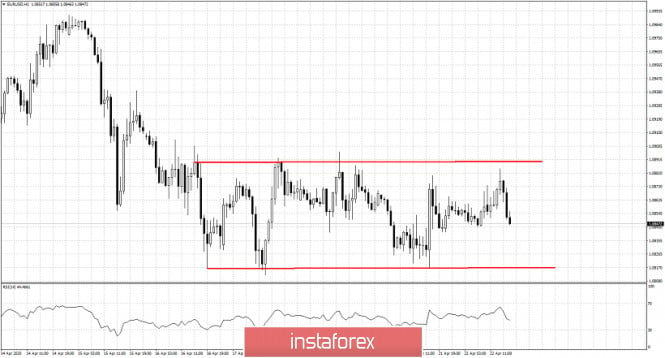
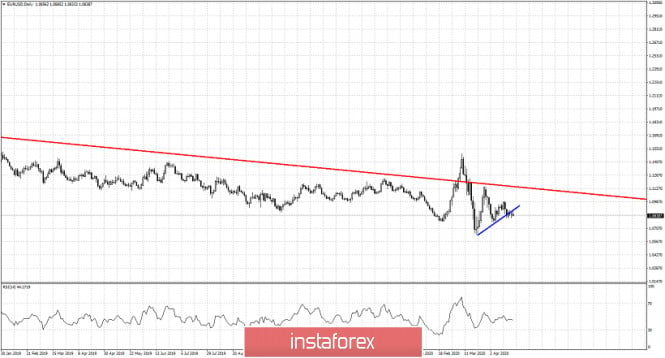
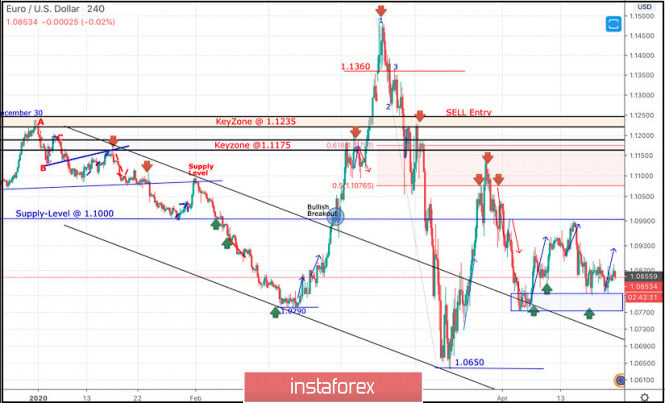
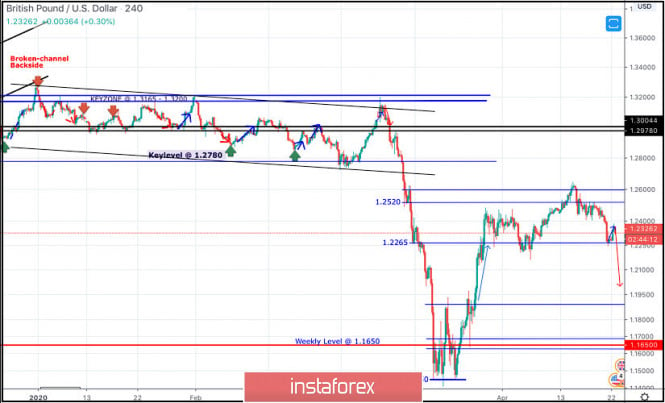
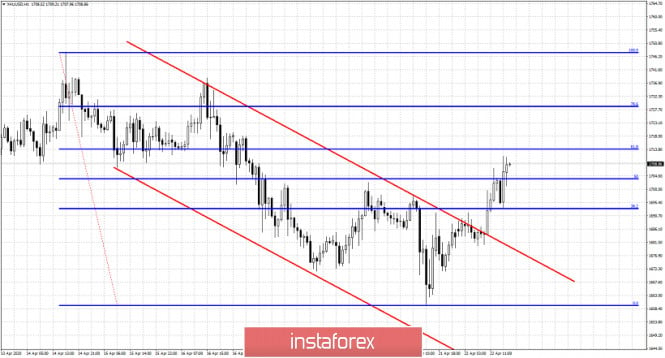
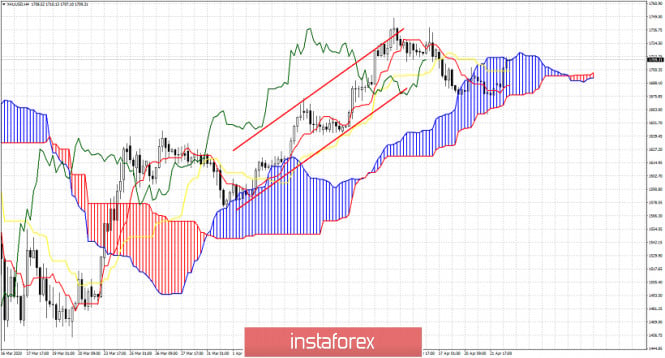
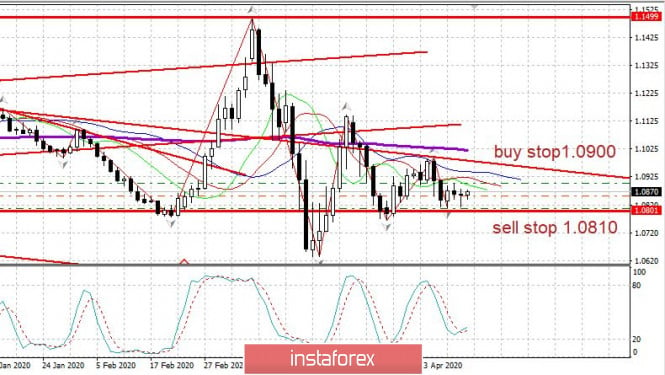
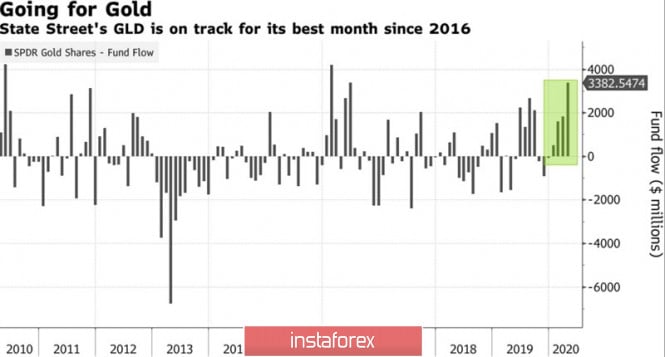
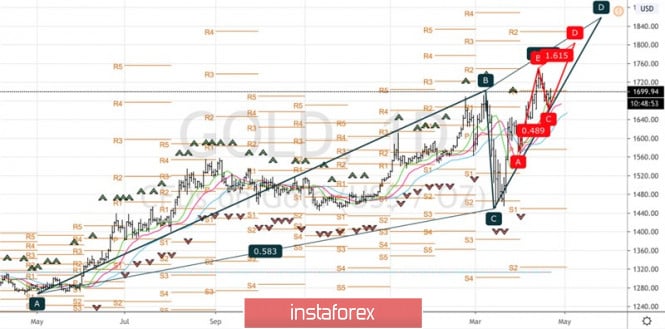
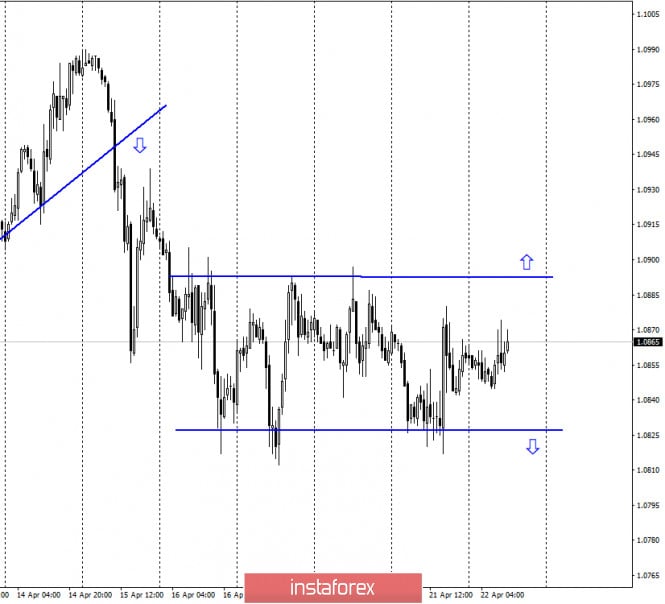
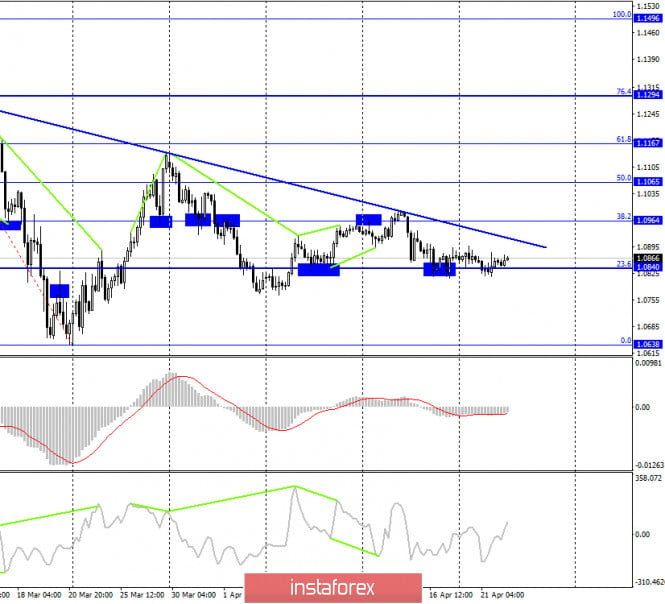
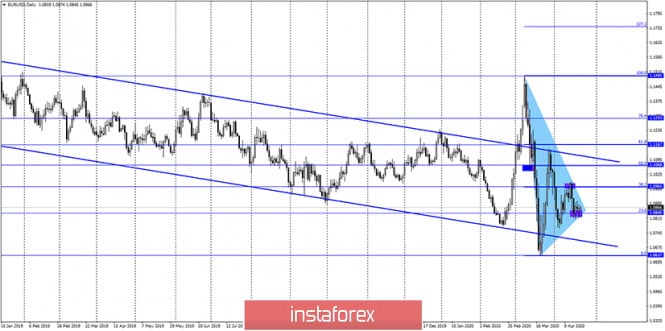
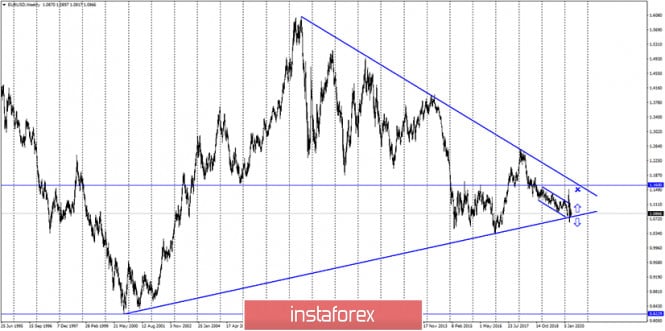
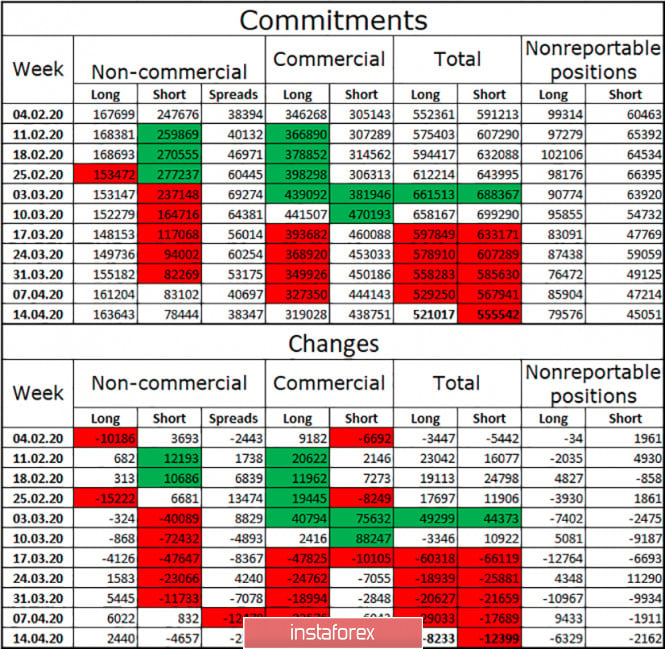
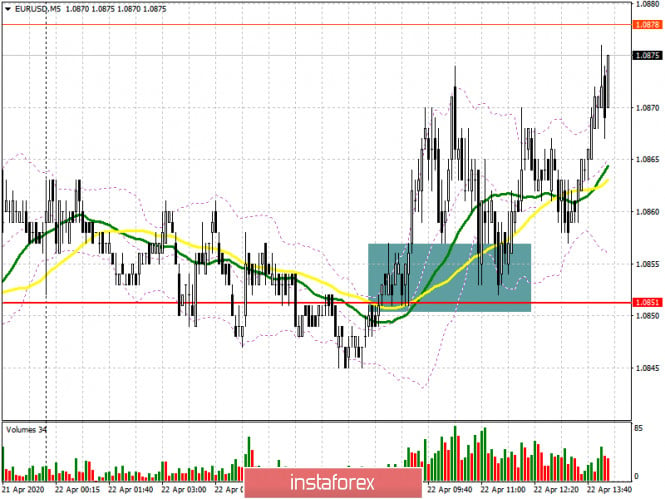
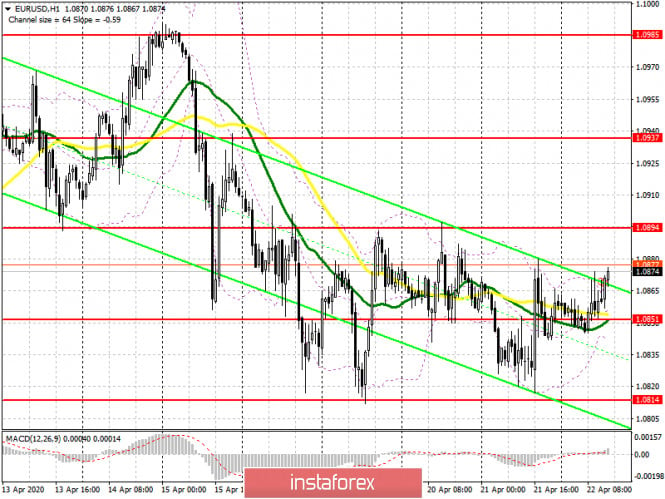
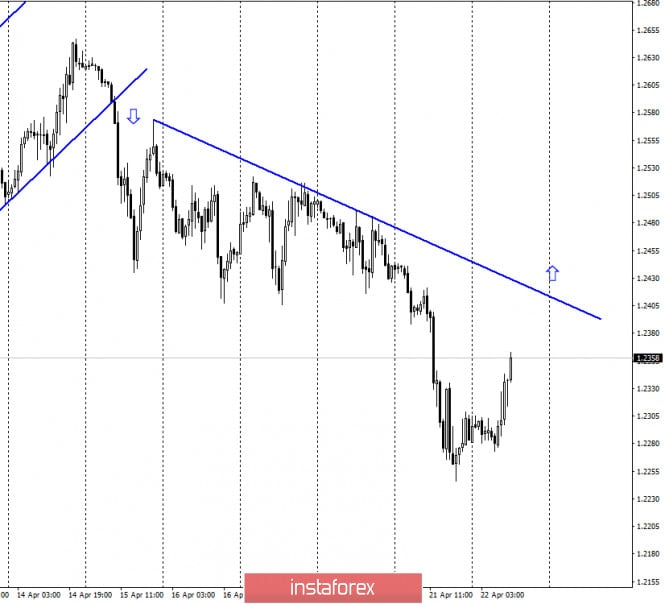
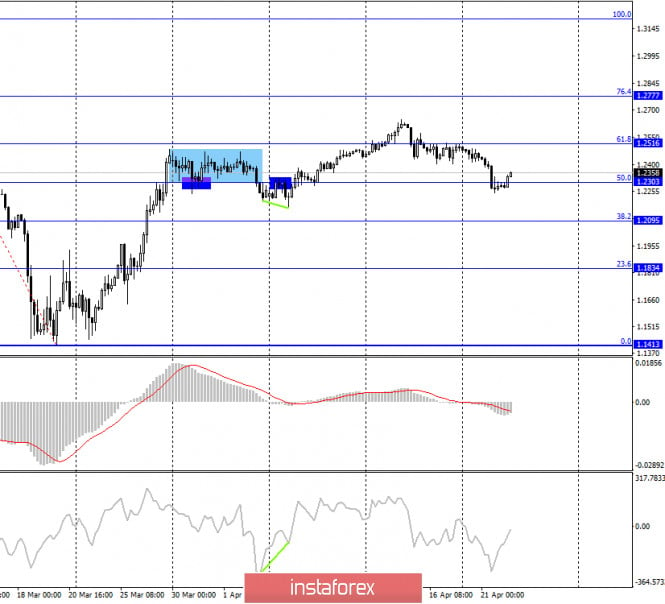
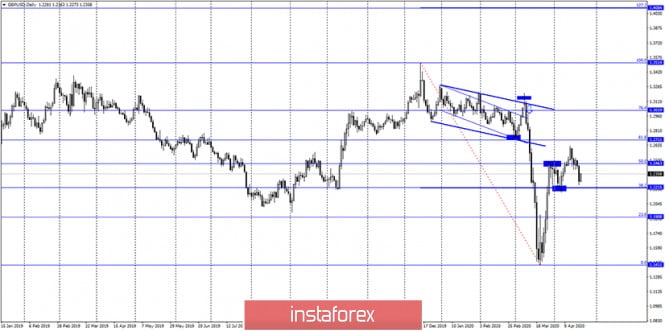
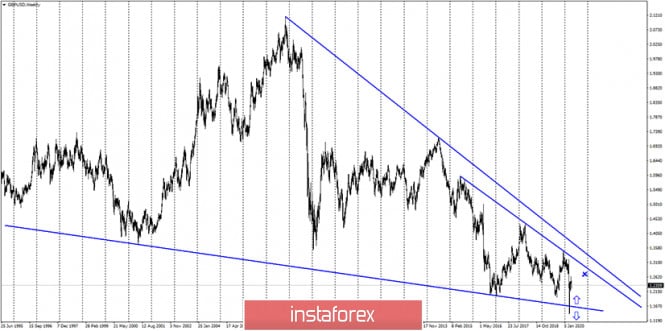
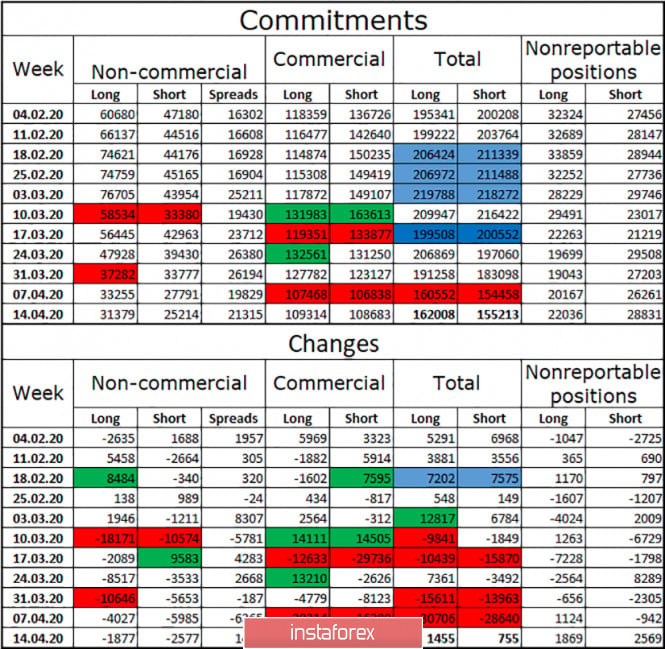
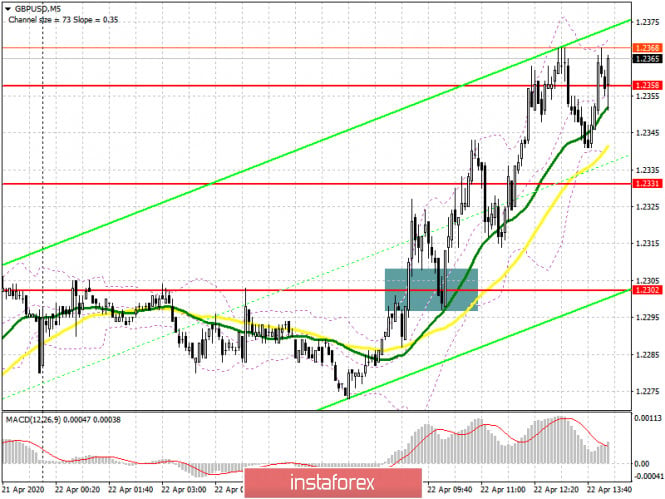
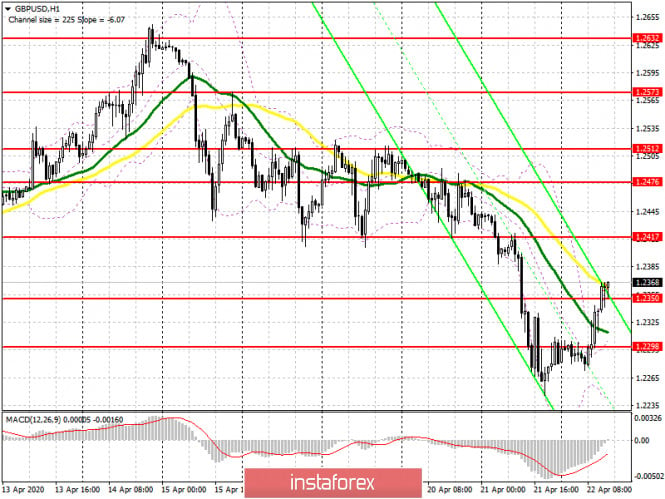
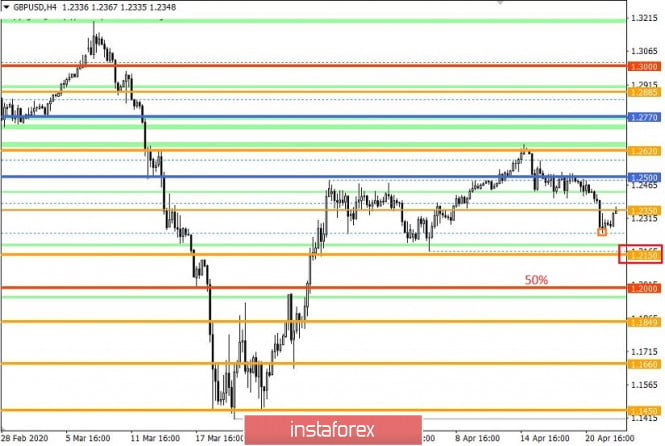
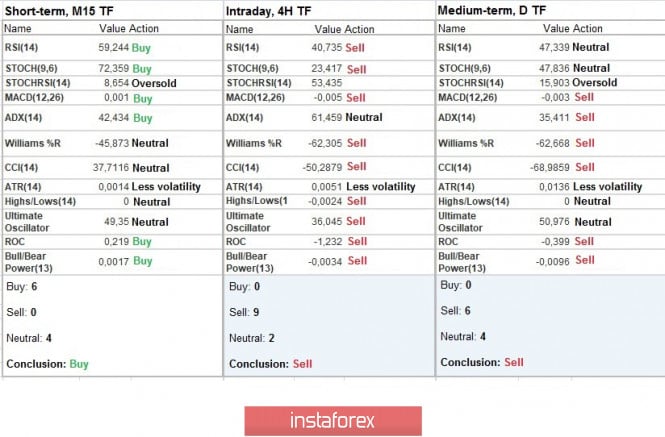
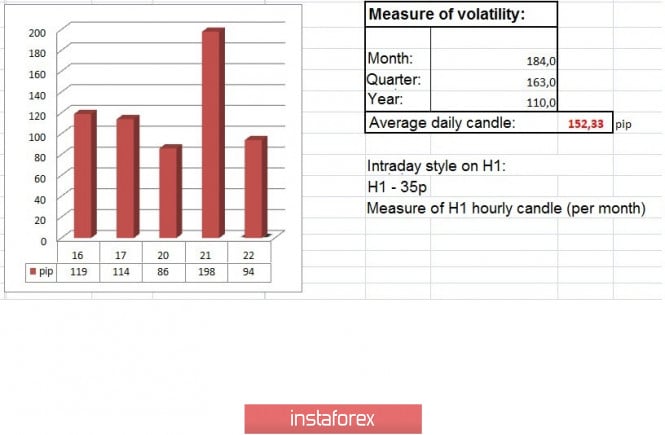
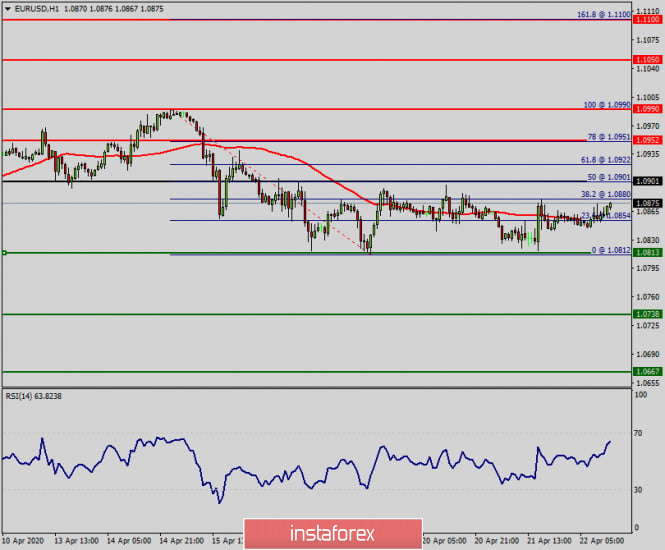
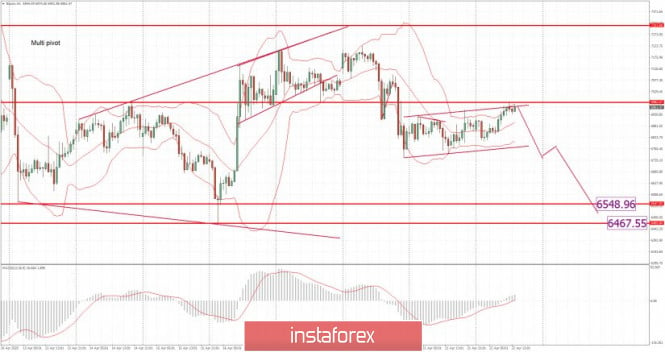
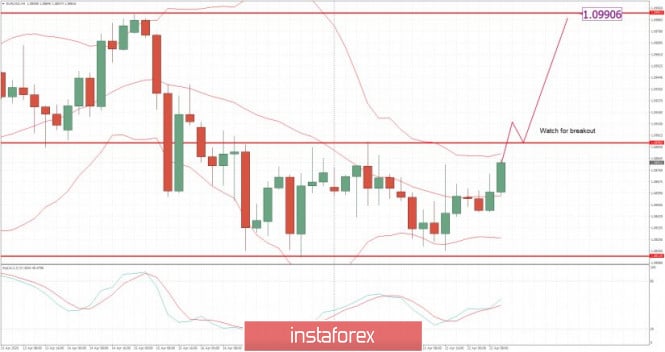
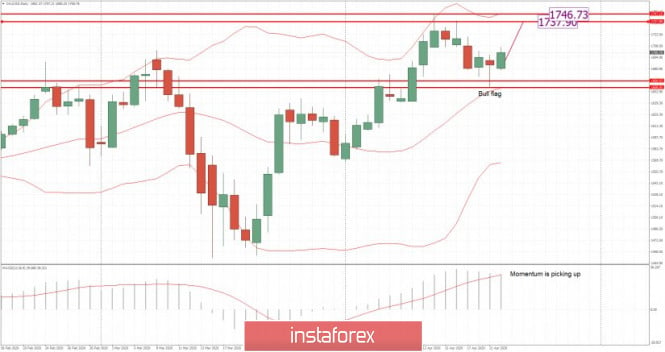
No comments:
Post a Comment