
Forex analysis review |
- Control zones for AUD/USD on 04/07/20
- Overview of the EUR/USD pair. April 7. EU imposes retaliatory duties on US goods amid coronavirus epidemic
- EUR/USD and GBP/USD. Results of April 6. Coronavirus begins to recede in Europe. Euro and pound
- Comprehensive analysis of movement options of #USDX vs EUR/USD vs GBP/USD vs USD/JPY (H4) on April 7, 2020. APLs & ZUP
- USD/JPY. Japan declares state of emergency, yen falls
- Evening review for EUR/USD for April 6th. Market optimism caused by expectations of epidemic decline
- April 6, 2020 : EUR/USD Intraday technical analysis and trade recommendations.
- April 6, 2020 : GBP/USD Intraday technical analysis and trade recommendations.
- Short-term Ichimoku cloud indicator analysis of EURUSD
- Short-term Ichimoku cloud indicator analysis of Gold
- Trading recommendations for GBPUSD pair on April 6
- Trading plan for EUR/USD for April 06, 2020
- Oil will show the "Canadian" way
- BTC analysis for 04.06.2020 - Important pivot resistance at the price of $7.245 on the test, watch for potential downside
- Analysis for Gold 04.06.2020 - Major pivot resistance at the price of $1.644 on the test, watch forr potential price action
- Analysis and trading ideas for USD/JPY on April 6, 2020
- EUR/USD analysis for 04.06.2020 - Broken intraday rising wedge pattern, selling opportunities preferable with target at 1.0743
- GBP/USD: plan for the US session on April 6. The bulls gave another rebuff to the bears, confidently returning to the resistance
- EUR/USD: plan for the US session on April 6. Bulls are probing the market, but weak statistics do not allow us to start a
- EUR / USD: why you should not rush to sell the dollar
- Analysis and trading ideas for GBP/USD on April 6, 2020
- Technical analysis of GBP/USD for April 06, 2020
- Trading recommendations for EUR/USD pair on April 6
- Welcome to the Viking age (EUR/USD and GBP/USD on 04/06/2020)
- Analysis of EUR/USD on April 6, 2020
| Control zones for AUD/USD on 04/07/20 Posted: 06 Apr 2020 07:29 PM PDT After yesterday's growth, the pair broke through and consolidated above the weekly control zone 1/2 0.6080-0.6071. This allows us to talk about the continuation of growth. The first goal will be the weekly control zone 0.6179-0.6161. At the same time, developing in the upward direction becomes the main goal for the current week. Any decrease must be perceived as a correction. Growth will not be limited to a weekly control zone, so the next goal will be the maximum of the last week, and then the monthly short-term in April. However, forming a deep correctional model may not follow. Thus, this will not allow you to get a favorable purchase price today. Despite this, purchases from current levels are not profitable, since they will require setting a stop loss below the current local minimum, which will not allow you to get a favorable risk-to-profit ratio. Daily CZ - daily control zone. The zone formed by important data from the futures market that changes several times a year. Weekly CZ - weekly control zone. The zone formed by the important marks of the futures market, which change several times a year. Monthly CZ - monthly control zone. The zone that reflects the average volatility over the past year. The material has been provided by InstaForex Company - www.instaforex.com |
| Posted: 06 Apr 2020 05:26 PM PDT 4-hour timeframe Technical details: Higher linear regression channel: direction - down. Lowe linear regression channel: downward direction. Moving average (20; smoothed) - down. CCI: -87.1604 If you close your eyes to the completely crazy last month and a half in the currency market and only consider the trading on Monday, it may even seem that there is no crisis, epidemic and recession in the world. The euro/dollar currency pair moved so calmly and easily. The volatility was only 68 points, first the pair went up and then down, thus fully corresponding to the nature of the fundamental and macroeconomic background on Monday, April 6. And both backgrounds were simply not there on Monday. There was no macroeconomic background, and no more or less significant publications for the day. The fundamental background is the same. No high-profile speeches by top officials of the European Union and the United States. Moreover, traders have been completely unresponsive to any macroeconomic information that comes to their disposal for a month and a half. At what absolutely any. Thus, by and large, trading is now quite simple, since it makes sense to take into account only technical factors. Trends are easy to follow, reversals are quite smooth, and fast indicators, like Heiken Ashi, react in time to everything that happens. The only thing that marred such a convenient time for trading was volatility. The pair went through 200-400 points every day, which simply frightened average traders who are not ready to work with a tool that goes the same distance in a day as it did a month ago. Thus, we can even assume that over the past month and a half, the market has mostly been made by major players. Large banks, financial conglomerates and syndicates, large manufacturing companies, and so on. The share of private traders, of course, was also present, but it was definitely lower than before the crisis. Now, when the volatility slowly returns to normal, it returns a convenient time for ordinary traders. If during almost all of 2019, we have repeatedly said that the balance of power between the United States and the EU, between the Fed and the ECB, is clearly led by the Americans. In other words, we analyzed all the macroeconomic indicators and monetary policies and concluded that the dollar will become more expensive. Now, no such conclusions can be made simply. We have received quite a lot of important information from overseas regarding the labor market. All market participants realized that unemployment and the labor market are now a headache for Congress and the Fed. Unemployment and a weak labor market will pull the US economy down at the moment. However, what about Europe? Is it ever better in the EU than in the US? We believe not. The EU does not publish data similar to NonFarm Payrolls, there is no ADP report, and there are no weekly reports on benefits applications. There are only official unemployment rates. Thus, we believe that the unemployment situation is no better in the EU, since it has the same quarantine as in the United States, and the epidemic is no smaller. Based on this, and also taking into account the Fed's key rate cut to almost zero, we believe that now the euro and the dollar are in almost the same conditions. If you carefully consider the movement of the euro/dollar over the past month, it becomes obvious: at the moment, quotes have returned exactly to the place where the strongest growth began a month and a half ago. Thus, nothing has changed in the balance of power between the euro and the dollar over the past month and a half. Meanwhile, the EU decided after almost two months to respond to the US for their expansion of duties on imports of steel and aluminum, which were introduced by Donald Trump on February 8. According to the European Commission, the list of goods from the United States that will be subject to duties is limited. Representatives of the EU believe that in the context of a global pandemic, partners should cancel their "unfair" duties, in particular on aluminum and steel. Since this did not happen, the EU introduces duties that will apply to lighters, furniture fittings and some other groups of goods. At the same time, European Commission chief Ursula von der Leyen said: "We need a Marshall plan for Europe. It is necessary to invest billions of euros today to prevent a disaster in the future." Naturally, we are talking about investing in the European economy to prevent its collapse as a result of the coronavirus epidemic. The head of the European Commission believes that the EU budget for 2021-2027 should be revised, as economic and social conditions have changed. All EU countries, according to Ursula von der Leyen, should show solidarity on this issue. From a technical point of view, the downward movement has every chance of resuming, since the upward correction has not started, and the Heiken Ashi indicator has colored the last bars purple. However, firstly, there is now a high probability of a flat, since the price has returned to its original positions a month and a half ago, and the macroeconomic background is now absent, and, secondly, we still believe that the correction against correction option is relevant. It is in the area of the 1.08 level that we believe there will be an upward reversal with a further upward movement from the 1.10 area. As before, we advise not trying to guess the reversal of the pair, but trading strictly on the trend. No important macroeconomic publications are scheduled for April 7. The volatility of the EUR/USD currency pair remains at rather high values, but at the same time continues to decline every day. As of April 7, the average volatility is 113 points. We believe that markets continue to rebound at a slow pace. Today we expect a further decrease in volatility and price movement between the levels of 1.0687 and 1.0913. There is a flat at the beginning of the trading week, so in fact the volatility channel can be much narrower. Nearest support levels: S1 - 1.0742 S2 - 1.0620 S3 - 1,0498 The nearest resistance levels: R1 - 1,0864 R2 - 1.0986 R3 - 1,1108 Trading recommendations: The EUR/USD pair maintains the downward trend. Thus, it is advised that traders either remain in euro-currency sales with the goals of 1.0742 and 1.0687, or wait for new signals for selling, since the Heiken Ashi indicator has already been turning up, indicating a correction. It is advised to buy the pair before traders reverse consolidate above the moving average line with the first goal of the Murray level "2/8" - 1.0986. The material has been provided by InstaForex Company - www.instaforex.com |
| EUR/USD and GBP/USD. Results of April 6. Coronavirus begins to recede in Europe. Euro and pound Posted: 06 Apr 2020 09:58 AM PDT 4-hour timeframe Average volatility over the past five days: 126p (high). The first trading day of the week for the EUR/USD pair was held in absolutely calm, Monday trading. Like at a time when there was no epidemic of coronavirus yet, and panic did not engulf the currency, commodity and stock markets. The euro/dollar pair has passed only 68 points during the day. And this is absolutely the lowest figure for the past month and a half. Thus, we can confidently say that market participants continue to calm down after an almost one and a half month period of chaos and panic. This conclusion suggests that in the near future the markets will begin to recover. And so far, it is precisely and only about restoring markets, not the economies of the United States or the European Union. Markets are tricky, but even during a pandemic and crisis, they cannot contract and fall constantly. We need, so to speak, upward corrections. Whoever says anything, the number one energy price in the world — oil — cannot be $20-25 per barrel. Theoretically, this is possible. For a short period of time, but not constantly, and not in for the long term. Oil prices have already begun to recover, because no matter how production declines, no matter how the transportation sector in each country of the world decreases due to quarantine, no matter how the demand for gasoline, fuel and oil itself decreases, it is not profitable to pump oil and only make a couple of dollars from one barrel. After all, it is absolutely obvious that there is no point in selling the most valuable asset at cost. The only problem is that large market players cannot always agree among themselves, but low prices are not profitable for all miners, and behind them, as a rule, are powerful countries that have influence in the international arena. Thus, we believe that the oil market will recover. The latest news about the spread of the coronavirus also suggests that the epidemic is beginning to subside in Europe. Growth in some countries has been contained. For example, Italy is no longer a hotbed for the spread of the COVID-2019 virus, and Spain came out on top in Europe. However, in Spain, sooner or later, the incidence will decrease. Thus, for the first time in a long time, it is really possible to say that the epidemic can be localized in every country by introducing a strict quarantine. These are just the first steps on the way to complete victory over the virus. But they are done, which means that there are no new reasons for panic in international markets. The United States is the leader in the number of diseases in the world, New York in particular, which has become a hotbed of infection overseas. Following a series of pessimistic forecasts of 200,000 deaths in America, Donald Trump has finally made a statement that can support the US population. "We see a light at the end of the tunnel," Trump said during a regular briefing at the White House. "We hope that in the near future we will be very proud of the work done. It is impossible to be happy when so many people die, but we will be very proud of the work we have done to minimize the death rate," the US president said. We would now like to review economic reports or analyze one or another aspect of the US or EU economy. However, unfortunately, on Monday, April 6, no important macroeconomic information was available to traders. Moreover, in addition to regular reports on the state of the economy of a particular country, no important economic information is now available to traders. The reason is simple - quarantine. The number one problem in the world right now is the epidemic. Losses from the pandemic will be calculated later. Now we need to stop the spread of the virus and minimize the negative effects on the economy. So, in fundamental terms, there is not much to talk about right now. Moreover, traders persist in ignoring any reports... 4-hour timeframe Average volatility over the past 5 days: 164p (high). The GBP/USD currency pair continued its slurred movement on April 6. The pound/dollar pair seems to have resumed a downward trend on Friday, but as it was shown on Monday, traders have little desire to continue selling pounds. However, a price rebound from the critical Kijun-sen line could trigger a resumption of the downward movement. Most likely, not as strong as before. The average volatility over the past two weeks has decreased to 164 points per day, however, for example, today, the pair managed to pass only 117 points. This is still a lot, but it can not be compared with the previous values. Bollinger Bands are now directed sideways, and the MACD indicator is located near zero. Both indicators, thus, indicate the absence of a trend movement, in other words, flat. There were no important macroeconomic publications in the UK today. Only the index of business activity in the construction sector, which expectedly fell from February 52.6 to 39.3. No important statistics are also expected in the United States and Britain tomorrow, so volatility may continue to remain low (in current realities), and there may be no trend movement. Recommendations for EUR/USD: For short positions: The EUR/USD pair maintains the prospects for a downward movement on the 4-hour timeframe, even though the MACD indicator has turned up. Nevertheless, the price continues to be near local lows, so there is no correction as such now. Thus, in euro sales, it is recommended to remain until the MACD indicator turns up (with a parallel increase in price) with the target of 1.0681. For long positions: It is recommended to buy the EUR/USD pair before consolidating the price above the Kijun-sen line, which will indicate the resumption of an upward trend. The first goal in this case is the resistance level of 1.1043. Recommendations for GBP/USD: For short positions: The pound/dollar is trying to resume a downward movement. Thus, it is recommended to sell the pound in small lots with targets at levels 1.2153 and 1.2099, especially in case of a rebound from the critical line. At the same time, one should remember the high probability of a flat. For long positions: It will be possible to buy the GBP/USD pair before consolidating the price above the critical line with the first target level of volatility of 1.2427. Also in small lots. The material has been provided by InstaForex Company - www.instaforex.com |
| Posted: 06 Apr 2020 09:26 AM PDT Minuette operational scale (H4) Second week of April - where are we going? The development of the movement of major currency instruments #USDX vs EUR/USD vs GBP/USD vs USD/JPY from April 7, 2020 in a comprehensive form. ____________________ US Dollar Index The movement of the dollar index #USDX from April 7, 2020, will be due to the development and direction of the breakdown of the range:
The breakdown of the support level of 100.25 and the lower boundary of the channel 1/2 Median Line Minute is an option for the development of the downward movement of the dollar index to the borders of the channel 1/2 Median Line (99.35 - 98.85 - 98.45) and the equilibrium zone (98.85-98.05-97.40) of the operational scale Minuette. If the resistance level of 100.75 is broken on the initial FSL line of the Minuette operating scale forks, the continuation of the upward movement #USDX towards the goals will become relevant:
Details of the dollar index movement markup from April 7, 2020, are shown in the animated chart.
____________________ Euro vs US Dollar From April 7, 2020, the development of the movement of the single European currency EUR/USD will continue, depending on the development and direction of the breakdown of the range:
Breakout ISL61. 8 Minute - resistance level 1.0810 - the development of the upward movement of the single European currency will be directed to the borders of the channels 1/2 Median Line in the operating scale - Minute (1.0870-1.0960-1.1055) and Minuette (1.0960-1.2020-1.2070). Breakdown of the LTL control line of the Minuette operating scale fork - support level of 1.0773 - a continuation of the downward movement of EUR/USD to the minimum of 1.0636 with the prospect of reaching the LTL control line (1.0565) of the Minute operating scale fork. Details of the EUR/USD movement options are shown on the animated chart.
____________________ Great Britain Pound vs US Dollar Her Majesty's currency GBP/USD from April 7, 2020, will continue to develop movement in the 1/2 Median Line channel (1.2070-1.2290-1.2484) fork operating scale Minute (h4), depending on the direction of the range breakdown:
Details are shown on the animated chart. If the upper limit of 1/2 Median Line Minute is broken - the resistance level of 1.2484, the movement of Her Majesty's currency will occur in the equilibrium zone (1.2385-1.2675-1.2965) of the forks of the operational Minute scale. Breakdown of the support level of 1.2070 at the lower border of the 1/2 Median Line channel in the operating scale Minute - the continuation of the downward movement of GBP/USD to the initial SSL Minuette line (1.1870) and the borders of the 1/2 Median Line channel (1.1675-1.1500-1.1320) of the operational scale Minuette. Details of the movement of GBP/USD can be seen on the chart.
____________________ US Dollar vs Japanese Yen The currency of the "Land of the Rising Sun" USD/JPY from April 7, 2020, will continue to develop its movement depending on the development and direction of the breakdown of the range:
When sharing the breakdown of the initial SSL (support 108.10) and control LTL (107.70) lines fork operational scale Minuette, and with the subsequent breakout of the level of 107.40 will be possible, the movement of the currency of the "Land of the Rising Sun" in the channel 1/2 Median Line (107.40 - 106.20 - 104.90) pitchfork operational scale Minute. Breakout of the initial line of the SSL fork of the operational scale Minute - the resistance level of 109.00 - the continuation of the upward movement of USD/JPY to the borders of the channel 1/2 Median Line (110.40-111.20-112.00) and equilibrium zones (111.60-112.75-113.85) of the forks of the operational scale Minuette. Details of the USD/JPY movement are shown on the animated.
____________________ The review is compiled without taking into account the news background, the opening of trading sessions of the main financial centers and is not a guide to action (placing "sell" or "buy" orders). Formula for calculating the dollar index: USDX = 50.14348112 * USDEUR0.576 * USDJPY0.136 * USDGBP0.119 * USDCAD0.091 * USDSEK0.042 * USDCHF0. 036. where the power coefficients correspond to the weights of currencies in the basket: Euro - 57.6 %; Yen - 13.6 %; Pound sterling - 11.9 %; Canadian dollar - 9.1 %; Swedish Krona - 4.2 %; Swiss franc - 3.6 %. The first coefficient in the formula brings the index value to 100 on the starting date - March 1973, when the main currencies began to be freely quoted relative to each other. The material has been provided by InstaForex Company - www.instaforex.com |
| USD/JPY. Japan declares state of emergency, yen falls Posted: 06 Apr 2020 08:22 AM PDT Anti-risk sentiment in the currency market continues to grow, but the Japanese currency ignores these trends. This time, the yen can not take advantage of the status of a protective asset, as traders are concerned about the fate of the Japanese economy directly due to the latest decisions of the official Tokyo. Therefore, investors have to look for other options in this situation. In fact, they don't have much of a choice: either the dollar or gold. These two assets are growing today, while the other instruments show a downward trend.
Rumors that Japan will introduce a state of emergency appeared at the end of last week. Reacting to such assumptions, the USD/JPY pair pushed off from the local minimum of 106.93 and headed back up towards the 110th figure. After the publication of the failed non-farms, this growth increased – despite everything, the dollar not only did not lose its position, but also strengthened throughout the market. Traders were clearly discouraged by the published figures, which turned out to be much worse than the rather weak forecasts. No joke – the number of people employed in the non-agricultural sector decreased in March by 700,000. The same dynamics was recorded in the private sector of the economy (-714,000). The unemployment rate came out at 4.4%, but this indicator refers to lagging economic indicators – according to experts, the real unemployment rate is now in the region of 10 percent. Such figures provoked an increase in anti-risk sentiment, after which traders began to buy the US currency in droves, using it as the most reliable protective asset. But the yen, on the contrary, increased its fall, including in a pair with the dollar. The fact is that Japan in the near future can largely repeat the path of the Americans with all the consequences that follow from this. Let me remind you that at the end of last month, Japanese lawmakers approved a law that allows the Prime Minister to declare an emergency in the country in connection with the Covid-19 epidemic. Now, if necessary, Shinzo Abe can order to declare a state of emergency in the entire country and in certain regions. In the second case, municipalities will get additional powers – in particular, they will be able to require local residents not to leave their homes, as well as temporarily use private land and premises for medical services. If the Japanese refuse to provide the required facilities for use, the local authorities have the right to confiscate them. And what is especially important (in the context of the currency market) – regional governors will be able to close enterprises and factories. Today, the rumors were confirmed: the Prime Minister of Japan during his press conference said that he intends to declare an emergency starting from April 7. Not in the whole country, but in many prefectures. The state of emergency will be introduced in the capital – Tokyo, neighboring prefectures of Kanagwa, Chiba, Saitama, as well as the prefectures of Osaka, Hyogo and Fukuoka. The Prime Minister promised that he would not close cities (as many countries do), but would insist that people stay at home. At the moment, it is difficult to assess how large-scale the consequences of this step will be. But at the same time, it is obvious that the unemployment rate will increase in the country and the volume of industrial production will decrease. And this is despite the fact that the epidemic in Japan, according to experts, has not yet reached its peak.
At the moment, more than 4,600 people infected with the coronavirus have been identified in the country, and 106 people have died. These numbers are relatively low (compared to those States that are at the epicenter of the pandemic), but the number of new cases continues to grow steadily, especially in the capital. At the moment, it is known that the heads of the above-mentioned regions of the country "strongly recommend" to suspend the activities of enterprises, factories and organizations, as well as the work of institutions where a lot of people gather. The adopted law allows you to extend this regime for up to six months, that is, until October of this year. Such prospects put pressure on the Japanese currency. The USD/JPY pair is growing for the third trading day in a row and today it has already tested the 109th figure – however, it bounced from the resistance level of 109.30 (the Tenkan-sen line on the daily chart). But if anti-risk sentiment continues to prevail in the market, the pair will probably break through the specified resistance level and head towards the next two price barriers – 109.30 and 109.60 (the lower and upper border of the Kumo cloud, respectively), with a further aim at the 110th figure. Therefore, it is now advisable to consider long positions for the pair to the specified price targets. The material has been provided by InstaForex Company - www.instaforex.com |
| Evening review for EUR/USD for April 6th. Market optimism caused by expectations of epidemic decline Posted: 06 Apr 2020 08:00 AM PDT As we can see on the chart, S&P500 is moving up. There is a rise amid expectations of the coronavirus decline in the US. Coronavirus: In Europe, the situation is improving. In Italy and Spain, a number of deaths ( around 500 and 700) dropped from the highest level of 1 thousand people a day. A number of infected people is advancing by 6%-7% every day. In the US, the total number of infected people is 337 thousand. In New York, a number of confirmed coronavirus cases is 123 thousand. Of course, it is too much for such a city. Nevertheless, a number of new cases is below 10% a day (+7%). Reports on coronavirus from the US are really fresh. The data is expected to be confirmed during the next two days. This week can become a pivot point for the US. In Russia, the epidemiological situation is getting worse and worse. A number of new cases grew by 15% a day to 6,346 people. More than 70% of all cases were recorded in Moscow. EUR/USD Buy positions can be opened at 1.1040. Sell positions can be opened at 1.0635. The material has been provided by InstaForex Company - www.instaforex.com |
| April 6, 2020 : EUR/USD Intraday technical analysis and trade recommendations. Posted: 06 Apr 2020 07:56 AM PDT
Since December 30, the EURUSD pair has trended-down within the depicted bearish channel until few weeks ago, when a new low around 1.0790 was recently established where the EUR/USD pair looked OVERSOLD after such extensive bearish decline. On February 20, recent signs of bullish recovery were demonstrated around 1.0790 leading to the recent steep bullish movement towards 1.1000, 1.1175, 1.1360 and finally 1.1480 where a (123) bearish reversal pattern was initiated around. This turned the short-term technical outlook for the EURUSD pair into bearish when bearish persistence below the Key Zones of 1.1235 and 1.1175 was maintained on a daily basis. Few weeks ago, the EURUSD pair has expressed significant bullish recovery around the newly-established bottom around 1.1065. The recent bullish engulfing H4 candlesticks as well as the recently-demonstrated ascending bottoms indicated a high probability bullish pullback at least towards 1.0980 and 1.1075 (Fibonacci Level 50%). Key Supply-Levels in confluence with significant Fibonacci levels are located around 1.1075 (50% Fibonacci) and 1.1175 (61.8% Fibonacci) where bearish rejection was highly-expected. Moreover, a Head & Shoulders reversal pattern was being demonstrated around the price levels of (1.1000 - 1.1075). The reversal pattern neckline existing near the key-level around 1.1000 was recently breached to the downside confirming the reversal. Shortly after, further bearish decline was being demonstrated towards 1.0800 where the nearest demand level to be considered is located near the backside of the broken channel around 1.0800-1.0750 where bullish rejection may exist soon. Trade recommendations : Intraday traders can wait for more bearish pullback towards the mentioned demand-zone around 1.0800-1.0750 and look for any bullish rejection signs as a valid BUY signal for a short-term trade. S/L to be placed below 1.0700 while Initial T/P level to be located around 1.0870, 1.0920 and 1.1000. The material has been provided by InstaForex Company - www.instaforex.com |
| April 6, 2020 : GBP/USD Intraday technical analysis and trade recommendations. Posted: 06 Apr 2020 07:31 AM PDT
Recently, the GBPUSD has reached new LOW price levels around 1.1450, slightly below the historical low (1.1650) achieved in September 2016. That's when the GBP/USD pair looked very OVERSOLD around the price levels of 1.1450 where a double-bottom reversal pattern was recently demonstrated. Technical outlook will probably remain bullish if bullish persistence is maintained above 1.1890-1.1900 (Double-Bottom Neckline) on the H4 Charts. Bullish breakout above 1.1900 (Latest Descending High) invalidated the bearish scenario temporarily & enabled a quick bullish movement to occur towards 1.2260. Next bullish targets around 1.2520 and 1.2680 were expected to be addressed if sufficient bullish momentum was maintained. However, early bearish pressure signs have originated around 1.2470 leading to another bearish decline towards 1.2265. That's why, H4 Candlestick re-closure below 1.2265 is needed to hinder further bullish advancement and enhance the bearish momentum on the short term. If so, Initial Bearish target would be located around 1.1900 provided that quick H4 bearish closure below 1.2265 is achieved. On the other hand, bullish persistence above 1.2265 would probably enhance another bullish pullback movement up to the price level of 1.2470. Trade recommendations : Conservative traders should be waiting either for another bullish pullback towards 1.2350 or another H4 bearish closure below 1.2265 as a valid SELL signal. T/P level to be located around 1.2100 and 1.2000 while S/L should remain above 1.2450. The material has been provided by InstaForex Company - www.instaforex.com |
| Short-term Ichimoku cloud indicator analysis of EURUSD Posted: 06 Apr 2020 06:31 AM PDT EURUSD remains in a bearish trend. Price continues to make lower lows and lower highs and as we said in a previous analysis, we expect price to challenge the 1.07-1.06 area. In Ichimoku cloud terms, there is no sign of a bottom and or a reversal.
|
| Short-term Ichimoku cloud indicator analysis of Gold Posted: 06 Apr 2020 06:26 AM PDT Gold price as we explained in our previous posts remained in a short-term bullish trend supported by the Ichimoku cloud. Price continues to make higher highs and higher lows. Support is being respected and so far all Ichimoku cloud indicators support the bullish trend.
|
| Trading recommendations for GBPUSD pair on April 6 Posted: 06 Apr 2020 05:36 AM PDT From a comprehensive analysis, we see the first significant change and I suggest that we analyze the details. The entire past week has been squeezed in the range of 1.2280//1.2380//1.2480, where the activity dropped over time and the oscillation amplitude contracted. A cardinal change occurred only on Friday, where the compression reached its limits and was replaced by an impulse that overcame the lower limit of its aisle and there were impulses that led the quote to the area of 1.2200. In fact, this is the first significant change since the beginning of the week, and now the main question is, how stable is it? If we turn our attention to other trading instruments, for example, the euro/dollar, we will see that the dollar with all its problems with the labor market continues to strengthen, which means that investors trust it and pour their assets into it. Returning to the pound, we note that the dynamics differ from the correlating pair (EURUSD), but the strengthening of the dollar here was more significant a period earlier. Traders assume that now there is another accumulation of trading forces, where a return to historical lows is a possible scenario for the future. As for our trading tactics, everything is always the same, the work is done on local operations, and the key technical elements are the last fluctuations, relative to which a forecast of a possible local move is made. In terms of volatility, we see that after two consecutive decelerations, there was an acceleration that again exceeded the daily average by 9%. Of course, this is not the same fluctuations that we saw in the middle of March, but we are still in the acceleration stage. Details of volatility: Monday-165 points; Tuesday-245 points; Wednesday-172 points; Thursday-358 points; Friday-359 points; Monday-144 points; Tuesday-271 points; Wednesday-676 points; Thursday-354 points; Friday-522 points; Monday-267 points; Tuesday-296 points; Wednesday-333 points; Thursday-452 points; Friday-352 points; Monday-148 points; Tuesday-227 points; Wednesday-108 points; Thursday-126 points; Friday-198 points. The average daily indicator, relative to the dynamics of volatility is 181 points (see the table of volatility at the end of the article). As discussed in the previous review, traders considered short positions just at the breakdown of the lower border of the flat, but the first predicted level of 1.2150 has not yet been reached by the quote. Looking at the trading chart in general terms (the daily period), we see only two main inertia, where there was a stagnation from the accumulation of Doji candles, which reflects the characteristic instability of the structure. Friday's news background had the index of business activity in the British services sector, where a decline was expected, but everything turned out to be much worse. The PMI fell from 53.2 to 34.5, and the composite PMI fell from 53.0 to 36.0. After that, the report of the United States Department of Labor became the center of attention, where the market was subjected to a new shock, since the acceleration of decline has not been seen for a very long time. So, the number of jobs in the agricultural sector decreased by 701,000. According to the forecast, they were waiting for a decrease of 150,000 In other words, we expected the worst and got even worse, but we don't stop there, since the unemployment rate in the United States accelerated from 3.5% to 4.4%, with a forecast of 3.8%. The market reaction to all this was interesting, so the dollar, contrary to the principles of fundamental analysis, continued to strengthen, repeating the story of Thursday, when after the publication of stunning data on applications for unemployment benefits in the US, the dollar did not react in any way. Experts are inclined to believe that such an unusual reaction is due to the fact that investors see the possible consequences of the COVID-19 virus in other countries, where there will be nothing better, and the dollar will be the most attractive currency due to the general risk. Today, in terms of the economic calendar, we had data on business activity in the construction sector in the UK, where, without too much surprise, a decline was recorded from 52.6 to 39.3, with a forecast of 44.0. Further development Analyzing the current trading chart, we see a return of the quote to the flat corridor of 1.2280//1.2380//1.2480, where the activity is extremely low. In fact, there is still a chance of resuming the downward development, but to start, the quote needs to focus on the area of 1.2200, otherwise the probability of maintaining fluctuations within the framework of a sideways move will be higher than usual. In terms of the emotional background, we see that market participants are strongly influenced by panic, where the external background leads to a violation of the laws of technical and fundamental analysis. We can assume a temporary oscillation in the range of 1.2200/1.2350, which will also be a signal of a change in the earlier inertia. The main step in the development is still fixing the price below 1.2200. Based on the above information, we will output trading recommendations: - Positions for sale are considered in two options: the first is lower than 1.2270, with the prospect of a move to 1.2220; the second option comes from the main development, where the quote needs to be fixed below 1.2200, with the prospect of a move to the psychological level of 1.2000. - Buy positions are considered in the event of a resumption of fluctuations within the flat. In this development, the quote should be fixed higher than 1.2350, with the prospect of a move of 1.2400-1.2450. Indicator analysis Analyzing different sectors of timeframes (TF), we see that the indicators of technical instruments have a variable signal due to the preservation of price fluctuations within the flat framework. At the same time, daily intervals reflect earlier inertia, which still reflects the high level of the quote. Volatility for the week / Measurement of volatility: Month; Quarter; Year. Volatility measurement reflects the average daily fluctuation, calculated for the Month / Quarter / Year. (April 6 was based on the time of publication of the article) The volatility of the current time is 116 points, which is even less than the daily average. It can be assumed that if the downward trend is resumed, the acceleration can easily exceed the average. Key levels Resistance zones: 1.2350**; 1.2500; 1.2620; 1.2725*; 1.2770**; 1.2885*; 1.3000; 1.3170**; 1.3300**; 1.3600; 1.3850; 1.4000***; 1.4350**. Support zones: 1.2280 (1.2240); 1.2150**; 1.2000*** (1.1957); 1.1850; 1.1660; 1.1450 (1.1411); 1.1300; 1.1000; 1.0800; 1.0500; 1.0000. * Periodic level ** Range level *** Psychological level **** The article is based on the principle of conducting a transaction, with daily adjustments. The material has been provided by InstaForex Company - www.instaforex.com |
| Trading plan for EUR/USD for April 06, 2020 Posted: 06 Apr 2020 05:33 AM PDT
Technical outlook: EUR/USD might have completed its corrective drop that had begun from 1.1150 levels. A bottom might be in place at 1.0775 on Friday and that EUR/USD might begin to rally towards 1.1500 levels. Initial resistance is seen 1.0866 levels and a break higher would confirm that bulls are back in control. Also, a push above the resistance trend line would be quite encouraging for bulls to continue further. On the flip side, if prices drop below 1.0775, the next support should come towards 1.0745 levels, which is also the fibonacci 0.786% retracement of the previous rally. The overall bullish structure remains intact until prices stay above the 1.0636 levels. Trading point of view, it remains good to hold on the long side with risk at 1.0636 respectively. Please be prepared for a marginal low below 1.0775 levels before the rally could resume. Trading plan: Remain long and add further @ 1.0745, stop @ 1.0636, target is 1.1500 Good luck! The material has been provided by InstaForex Company - www.instaforex.com |
| Oil will show the "Canadian" way Posted: 06 Apr 2020 04:57 AM PDT What can't you do to pull the American stock market out of the abyss! And you will implement the $2 trillion fiscal stimulus, and the Fed will force the rate to drop almost to zero and reanimate QE, and you will reconcile the enemies. One of the important drivers of the fall in US stock indices is the peak of Brent and WTI to the area of 18-year lows, which negatively affects the stock prices of oil companies in the United States, increases the risks of their defaults and bankruptcies. In order to prevent this, Donald Trump has to put pressure on Russia and Saudi Arabia. Events in the black gold market attract the attention of investors, and along with it, interest in the currencies of oil-exporting countries is growing. The OPEC+ meeting and the report on the maple leaf country's labor market for March make you look at the Canadian dollar. At the end of the second decade of spring, its position seemed hopeless, but cheap liquidity from the Fed and Donald Trump's intervention in the oil war between Moscow and Riyadh changed the picture somewhat. The US President insists that the cartel and other producing countries reduce production by 10-15 million b/d, otherwise he intends to apply duties on imports from Russia and Saudi Arabia. Investors believe that a compromise will be found at the OPEC+ meeting, and push Brent quotes to $33 per barrel. Given the close correlation between black gold and USD/CAD, it was possible to assume that confidence would return to the "loonie". However, the exchange rate formation on forex depended on a single factor! Dynamics of USD/CAD and oil
The Fed lowered the federal funds rate to 0.25% and announced its intention to buy as many Treasury and mortgage bonds as it wants, but instead of helping the US equity market, the Central Bank strengthened the US dollar. The latter is used as the main safe-haven asset, and cheap liquidity from the Federal Reserve in conditions of deteriorating macro statistics allows investors to increase their share in portfolios. The dollar strengthened in response to disappointing statistics on the US labor market for March. Most likely, it will continue to improve its position even if other countries will release gloomy data. In this regard, the sad forecasts for Canadian employment are the very factor that restrains the bears' attacks on USD/CAD even against the backdrop of growing oil. The consensus forecast of Bloomberg experts suggests a reduction in employment by 500,000 and the Royal Bank of Canada and Citigroup expect a decline of 1-1. 1 million at all. If the most pessimistic estimates become reality, and OPEC+ fails to agree, oil and the "loonie" will return to a downward trend. In the opposite case, the "Canadian" will continue to correct. The fundamental picture is confirmed by the technical one. The USD/CAD pair is frozen in the consolidation range of 1.40–1.43 within the "surge and shelf" pattern on the basis of 1-2-3 and is waiting for news. A breakout of support at 1.40-1.401 makes sense to use it to form short positions. A successful assault on the resistance at 1.43 – to open long positions. USD/CAD, the daily chart
|
| Posted: 06 Apr 2020 04:46 AM PDT News :
Since the price of bitcoin plunged to historic lows last month, the bitcoin network's hash rate has also been on a constant decline. Nearly 2.3 million S9 miners were wiped out in China recently as it became hard for miners to make profits. Network's hash rate indicates how secure and strong the blockchain network is. Bitcoin's hashrate dropped from 133.29 EH/S, the highest since the start of 2020, to 108.16 on 12th March, when the price of the leading cryptocurrency plunged below $4,000. Since then, the hashrate has been continuously falling as miners face tough times to continue their operations. On 4th April, hashrate was at 96.9888EH/S, an increase in hashrate must be accompanied by an increase in the price of bitcoin for miners to maintain healthy profit margins. Technical analysis: BTC has been trading upwards. The price is at the very critical pivot level at $7.245. This is decision level for BTC and you should watch carefully this level.I do expect potential downside rotation and rejection towards the level at the price of $5.827. Watch for selling opportunities. Only if you see the breakout of the $7.245, watch for possible rise towards the $7.691. MACD oscillator is showing neutral stance and no imbalance in momentum. Resistance level is set at $7.245 Support levels are set at the price of $6.600 and $5.827. The material has been provided by InstaForex Company - www.instaforex.com |
| Posted: 06 Apr 2020 04:21 AM PDT News:
The ousted US inspector general of the intelligence community has said he is "disappointed and saddened" that Donald Trump fired him, but he also encouraged other inspectors general to continue to speak out when they are aware of wrongdoing. The US president notified Congress late on Friday evening that he intended to fire Michael Atkinson, a pivotal figure in his impeachment last year, because he had lost confidence in him. On Saturday, Trump made it clear that the move had been retaliatory, telling reporters that Atkinson was a "disgrace" and had done "a terrible job" because he had provided an anonymous whistleblower complaint to Congress – a move that was required by law. Technical analysis: Gold has been trading upwards. The price tested the level of $1.636 Anyway, the gold is near very important resistance pivot level at $1.644. The eventual upside breakout of the $1.644 may confirm further rise towards the $1.670 and $1.689. Buying would be preferable if this scenario happens. The eventual rejection may confirm rotation downside towards the levels at $1.607 and $1.598. Selling would be preferable if this scenario happens. Stochastic oscillator is showing reading above the 80 and the overbought condition.. Resistance level is set at $1.644 Support levels are set at the price of $1.607 and $1.598 The material has been provided by InstaForex Company - www.instaforex.com |
| Analysis and trading ideas for USD/JPY on April 6, 2020 Posted: 06 Apr 2020 04:13 AM PDT Good day! The situation with COVID-19, according to data on Sunday, remains more or less tolerable in Japan. 4,565 people infected with coronavirus, about 700 cases of fatal outcomes. Nevertheless, Japanese Prime Minister Shinzo Abe is considering the option of introducing a state of emergency in the country. However, Abe can only take such a step after consulting with medical experts and health officials. It is not the responsibility of the Prime Minister of Japan to make an independent decision on the introduction of a state of emergency. Even if an emergency is introduced, it will most likely affect the largest and most densely populated areas and cities in the country. Such as Tokyo, Osaka, and perhaps some others. However, the emergency situation does not provide for a total quarantine. The population will not be fined, but the closure of schools and a number of institutions is quite possible. A decision on this issue may be made as early as tomorrow, on Tuesday. By the way, the emergency regime cannot prohibit business activity in Japan, which means that the economy of the Land of the Rising Sun will not be paralyzed and will continue to function as much as possible in the current conditions. If we go to the technical picture of the USD/JPY currency pair, then, despite the failed data on the US labor market, the dollar/yen showed growth last week. Weekly
The bears' attempts to continue the pressure on the instrument were limited near 107.00. As has been noted many times before, this is a strong, significant psychological and technical level, which was once again confirmed by the auction of the past week. From this mark, the pair started an active recovery and closed the session at 108.52. Approximately in the middle of the Ichimoku indicator cloud and slightly above 50 simple moving average. For the USD/JPY, the trading of the current five-day period started quite positively. At the time of writing, the pair is strengthening and trading is taking place near 109.20. However, the bulls for this instrument have not solved all the same tasks as before. Namely, going up out of the cloud, breaking through 89 and 144 exponential moving averages, as well as fixing over the cut, but not broken, resistance line (red) 125.84-114.55. As you can see, the pair can not be fixed by more than one candle above this line, which means that its breakdown at the moment can not be considered true. Right now, the quote is testing for a breakout of 89 EMA and trying to get out of the Ichimoku cloud, above the red resistance line, which, although it is considered cut, continues to offer resistance. Also, do not discount the strong 144 exponential, which has a special impact on pairs with the Japanese yen. In general, the USD/JPY bulls have serious tasks that they need to solve in order to continue the route in the north direction. Daily
Despite the fact that today's trading opened with a small bearish gap, the pair turned up, closed the price gap and continues to grow. Here it is very clear that after passing up three moving averages at once (50 MA, 89 EMA, and 144 EMA), the quote met resistance on the Tenkan line and so far has rebounded from it. If today's trading can be closed above Tenkan, it is possible to continue the rise to the area of 109.60-109.85. However, it is worth noting that the same resistance line of 125.84-114.55 passes a little higher than Tenkan. Thus, there is a possibility of a downward pullback from current prices. Let's take a closer look at this scenario over a smaller time period. H1
In particular, on the hourly chart, we see a series of Doji candles that indicate the pair's problems to continue rising. In my opinion, there are two possible scenarios in this situation. The first provides that after the formation of the next Doji candle, the pair will begin to decline, the goals of which will be the area near 108.85 or lower, the area of 108.35-108.20. If this happens, you can try careful sales to the indicated prices, where you can close short positions and consider purchases. The second scenario is a sharp shot up from the current prices and a breakdown of 109.50. In this case, after fixing above 109.50, you can also try opening long positions on the rollback to this level, which are currently the most priority. Good luck! The material has been provided by InstaForex Company - www.instaforex.com |
| Posted: 06 Apr 2020 04:03 AM PDT Corona virus summary:
Boris Johnson has been admitted to hospital due to coronavirus after suffering 10 days of symptoms including a high fever, bringing doubts about his capability to lead the response to the pandemic despite No 10 insisting it was purely precautionary. Johnson was taken to an unnamed London hospital on Sunday after days of persistent symptoms, during which time he has been self-isolating. Last week No 10 had denied the prime minister was more seriously ill than claimed.. Technical analysis: EUR/USD has been trading sideways at the price of 1.0800. Anyway, there is the breakout of the rising wedge pattern on the 30M time-frame, which is sign that intraday sellers are in control. Watch for selling opportunities with the downward target at the price of 1.0743. MACD oscillator is showing selling pressure from the background and the slow line again turned to the downside, which is strong sign of the bearish pressure. Resistance levels are set at the price of 1.0835. Support levels are set at the price of 1.0733 and 1.0743 The material has been provided by InstaForex Company - www.instaforex.com |
| Posted: 06 Apr 2020 04:00 AM PDT To open long positions on GBPUSD, you need: In the morning forecast, I paid attention to the level of 1.2305, around which the bulls could have problems, which happened. However, it is worth noting that bears are not in a hurry to return to the market at this resistance even after forming a false breakout there, which is clearly visible on the 5-minute chart. In the second half of the day, the buyers' task will be to break through and consolidate above this range, which will lead to a larger upward correction of the pair to the area of last week's maximum of 1.2473, where I recommend fixing the profits. It is important to note that if the bulls manage to close the day above 1.2305 – this will be a very strong bullish signal in the medium term, which will open a direct path to new highs in the area of 1.2605 and 1.2686. In the scenario of a decline in GBP/USD, you can still count on long positions only after forming a false breakout from the support of 1.2146 or buy the pound immediately on a rebound from the minimum of 1.1985.
To open short positions on GBPUSD, you need: Due to weak fundamental data on the construction sector, the bears stopped the growth of the pair and did not let it go above the resistance of 1.2305. Until such time as trading is conducted below this range, the option of reducing the pound will remain quite high, and the nearest target of sellers will be a minimum of 1.2146, where I recommend fixing the profits. To maintain the downward correction, the bears will also only need to update the low of last Friday. In the scenario of GBP/USD growth in the second half of the day above the resistance of 1.2305, it is best to return to short positions on the rebound from the maximum of 1.2473 or after updating the larger resistance of 1.2605, counting on correction of 50-60 points within the day.
Signals of indicators: Moving averages Trading is conducted in the area of 30 and 50 daily averages, which indicates an active struggle between buyers and sellers. Note: The period and prices of moving averages are considered by the author on the hourly chart H1 and differ from the general definition of the classic daily moving averages on the daily chart D1. Bollinger Bands A break in the upper limit of the indicator around 1.2305 will lead to an increase in the pound. Description of indicators
|
| Posted: 06 Apr 2020 03:59 AM PDT To open long positions on EURUSD, you need: In my morning forecast, I paid attention to the resistance of 1.0833, which could not be broken above in the first half of the day due to another poor fundamental data indicating a reduction in the economic growth rate of the eurozone. The report on the decline in investor confidence scared off the bulls, whose target is still the resistance of 1.0833. Only fixing it will allow you to think about the continuation of the upward correction against the background of profit fixing by bears, with a likely test of the maximum of 1.0894 and an update of the larger resistance of 1.0955, where I recommend fixing the profit. If the pressure on EUR/USD persists in the second half of the day since there are no reports on the US economy today, it is best to return to long positions only after updating the minimum of 1.0776, provided that a false breakout is formed or immediately to rebound from the larger support of 1.0718.
To open short positions on EURUSD, you need: The reluctance to sell the euro at current lows still prevails over the desire to buy EUR/USD against the background of such terrible fundamental statistics for the eurozone. The 5-minute chart clearly shows how sellers coped with their morning task and protected the range of 1.0833, where the formation of a false breakout led to another sale and an update of the low of 1.0776. In the second half of the day, an equally important task for the bears is to break through and consolidate below this area, which will definitely push EUR/USD to a larger level of 1.0718, and then to the annual minimum in the area of 1.0636, where I recommend fixing the profits. In the scenario of repeated growth of the pair to the resistance of 1.0833, I recommend postponing new short positions until the test of larger highs of 1.0894 or "short" EUR/USD immediately on the rebound from the area of 1.0955.
Signals of indicators: Moving averages Trading is conducted in the area of 30 and 50 daily moving averages, which indicates the likely end of the bearish trend. Note: The period and prices of moving averages are considered by the author on the hourly chart H1 and differ from the general definition of the classic daily moving averages on the daily chart D1. Bollinger Bands In the case of an upward correction in the second half of the day, a break in the upper limit of the indicator in the area of 1.0833 will lead to an increase in the euro. Description of indicators
|
| EUR / USD: why you should not rush to sell the dollar Posted: 06 Apr 2020 02:59 AM PDT Even though the Federal Reserve pumped financial markets with liquidity, it failed to stabilize US stock indexes. Instead of buying shares, investors continue to increase the share of reliable assets in their portfolios. The fate of the EUR / USD pair depends on how long this lasts. The S&P 500 index responded with a decline to disappointing statistics on the US labor market in March. Last month, the number of people employed in the non-agricultural sector of the United States fell by 701,000, forcing experts to recall the darkest days of the 2008 crisis. At the same time, unemployment has shown the fastest growth since 1975, from 3.5% to 4.4%. Given the reflection of data for an incomplete month, the picture in the middle of spring promises to be much more gloomy. According to forecasts by Bloomberg analysts, the number of applications for unemployment benefits in the United States for the six-day period by April 4 will amount to 5 million. In the next three weeks, the figure may grow by 15 million. As a result, the unemployment rate in April will jump from the current 4.4% to 10%. According to Moody's Analytics estimates, due to social exclusion, about 29% of the US economy was "disconnected" during the month. If quarantine lasts two months, it will be about reducing national GDP by 75% in the second quarter. In this regard, The Goldman Sachs forecast of a 34% decline does not look so pessimistic, although it is difficult to call it optimistic as well. Thus, the immediate prospects for the US GDP and the US labor market are far from being drawn in bright colors. This does not allow US stock indices to stand on their feet. It is their weakness that first of all gives strength to the greenback. The US currency is still in high demand as the level of uncertainty goes off scale. At present, there are at least four types of uncertainty that force investors to resort to safe-haven assets and increase market volatility: the severity and timing of the spread of coronavirus, the breadth and duration of social exclusion measures, the economic consequences of these measures, and, finally, the response policy. Meanwhile, the colossal amount of cheap dollar liquidity could become a stone tied to the legs of a greenback. It is assumed that during the recovery period of the world economy it will be actively used as a funding currency for carrying trade operations. The balance sheet of the American Central Bank is now growing by leaps and bounds. According to Bank of America, the figure will expand to $9 trillion by the end of the year, which is equivalent to 40% of the US GDP. Evercore ISI experts, in turn, call the figure $12 trillion (60%). For comparison: the ECB balance is 40% of the size of the eurozone economy. However, there is no question of restoring the GDP of the currency block. The failure of the bulls on EUR / USD to return quotes above 1.0840 will increase the risks of continuing the peak of the main currency pair. "The dynamics of the USD suggests that it is not the time to sell the American currency, despite the fact that the Fed has actually launched an endless QE," said Nordea Bank strategists. "The launch of the printing press in the United States gives reason to expect a fall in the dollar on the horizon of six to twelve months. Moreover, the scale of losses of 10% looks quite real. However, at the moment, the level of uncertainty is too high: the scale of the coronavirus pandemic is growing, and most countries are at the beginning of the path that China has traveled. Therefore, the full damage to the global economy from the virus has not yet been taken into account in quotes, "they added. Although experts are convinced that the dollar will weaken in the future, they see a significant risk of new attacks of its strengthening in the short term. The bank admits that during severe shocks the EUR / USD rate may fall to parity or even lower. The material has been provided by InstaForex Company - www.instaforex.com |
| Analysis and trading ideas for GBP/USD on April 6, 2020 Posted: 06 Apr 2020 02:54 AM PDT Boris Johnson hospitalized, Elizabeth II addresses the nation. Hello, dear traders! The GBP/USD currency pair ended the previous trading week with a decline. However, it turned out to be quite insignificant. We will return to the technical picture of the pound/dollar pair later, but for now, we will talk about important events related to the COVID-19 epidemic. As it became known, British Prime Minister Boris Johnson was hospitalized for a more in-depth medical examination for a new type of coronavirus. Nevertheless, the British Prime Minister continues to manage the government remotely via video conferences. According to some reports, the health of Queen Elizabeth II of Great Britain is also under threat, as one of the courtiers tested positive for coronavirus, and her son is already ill. Meanwhile, Elizabeth II made an address to the nation, in which she thanked the British for their courage and patience and promised that everything will be fine. Judging from the TV picture, Queen Elizabeth II looks pretty good. It is characteristic that for 68 years that she sits on the throne, this is only her third official address to the nation. Understand the importance of the moment! If we go back to the pandemic, the British leadership echoes its older brother, the United States, and believes that the peak of the epidemic will come within 1-2 weeks. God grant that this will be the case and the epidemic will go down. Now let's turn directly to the technical picture for the pound/dollar currency pair, and start with the weekly chart. Weekly
As noted at the beginning of the article, the British pound got off lightly and suffered minor losses against the US dollar. Moreover, there were even attempts to grow, but the lower border of the cloud and the Kijun line of the Ichimoku indicator curbed the bulls on the pound and did not allow them to raise the quote above the resistance level of 1.2480. After reports of Boris Johnson's hospitalization, sterling opened the week with losses and fell to 1.2208. In past reviews of this currency pair, it has been repeatedly noted that the mark of 1.200 is very strong and extremely important for trading participants. The current case is another confirmation of this. At the moment, the GBP/USD pair is showing growth and is trading near 1.2310. If the players on the increase manage to continue moving the quote in the north direction, the nearest goal may be the lower border of the Ichimoku cloud, which passes at 1.2450. The longer-term goal will be the maximum values of the week before last at 1.2485. However, this may happen later, not at the auction of the current five-day period. If the pair's bulls manage to close the weekly trading within the Ichimoku cloud, it is possible that in the future the pair will head to its upper border, which passes at 1.2668, just above, at 1.2680, and there is a 50 simple moving average. Bears have a very difficult task with this tool. They need to lower the rate to the support of 1.1410 and breakthrough this level, closing trades under it. Judging by the weekly timeframe, it is more likely to predict the growth of the pair. Daily
In this time period, the upward prospects of the pound are also seen, however, for this purpose, it will be necessary to break through the resistance of sellers at 1.2480/85. If it is possible for the players to increase the rate, the next target at the top will be 50% and 89 exponential moving averages, which are located near 1.2650. I consider the strong technical level of 1.2725, which is directly at the 200 exponential, to be the further mark of a possible rise in the pair. Conclusion and recommendations for GBP/USD: Compared to the single European currency, the British pound technically looks less vulnerable and more prone to growth. In other words, if both the euro and the pound declined against the US dollar, the decline of the "British" will be more limited. Conversely, in the event of the growth, sterling will strengthen against the USD more strongly than the single European currency. If today's article recommended selling for the euro/dollar, then you can try to buy the GBP/USD pair with a short-term decline in the area of 1.2275-1.2255 and (or) after the breakout of the level of 1.2323. The indicated targets for possible growth can be considered for opening short positions. Confirmation of this will be the reversal bearish models of Japanese candlesticks. Good luck! The material has been provided by InstaForex Company - www.instaforex.com |
| Technical analysis of GBP/USD for April 06, 2020 Posted: 06 Apr 2020 02:41 AM PDT The Coronavirus (COVID-19) impacts on the GBP/USD pair since three months. The GBP/USD pair started recovering until it reaches the top point of 1.2484. Amid the previous events, the price is still moving between the levels of 1.2256 and 1.2484. Resistance and support are seen at the levels of 1.2484 (also, the double top is already set at the point of 1.2484) and 1.2256 respectively. Therefore, it is recommended to be cautious while placing orders in this area. So, we need to wait until the sideways channel has completed. The current price is seen at 1.2338 which represents a key level today. The level of 1.2484 will act as the first resistance today. Hence, if the pair fails to pass through the level of 1.2484, the market will indicate a bearish opportunity below the strong resistance level of 1.2484. Sell deals are recommended below the level of 1.2484 with the first target at 1.2256. The level of 1.2256 represents the daily pivot point. If the trend breaks the support level of 1.2256, the pair is likely to move downwards continuing the development of a bearish trend to the level 1.2087. The weekly pivot is seen at the level of 1.2256. The market is still in a downtrend. We still prefer the bearish scenario in long term. However, the sop loss should be placed above the last bullish wave around the spot of 1.2500. The material has been provided by InstaForex Company - www.instaforex.com |
| Trading recommendations for EUR/USD pair on April 6 Posted: 06 Apr 2020 02:39 AM PDT From the point of view of complex analysis, we see a movement contrary to the fundamental approach, where the quote eventually reached the level of 1.0775. Now, let's talk about the details. Last week, in terms of a downward movement, the quote managed to pass more than 350 points, not paying attention to all the constraining factors. As a result, we received an inertia again in a downward course, and the sequence of them, which has stretched right from the beginning of the year, is still preserved. Concerning the graphic model "Head and shoulders" [H1 graph], which we managed to identify on April 1, there was a 100% implementation to everyone's surprise. The figure did not just have even forms, it also developed a profit segment. The end of which coincided with a variable level of 1.0775. Regarding trading approaches, tactics have remained unchanged and carry local operations. On the other hand, regarding the theory of inertial oscillations, it was noted that with each successive descending course, the minimum of early inertia was overcome. Based on this logic, a minimum of 1.0636 may be at risk of breakdown in the near future, and if you look at the current location of the quote, then the chance is extremely high. In terms of volatility, we see the first slowdown in volatility relative to the daily average for several months. 91 points seems to be not so much now, but just at the beginning of March, the average daily figure was 50 points, and now we understand how much we have dispersed the activity. I do not think it is necessary to say that the process of slowing down volatility has come, since there is still a long way to go to the norm of activity of the single currency, and the external background is still large. Details of volatility: Monday - 155 points; Tuesday - 183 points; Wednesday - 115 points; Thursday - 278 points; Friday - 166 points; Monday - 151 points; Tuesday - 234 points; Wednesday - 243 points; Thursday - 326 points; Friday - 194 points; Monday - 191 points; Tuesday - 160 points; Wednesday - 133 points; Thursday - 188 points; Friday - 194 points; Monday - 134 points; Tuesday - 127 points; Wednesday - 136 points; Thursday - 147 points; Friday - 91 pips The average daily indicator, relative to the dynamics of volatility is 110 points [see table of volatility at the end of the article]. Parsing Friday, we see that downward interest has been present literally since the opening of the daily candle, but the main round of short positions arose at the start of the European session. The subsequent movement was in the direction of the level of 1.0775, where after a control touch the quote moved to a slowdown. As discussed in the previous review, traders were already taking short positions, where the main profit was already taken, and the level of 1.0775 was suitable for partial and full profit taking. The further move was considered in two versions: the first is a continuation of the downward move, but in this case, a clear price fixing was needed below the level of 1.0775, but this did not happen; the second option considered a rebound from the level of 1.0775, which turned out to be attractive in terms of local operations. Considering the trading chart in general terms [the daily period], we see all the same inertial fluctuations in the structure of the global downward trend. Friday's news background was extremely broad and negative, starting with Europe, where the final data on the business services index were published, recording a decrease from 52.6 to 26.4. The mainstream news awaited us in the afternoon, where the report of the United States Department of Labor was published. They didn't expect anything good from it, the number of jobs should have decreased by 150 thousand, but it wasn't there, the decrease was already by 701 thousand. Of course, these are terrifying indicators and one of the fastest downward accelerations, but why be surprised when we see millions of applications for unemployment benefits in the states. In turn, the unemployment rate shows strong growth from 3.5% to 4.4% with a forecast of growth to 4.0%. Now, the most surprising thing is that the market reaction to such negative statistics was in favor of a stronger dollar. In the current period of time, the fundamental analysis has literally ceased to function, and the panic mood, against the background of the COVID-19 virus, is literally the reason for everything. Investors perfectly see the situation in the world and everywhere fix global problems. If the United States has such problems with the labor market, then what can we expect from Europe or from other regions? The consequences of coronavirus can be overwhelming, and amid the current background, it is better to sit in a situation where the risk is conditionally less, that is, not to jump from one risky asset to another since the risk may be even greater. Today, in terms of the economic calendar, we do not have statistics worth paying attention to, and market participants will continue to monitor the external background and the possible consequences of coronavirus on the global economy. Further development Analyzing the current trading chart, we see that the quote continues to focus on the downward trend after a small pullback, where the base point in the form of the level of 1.0775 is still maintained on the market. In fact, there is a chance of a possible downward development again, where the focus is not on the level of 1.0775, but the local minimum of 1.0636. That is, we continue to focus on the theory of updating minimum in the course of successive inertia. In terms of emotional background, we see a persistent panic, due to which there is activity and local denial of the principles of analysis of TA and FA. It can be assumed that downward interest will be most relevant after fixing the price lower than 1.0775. In the case of a developing one, it is possible to consider a sequential move in the form of steps 1.0700-1.0650 (1.0636). Based on the above information, we derive trading recommendations: - We consider buying positions in case of deceleration relative to the fluctuating 1.0775 / 1.0835 and fixing the price higher than 1.850. - We consider selling positions already in the field of price fixing lower than 1.0775, with the prospect of a movement to 1.0700-1.0650. Indicator analysis Analyzing a different sector of time frames (TF), we see that the indicators of technical instruments occupy a single signal about the sale due to the downward inertia. Volatility per week / Measurement of volatility: Month; Quarter; Year Measurement of volatility reflects the average daily fluctuation calculated from Month / Quarter / Year. (April 6 was built taking into account the time of publication of the article) The volatility of the current time is 52 points, which is half lower than the daily average. It can be assumed that in the case of the passage of the level of 1.0775, the acceleration of volatility can go to the stage of reaching an average indicator with a further increase during inertia. Key levels Resistance zones: 1.0850 **; 1,1000 ***; 1.1080 **; 1,1180; 1.1300; 1.1440; 1.1550; 1.1650 *; 1.1720 **; 1.1850 **; 1,2100 Support Areas: 1.0775 *; 1.0650 (1.0636); 1,0500 ***; 1.0350 **; 1,0000 ***. * Periodic level ** Range Level *** Psychological level The material has been provided by InstaForex Company - www.instaforex.com |
| Welcome to the Viking age (EUR/USD and GBP/USD on 04/06/2020) Posted: 06 Apr 2020 02:09 AM PDT It is clear that all economic difficulties of the policy will be attributed to the epidemic of coronavirus. After all, one cannot say that structurally the world economy is extremely vulnerable and there were many problems in it that no one solved. And then you have to report for an unprecedented increase in unemployment. The situation is really terrifying. The incredibly rapid growth rate of the number of unemployed, and not only in the United States, clearly shows that maybe coronavirus and measures to counter its spread have led to a surge in the number of unemployed, but that is not the point. This could only happen if employment was provided by artificial methods. Extremely cheap loans and rampant inflation of the financial sector have become the foundation for creating a huge number of jobs, however, these jobs were provided not at the expense of real economic efficiency, but by the endless supply of cheap money. As soon as a panic began in the markets and difficulties began to come up with financing, as major players were trying to save their money, this whole house of cards began to fall. The structure itself is extremely unstable and could not stand for a long time. So if it wasn't for the coronavirus, then a little later there would have been another reason for the general collapse. Perhaps, the design itself would begin to crumble under the weight of its own weight. In this whole situation, only the stubborn desire of the dollar to strengthen is surprising, which only occasionally gives way to its accidental weakening. And no matter how ridiculous it may look, we got an excellent explanation of the reasons for the growth of the dollar the other day. So it happened that no country in the world was ready for such an epidemic, and even the richest countries are faced with an elementary shortage of simple medical remedies. For example, masks, gloves and the like. Germany was no exception, which urgently ordered a bulk cargo ship of such funds. A bulk carrier can translate a gigantic amount of such protective equipment. So, Germany paid for everything and patiently waited for the arrival of the ship. But now, it will have to wait only for a refund, since, by the decision of the United States Government, this ship changed course and sailed not to Europe, but to North America. The indignation of Germany was so strong that other countries cast their voices, and France even admitted that it had already faced a similar situation. However, there it was not about masks, but about medical equipment. So the United States has clearly demonstrated to everyone that its own interests and security are above all and will not stop at anything to get what is required. And if all conceivable and inconceivable rules are violated at the same time, then this does not bother them at all. And now put yourself in the place of a major investor, who, in time of complete chaos and confusion, rushes about with the goal of more reliably hiding its capital. Where will you keep your money? It is better to entrust the money to the guys who will not hesitate to destroy everything and everything to get what they need. You never know, they might need them. If you give them to them in advance, they may even pay for them or maybe they'll just take them away and you'll have to thank them for not killing them at all. However, this is usually how events in the Middle ages are illustrated. And here, it turns out that in the 21st century, things are exactly the same. So the question about the strengthening of the dollar is probably removed. Any weakening of the dollar is a temporary mess, an accident until the United States resolves its own issues.
Let's be honest, the single European currency did not have any special reasons for growth apart from the report of the United States Department of Labor, which was more than leveled by a special operation to change the course of a ship loaded with all sorts of badly needed medical masks. Of course, you can point out the retail sales in Europe for a long time, the growth rate of which accelerated from 2.2% to 3.0%. In France, they generally accelerated from 2.6% to 3.4%. What can I say, even the decline in industrial production in Spain slowed down from -2.2% to -1.3%. In general, solid positive news. But the fact is that this is all the data for February, and now they love to say that the world will never be the same again. So, this world is changing, at least for Europe and North America, beginning closer to mid-March. Therefore, what happened in February is deeply parallel. But the final data on business activity indices just for March turned out to be just fine. For example, the index of business activity in the services of the euro area fell from 52.6 not to 28.4, but to 26.4. In Germany, it was supposed to decline from 52.5 to 34.5, but it turned out to 31.7. In France, it fell from 52.5 to 27.4, while a preliminary estimate spoke of 29.0. In Italy, it is still more fun, since the index fell from 52.1 to 17.4, while they expected a decrease to 20.0. Well, in Spain, the index was supposed to decrease from 52.1 to 25.0, and saw a fall to 23.0. It is clear that things are not in the best way with the composite index of business activity, in which the index of business activity in the service sector has the greatest weight. So the pan-European business activity index collapsed from 51.6 to 29, 7, although a preliminary estimate showed its reduction to 31.4. In Germany, it fell from 50.7 not to 37.2, but to 35.0. Well, in France, where they expected a reduction from 52.0 to 30.2, they got a drop to 28.9. In short, indeed, there is somehow no reason for the growth of the single European currency. After all, not only that the fall in the indices should have been just catastrophic, but it turned out to be even worse. Composite Business Activity Index (Europe):
But on the other side of the English channel, the situation is fundamentally no different. For example, a preliminary assessment showed a decrease in the index of business activity in the services sector from 53.2 to 35.7, and in fact, a reduction to 34.5 was obtained. The composite business activity index simply declined from 53.0 to 36.0. And it was supposed to collapse only to 37.1. Although the size of the fall in the indices is so impressive that the deviations of the actual indicators from the preliminary estimate, it looks a bit ridiculous. Let's just say that there is no difference anymore. Composite Business Activity Index (UK):
It's funny that the situation is slightly different in the United States, since the final values of business activity indices turned out to be better than the preliminary estimates showed. In particular, the index of business activity in the service sector, which was supposed to decrease from 49.4 to 39.1, only fell to 39.8. This allowed the composite business activity index to decline from 49.6 to 40.9, and not to 40.5. However, the scale of the decline in indices is still appalling. But most importantly, all this pales amid the contents of the report of the United States Department of Labor, which in fact simply confirmed the most terrible fears. Yes, there is a real disaster in the United States labor market. The unemployment rate jumped from 3.5% to 4.4%, and the number of jobs outside agriculture fell immediately by 701 thousand. This is much worse than forecasts that assured everyone that that the unemployment rate will increase to only 4.0%, and the number of jobs will be reduced by some 150 thousand. The reality turned out to be much worse. And there is no reason to believe that this is just a temporary difficulty and the situation on the labor market is about to improve. Forecasts show that the number of unemployed will only increase. Moreover, an impressive increase in the number of repeated applications for unemployment benefits is expected. That is, the duration of unemployment will increase. And since people are without work, then without income. This means that consumption will go down too. And the American market is the largest market in the world. Consequently, there will be less work worldwide. First, in those countries that manufacture finished products exported to the United States and then in those countries that supply raw materials from which all these goods are made. Thus, the situation is really scary. And most importantly, all this clearly demonstrates the weakness of the American economy. Indeed, if a business is efficient and generates profit, then in case of difficulties it has at least some margin of safety. For some time, employers are able to hold out. And here, we literally see instant growth of the army of the unemployed. That is, the business does not have any margin of safety. This suggests that the real effectiveness of many companies is likely to be generally negative, and they only live off cheap credit. This is not an economy. This is a virtual economy. In economic science, there is even a suitable term for this - zombie economy. But all this does not matter, because the story of the cargo ship for Germany showed everyone where they should keep their money. Number of New Non-Agriculture Jobs (United States):
In fact, no serious data is published today, but those that have already been released have shown nothing good again. The index of business activity in the construction sector in Europe fell from 52.5 to 33.5. In Germany, it declined immediately from 55.8 to 42.0, which amid other data does not look so bad. Indeed, in France, it collapsed from 50.2 to 35.2. And in Italy, it's a general disaster, since the index of business activity in the construction sector literally collapsed from 50.5 to 19.9. It is believed that Markit itself was not even aware that indexes could reach such values. In addition, the volume of factory orders in Germany fell by 1.4%, so we will have to wait a very, very long time to wait for the restoration of industrial growth in Europe. Construction sector business activity index (Europe):
No less exciting events take place on Foggy Albion, where car sales, to put it mildly, plumped down by 44.4%. It can be noted that this is in annual terms. Moreover, the index of business activity in the construction sector decreased from 52.6 to 39.3. But the construction sector is directly related to the real estate market, which is traditionally the main criterion for the investment attractiveness of the British economy. New Car Sales (UK):
Nothing interesting is being published in the US today. In addition, investors froze in anticipation, as there are suggestions that the peak of the epidemic has already passed, and now hope to see a confirmation of a decline in the growth rate of new cases of coronavirus infection. In this case, the closest attention to Italy and Spain. So for now, the single European currency will hang around the level of 1.0775.
The situation is similar with the pound, the only difference is that 1.2275 is the reference point.
|
| Analysis of EUR/USD on April 6, 2020 Posted: 06 Apr 2020 01:52 AM PDT Hello, dear colleagues! Friday's data on the US labor market was very disappointing. Thus, unemployment in the United States jumped immediately to 4.4%, although growth expectations were reduced to 3.8%. Nonfarm Payroll figures for the month of March were shocking. Employment in non-agricultural sectors of the economy fell short in March of 701,000 new jobs, while it was expected that the loss will be only 100,000-150,000. As you can see, the difference is huge, and the figure itself minus 701,000 is simply shocking! If you compare these reports, they are much worse and do not go in any comparison with the reports on non-forms during the financial and economic crisis of 2008. The only bright spot in the main indicators of all American labor statistics was the growth of average hourly wages, which quite unexpectedly exceeded the forecast value of 0.2% and in fact amounted to 0.4%. However, this did not affect the reaction of market participants. Traders' reaction to the extremely negative labor statistics from the United States was almost nonexistent. The market seemed to fall into a stupor and actually left without moving (that is, ignored) Friday's statistics from the US. It is clear that in the conditions of COVID-19 rampant around the world and the negative impact of the pandemic on the global economy, strong data on Nonfarm Payrolls were expected only by the most outspoken optimists. Nevertheless, such a faceless reaction of investors to the disgusting data on the change in the number of people employed outside the agricultural sectors of the American economy came as a surprise to me personally. Now about the negative consequences of a new type of coronavirus. Many reputable global agencies and major commercial banks are voicing the numbers that the US, eurozone, UK and so on will miss. It also indicates the level of decline in the world economy, which will be around 2% by the end of this year. Well, it's their job to submit their forecasts to the court. At least now, when the peak of the epidemic has not yet passed. I believe that only after the peak of COVID-19 goes down and is passed, it will be possible to make some more accurate forecasts about the losses incurred. Meanwhile, the predictions of some world leaders are not at all comforting. So, US President Donald Trump believes that 200,000 deaths from coronavirus in the US are a favorable scenario. Let me remind you that the coronavirus is currently affecting people in the United States at the fastest rate in the world, and the number of deaths is also increasing. The numbers are steadily increasing, so it doesn't make much sense to specify them. In Europe, the situation is a little better, if at all. Spain and Italy are still the hotbeds of COVID-19. At the same time, the number of infected people in France and Germany increases significantly, with unenviable constancy. But the Chinese, from whose territory the infection began to spread around the world, seem to have moved away and are now sending humanitarian aid to countries in need. China has started to open production facilities, only to whom to send finished products if the economy of its main trading partners is almost paralyzed. Everything is closed, everything is quarantined. Most of this review was devoted to nonfarm and COVID-19, so we will briefly consider the technical picture of the main currency pair today. Weekly
Despite the fact that the last five-day trading closed at 1.0800, that is, above the level of 1.0777, which was once strong support, it is quite difficult to draw any definite conclusions. It is safe to say that the US dollar does not take "neither hell nor the devil". The outbreak of the coronavirus epidemic in New York, Los Angeles, San Francisco, and the failed reports on the labor market for March did not have a negative impact on the US currency. If investors remain in the same mood and have such faith in the US dollar, it is highly likely that the "American" will continue to be the favorite in the forex currency market. H1
As you can see, at the end of the article, the euro/dollar is trading flat. Growth attempts can limit moving averages: 50 MA (blue), 89 EMA (black), and 200 EMA (orange). Conclusion and recommendations The main trading idea for the EUR/USD pair remains sales, the nearest of which can be tried from 1.0833(50 MA). Above, you can look at the opening of short positions after the price rises to 1.0872, 1.0912 and 1.0938. Have a good week! The material has been provided by InstaForex Company - www.instaforex.com |
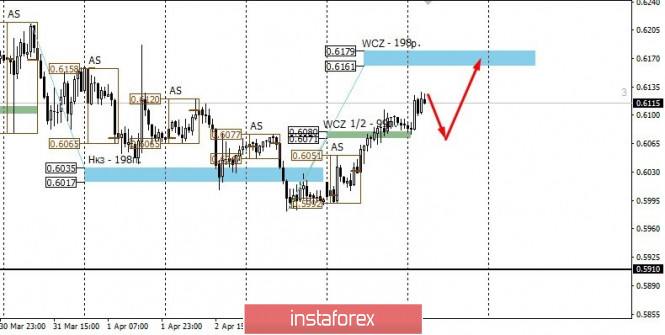
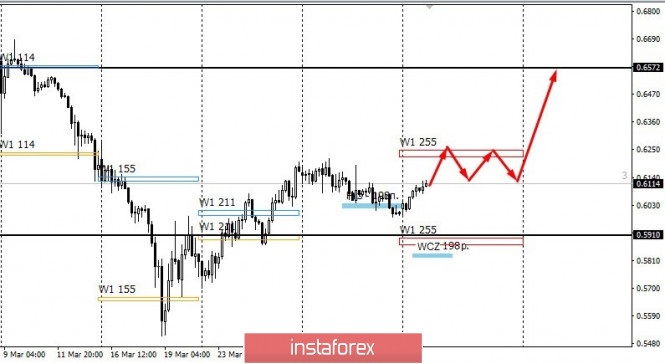
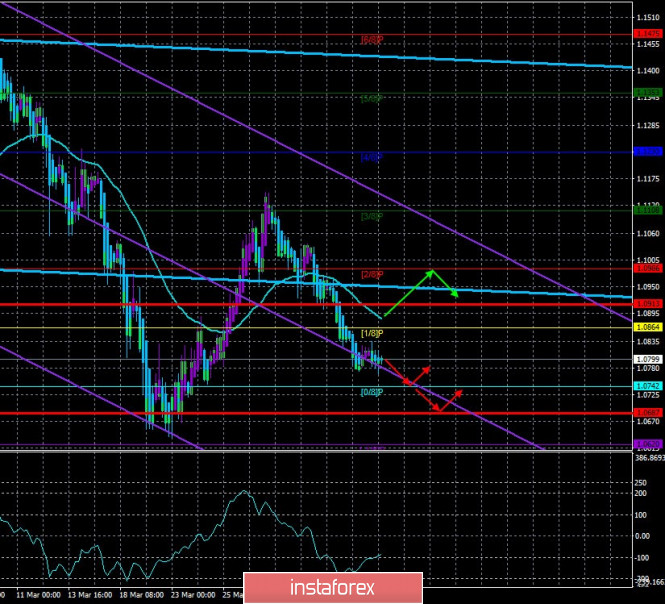
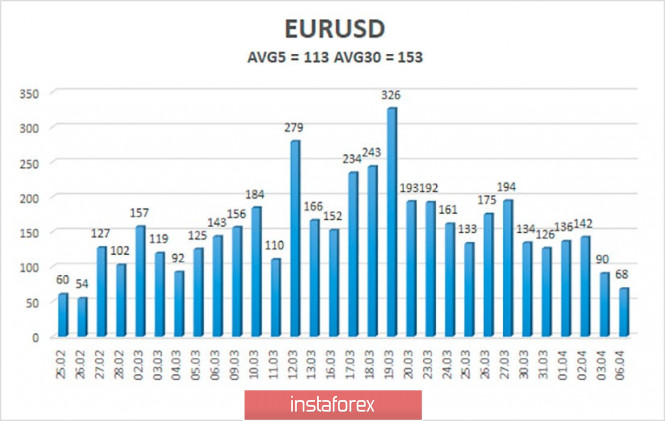
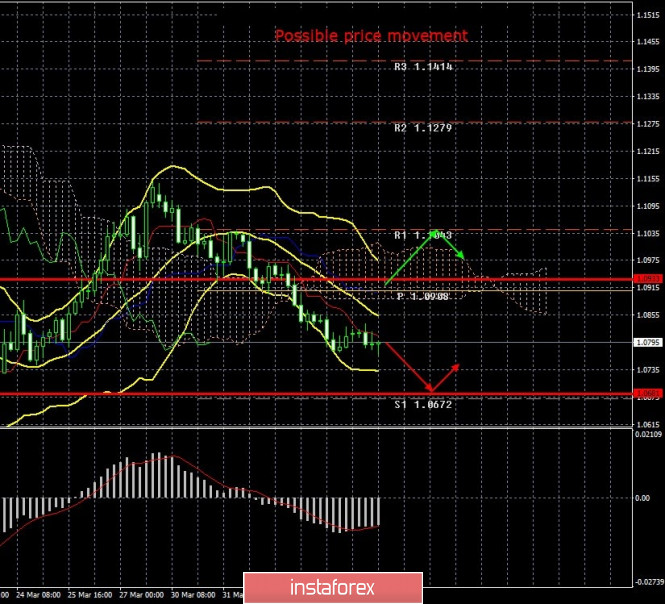
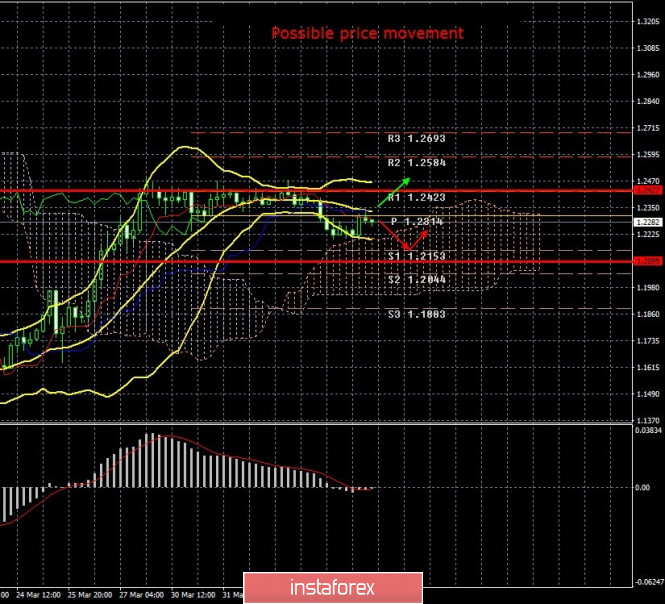
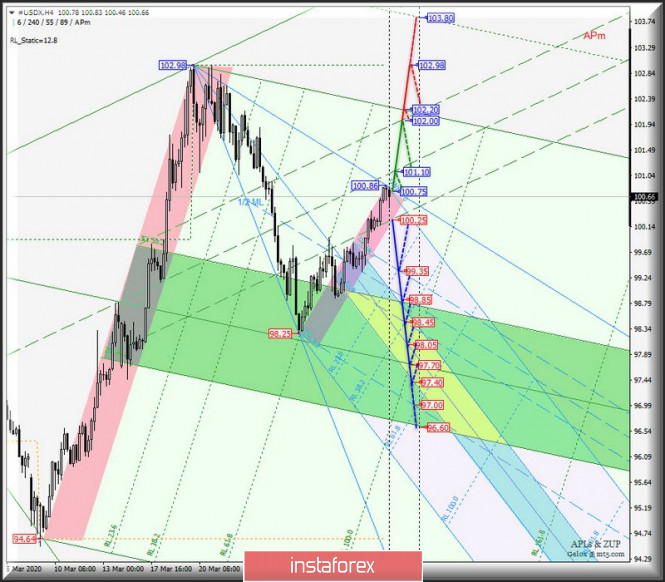
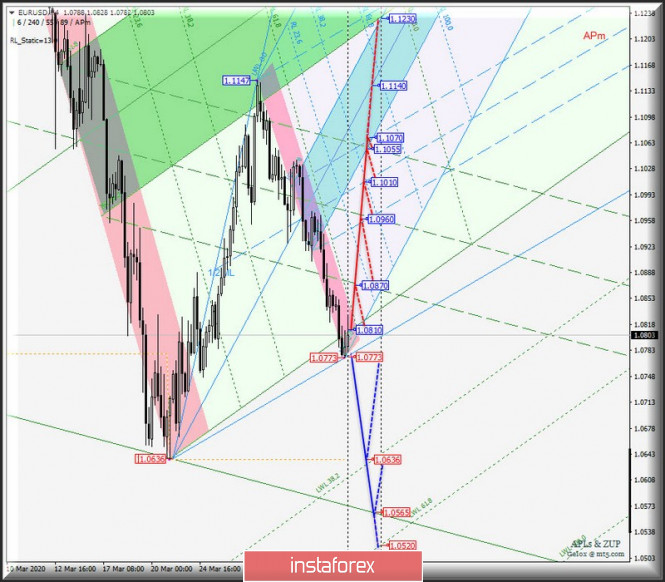
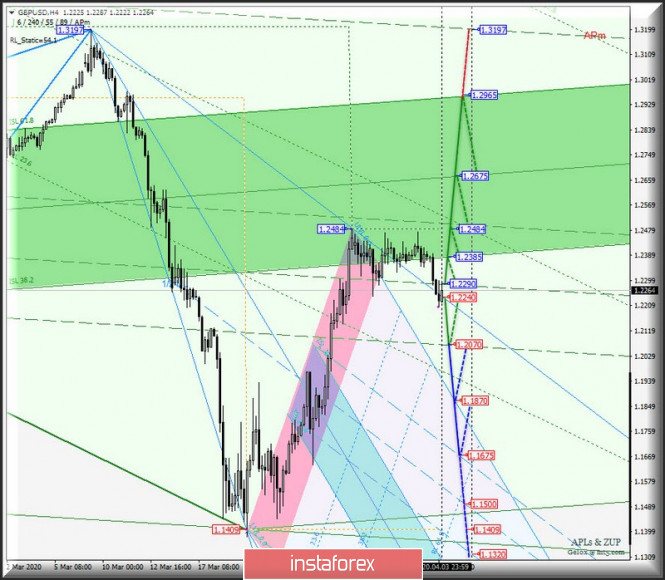
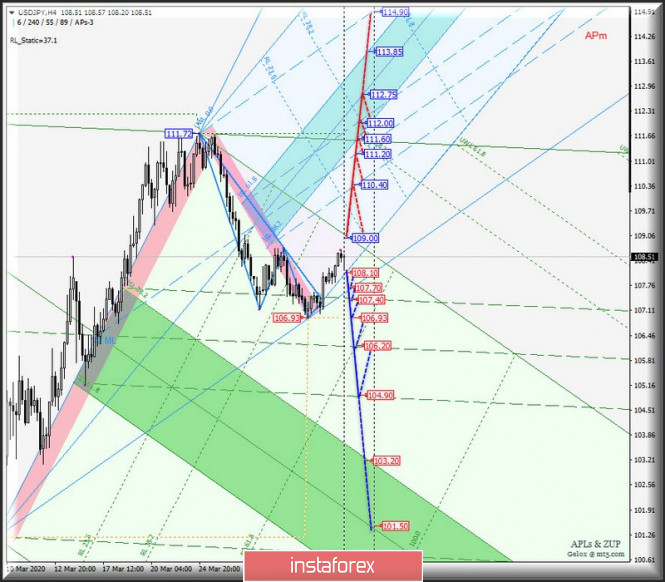


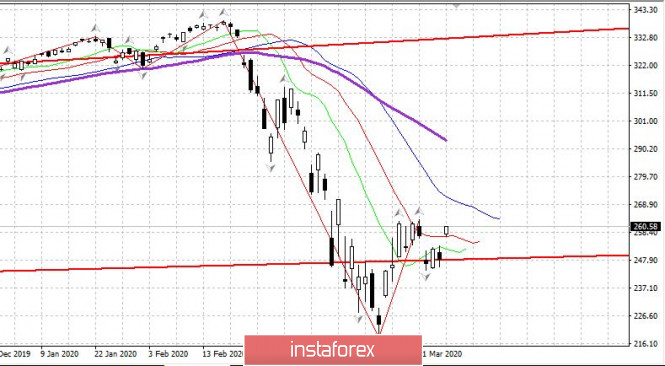
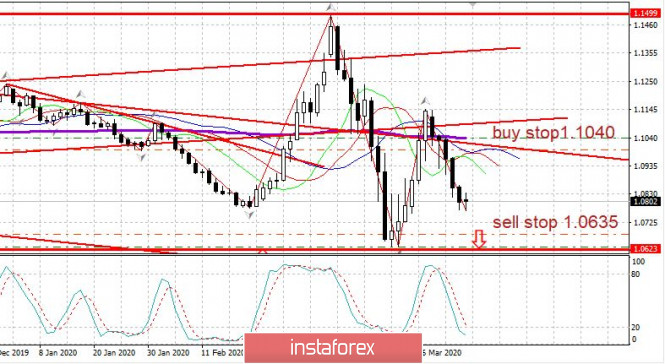
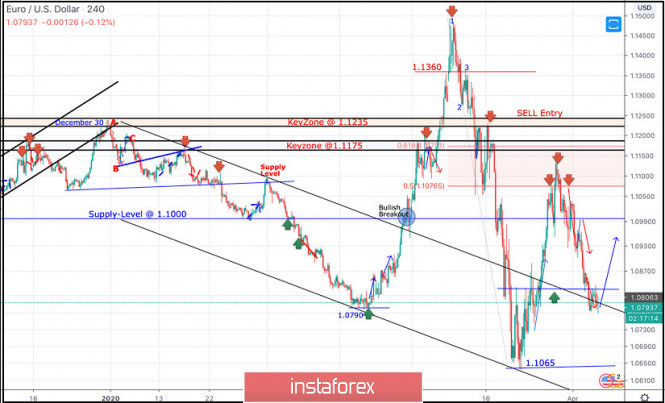
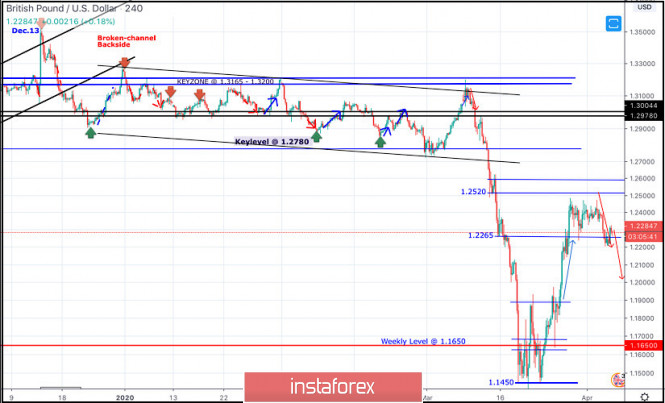
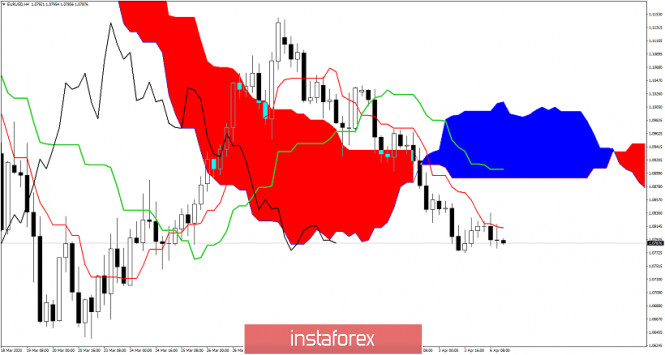
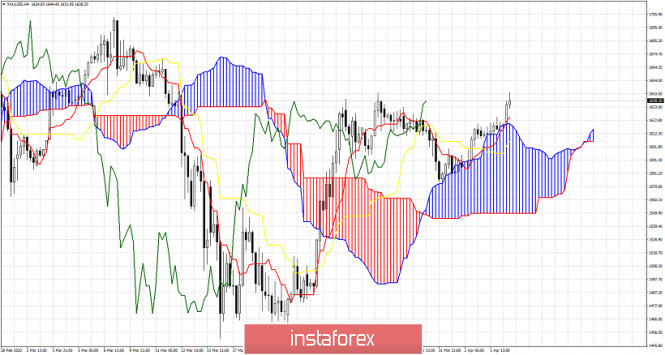
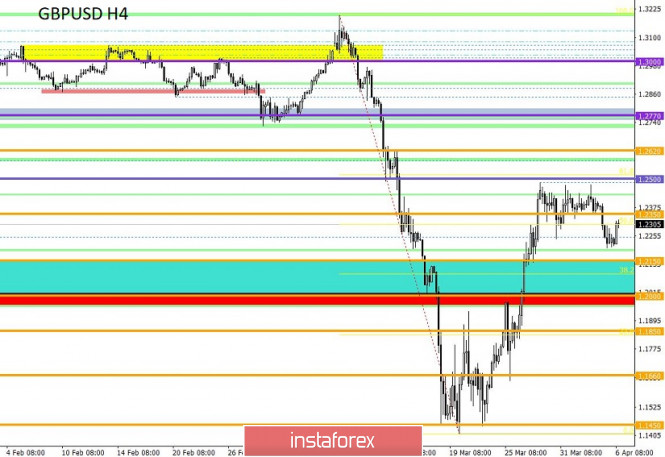
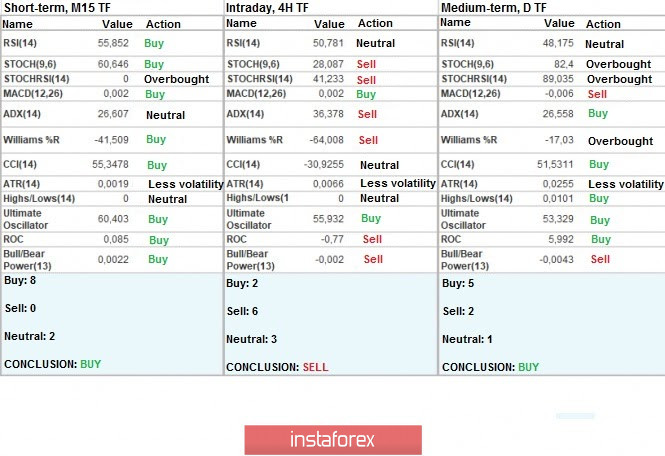
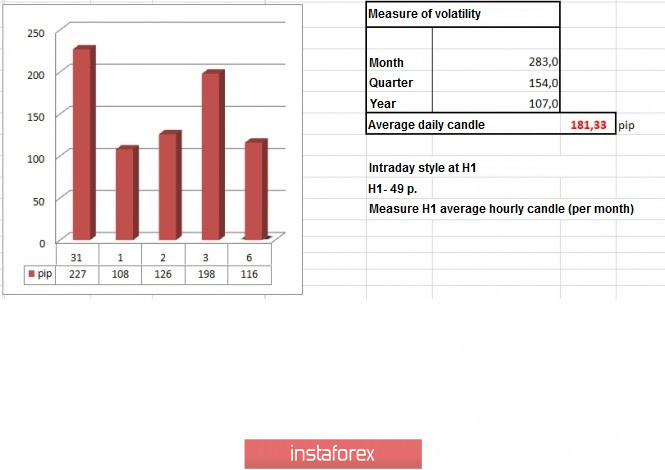
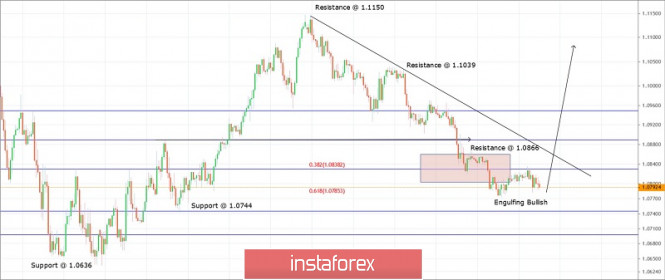
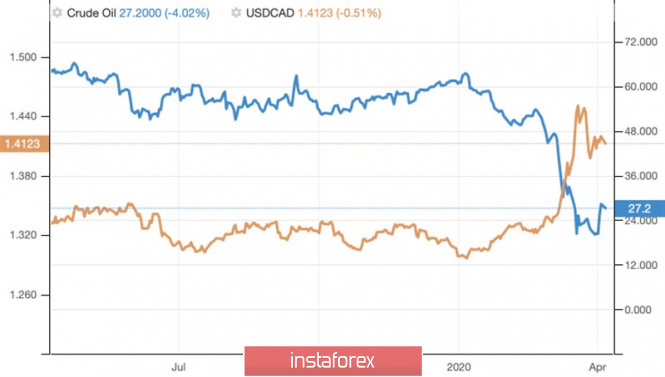
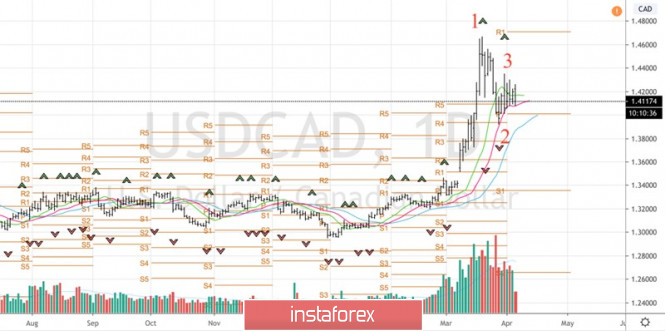


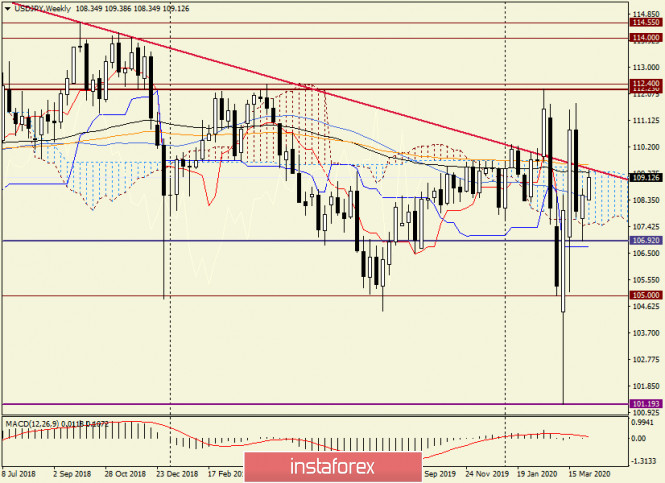
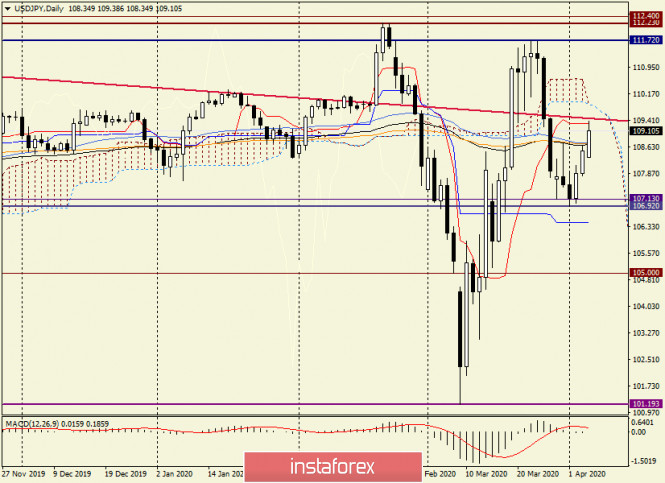
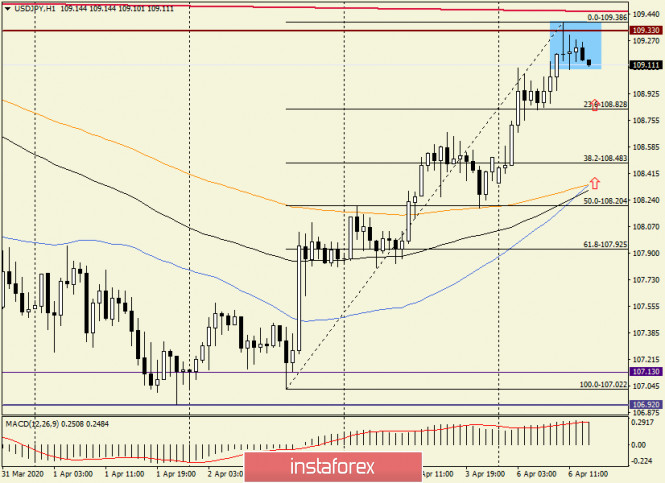
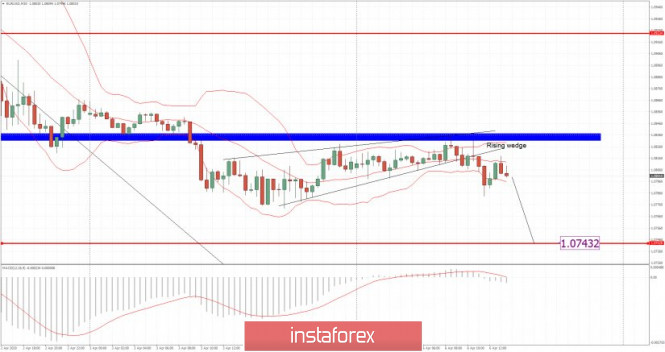
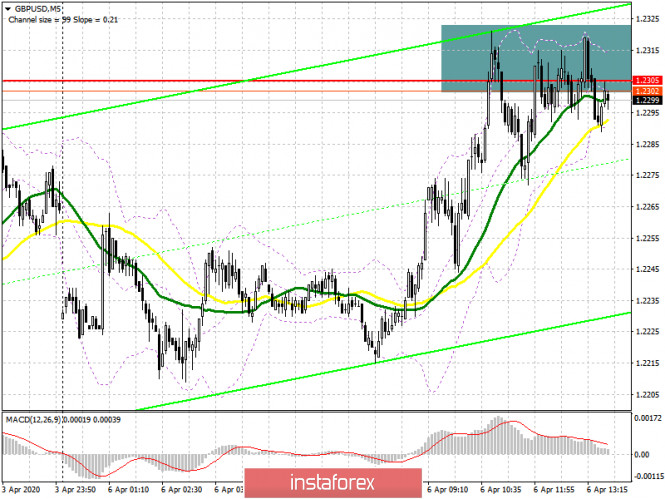
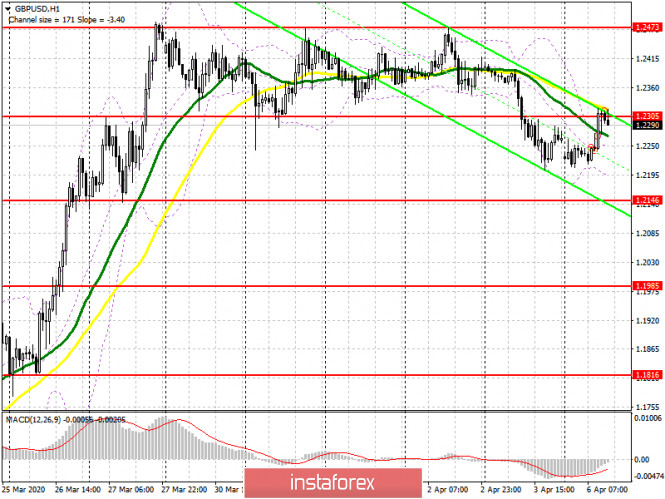
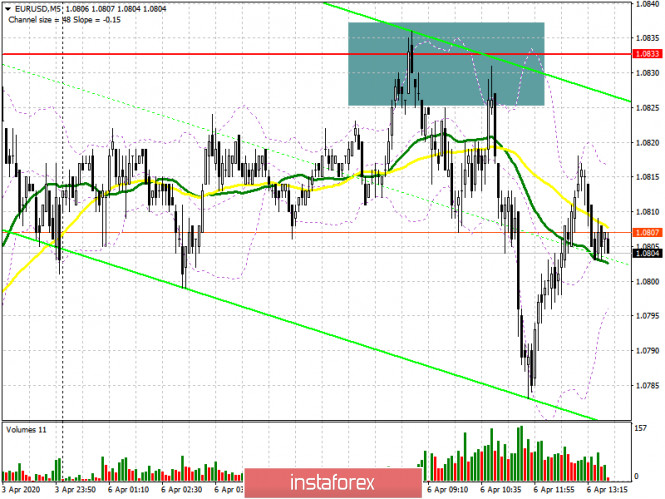
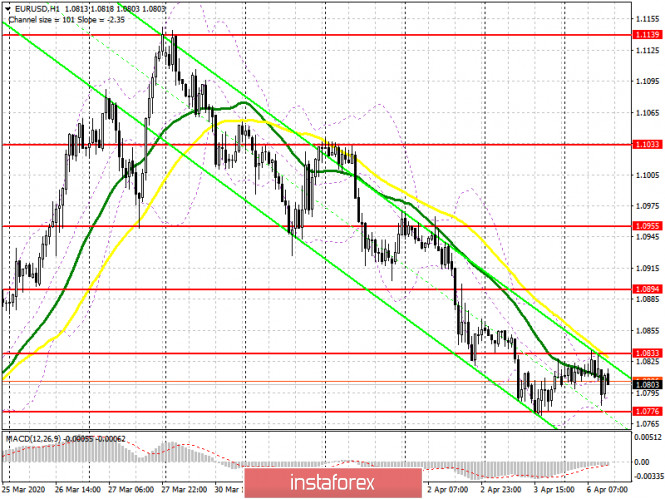

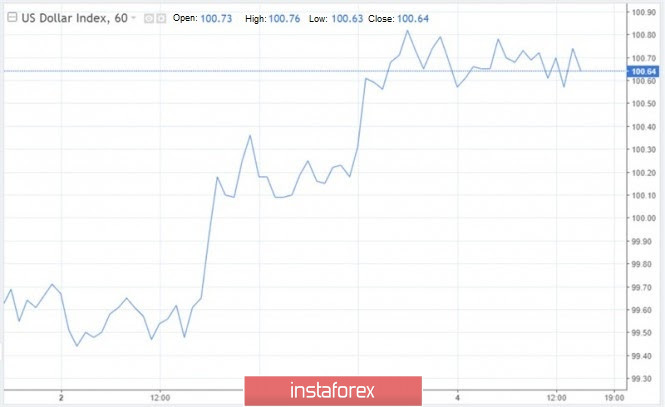
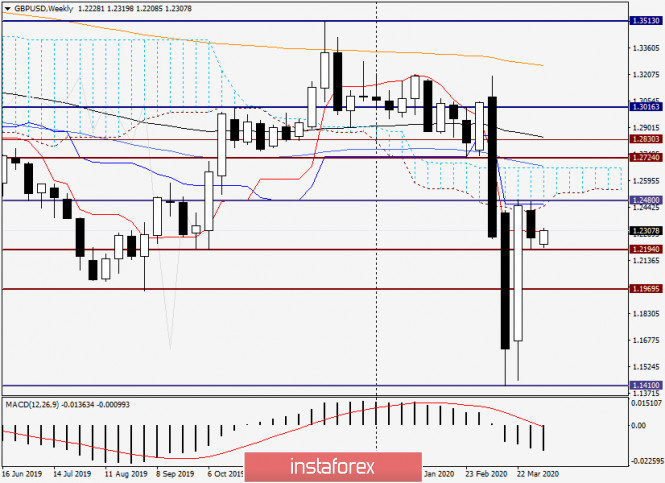
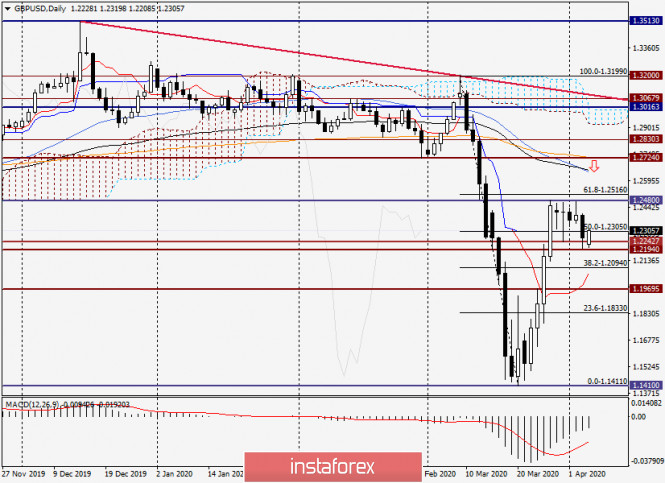
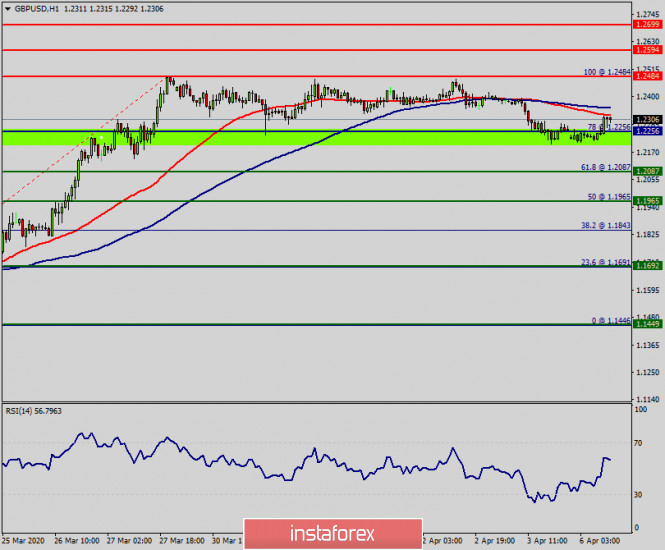
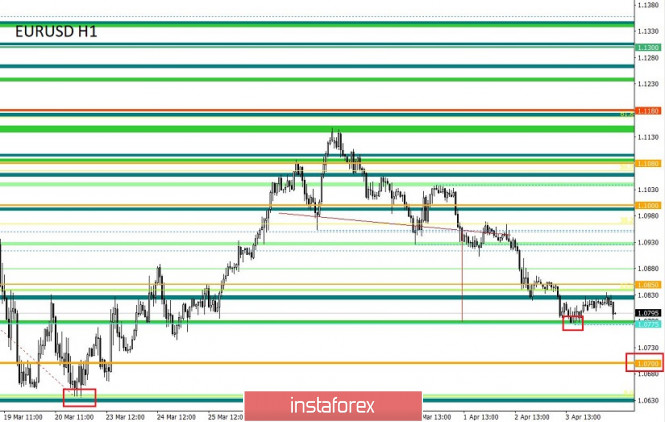
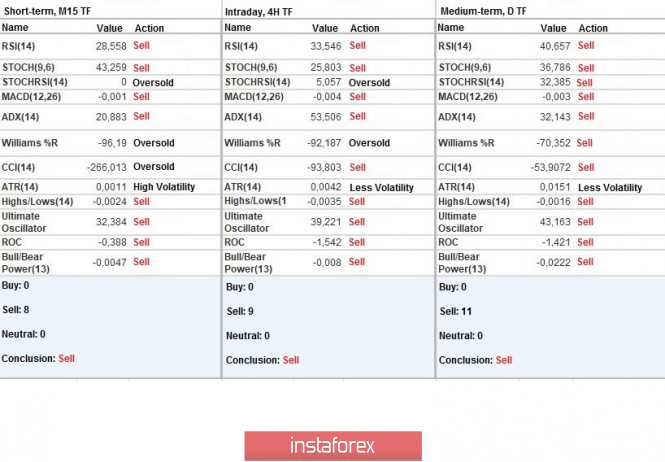
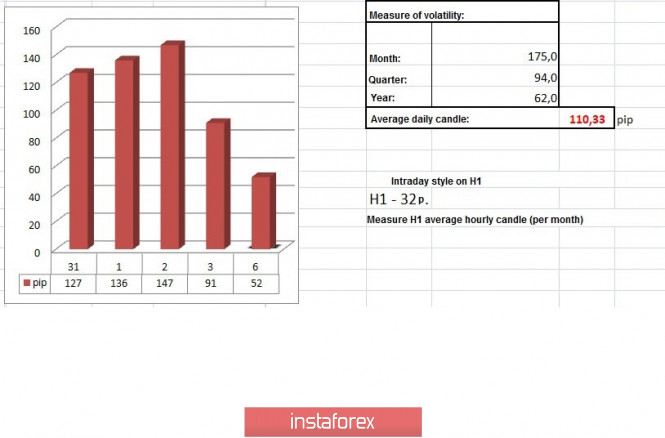
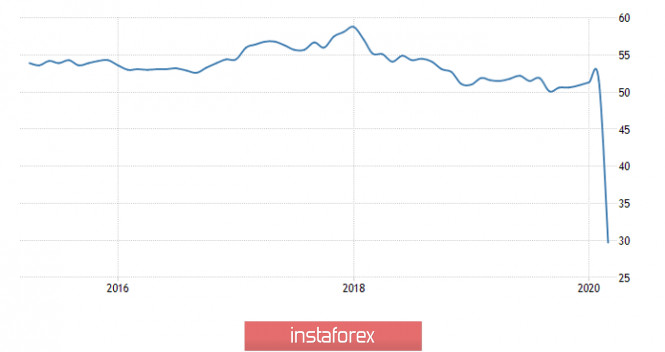
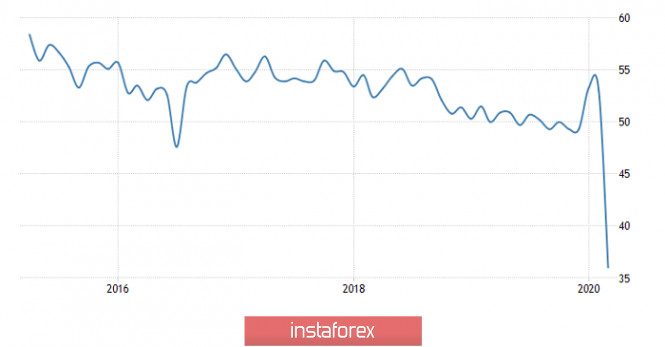
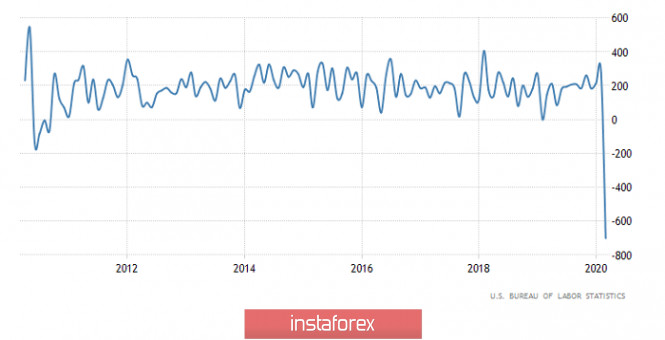
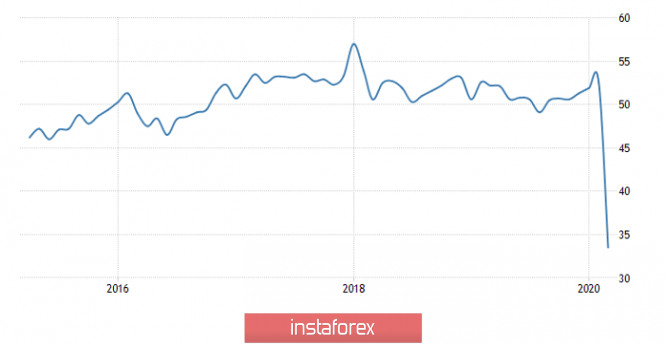
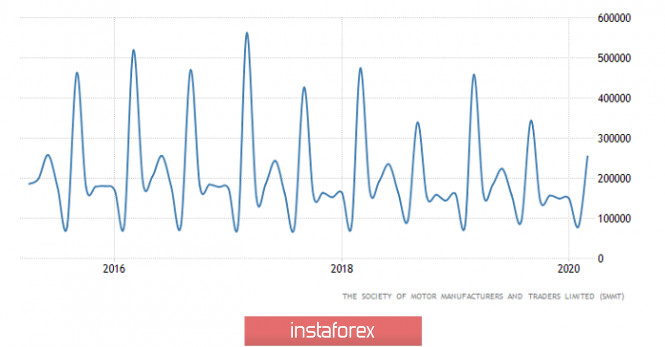
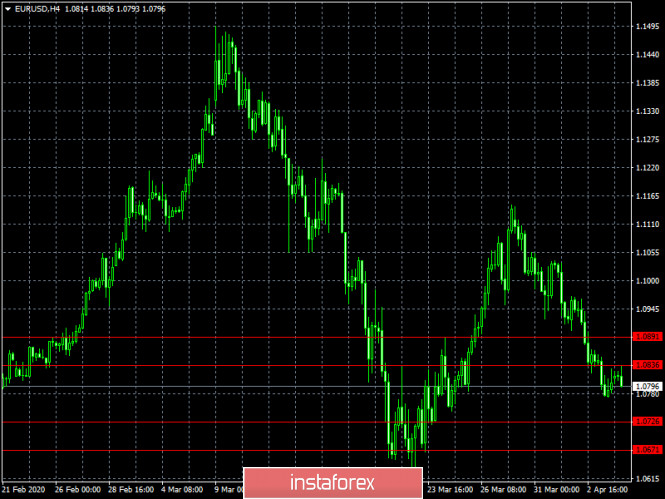
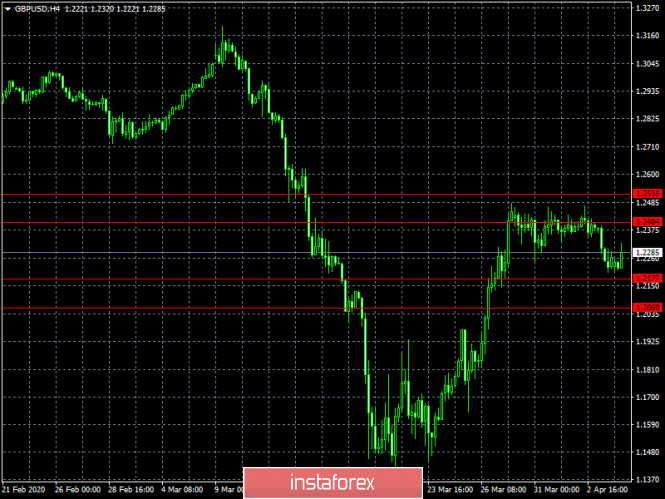
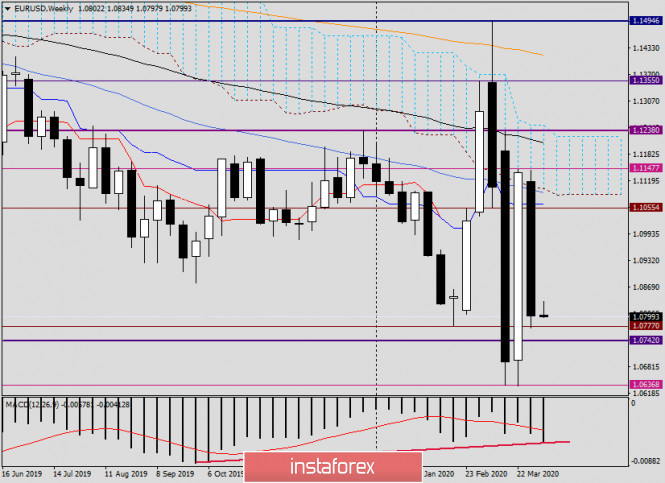
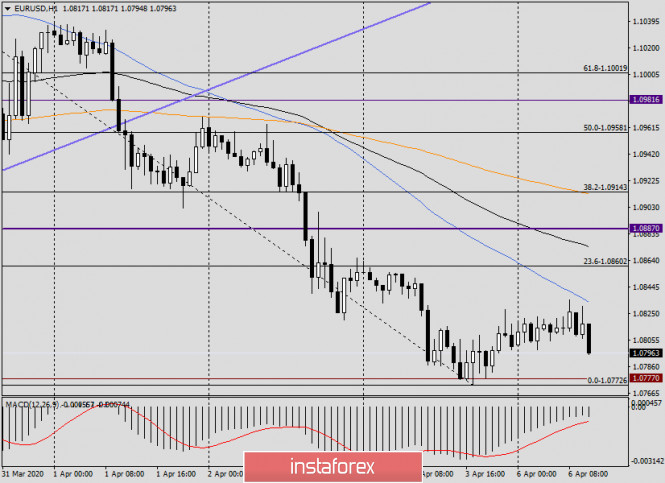
| You are subscribed to email updates from Forex analysis review. To stop receiving these emails, you may unsubscribe now. | Email delivery powered by Google |
| Google, 1600 Amphitheatre Parkway, Mountain View, CA 94043, United States | |
No comments:
Post a Comment