Forex analysis review |
- Forecast for EUR/USD on May 14, 2020
- Forecast for GBP/USD on May 14, 2020
- Forecast for AUD/USD on May 14, 2020
- Forecast for USD/JPY on May 14, 2020
- Hot forecast and intraday trading signals for the GBP/USD pair on May 14. COT report. Bears reached the important zone of
- Hot forecast and intraday trading signals for the EUR/USD pair on May 14. COT report. Traders are returning to 1.0780. Overcoming
- Overview of the GBP/USD pair. May 14. US senators are preparing a bill to allow Donald Trump to impose sanctions against
- Overview of the EUR/USD pair. May 14. Donald Trump is again pressing the Fed to lower rates. Elon Musk opens factories in
- EUR/USD and GBP/USD. Results of May 13. Jerome Powell expects a long period of economic recovery, but is not going to use
- EUR/USD. Assault on the ninth figure is postponed: Fed chief becomes the dollar's temporary ally
- May 13, 2020 : GBP/USD Intraday technical analysis and trade recommendations.
- May 13, 2020 : EUR/USD Intraday technical analysis and trade recommendations.
- Another rejection at key cloud resistance for EURUSD
- Ichimoku cloud indicator Daily analysis of Gold for May 13, 2020
- Evening review for May 13, 2020
- Bitcoin done with the third stage
- EURUSD and GBPUSD: The euro and pound increased after the fundamental statistics, encouraging optimism in traders. Divisions
- BTC analysis for 05.13.2020 - Bearish flag pattern in creation and potential for further downside contianution. Next downward
- Analysis on EUR / USD and GBP / USD for May 13, 2020
- Analysis for Gold 05.13.2020 - Breakout of intraday pivot high at $1.711, watch for potential bigger upside breakout towards
- GBP/USD: plan for the US session on May 13 (analysis of morning deals). Good GDP statistics help buyers of the pound to return
- EUR/USD: plan for the US session on May 13 (analysis of morning deals). Bulls pushed from the level of 1.0835 due to good
- EUR/USD analysis for 05.13.2020 - First upward target at the price of 1.0875 reached. I expect further upside and test of
- Gold is waiting for clarification from the Fed
- Market review. Trading ideas. Q&A
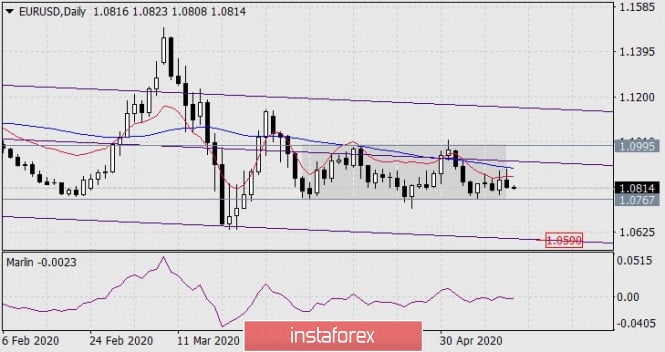
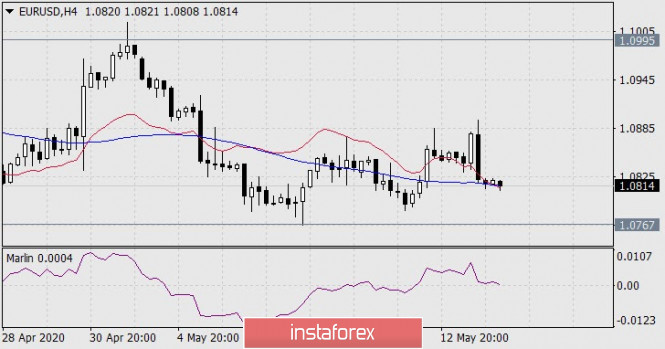
| Forecast for EUR/USD on May 14, 2020 Posted: 13 May 2020 08:04 PM PDT EUR/USD The euro traded in the range of 86 points on Wednesday, taking note of the resistance of the MACD line on the daily chart, it ended the day with a loss of 28 points. The Marlin oscillator did not leave the zone of negative values. We are waiting for the euro to support the price channel in the region of 1.0590. The price lies on the MACD line on the four-hour chart. Going below the line below 1.0810 will be the primary signal for an intraday price drop. In this case, the signal line of the Marlin oscillator will also be in the negative trend zone. The euro's fall to the signal level of 1.0767, which has been the lower boundary of the trading range since April, opens the way to a medium-term decline, below 1.0500. |
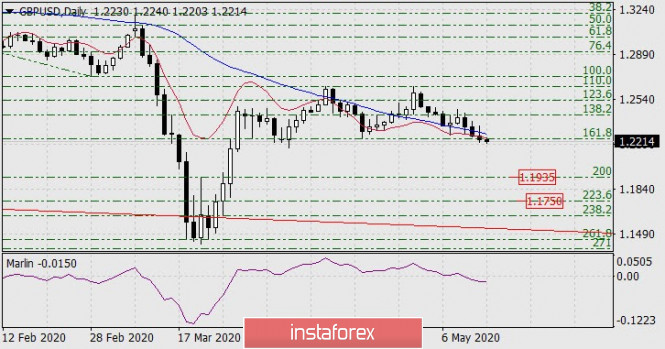
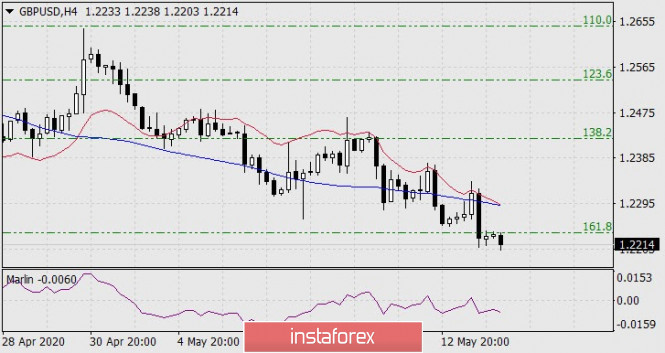
| Forecast for GBP/USD on May 14, 2020 Posted: 13 May 2020 07:58 PM PDT GBP/USD The pound was pinned under the MACD indicator line on the daily chart yesterday, and now the price tends to be even lower, under the Fibonacci level of 161.8%. The Marlin is falling in the zone of negative values, the nearest target of 1.1935 at the Fibonacci level of 200.0% is open. The price is under both indicator lines on the four-hour chart, the Marlin oscillator is in the negative zone. It is possible to open short positions in the market with a target above 1.1935 and stop loss above 1.2255. |
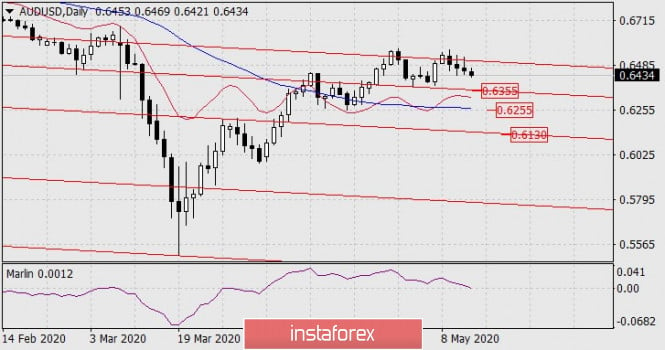
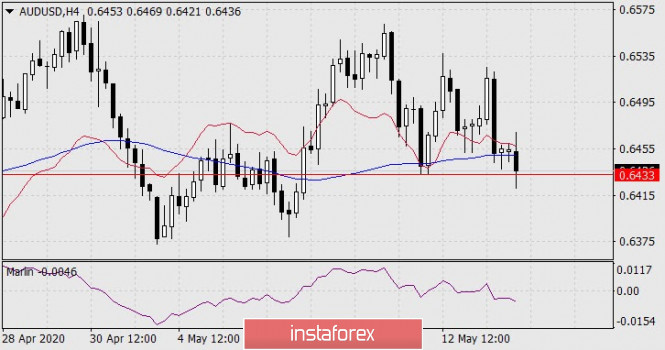
| Forecast for AUD/USD on May 14, 2020 Posted: 13 May 2020 07:53 PM PDT AUD/USD The Australian dollar repeated Tuesday's fluctuating scenario on Wednesday, and so it also ended the day with a moderate decline. The main conclusion of those days was the aussie's comprehension of the strength of the technical resistance of the price channel line on the daily chart. Now the price appears with more confident bearish targets: 0.6355, 0.6255 (support of the MACD line), 0.6130. This morning the price passed the signal level of 0.6433 (May 12 low) on the four-hour chart, which indicates the beginning of a decisive price decline. The Marlin oscillator is already in the negative zone.
|
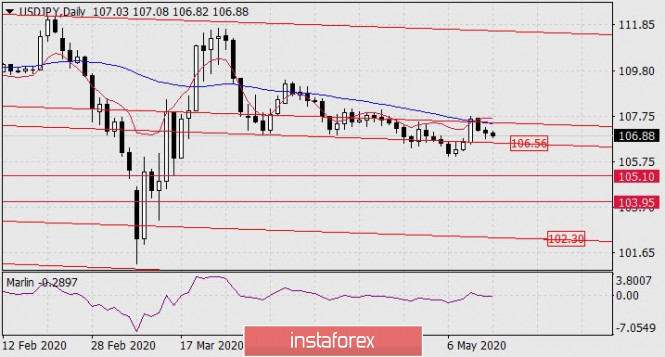
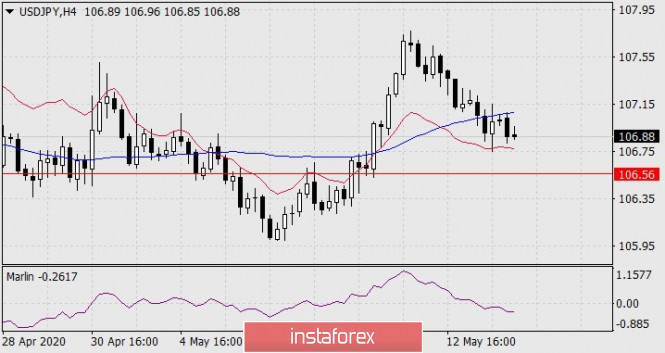
| Forecast for USD/JPY on May 14, 2020 Posted: 13 May 2020 07:53 PM PDT USD/JPY The US stock market has been falling for two days, increasing the talk of a second wave of market decline. The S&P 500 fell by 1.75% yesterday. The yen strengthened by 11 points. The price is in no hurry to leave the consolidation range between the two lines of the price channel on the daily chart. But when this happens, the price will overcome the support at 106.56, before it opens the road to 105.10 and further to 103.95. The price has consolidated below the MACD indicator line (moving blue) on the four-hour chart, the Marlin oscillator is in the decline zone. We are waiting for the development of a downward trend. |
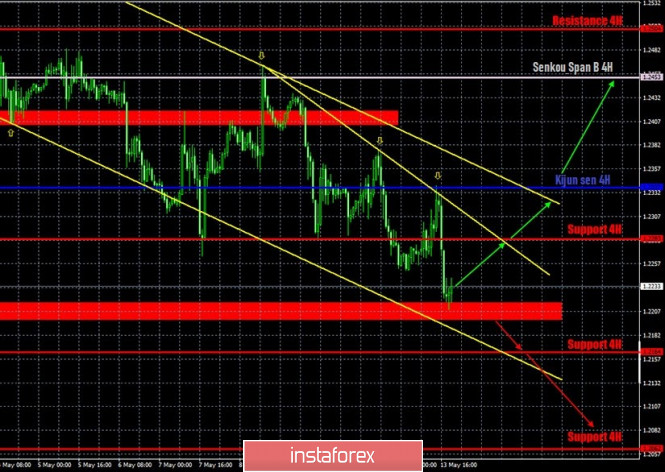
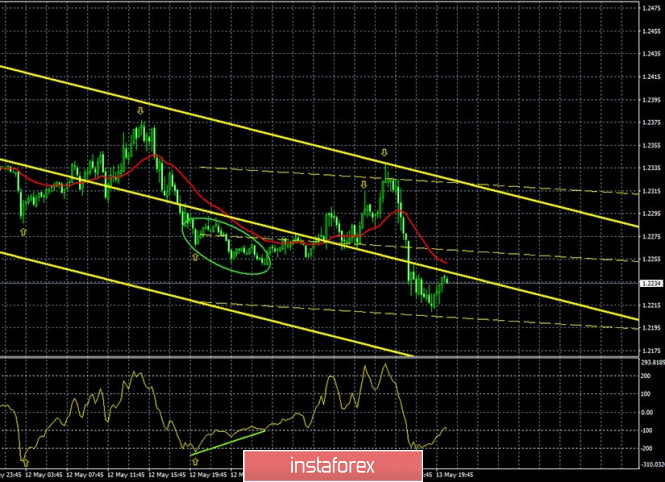
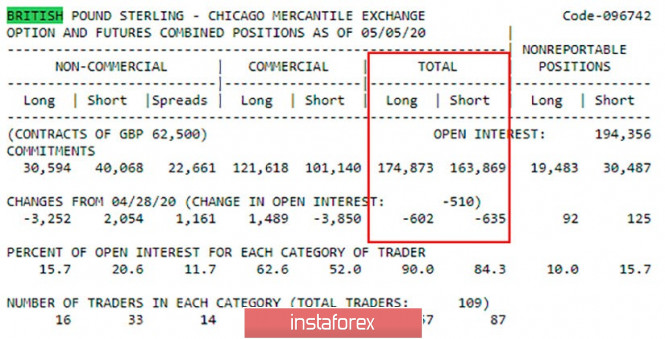
| Posted: 13 May 2020 05:31 PM PDT GBP/USD 1H There has been an openly downward trend for the GBP/USD pair in the last few days on the hourly chart. Bears attack very strongly, bulls have nothing to oppose. However, traders met a barrier in the form of a support area of 1.2198 - 1.2216 on their way down, which formed on April 3-7. Thus, a high probability of a new price rebound from this area. At the same time, overcoming this support area will support the bears in technical terms, and they will be able to continue their movement to two support levels of 1.2164 and 1.2062. A downward channel unambiguously indicates a downward trend, in addition to it there is a downward trend line with three pivots at once. Both of these patterns support sellers and are ready to signal the completion of a downward movement if quotes go above them. GBP/USD 15M. We have two linear regression channels on the 15-minute timeframe, which are also directed downwards and signal a downward trend. However, there is also a CCI indicator entering the "-200" area, which is a signal to turn up. Together with a possible rebound from the area of 1.2198 - 1.2216 on the hourly timeframe, we can get a strong signal to complete the downward trend. In fact, this signal has already been formed. It remains only to understand whether it is false. This is relatively easy to do. If the quotes update yesterday's low, then most likely the signal will be recognized as false, and the CCI indicator will form a divergence (it will increase with a further fall in the pair quotes). COT report. The latest COT report for May 5 shows that the total number of buy and sell transactions among large traders per week decreased by 1200. Thus, the general mood has not changed and remains "moderately upward" despite the fact that the pound has become cheaper in the last few days. However, the pound is getting cheaper in the short term, and COT reports published once a week are more relevant to the long term. No macroeconomic publications in the UK on Thursday are planned. Consequently, the macroeconomic background for the pound/dollar pair will be reduced only to a report on applications for unemployment benefits in the United States (primary and secondary). We believe that the next and an additional several million unemployed in the United States could create little pressure on the US dollar's position. However, we should not forget that traders are ignoring almost all the data that is at their disposal. Thus, technical factors will have a higher priority in determining the further dynamics of the pair. We have two main options for the development of the event on May 14: 1) The initiative for the pound/dollar pair remains in the hands of the bears, since the price is located inside the downward channel. However, a rebound from the 1.2198 - 1.2216 area is a strong signal to turn up, especially in conjunction with the CCI signal on the 15-minute timeframe. Thus, we recommend working out this signal with targets at the level of 1.2283, the Kijun-sen line (1.2337) and the Senkou Span B line (1.2453). A price rebound from any of these targets, or from a downward trend line, or from the upper border of the channel can serve as a signal for manual closing of buy-positions. Take Profit will be about 60 points in the first case, 110 points in the second and 230 points if the pair gets to the third goal. 2) Sellers will be able to continue moving down if they manage to overcome the strong support area 1.2198 - 1.2216. Then we recommend continuing sales or staying in them with goals 1.2164 and 1.2062. In these cases, Take Profit can range from 30 to 130 points. The material has been provided by InstaForex Company - www.instaforex.com |
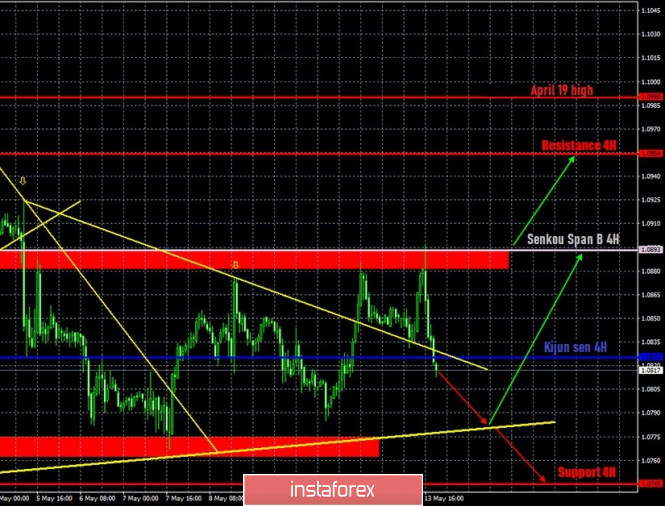
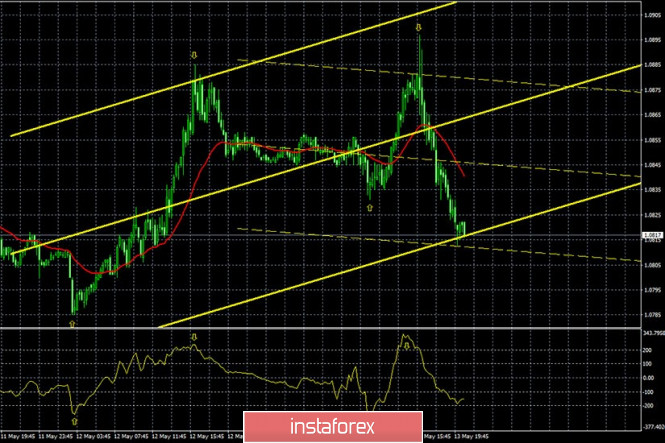
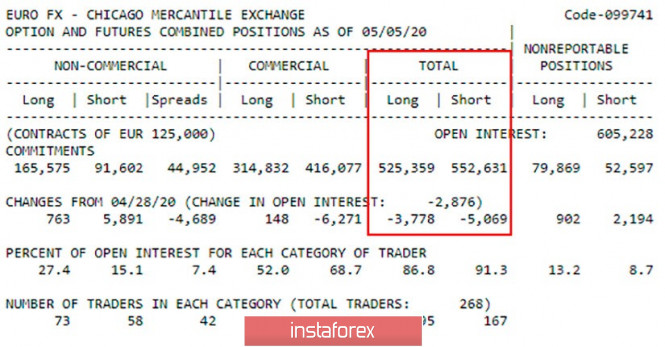
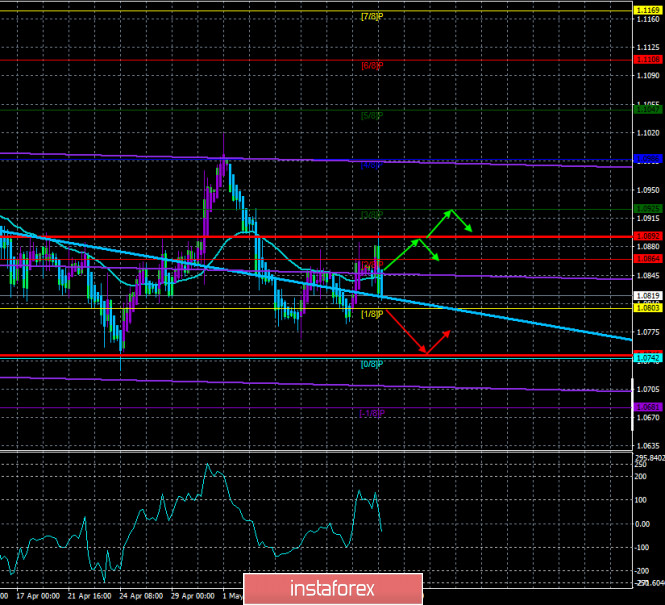
| Posted: 13 May 2020 05:30 PM PDT EUR/USD 1H Quotes of the euro/dollar pair rose yesterday to the Senkou Span B line and the resistance area of 1.0881 - 1.0893 on the hourly timeframe, from which they had already rebounded several times before. And this time the pair rebounded off this strong area and line. Thus, a new round of downward movement began in the direction of the long-term upward trend line, which lies in the area of 1.0780. If the pair once again rebounds off this trend line, then the upward movement will resume again, perhaps even back to the Senkou Span B line. Overcoming the trend line will enable the US currency to continue its downward movement. EUR/USD 15M. We see quotes sharply dropping on the 15-minute timeframe during the US trading session on May 13. Quotes are near the lower boundaries of two linear regression channels at once, so the probability of a turn up is high. Along with this, the CCI indicator came close to the critical area of "-200", the entry into which is a strong signal to turn up. Therefore, forming this signal will enable us to expect the euro's growth. The smallest linear regression channel is directed downward, so further reduction is also allowed. An ideal option would be for the CCI indicator to enter the "-200" area near the upward trend on the hourly timeframe. COT report. The latest COT report of May 5 showed a decrease in the number of transactions for purchase among large traders by 3,778 and a decrease in the number of transactions for sale by 5.069. Thus, the downward mood slightly weakened for the euro. But, since the total number of sales contracts exceeds the number of purchase contracts, the overall trend still remains downward. As we have repeatedly said in fundamental reviews, market participants are ignoring the entire macroeconomic background. Today, the United States is set to report on applications for unemployment benefits, which is almost guaranteed to usher in an additional few million unemployed Americans. Thus, even if the value of the indicator turns out to be slightly better than the forecast, we do not believe that it will be a reason for joy. This means that in the afternoon we can expect the US currency to fall (the growth of the EUR/USD pair). Again, a reversal is very likely near the upward trend on the 4-hour timeframe. You should also carefully monitor the CCI on the 15-minute timeframe. Good reasons are needed for the pair to fall further. There are not so many planned important events on Thursday; overcoming the trend line is likely to happen on Friday, when a report on GDP is published in the European Union. Based on the foregoing, we have two trading ideas for May 14: 1) On Thursday, we expect the pair's quotes to fall to the trend line and/or the area of 1.0763 - 1.0775. Those traders who are already in sell-offs after rebounding from the Senkou Span B line can support open sell positions with the target of 1.0780. It is recommended to open sell positions for the pair only in the event of overcoming the trend line. The potential to take profit is about 35 points in the first case, and about 30 points for the target of 1.0745. 2) The second option - bullish - implies a rebound from the long-term ascending trend line. We recommend that you open purchases of the euro in this case with the goal of Senkou Span B line - 1.0893, especially if the CCI indicator on the 15-minute chart goes into the "-200" area beforehand. The potential to take profit in the execution of this scenario is at least 100 points. The material has been provided by InstaForex Company - www.instaforex.com |
| Posted: 13 May 2020 05:26 PM PDT 4-hour timeframe
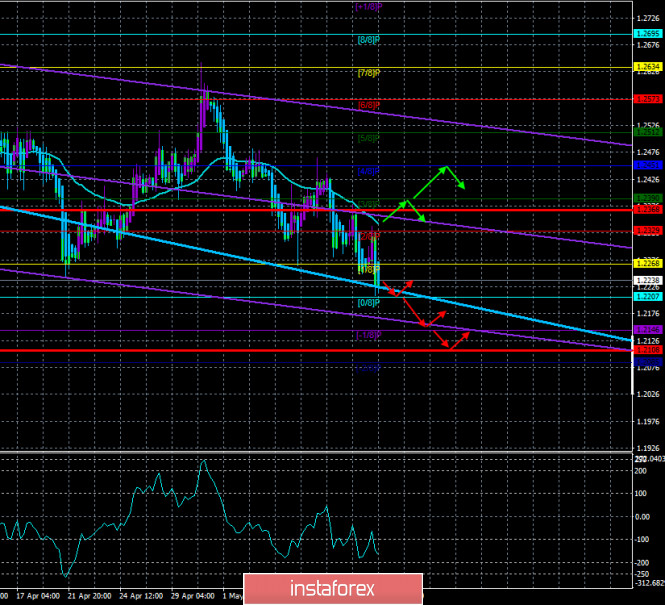
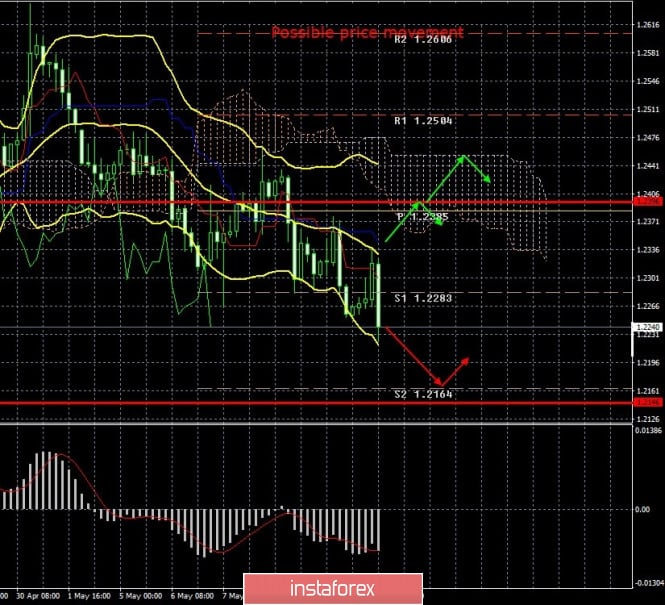
Technical details: Higher linear regression channel: direction - downward. Lower linear regression channel: direction - downward. Moving average (20; smoothed) - downward. CCI: -173.6052 The British pound starts the fourth trading day of the week in a downward movement inside the same 400-point side channel, continuing to approach its lower border. Thus, in the near future, the pound/dollar pair may be followed by an upward reversal with further movement to the area of the Murray level of "7/8"-1.2634. At the same time, the pair can overcome the lower border of the channel and thus start forming a new downward trend. We note that the lower border of the channel has an indistinct price value and can run even at the level of 1.2165 – the minimum from April 7. The CCI indicator is getting closer to the "-200" area, entering which can serve as a strong signal to turn up. In the article on the euro/dollar, we talked about two epics that are starting now in the United States. The first and most important of them is a new confrontation between China and the United States, which can turn into a new trade war and the introduction of mutual sanctions and restrictions. Earlier, we said that Donald Trump believes China is to blame for the spread of the COVID-2019 virus across the planet, and also accuses Beijing of misinformation and belatedly releasing all the details of the virus. Thus, according to the leader of the United States, Beijing must be held accountable. As a punishment, Washington considers various measures, ranging from the introduction of new trade duties, ending with international courts, and the demand for compensation. According to the latest information, the US leader's threats were not ignored by Congress and the Senate and were not unfounded. The US government supports the initiative of Trump "to recover to the fullest extent" with China. US Senator Lindsey Graham introduced a bill that allows for sanctions against China for the spread of "coronavirus". The draft law "on responsibility for COVID-19" proposes to impose sanctions if Beijing does not provide a full report on what happened in Wuhan. "I am sure that without the deception of the Chinese Communist party, the virus would not have existed in the United States. China refuses to allow the international community to investigate the laboratory in Wuhan. They prohibit an investigation into how the outbreak started. I am sure that China will never cooperate if it is not forced to," Senator Graham said. It is reported that 8 more Republican senators supported the bill. Senator Graham believes that if China does not provide all the necessary information, the United States can freeze Chinese assets, ban Chinese officials from entering the United States, revoke visas, prohibit financial organizations from issuing loans to any Chinese individuals and legal entities, and prohibit Chinese companies from placing their securities on the American stock market. At the same time, it is also reported that representatives of the US Democratic party do not support the introduction of new sanctions and duties against China. According to many political analysts, such a step on the part of Trump's followers from the ranks of the Republican party may help their leader to "whitewash" himself a little. Many Americans now think that the government failed to fight the "coronavirus" and blame it on Trump. In addition, the absolute majority of US residents do not support the early completion of "lockdown", which can lead to new outbreaks of the pandemic throughout the country. Thus, the US leader seems to continue to push the idea of "China's guilt" into the American masses. In fact, he has no other choice. Americans should fully believe that China is responsible for 80,000 deaths and more than 1 million illnesses. The Democratic party, which has always been loyal to China, may also suffer from such actions by Trump. The US President can use this loyalty to denigrate the candidacy of Joe Biden, who has always been very friendly to China. However, there is one "but". Any sanctions that Washington decides to impose will most likely be duplicated by China itself against the United States. You can't punish China unilaterally without hurting yourself. Thus, the introduction of any sanctions by Washington potentially threatens a new round of trade and not only conflict between Beijing and Washington. If the sanctions are not economic in nature, then this is still half the trouble. But if new duties are imposed and old agreements are torn up, this will cause an additional blow to the global economy. However, most experts are inclined to believe that Donald Trump will not start a new trade and economic war with China in the near future. A new war means new losses, and the American economy is already not in the best condition. A new decline, especially caused by the trade and economic war, will definitely be associated with the name of Donald Trump and his political ratings will fall even more. On the fourth trading day of the week, a small number of macroeconomic publications are planned in America, and in the European Union and the UK, they will not be at all. In the United States, the next report on applications for unemployment benefits for the week of May 8 will be released. According to forecasts, another 2.5 million Americans will apply for benefits during this week, and the number of secondary applications for benefits will reach 25.1 million as of May 1. Thus, we do not expect positive news tomorrow from overseas. So far, the British pound continues to fall in price against the US currency. However, firstly, most of the macroeconomic information continues to be ignored by market participants, and secondly, the pound/dollar pair remains within a wide side channel and has not yet left it. Therefore, technical factors remain the most important when determining the direction of trading. Meanwhile, the UK came out on top in the European Union in the number of cases of the COVID virus-2019. The total number is 231,000. The total number of deaths from the pandemic is 33,263 and this is also the worst figure in Europe. Despite this, the quarantine in the UK is easing and in this country is very similar to America, where there are also not too many signs of slowing down the epidemic, but the authorities are trying to complete the "lockdown" as soon as possible. In fact, why be surprised if these two countries are ruled by friends Boris Johnson and Donald Trump, who regularly flatter each other and want to be friends with each other?
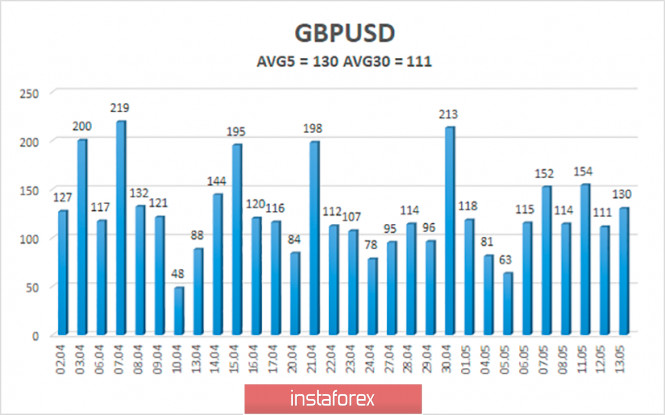
The average volatility of the GBP/USD pair has increased slightly in recent days and is currently 130 points. For the pound, this is still not too much, and there are no signs of a serious increase in volatility yet. On Thursday, May 14, we expect movement within the channel, limited by the levels of 1.2108 and 1.2368. A reversal of the Heiken Ashi indicator upward will indicate a new round of upward movement. Nearest support levels: S1 – 1.2207 S2 – 1.2146 S3 – 1.2085 Nearest resistance levels: R1 – 1.2268 R2 – 1.2329 R3 – 1.2390 Trading recommendations: The GBP/USD pair continues its downward movement on the 4-hour timeframe. Thus, formally, sell orders with targets of 1.2146 and 1.2108 remain relevant now, but the downward momentum may dry up around the mark of 1.2165. On the approach to the lower border of the side channel, we believe it is not advisable to sell the pair. It is recommended to buy the pound/dollar not before fixing the price back above the moving average with the first goals of 1.2390 and 1.2451. The material has been provided by InstaForex Company - www.instaforex.com |
| Posted: 13 May 2020 05:26 PM PDT 4-hour timeframe
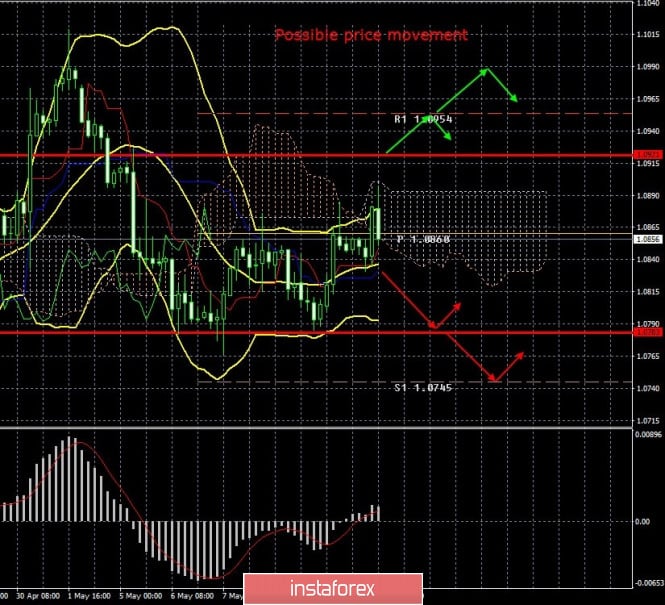
Technical details: Higher linear regression channel: direction - downward. Lower linear regression channel: direction - sideways. Moving average (20; smoothed) - sideways. CSI: -39.1184 On Thursday, May 14, the EUR/USD currency pair starts with the resumption of a downward movement within the side channel. However, the pair's movements in recent days no longer resemble movements between the borders of the channel with a width of 250 points, but "swings" in the range of 120 points. Thus, the pair is getting closer to an outright flat. Yesterday, for example, the fall in quotes was triggered by the speech of Jerome Powell, who assured the markets that he is not going to lower the Fed's key rate even more, as Donald Trump wants. Let's see what happens today. In any case, traders should take into account the possible flat channel of 1.0777-1.0897 in the medium term. Over the past few years, we have been writing regularly about a British epic called "Brexit". Now two similar epics are brewing in the United States. The first is a new trade war with China, a conflict on the basis of the "coronavirus" epidemic, the second is the exit from the so-called "lockdown". The situation in the second epic is as follows. Donald Trump is in favor of restarting the economy as quickly as possible. However, it cannot "open" each individual state, it does not have such powers. The powers are vested in state governors, some of whom are Democrats and some of whom are Republicans. It is obvious that the Republicans are ready to go to a meeting with Trump or are simply afraid of his anger since they are members of the same political party. But the Democrats are not afraid to openly go against Trump, but in the case of the completion of the "lockdown", no Governor can be accused of deliberately not wanting to open his state to "annoy" the President. Recall that the country's chief epidemiologist Anthony Fauci, who in recent weeks regularly denied the statements of the US President, believes that it is not necessary to rush to complete or weaken the quarantine. Many representatives of the healthcare sector are in solidarity with him, who, unlike Trump and all his followers, hospitalize people with COVID-2019 every day and regularly see deaths from this disease, for which there is no vaccine. And although the percentage of deaths from "coronavirus" is not high, nevertheless, 83,000 deaths have already been recorded in the United States, the most in the world. Anthony Fauci believes that "the epidemic in the US is not under control". In addition, the chief epidemiologist of the United States said that children do not have any immunity to the disease, and a new wave of diseases is possible in the fall. Fauci also said that the premature opening of the economy with jumping through entire phases of a gradual exit from quarantine may cause a new danger that can not be controlled. "The main message I want to convey is the danger of premature opening of the country. If we jump over the key points of the recommendations, we run the risk of multiple outbreaks across the country. This will not only lead to new diseases and deaths but also set us back on the path to restoring the usual rhythm of life," Fauci concluded. However, President Trump does not seem to listen at all to representatives of the health care sector and is obsessed with the idea of restoring the economy to work as quickly as possible. In this, almost the only way to win the election in November 2020 is to revive the economy as quickly as possible. To achieve this goal, Trump is ready to quarrel with anyone, including state governors. For example, most recently, billionaire Elon Musk voluntarily resumed work at Tesla factories in Alameda County, California, despite a ban by federal authorities. Before breaking the law, Elon Musk had a conversation with Donald Trump, during which the American President, of course, approved of such a decision by Musk. However, in this case, the approval of Trump does not mean anything, because, as we have already said, it is not Trump who decides when to end the quarantine in a particular state. As a result, all this turns into a conflict between Elon Musk and the authorities of the city of Alameda, which can smoothly turn into a trial. Trump himself publicly supported Elon Musk, writing on Twitter: "California should allow Tesla and Elon Musk to open factories immediately. This can be done quickly and safely!" At the same time, as the American economy continues to collapse, Donald Trump wants to use all available means to maintain it. And one of these ways is to put new pressure on the Fed and Jerome Powell. If earlier Trump wanted rates to be close or equal to zero, now he believes that Powell should lower rates to the negative zone. "While other countries benefit from negative interest rates, the US should also accept this "gift"," Trump wrote on Twitter. Well, so far we only see that Trump is ready to sacrifice tens of thousands of American citizens, ready even to sacrifice the economy itself. Because he doesn't have much time until November. Donald Trump is going all in. Either in the coming months it will be possible to restart the economy, despite the "coronavirus" or even if the economy finally collapses due to a new outbreak of the epidemic, it will not be worse for Trump. Joe Biden can only wait. Wait and watch for Trump's desperate attempts to increase his political ratings. Almost every action of the US leader can now be absolutely calm and reasonably criticized. For example, Trump's desire to hold campaign rallies in the United States during the quarantine. What all this means for the US dollar. At the moment, only that in the future, the markets may begin to get rid of the US currency due to the short-sightedness of the actions and decisions of the American leader. However, the dollar exchange rate does not depend only on Ameria. In Europe, we will remind you that a stronger economic downturn is expected. Moreover, in Europe, a conflict is brewing between the European authorities and Germany, which may end with the courts and the exit of the rebel country from the Alliance. In addition, Italy, Spain and other countries most affected by the pandemic require urgent assistance from the EU authorities, which, in fact, is blocked by Germany, which is desperate not to pay for other people's mistakes. Many experts believe that as a result of the "coronavirus" crisis, the European Union may collapse.
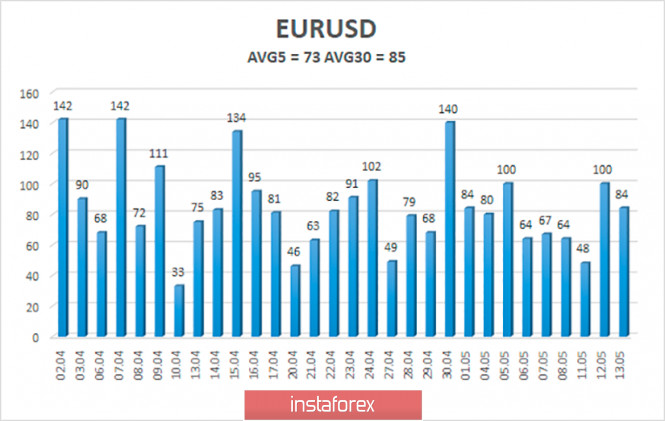
The average volatility of the euro/dollar currency pair as of May 14 is 75 points. Thus, the indicator remains stable, and its value is now characterized as "average". Today, we expect quotes to move between the levels of 1.0746 and 1.0892. The upward turn of the Heiken Ashi indicator may signal a new round of upward movement within the channel of 1.0750-1.1000 but within the channel of 1.0777-1.0897. Nearest support levels: S1 – 1.0803 S2 – 1.0742 S3 – 1.0681 Nearest resistance levels: R1 – 1.0864 R2 – 1.0925 R3 – 1.0986 Trading recommendations: The EUR/USD pair is fixed back below the moving average, so at the moment, formally, short positions are again relevant. However, we are increasingly inclined to the fact that the pair is now in the flat, as indicated by the moving, directed sideways for several days. Thus, it is best to start trading down if the lower limits of both side channels (1.0777 and 1.0750) are overcome. It is also recommended to consider buying the euro/dollar pair after the quotes exit from the side channel, that is, above 1.0897 with the goal of 1.1000. The material has been provided by InstaForex Company - www.instaforex.com |
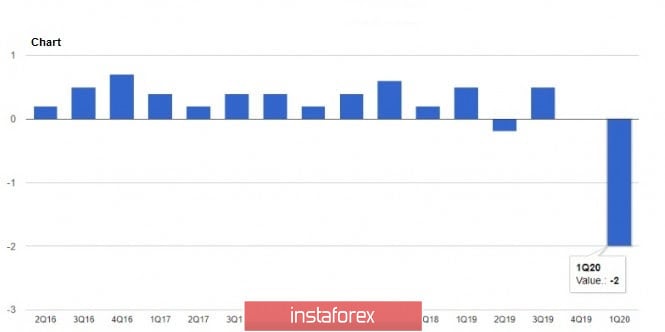
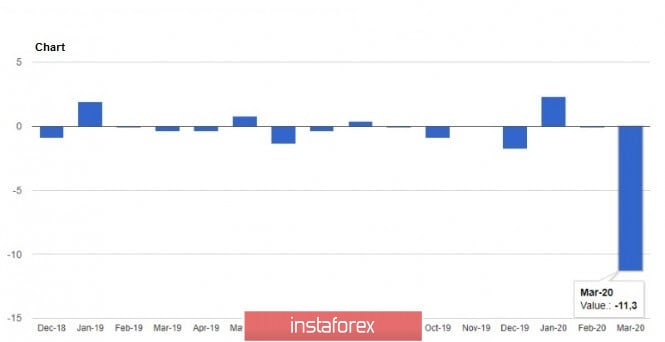
| Posted: 13 May 2020 10:32 AM PDT 4-hour timeframe Average volatility over the past five days: 69p (average). The EUR/USD pair continued a slurred upward movement on Wednesday, May 13. "Indistinct" - due to frequent corrections and pullbacks, which, in principle, is due to the side channel, inside which the euro/dollar continues to trade. We have repeatedly said that the pair is now in the channel, limited by the levels of 1.0750 and 1.1000. Thus, after an unsuccessful attempt to leave through the lower line of the channel, it is logical to move to its upper line. However, today the pair found an insurmountable barrier in the form of the Senkou Span B line, from which it rebounded, and a downward movement began at the US trading session. Today's volatility does not exceed 60 points, which is a normal value for the pair. A large number of macroeconomic statistics have not been published to date. Only a report on industrial production was released in the European Union, which showed a decrease of 12.9% in March in annual terms (worse than forecasts), and by 11.3% in monthly terms (better than forecasts). However, a decrease of 11% cannot be interpreted as positive in itself. Nevertheless, the pair's growth was observed at the European trading session, which indicates the appreciation of the euro. Based on this, we once again conclude that market participants continue to ignore all macroeconomic data. In the afternoon, Federal Reserve Chairman Jerome Powell also gave a rather important speech. Recall that earlier, US President Donald Trump called on the Fed to continue to reduce rates and bring them to negative values, as in some other countries. Thus, the markets were immediately worried about a possible new easing of US monetary policy. By the way, Powell spoke today and dispelled the concerns of traders and investors. The Fed chief said that the US economy could face a long period of weak growth, but promised that the regulator would make every effort and called for increasing budget expenditures to support the economy. He also said that economic recovery can be quite long and slow before it picks up speed. "Everything will depend on the results of the fight against the coronavirus," Powell emphasized. He emphasized that the longer the risks of a pandemic persist, the more businesses go bankrupt, the longer households will have problems earning income. Also, Powell openly called on Congress to allocate more money for additional fiscal support to the economy. Recall that now the total assistance program is already more than three trillion dollars. The most important thing that all spectators of the video conference were waiting for - Powell noted that the Fed is not considering the possibility of using a negative interest rate. Thus, it can easily be assumed that in the near future, Trump, who needs to revive the US economy as quickly as possible, will once again take up the massive criticism of the Fed and personally Powell, who recently even began to praise when rates were still lowered to zero . The US currency received the support of market participants after receiving information from Powell. However, will the dollar continue to strengthen? From a technical point of view, it is more preferable to continue the upward movement to the psychological level of $1.10. And we can talk about forming a downward trend only after confidently overcoming the 1.0750 level. Meanwhile, the media continues to discuss possible solutions to the situation between Germany and the European Union. The current situation is very delicate, and any wrong or careless decision can lead to the fact that anti-European sentiments will continue to mature in Germany, which may result in the victory of left or right political forces in the coming elections. Approximately the same thing that can happen in Italy. Recall that the essence of the conflict lies in the fact that Germany does not want to pay for the assistance of France, Italy and Spain, since it adheres to a strict budget framework, which the above countries do not do. The European Commission has already threatened Germany with legal proceedings and fines, but at the same time, the stronger it puts pressure on the Bundestag, the more Berlin will want to leave the European Union. Moreover, the UK has already set an example, and the mood of its current government (faster, as you like, just to break all ties with Europe) raises doubts about the urgent need for membership in the EU. Thus, it is the European Commission that needs to worry and find ways to put pressure on Germany so that it does not flare up and initiates a new "divorce proceedings". In fact, after all, any fine in Germany is a fine to its taxpayers, who will elect the next power in the country. Penalize a German court? It is absurd. Thus, we believe that in this situation, the ECB should really explain to Merkel and companies the necessity of just such a program to stimulate the economy and the importance of the participation of the Bundesbank in it. Yes, the ECB's reputation will slightly drop, and other countries that will need to help the most affected and squandering countries may also follow the example of Germany and demand an explanation from the ECB. However, there is no other option. 4-hour timeframe Average volatility over the past five days: 125p (high). The GBP/USD pair also jumped at the European session on May 13, although it is clear that at such an earlier time no important information could come from the US. And in any case, important information would trigger an upward movement of 100 points, and not by 40. But a similar decline in the pair's quotes began at the US session, as the dollar strengthened. Quite important data on GDP and industrial production have been published today in the UK. According to the Office of National Statistics, in March Britain's GDP fell by 5.8% m/m, by 2% q/q and by 1.6% y/y. Thus, the real values of all three indicators of GDP turned out to be much better than the expectations of traders. However, as in the case of European industrial production, it is difficult to call negative values of GDP "positive". Industrial production in Great Britain also turned out to be weaker than traders expected, -4.2% in monthly terms in March and -8.2% in annual terms. Thus, to put it mildly, the pound's growth this morning contradicts the published figures. Well, after Powell's speech, traders gladly rushed to sell the British pound, which continued its movement to the lower border of the side channel, which is quite unclear. Recommendations for EUR/USD: For short positions: The EUR/USD pair began a new round of correction against a new upward trend on the 4-hour timeframe. Thus, it is recommended to consider selling the euro while aiming for 1.0783 and 1.0745, not before prices are returned to the area below Kijun-sen. For long positions: It is recommended that you open new long positions with the goal of the Senkou Span B line, levels 1.0921 and 1.0954 in the event that a rebound from the Kijun-sen critical line occurs. Recommendations for GBP/USD: For short positions: The pound/dollar pair resumed the downward movement. Therefore, traders are advised to sell the pair with the target support level of 1.2164. But sell positions still carry increased risk. For long positions: It is recommended that purchases of the GBP/USD pair be considered with a view to the volatility level of 1.2396 and the Senkou Span B line, but in small lots if the Kijun-sen line is again overcome. The material has been provided by InstaForex Company - www.instaforex.com |
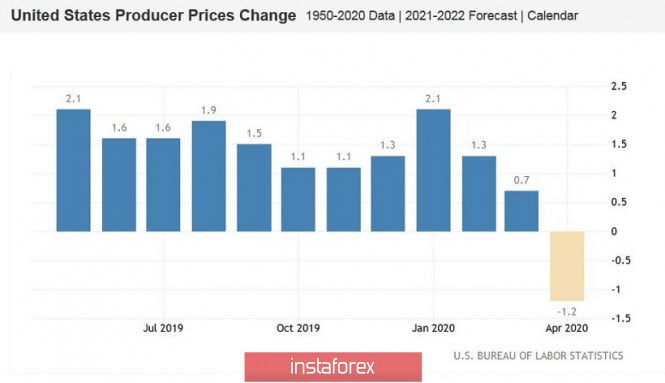
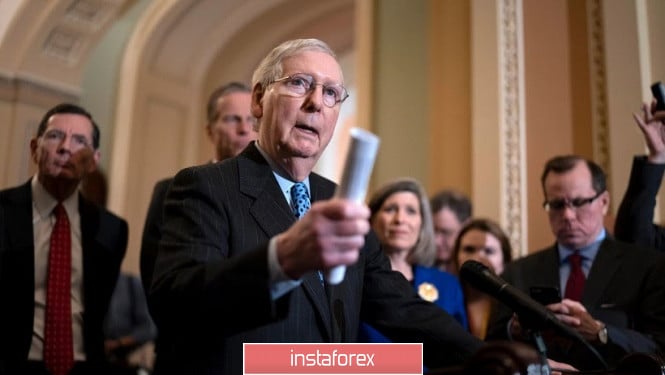
| EUR/USD. Assault on the ninth figure is postponed: Fed chief becomes the dollar's temporary ally Posted: 13 May 2020 10:32 AM PDT The US currency still can not determine the vector of its movement. Paired with the euro, the dollar is showing multidirectional intraday movement, although EUR/USD buyers managed to gain a foothold within the eighth figure in the first two days of the trading week. Now the bulls have a more difficult task - they need to finally stake out their positions above the middle line of the Bollinger Bands on the daily chart (that is, above the 1.0850 mark), then to begin the assault on the ninth figure. Weak data on rising US inflation today was compounded by weak producer price index values. But Federal Reserve Chairman Jerome Powell unexpectedly came to the aid of dollar bulls, who spoke (via video conference) to students at the University of Pittsburgh. Buyers were out of luck again: the Fed chief put an end to the upward momentum, returning the pair to the middle of the eighth figure. And although Powell did not say anything sensational, his rhetoric provided support for the US currency. As a result, the situation again hung in the air: bulls still need to go above 1.0880, bears - in the seventh figure. The eighth figure looks like a kind of buffer, from which traders can not get out for the second week. So, let's start with US statistics. US macroeconomic reports are frankly disappointing, even against the background of very pessimistic and realistic forecasts. In particular, all April inflation indicators were in the red zone, reflecting a decrease in consumer activity. For example, the general consumer price index in monthly terms, when forecasting a decline to -0.7%, fell to -0.8%. In annual terms, experts expected to see the general CPI at around 0.4%, while the figure came out at around 0.3%. Core inflation, excluding food and energy prices, also disappointed. In monthly terms, the core index dropped to -0.4%, in annual terms - to 1.4%. The Producer Price Index added a gloomy picture today: April figures were much worse than expected. Judge for yourself: according to the consensus forecast, this indicator (in monthly terms) should have decreased to -0.5% (i.e., a two-month low). Instead, it collapsed to -1.3% (multi-year low). Similar dynamics can be seen on an annualized basis - with a forecast decline to -0.2%, the indicator crashed to -1.2%. It should be recalled that the number of people employed in the US in April fell by 20,500,000, and since the beginning of the epidemic, that is, since the beginning of March, more than 33 million new unemployed have been registered in the United States. Unemployment jumped to almost 15% (although according to other estimates, this figure rose to 20%, since the temporarily absent were not classified as unemployed). After the release of such disappointing data, rumors spread around the market that the Fed might consider options for further easing monetary policy. There were even suggestions that the rate would be reduced to the negative area. Representatives of the Fed began to discuss this topic, however, none of the speakers (Bullard, Kashkari, Barkin, Quarles) spoke in favor of such a scenario. But the fact of such discussions alerted traders, after which the dollar was under background pressure. In anticipation of today's Powell speech, this pressure has intensified, especially after the release of data on the growth of US inflation. If Powell today at least hypothetically allowed the option of lowering rates below zero, the dollar would have plunged the entire spectrum of the market. But the head of the Federal Reserve willy-nilly sided with the dollar bulls, rejecting this idea. Although in itself the speech of the Fed chief was extremely pessimistic. He said that even after the economy opens, the United States may face a "long period" of weak growth and stagnation of income. And the longer the quarantine period (not to mention the possible second wave of the epidemic), the deeper the crisis will be (the risks of mass bankruptcies will increase, consumer activity will significantly decrease, etc.). At the same time, Powell almost openly asked Congress to approve the 3 trillion package of additional economic assistance. It is worth noting that after the speech of the Fed chief, the dollar began to strengthen not only due to a decrease in the probability of introducing negative rates. According to some experts, today's call by Powell will accelerate the process of agreeing on the above bill. The economic assistance package proposed by the Democrats includes $1 trillion for the needs of states and cities, additional payments for working in dangerous conditions for life support workers, and a new round of payments to all US residents. But the whole problem is precisely that the bill was proposed by the Democrats, who have a majority of votes only in the Lower House of Parliament. The Republicans, who in turn control the Senate, are not eager to play along with their opponents, especially on the eve of the presidential election. Biden is now ahead of Trump in many states, and if Democrats' three-trillion-dollar legislative initiative comes to fruition, this rating gap can only increase. Therefore, it is not surprising that the Republicans took the idea of the Democratic Party "with hostility", although on the public plane they can not too zealously protest against additional assistance. At present, the bill, which is 1,800 pages long, has been sent for consideration by the Senate. Mitchell McConnell, the Republican leader in the Upper House, has already called the Democratic proposal a hodgepodge, adding that the voiced proposals "are irrelevant." Of course, today's appeal by the Fed chief some Republicans to vote "for" the initiative of the Democrats. But, in my opinion, Powell will not be able to radically affect the situation, which is not so much economic as political. Therefore, with a high degree of probability, the Senate will return the bill for revision, and the dollar, in turn, will remain under background pressure. Despite the increased volatility, the technical side of the issue has not changed much since yesterday. For further growth, the bulls of the pair, firstly, it is necessary to finally gain a foothold above the 1.0850 mark (the middle line of the Bollinger Bands indicator, which coincides with the Kijun-sen line on the daily chart), and secondly, to overcome the 1.0890 mark (Tenkan- line sen on the same timeframe). In this case, it will be possible to consider long positions with the first northern target at 1.0950 (the upper line of the Bollinger Bands) and the second target of 1.1010 (the lower border of the Kumo cloud). If EUR/USD traders in the near future can not settle above 1.0850, then they will again fall to the bottom of the eighth figure, with further testing of the seventh price level. The material has been provided by InstaForex Company - www.instaforex.com |
| May 13, 2020 : GBP/USD Intraday technical analysis and trade recommendations. Posted: 13 May 2020 10:14 AM PDT
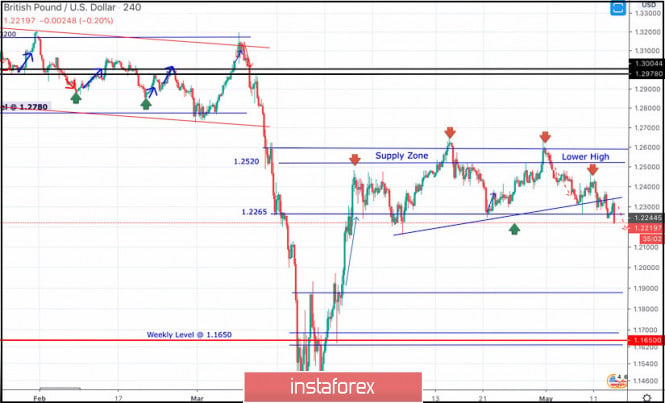
Intermediate-term Technical outlook for the GBP/USD pair remains bullish as long as bullish persistence is maintained above 1.1890-1.1900 (Double-Bottom Neckline) on the H4 Charts. Recently, Bullish persistence above 1.2265 has enhanced another bullish movement up to the price levels of 1.2520-1.2590 where significant bearish rejection as well as a quick bearish decline were previously demonstrated (In the period between 14th - 21 April). Currently, Atypical Bearish Head & Shoulders reversal pattern may be in progress. The pair may be demonstrating the right Shoulder of the pattern. Hence, Bearish persistence below 1.2265 (Reversal Pattern Neckline) is needed to enhance another bearish movement towards 1.2100, 1.2000 then 1.1920. However, recent bullish price action brought the GBP/USD pair back towards 1.2600 where evident bearish rejection was manifested as we expected in previous articles. By the end of Last Week, Intraday traders were advised to wait for bearish pullback towards the price levels of 1.2300-1.2280 where a low-risk short-term BUY trade could be taken. The price zone of 1.2300-1.2280 still stands as a prominent Intraday Demand Zone to be watched for bullish price action and a valid short-term BUY trade. For Previous BUYERs, bullish targets were expected to be reached initially around the price levels around 1.2450 then 1.2520 Provided that Bullish persistence above 1.2265 is maintained on the H4 chart. However, the recently demonstrated Lower High around 1.2440 endangers the previously-mentioned short-term bullish scenario. Thus, intraday traders should be careful for upcoming price action. Any bearish breakdown below 1.2265 should be taken into consideration as it confirms the previously-mentioned reversal-top pattern. Hence, This would probably enable further bearish decline eventually towards 1.2020 as a projection target for the reversal pattern. Trade recommendations : Intraday traders can wait for the current bearish breakout below 1.2265 to be confirmed as a valid SELL signal. T/P level to be located around 1.2150, 1.2100 and 1.2000 while S/L should be placed above 1.2265. The material has been provided by InstaForex Company - www.instaforex.com |
| May 13, 2020 : EUR/USD Intraday technical analysis and trade recommendations. Posted: 13 May 2020 09:45 AM PDT
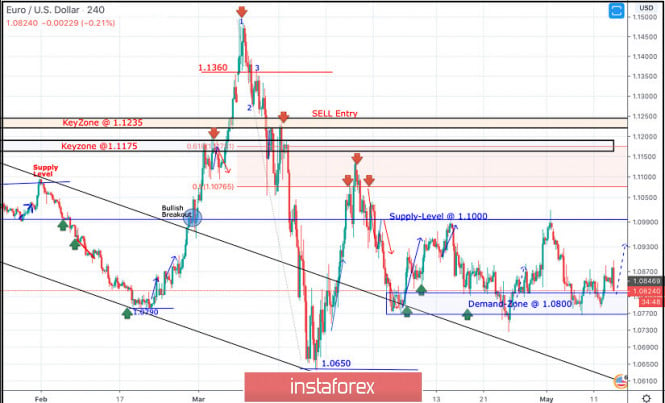
Few weeks ago, the EURUSD pair has expressed significant bullish recovery around the newly-established bottom around 1.0650. Bullish engulfing H4 candlesticks as well as the recently-demonstrated ascending bottoms indicated a high probability bullish pullback at least towards 1.0980 and 1.1075 (Fibonacci Level 50%). Key Supply-Levels in confluence with significant Fibonacci levels are located around 1.1075 (50% Fibonacci) and 1.1175 (61.8% Fibonacci) where bearish rejection was highly-expected upon the previous bullish pullback that took place on March 27. Thus, a bearish Head & Shoulders pattern was demonstrated around the price levels of (1.1000 - 1.1150). Further bearish decline was demonstrated towards 1.0800 where the nearest demand level to be considered was located near the backside of the broken channel (1.0800-1.0750). Evident signs of Bullish rejection have been manifested around the price zone of (1.0800-1.0750) leading to the recent bullish spike up to 1.0990. The short-term technical bullish outlook remains valid as long as bullish persistence is maintained above the recently-established ascending Bottom around 1.0770. Further bullish advancement was expected to pursue beyond 1.1000 towards 1.1175 where 61.8% Fibonacci Level is located. Bullish breakout above 1.1000 was needed to enhance further bullish movement towards 1.1075 and probably 1.1150. However, lack of bullish momentum brought another recent bearish decline towards the depicted price zone around 1.0800. On the other hand, the price zone of (1.0815 - 1.0775) still stands as a prominent Demand Zone which can provide quite good bullish support for the pair. However, Any bearish breakdown below 1.0770 should be marked as an Exit signal for all short-term BUY trades. Trade recommendations : Intraday traders are advised to consider the current bearish pullback towards the price zone of 1.0815 - 1.0775 as another valid short-term BUY trade. S/L should be placed at 1.0750 while T/P levels to be located around 1.0930, 1.1000 then 1.1075 if sufficient bullish momentum is maintained. The material has been provided by InstaForex Company - www.instaforex.com |
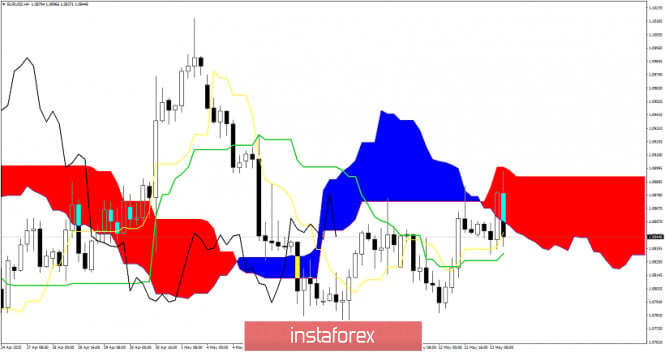
| Another rejection at key cloud resistance for EURUSD Posted: 13 May 2020 08:28 AM PDT EURUSD bulls tried to move above the resistance of 1.0880-1.09 but they were unable. Price got rejected once again at the Kumo and this is a bearish sign. EURUSD is now approaching key short-term support.
|
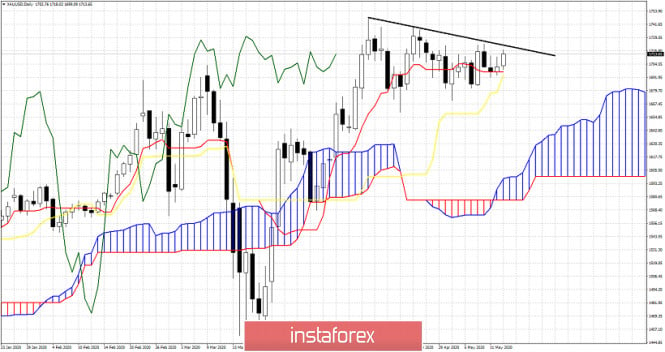
| Ichimoku cloud indicator Daily analysis of Gold for May 13, 2020 Posted: 13 May 2020 08:14 AM PDT Gold price is back above $1,700-$1,705. This is a sign of strength. However price remains trapped below important resistance trend line making price create lower highs. The Ichimoku cloud indicator so far supports the bullish continuation scenario.
Gold price remains in a bullish trend in the Daily chart. Price is above both the tenkan-sen and the kijun-sen. Support is key at $1,690-95 area. As long as price is above this level trend is bullish. Breaking below this level will open the way for a move towards $1,630. Resistance as we mentioned in our previous analysis remains key at $1,720-25. Breaking above this level will push price to new 2020 highs. The material has been provided by InstaForex Company - www.instaforex.com |
| Evening review for May 13, 2020 Posted: 13 May 2020 08:07 AM PDT
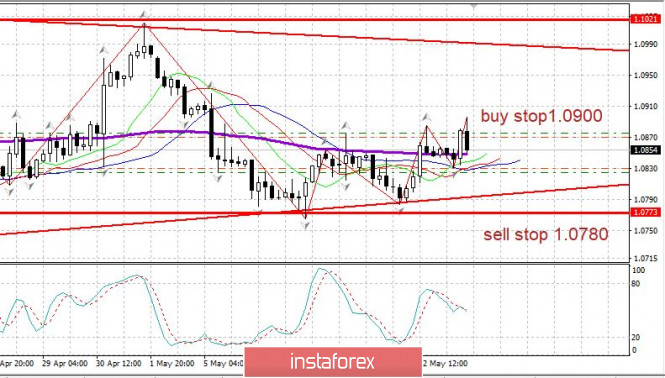
Two factors collided around EURUSD on Wednesday afternoon: Speech by Fed Chairman Powell, and a statement by the German Chancellor in support of the unity of the EU and the eurozone. Euro volatility increased slightly. You may consider purchases upon breaking through 1.0900 upwards, You may consider sales after a breakdown at 1.0825. This is somewhat risky, but the entry point will be better. The material has been provided by InstaForex Company - www.instaforex.com |
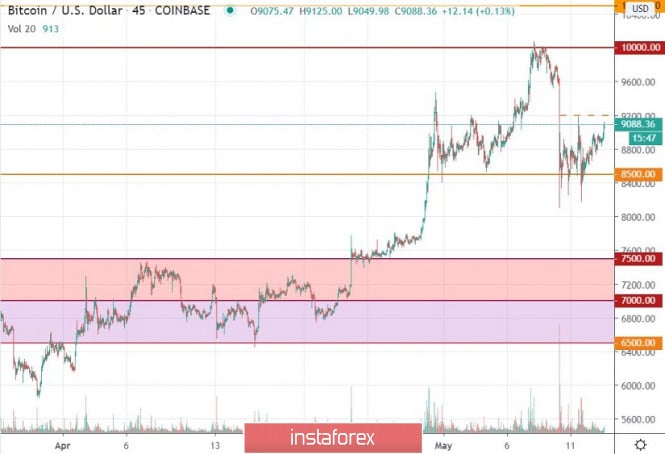
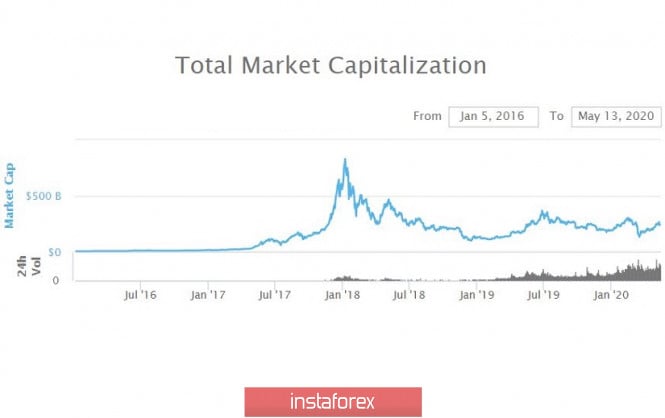
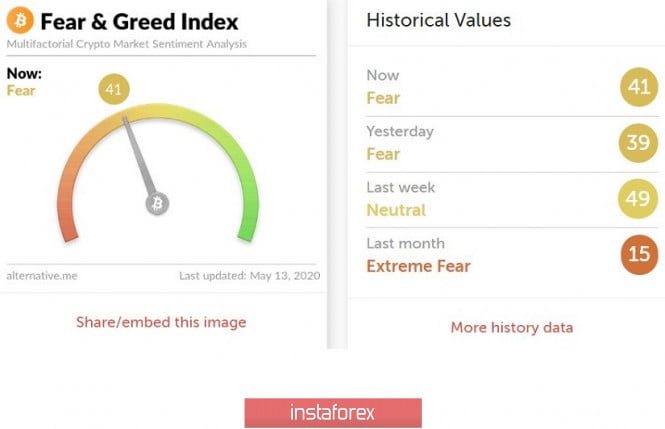
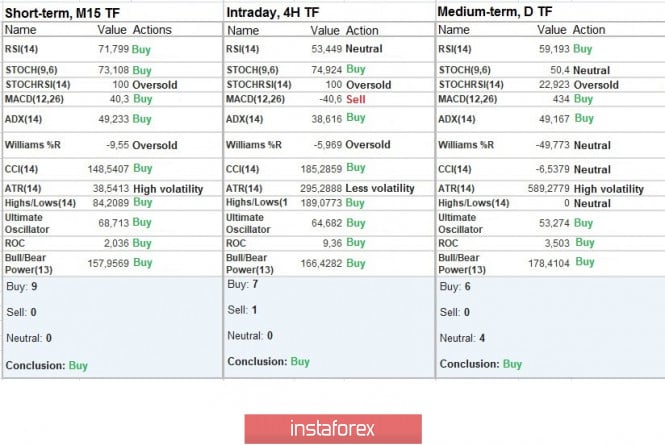
| Bitcoin done with the third stage Posted: 13 May 2020 07:49 AM PDT Greetings cryptocurrency enthusiasts! So the triumphant halving of Bitcoin came, which was anticipated for so long. But what changes have occurred and what to expect in the future? Let's take it in order. In the new story, three BTC halvings are known: November 28, 2012; On July 9, 2016, and May 11, 2020, each subsequent stage carried a complication of the production process of the new block, or rather, a decrease in remuneration to miners. The process has its own sacred meaning of emission, which was asked by the sensei of crypto enthusiasts, Satoshi Nakamoto. Halving focuses on itself with increased interest, and judging by the existing process of complication, Google Trends literally went off-scale from queries related to halving. Naturally, against this background, crypto enthusiasts became active, which in March-April began to prepare trading accounts on stock exchanges, where the influx of living funds from outside was recorded. Before we move on to halving and its impact on the market in the future, it is worthwhile to analyze the preparation process in detail. So, for more than a month the price was in the variable range of $ 6,500 / $ 7,500, which served as a kind of catalyst for trading forces, but the existing platform was a temporary phenomenon, and everyone knew about this. Since April 24, the process of preparing positions for the halving has begun, longs have grown and capital has flowed into BTC. Over 16 days, market participants managed to gain more than $ 3,000, reaching $ 10,079, and this is a kind of parity for bitcoin. Such accelerations due to expectations of halving led to the mass liquidation of long positions in the amount of $ 1.3 billion, which resulted in a sharp decrease in the BTC rate, the loss of May 10 more than 15% of the cost. The triumphant moment of halving comes on May 11, and everything is already won back on the market, there is no speculation, and the enthusiasts that were bought by BTC at the level of $ 10,000 are at a loss. However, everything is not so bad, Bitcoin has come a long way from nothing to public recognition, and it is worth a lot. If we go to the numbers and compare the BTC trading volumes from the last halving, we will see that during this period, the trading volume soared 50 times. Summing up, no matter how bad the judgment about the first MTC cryptocurrency, it still remains in its place and balances both in the market and in the world. Current halving will not bring unprecedented heights of $ 100,000; $ 200,000 $ 500,000 PTS needs stabilization in the new digital world. Current development and prospects After a local collapse on May 10, the quotes entered the stabilization phase, with variable boundaries of $ 8,250 / $ 9,200. In fact, we were faced with another catalyst for trading forces, where it can be assumed that halving could theoretically push the BTC to a gradual increase in the future. The growth goes towards the breakdown of parity of $ 10,000 and consolidation above this value, which is the main goal for most traders. We specify everything in the trading recommendations. A buy position should be considered after consolidating the price higher than $ 9,200, with the prospect of a move to the level of $ 10,000. Subsequently, we expect a new stabilization, where it is necessary to consolidate at a level above $ 10,500, which will confirm the intention of further growth. The general background of the cryptocurrency market Analyzing the total market capitalization, you can see the change in trading volumes relative to the previous halving, where for the current hour Total market is $ 245 billion. If we consider the volume chart in general terms, we see that the level of $ 260–265 billion remains a variable ceiling. Subsequent resistance is in the region of $ 280–300 billion. The cryptocurrency market emotion index (aka fear and euphoria) has recently grown significantly to level 41, which is considered a good signal for the growth of activity of market participants. Indicator analysis Analyzing a different sector of timeframes (TF), it can be seen that there is a buy signal relative to the main time periods, but it is worth considering the fact that price fluctuations are carried out in the side corridor and the indicators of technical instruments are variable in nature. |
| Posted: 13 May 2020 07:48 AM PDT The European currency and the British pound strengthened their positions against the US dollar after the release of a number of fundamental statistics for March this year, which clearly shows the beginning of a recession in developed economies. Today's report on the rate of decline in the UK's GDP is only a distant echo of what awaits the country in the future. The worst is yet to come, when the reports for April and May begin to be published, where the country was already completely paralyzed due to the spread of the coronavirus. While it is difficult to estimate the exact scale of the decline, according to some experts, the economy may lose up to 30% in the 2nd quarter. Even though the UK was late in introducing the quarantine regime, a longer period of isolation will have a detrimental effect on all economic indicators. According to the statistics agency, in the 1st quarter of this year, UK GDP decreased by 2.0% year-on-year, while economists expected a decline of 2.2% immediately. However, the quarantine in the UK began only on March 23, while in other European countries, isolation measures were taken much earlier, which led to a larger reduction in GDP. In March, compared to February, the economy declined more significantly, immediately by 5.8%, and by 2.0% compared to the 1st quarter. Economists had predicted a drop in GDP of almost 8.0%. The Bank of England expects a clearer picture by the end of May this year, and in just the 2nd quarter, the economy may contract by 25%. Such indicators suggest that the economy is 100% likely to be in a recession, and when it will get out of it, we can only guess. The UK will not return to pre-crisis levels until 2022, as social distance standards are likely to be in place before the vaccine is available. After the release of the report, the market could watch the growth of the British pound, as traders were generally encouraged by the fact that the data was much better than the forecasts of economists, although it indicated a contraction of the economy. This leaves hope for a larger jump in recovery after the lifting of restrictive measures. However, there are also those who are more pessimistic about the pace of future GDP growth, since if measures of social distancing can be weakened, then it will not be possible to influence the labor market so easily. A significant increase in unemployment in the UK will hold back the recovery of the economy after the pandemic. As for the technical picture of the GBPUSD pair, while buyers of the pound have confidently managed to cope with the level of 1.2310 and expect to continue the upward correction to the maximum of 1.2380 and a test of a larger resistance of 1.2470. If the pressure on the pound returns in the second half of the day, it is best to return to long positions only after updating the minimum of 1.2250. Larger players will be waiting for the test of the new areas of 1.2210 and 1.2150. EURUSD The European currency has slightly regained its positions against the US dollar, getting close to a fairly important resistance level, the break of which will provide the pair with a new bullish impulse to the highs of 1.0930 and 1.1010. The report on industrial production in the Eurozone, which was better than the forecasts of economists, provided support to buyers of risky assets, who were completely bored without positive news. According to the statistics agency, industrial production in the Eurozone in March this year decreased by -11.3% compared to February and fell immediately by 12.9% compared to the same period in 2019. Economists had expected production to fall by -12.8% and -12.4%, respectively. I think it makes no sense to talk about the reasons for the reduction in production, since isolation measures, a surge in unemployment, and disruption of logistics chains, along with the disruption of supplies and the freezing of the economy, have led to such record figures. However, talking about a larger continuation of the recovery of the European currency is rather premature, since the differences between the northern and southern countries of the eurozone are increasing, which paralyzes the actions of the European Central Bank, which is preparing a new aid package. Even if the Bundesbank and the ECB manage to agree on an increase in the quantitative easing program, it is unlikely to solve the fundamental problems of the southern countries, and after the COVID-19 crisis, after funding cuts, the situation will only get worse. However, if the EU does not come to a consensus on increasing the volume of financing for weak southern countries, such as Italy, Spain, Greece, etc., then it is quite possible that governments will be forced to increase the issue of government bonds, which may lead to an expansion of the spread of government bond yields between the northern countries. For example, at the moment, the yield spread of 10-year government bonds in Italy and Germany is 244 basis points. As for the technical picture of the EURUSD pair, it has not changed much compared to the morning forecast, except that traders have approached the resistance of 1.0880 and further movement will depend on the speech of the Fed Chairman. A break of 1.0880 will lead to a new wave of growth in the area of highs 1.0930 and 1.1010. The material has been provided by InstaForex Company - www.instaforex.com |
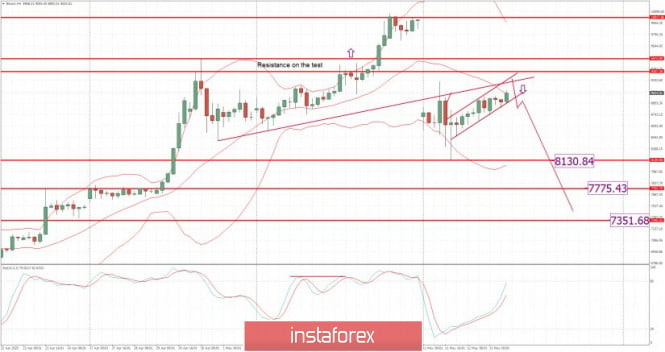
| Posted: 13 May 2020 05:43 AM PDT BTC News:
According to recent research conducted by Ripple, traders swap bitcoin (BTC) and ethereum (ETH) for XRP for their exchange balance transfers. Xpring's data scientist Shae Wang noted that the recent financial market instability has put cryptocurrencies networks to the test. The increased trading volumes witnessed, sparked network congestion on both ethereum and bitcoin. This subsequently made it very difficult to move these two currencies in and out of exchanges. As a result, most traders opted for XRP for convenient exchange balance transfers. Traders Use XRP For Interexchange Transfers To Escape High Fees And Delays On ETH And BTC NetworksTechnical analysis: BTC has been trading upwards. The price tested the level of $9,000, which is the middle Bollinger line and potential resistance. I expect further continuation of the downside movement towards the support levels. Trading recommendation: Watch for selling opportunities due to the bearish flag pattern in creation and potential for the downside continuation. The material has been provided by InstaForex Company - www.instaforex.com |
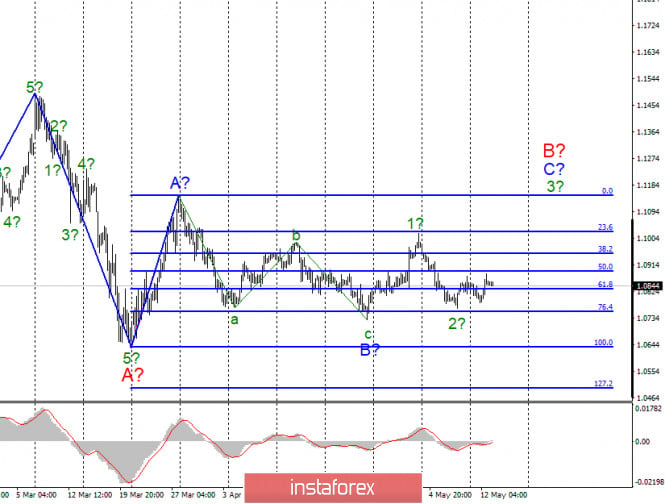
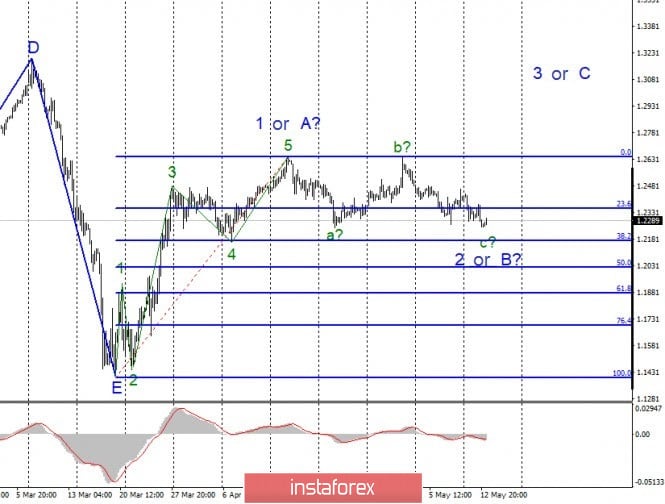
| Analysis on EUR / USD and GBP / USD for May 13, 2020 Posted: 13 May 2020 05:39 AM PDT EUR / USD On May 12, the EUR / USD pair gained about 40 base points, but this was enough for the instrument to begin to move quotes from previously reached lows. Thus, the alleged wave 2 in C in B is still considered complete. If this is true, then the increase in quotes will continue within the framework of wave 3 with targets located about 11 of the figure and above. At the same time, the wave pattern of the instrument may require making adjustments or additions, since the euro quotes are growing very reluctantly. Fundamental component: The news on Monday and Tuesday is forcing markets to become wary again, and perhaps even prepare for a new panic. The fact is that the conflict between the US and China over the coronavirus pandemic continues to grow. Let me remind you that Washington immediately makes several complaints to Beijing regarding the spread of the COVID-19 virus around the world. The White House believes that Beijing deliberately misinformed the whole world about the scale of the pandemic and too late in announcing the new virus in the media as well as in informing the WHO. Moreover, Washington does not exclude the laboratory origin of the virus and its not entirely random release. Thus, Donald Trump believes that China should be punished for its negligence and is preparing a new package of sanctions that could spark a new trade war between the countries. Yesterday, US Senator Lindsey Graham introduced a bill on liability for COVID-19, which would impose sanctions on China if it does not provide a full report on what happened in a laboratory in Wuhan. The senator believes that China lied and continues to lie to the whole world about the coronavirus. At the same time, it is reported that China itself does not mind terminating the trade deal since we believe that during the crisis caused by the virus, some points of the agreement are not feasible. America is not going to resume negotiations on a trade agreement and change any of its items to be more favorable to China. Thus, the transaction can be terminated, and new fees and penalties can be introduced by both parties to the dispute. General conclusions and recommendations: The Euro-Dollar pair presumably continues to build the rising wave C to B. Thus, I recommend buying the instrument with targets located, as before, at around 1.1148, which equates to Fibonacci 0.0%, or near the peak of wave A. A successful attempt to break through the minimum of wave B will require corrections and additions to the current wave marking. GBP / USD The GBP / USD pair on May 12 lost another 80 basis points. The MACD indicator did not give a new upward signal yesterday, and the instrument made a successful attempt to break through the previous low. Thus, the alleged wave c in 2 or B resumed its construction with targets located near the 38.2% Fibonacci level. The whole wave 2 or B can take a fairly long horizontal view. However, even in this case, the construction of a rising wave d in its composition is expected. Fundamental component: The news background for the GBP / USD pair on May 12 was very weak. However, this morning important data on GDP for the first quarter in the UK has already been released, which inspired a little optimism in buyers of the pound sterling. According to the results of March, GDP fell not as much as the markets expected. Industrial production also turned out to be better than expected. Thus, in the first half of Wednesday, the pound is even in demand. However, I believe that the market reaction was too weak for such important reports. If the markets have not found the strength to buy the pound on optimistic data, then most likely the decline in the instrument will continue in the near future. General conclusions and recommendations: The Pound-Dollar instrument is nearing completion of the construction of the second wave of a new upward trend section. Thus, now I recommend buying the pound with targets located around 26 of the figure, counting on building a wave of 3 or C or d in 2 or B on a new MACD signal "up". A successful attempt to break the 1.2645 mark will allow you to buy the pound more confidently. The material has been provided by InstaForex Company - www.instaforex.com |
| Posted: 13 May 2020 05:36 AM PDT Corona virus summary:
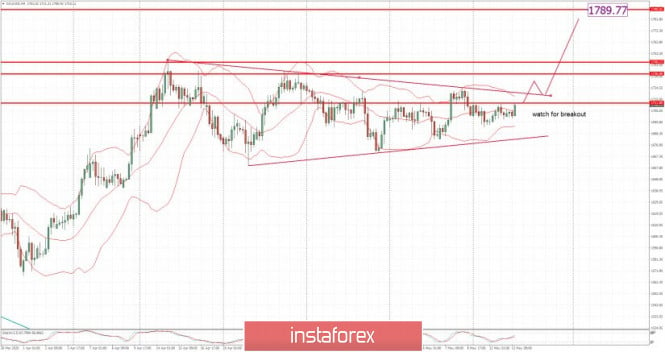
Technical analysis: Gold has been trading upwards as I expected. The Gold is breaking the pivot high at the price of $1,711, which is good sign for the further upside. I still expect upside movement and breakout of the the larger symmetrical triangle pattern in the background. Trading recommendation: Watch for buying opportunities due to the intraday up-cycle and potential for the breakout of the symmetrical triangle. The upward targets are set at the price of $1,746 and $1,790. The material has been provided by InstaForex Company - www.instaforex.com |
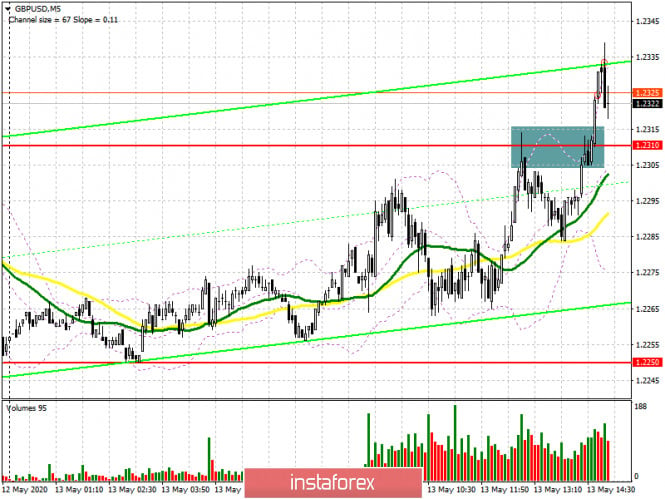
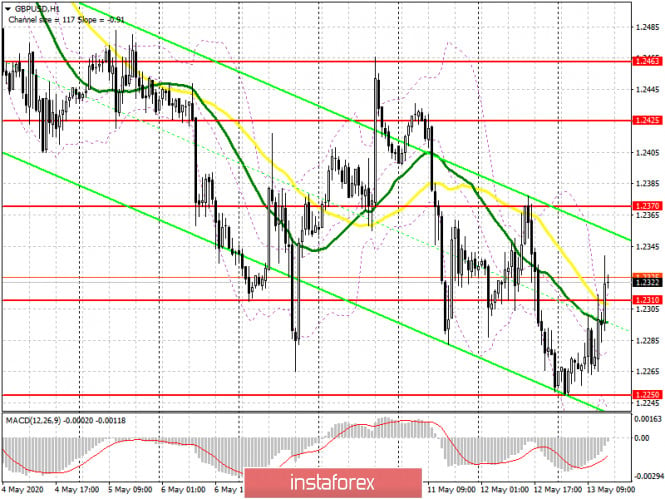
| Posted: 13 May 2020 05:23 AM PDT To open long positions on GBPUSD, you need: In the first half of the day, I paid attention to the level of 1.2310 and the formation of a false breakout from this range, which would allow sellers of the pound to continue the downward trend. If you look at the 5-minute chart, we see how after the test of this resistance, the pair rolled down more than 25 points, but the data on the reduction of the growth rate of UK GDP stopped its downward trend, as it turned out much better than forecasts of economists, reinforcing the risk appetite. A repeated test of the resistance of 1.2310 has already led to a breakout of this level, and all that is now required for buyers is to fix above this range and update it from top to bottom on the volume, which will be a signal to open long positions in the expectation of continuing the upward correction. However, much still depends on the speech of US Federal Reserve Chairman Jerome Powell, which will take place in the afternoon. The next target of the bulls will be the resistance of 1.2370, after updating which I recommend fixing the profit. In the scenario of GBP/USD falling below the support level of 1.2301 in the second half of the day, it is best to postpone long positions until the test of the minimum of 1.2250 or buy the pair immediately for a rebound from the support of 1.2211 in the calculation of an upward correction of 30-40 points within the day.
To open short positions on GBPUSD, you need: In the first half of the day, the bears tried to hold the resistance of 1.2310, and it seemed that they succeeded, but at the second test of this level, active sales did not occur, which led to the breakdown of this range and the demolition of stop orders of speculative players. The sellers' task for the second half of the day will be to return to the level of 1.2310, which will increase the pressure on the pound and quickly push it down to the major support of 1.2250. However, the bears' longer-term goal for the end of this week remains the lows of 1.2211 and 1.2169, where I recommend fixing the profits. In the scenario of further growth of the pound, which may occur after the speech of Fed Governor Jerome Powell, short positions can be returned only after the formation of a false breakout in the area of 1.2370, but I recommend selling GBP/USD immediately for a rebound only after testing the maximum of 1.2325 in the calculation of a downward correction within the day of 30-40 points.
Signals of indicators: Moving averages Trading is just above the 30 and 50 daily averages, which indicates an attempt by the bulls to return to the market, which is still owned by the bears. Note: The period and prices of moving averages are considered by the author on the hourly chart H1 and differ from the general definition of the classic daily moving averages on the daily chart D1. Bollinger Bands The break of the upper limit of the indicator in the area of 1.2300 once again confirms the firmness of buyers' intentions to continue the upward correction. In case of a decline, the lower border of the indicator in the area of 1.2250 will provide support. Description of indicators
|
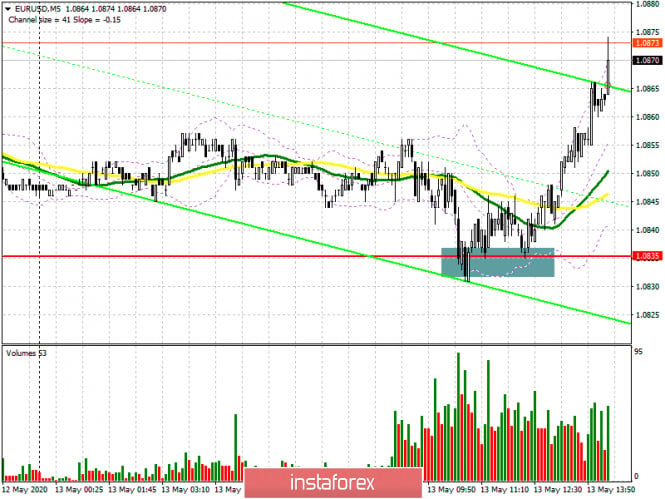
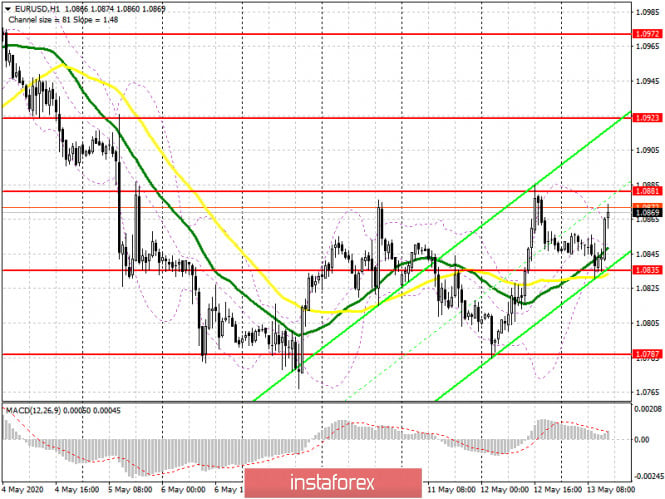
| Posted: 13 May 2020 04:50 AM PDT To open long positions on EURUSD, you need: In my morning forecast, I paid attention to the level of 1.0835 and its high importance in terms of continuing the upward correction of the euro. If you carefully look at the 5-minute chart, you will see how after the formation of a false breakdown at this level with a repeated test of it on the volume, it was possible and necessary to open long positions and wait for the continuation of the upward movement in the first half a day. Good indicators on the reduction of industrial production, which was better than the forecasts of economists, led to the strengthening of the euro in the first half of the day. At the moment, an important goal is to break through and consolidate above the resistance of 1.0881, which will lead to a more powerful bullish impulse with an exit to the highs of 1.0923 and 1.0972, where I recommend fixing the profits. In the scenario of a repeated decline of EUR/USD to the support area of 1.0835 after the speech of the US Federal Reserve Chairman Jerome Powell, which will take place in the afternoon, it is best to postpone buying the euro until the test of the lower border of the side channel 1.0787 or open long positions immediately on a rebound from the new local minimum of 1.0728 in the calculation of an upward correction of 30-40 points within the day.
To open short positions on EURUSD, you need: Sellers need to return to the market, and it will be possible to talk about control from their side only after the pair is fixed below the support of 1.0835, which was not possible in the first half of the day. Only in this scenario, you can open new short positions in the expectation of a repeated decline in EUR/USD in the area of this week's minimum to the support of 1.0787, as well as its breakdown, which will increase pressure on the euro and lead to an update of the area of 1.0728, where I recommend fixing the profits. If, after a speech by the head of the Fed, the market does not start moving down, and the formation of a false breakdown in the resistance area of 1.0881 does not lead to a larger decrease in the euro, it is best to postpone short positions until the test of larger highs in the areas of 1.0923 and 1.0972 counting on correction of 25-30 points intraday.
Signals of indicators: Moving averages Trading is above the 30 and 50 daily moving averages, which indicates a possible continuation of the euro's growth in the short term. Note: The period and prices of moving averages are considered by the author on the hourly chart H1 and differ from the general definition of the classic daily moving averages on the daily chart D1. Bollinger Bands A break in the upper limit of the indicator around 1.0865 may lead to a larger increase in the euro. Bears will return to the market only after breaking the lower border of the indicator in the area of 1.0835. Description of indicators
|
| Posted: 13 May 2020 04:47 AM PDT Corona virus summary:
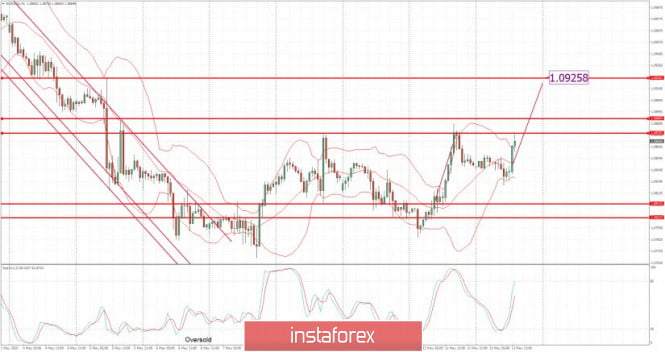
Russia registers more than 10,000 new casesRussia registered more than 10,000 new coronavirus cases on Wednesday, continuing a grim trend that has seen the country become a global virus hotspot, AFP reports. Health officials reported 10,028 new cases over the last 24 hours, bringing Russia's total number of infections to 242,271. The Kremlin this week eased a national lockdown to slow the spread of the virus, despite a steady rise in numbers that has brought Russia to second place in a global tally of infections, behind the United States. A majority of Russia's new cases were registered in the capital, a government virus tally said, where Moscow's mayor, Sergei Sobyanin, has extended a lock-down until the end of May. Technical analysis: EUR/USD has been trading upwards as I expected. The EUR reached my first yesterday's target at the price of 1,0875. I still expect upside movement towards the my second target at the price of 1,0925. Trading recommendation: Watch for buying opportunities on the pull backs due to strong upside cycle and further rally expectation. The next upward target is set at the price of 1,0925. .Support level is set at the price of 1,0830 The material has been provided by InstaForex Company - www.instaforex.com |
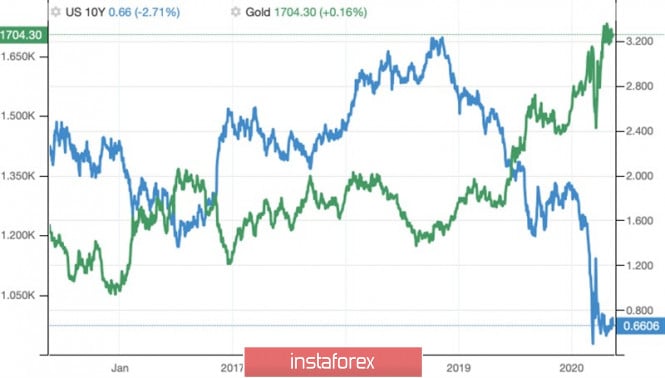
| Gold is waiting for clarification from the Fed Posted: 13 May 2020 04:36 AM PDT After a tumultuous rally in the first half of spring, gold was stuck for a month in the consolidation range of $1665-1745 an ounce, which narrowed further amid rumors of a federal funds rate cut below zero. For the first time in history, the futures market began to put the probability of such a scenario in the quotes of its instruments, first by the end of 2020, and then, after dissatisfied comments from FOMC officials, by the middle of 2021. However, the words of Donald Trump that he expects a gift from the Fed in the form of negative rates, added fuel to the fire. Now investors want to hear a speech by Jerome Powell, during which this topic will surely come up. Lower borrowing costs are usually regarded as a "bullish" factor for XAU/USD, as it contributes to the weakening of the US dollar and leads to a fall in Treasury bond yields. If it is high, then gold that does not generate income in the form of interest or dividends cannot compete with debt obligations. Reducing rates on bonds, on the contrary, allows the precious metal to spread its wings. Dynamics of gold and US bond yields
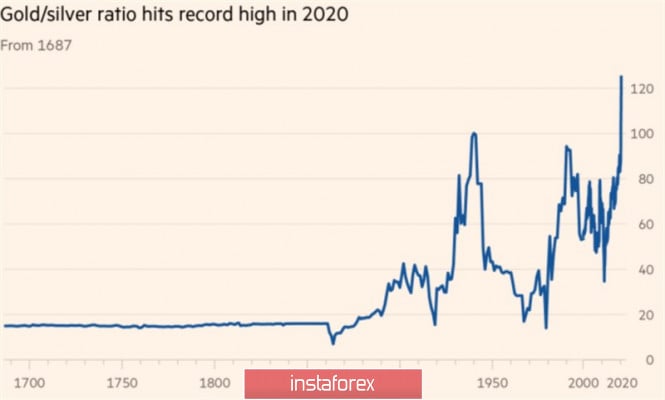
Due to trade wars, pandemics, and recessions, the yield of global debt market instruments is constantly going down, which creates a solid foundation under the upward trend for XAU/USD. If the Fed does go along with Donald Trump (admittedly, not the first time), then the path to $1800 per ounce for gold will be open. While the probability of such a scenario is low, however, it is not necessary to discount negative rates on federal funds. This circumstance, along with the major world currencies weakened by large-scale monetary expansion, increases the investment demand for the precious metal. In April, stocks of the largest specialized fund SPDR Gold Shares registered a record increase in 11 years, and capital inflows to gold-oriented ETFs for less than 5 months of 2020 amounted to 14.5 billion. For comparison, for the whole of 2009 - 11.7 billion. At the same time, investors are looking with growing curiosity at the record high ratio of gold and silver, which reached 125 in March and has fallen slightly since then. The latter metal is highly dependent on industrial demand, and if the global economy starts to recover in the second half of the year, XAG/USD will go up. On the other hand, American GDP may not move along a V or U-shaped path, but face the same situation as in the 1930s, when industrial production halved, then slowly grew for four years, but subsequently went back to the bottom. Dynamics of the ratio of gold and silver
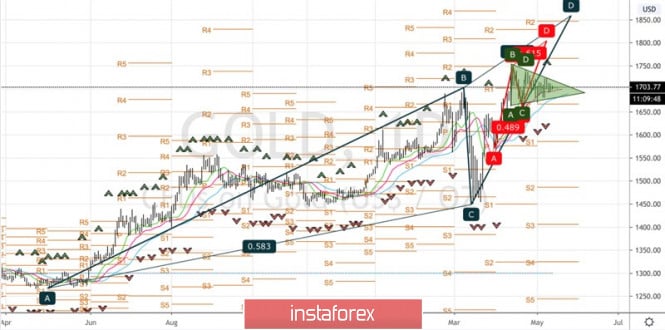
In my opinion, the weakness of the main world currencies and the low rates of the global debt market paint a bullish picture for gold. A drop in its quotes to $1665 and $1635 or a breakthrough of resistance at $ 1720 per ounce should be used to form longs. Technically, without the exit of the precious metal quotes outside the triangle, it will be difficult for it to determine the direction of further movement. The chances of implementing 161.8% targets for the parent and child patterns AB=CD are still high. Gold, the daily chart
|
| Market review. Trading ideas. Q&A Posted: 13 May 2020 04:21 AM PDT Trading recommendations: USD/JPY- buy up to 108. The material has been provided by InstaForex Company - www.instaforex.com |
| You are subscribed to email updates from Forex analysis review. To stop receiving these emails, you may unsubscribe now. | Email delivery powered by Google |
| Google, 1600 Amphitheatre Parkway, Mountain View, CA 94043, United States | |



No comments:
Post a Comment