
Forex analysis review |
- Do not miss the trend: USD ready to determine the direction
- #SPX stock markets, trading signals, feast during the plague and the cure for it #GILD
- Comprehensive analysis of movement options for #USDX vs EUR/USD & GBP/USD & USD/JPY (Daily) in June 2020
- May 29, 2020 : EUR/USD Intraday technical analysis and trade recommendations.
- May 29, 2020 : GBP/USD Intraday technical analysis and trade recommendations.
- US-China conflict puts pressure on European stock market
- Oil finished rally
- Pressure on greenback grows
- Trading plan for Gold for May 29, 2020
- Trading plan for EUR/USD on May 29, 2020
- Evening review on EURUSD for May 29, 2020
- Euro got up and powerfully answered
- EUR/USD and GBP/USD on May 29 - results of the analysis of the COT report (Commitments of Traders)
- Trading recommendations for EUR/USD on May 29, 2020
- GBP/USD analysis for May 29, 2020 - Strong upside momentum and potential for test of 1.2450
- Analysis of Gold for May 29,.2020 - Strong momentum to the upside and potential for further upside continuation. Upward targets
- BTC analysis for May 29,.2020 - Broken upward channel and potential for the bigger drop towards the $8.750
- EUR / USD: Euro's continuous growth still uncertain
- GBP/USD: plan for the American session on May 29 (analysis of morning deals). The pound remains in the channel, and the bulls
- EUR/USD: plan for the American session on May 29 (analysis of morning deals). Germany was again pleased with the good reports
- Trading plan for May 29, 2020: EUR/USD - take profit!; Coronavirus updates from around the world.
- Trader's diary on May 28th, 2020. Moscow to soften containment measures from June 1st. Outlook for RUB and EUR/USD
- GOLD Shining On Global Risks!
- Technical analysis of GBP/USD for May 29, 2020
- Trading idea for GBP/USD
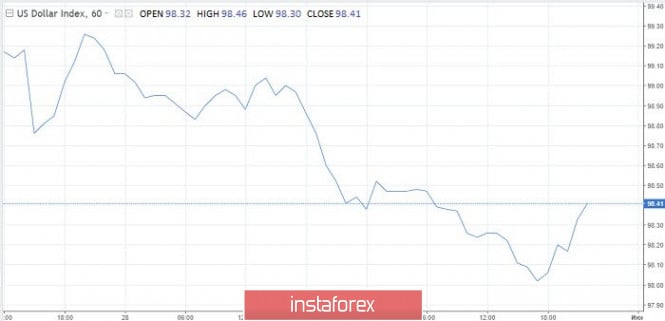
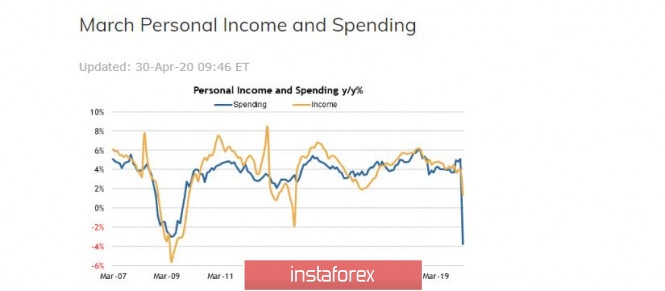
| Do not miss the trend: USD ready to determine the direction Posted: 29 May 2020 12:38 PM PDT The weekend seems to be eventful. Hong Kong is preparing for new street protests, China is angry at the interference of other countries in the affairs of the autonomous region, and Donald Trump is preparing to answer China for Hong Kong. Everyone is interested in how far the president of the United States can go and whether he will go to level the preliminary trade deal with China in 2019 or noisily take some symbolic steps, such as sanctions and visas for Hong Kong citizens. This may affect the fate of further stock market rallies. Meanwhile, data on employment in the non-agricultural sector for May will be released next Friday. This will probably be another gloomy indicator. Despite some encouraging signs in the employment picture in recent weeks, these changes are unlikely to be reflected in the May data. Investors striving to seize on signs of economic recovery after a pandemic will meet with any positive stormy standing ovation. According to a Reuters poll, US employers cut 7.45 million jobs in May compared with a record 20.5 million in April. As for the dollar, today it missed the US macrostatistics. According to the Ministry of Trade, consumer spending fell by 13.6% in April compared to March instead of the expected decline of 12.6%. At the same time, income unexpectedly increased by 10.5%. Analysts had forecast a drop of 6.5%. The University of Michigan consumer sentiment index rose by a final estimate to 72.3 points in May, not reaching expectations. Experts announced an indicator of 74 points. The dollar has other concerns now - the uncertainty in relations between the US and China and the possible reduction in rates deep into the negative area. Jerome Powell today must hint at this or refute market guesses. Traders are trying to figure out an important question for them: how the reduction in interest rates will affect the status of the dollar as a world reserve currency and a safe-haven asset. This explains why they cannot decide on the movement. And if we add here short-term and long-term economic risks, an increase in the number of initial applications for unemployment benefits? According to Goldman Sachs, high unemployment in the United States will continue for two years, and maybe more. This will slow down a rising economy. Forbes believes that "millions of jobs are lost forever." It is not surprising why the greenback rushes from side to side in search of the right direction. So, on Thursday, the dollar passed the lower border of the trading range of March 27. Traders were not sure how to proceed. There was a lull in the market on Friday, as both buyers and sellers took a wait-and-see attitude. New drivers may appear over the weekend. At the moment, the US currency really offers a favorable risk/reward ratio. This is due to finding it as at the lower limit of the trading range, and near a possible level of resistance with a subsequent decrease. The material has been provided by InstaForex Company - www.instaforex.com |
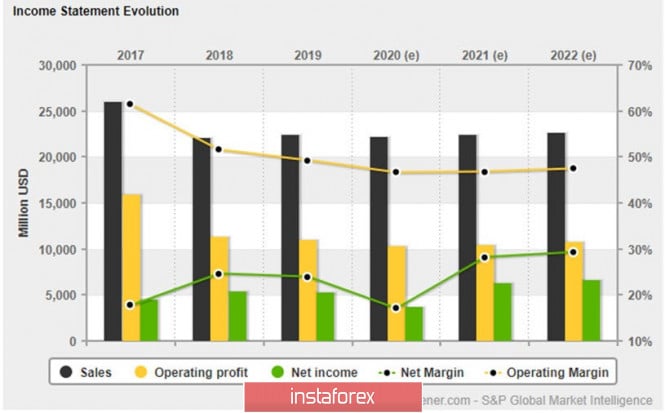
| #SPX stock markets, trading signals, feast during the plague and the cure for it #GILD Posted: 29 May 2020 12:38 PM PDT Dear colleagues. What is currently happening on the stock markets gives me a strong sense of deja vu, because we already saw something similar in 2011-2012, only to a much lesser extent. Although it seemed unbelievable then, the essence of what is happening with stock markets around the world was akin to insanity and was described by the phrase "the worse, the better." Then the worse the data on the US economy came out, the more the US stock market grew in anticipation of new injections from the Federal Reserve. Today we see something similar, only in much larger - global volumes. The unemployment data all over the world comes out horrific, hundreds of millions of people all over the world lost their jobs overnight, the number of unemployed in the US alone reached 36 million. Many sectors of the economy, such as air travel and tourism, have been thrown back decades. The leader of the "free" world can not cope with the epidemic of the COVID-19 virus for the third month, and the number of victims has already exceeded 100,000. However, stock markets have almost recovered their losses by 2/3 of the February record highs and continue to grow. The leaders with exceeding the previous highs of March 4 were the Information Technology Sector (INFO TECH), where AMD (#AMD), which has Wtd Alpha +141.80, and Apple (#AAPL), which possesses the strongest growth indicators, Wtd Alpha +73.00. Also, following the results of two months of the second quarter, the Health Care sector emerged as the leader, where the company Gilead Sciences Inc (#GILD), available for trading in the InstaFOREX terminal, which has Wtd Alpha +20.50, showed a very worthy result. Since this company has developed an interesting technical model at the moment, I will consider it in more detail. Gilead Sciences, Inc. is a biopharmaceutical research and development company that seeks, develops and commercializes innovative medicines in the fields of unmet medical needs. The company seeks to change and simplify the care of people with life-threatening diseases around the world. Gilead's product portfolio and range of products includes treatments for HIV/AIDS, liver disease, cancer, inflammatory and respiratory diseases, and cardiovascular diseases. The company is included in the Nasdaq 100 and S&P 100 indices. At the same time, for a long time, the company's shares have brought investors income below these indices. However, everything changed in 2020, when the company's shares began to grow rapidly. Consider some of the fundamental indicators of Gilead Sciences Corporation and conduct its general fundamental analysis. Earlier, I mentioned the Weighted Alpha indicator, which characterizes the strength of the company's growth over the past year. This indicator is #GILD low, but not low. The leader in the Health Care sector is Regeneron Pharmaceuticals, which has a Wtd Alpha of +108.90. However, companies with high weighted alpha are usually very overbought, and, in my opinion, buying stocks of these companies is like trying to catch up with an outgoing train. Gilead Sciences, Inc. refers to the mastodons of financial markets and has a capitalization level of over 90 billion dollars. Annual sales are at $20 billion. Earnings before tax for EBITDA in 2019 amounted to $ 12.486 billion. Forecast for profit for 2020 is 11.514 billion. The company is relatively cheap, the earnings per share Price/Earnings ttm is 12.18, according to some estimates, 25.5, which in any case is acceptable for the performance of a company in this sector. Indicators of debt on equity are 1.02. Profitability is estimated at 23.99%. An excellent bonus for a long-term investor is the high, by the standards of the United States and the sector, dividends of 3.61%. The growth in the value of shares over the past year is 18.66%. An important positive factor is the fact that the Beta indicator for 60 months is at 0.70. This suggests that #GILD shares are dependent on changes in the Nasdaq 100 and S&P 100 base indices by 70% or less volatile. We have more or less sorted out the indicators of fundamental analysis, and, as we can see, Gilead Sciences is quite attractive to the investor. But maybe it is not very attractive to the trader? However, I have good news for you, I do not do fundamental analysis without technical background. As follows from the daily chart (Fig. 1), in January 2020, the company's shares moved into an upward trend and in mid-March, against the backdrop of the development of the COVID-19 epidemic, peaked at $85.86, after which they began to decline. Unsuccessful recovery attempts were made in April and May, after which the company's shares gradually fell to the level of the semi-annual moving average line, while remaining in an upward trend, as evidenced by the established April low at $71.30. The closing of the price of the week below the level of 120 MA also did not occur. At the same time, the indicators of the RSI indicator (5) exceeded the indicators of the RSI indicator (20), which in my trading system implies a signal to buy #GILD shares. However, when deciding on the purchase of #GILD shares, traders should be guided by the signals of their own trading systems, observing the rules of money management and proceeding from the principle: the movement will continue until we get the opposite. Values of 85.60, 89.15 and 94.50 can be selected as targets. In case the company's shares decrease, losses must be recorded when the week price is closed below the 71 level, when the target is selected at a value of 85.60, or when the day price is closed below the level of 64, if the values 89.15 and 94.50 are selected as targets. Choosing a target at the level of 85.60 and setting a loss fixing point at level 64 will be the wrong decision, because profit should be greater than possible losses, which, however, does not prohibit early closure of positions in case the situation changes, unless, of course, the signals of the trading system indicate this, not the trader's intuition. The National People's Congress of China approved the National Security Act on Thursday, May 28, aimed at curbing separatist and subversive activities in Hong Kong. In response to the passage of the law, US Secretary of State Mike Pompeo said that Washington can no longer treat the former British colony as independent from Beijing, which violates its trade and financial status. Donald Trump's press conference is expected on Friday evening, and it is possible that the US president will announce new sanctions and tariffs on China. This could trigger a new round of trade war and a wave of decline in stocks across all global stock exchanges. However, despite concerns, investors are at a stage of optimism, primarily due to the actions of the US Federal Reserve and other central banks, which are taking measures to unprecedentedly pump markets with liquidity. On Wednesday, the European Commission adopted a package of incentive measures worth 750 billion euros, investors expect a similar step from the European Central Bank, a meeting of which should be held next week, June 4. Be careful and careful, let the coronavirus pass us. The material has been provided by InstaForex Company - www.instaforex.com |
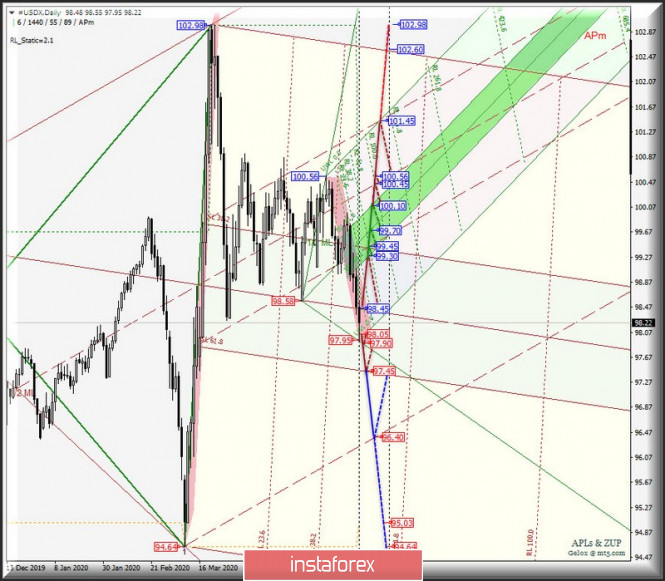
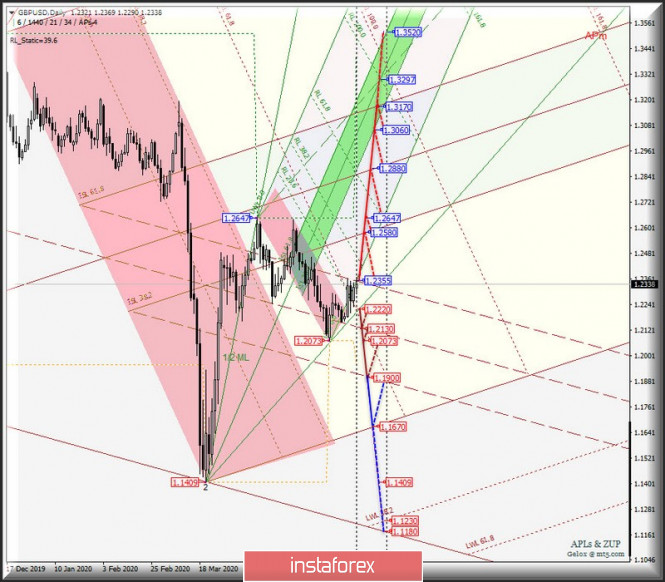
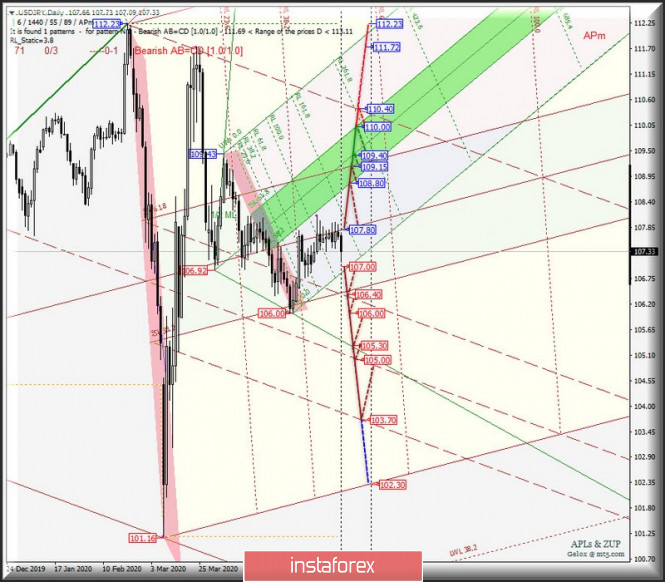
| Posted: 29 May 2020 09:57 AM PDT Minor operational scale (Daily) Options for the development of the movement #USDX vs EUR/USD & GBP/USD & USD/JPY (Daily) in June 2020 ____________________ US dollar index Starting June 1, 2020, the movement of the #USDX dollar index will begin to be determined depending on the direction of the breakdown of the range:
Breakdown of the Median Line Minor - resistance level 98.45 - development option of the upward movement of the dollar index to the borders of the equilibrium zone (99.30-99.70-100.10) of the Minuette operational scale forks and channel 1/2 of the Median Line (99.45-100.45-101.45) of the Minor operational scale forks. If the initial - SSL (support level 98.05) and control - LTL (97.90) of the Minuette operational scale forks are consistently broken, the downward movement of #USDX can be continued to the goals:
The markup of #USDX motion options in June 2020 is shown on the animated chart.
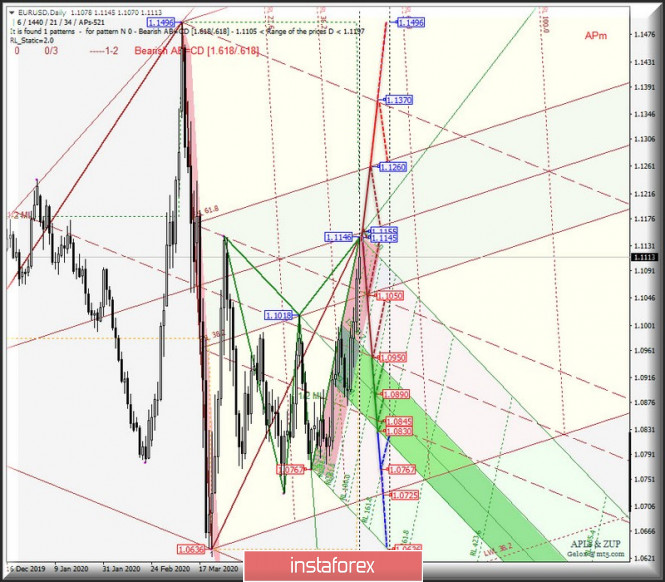
____________________ Euro vs US dollar From June 1, 2020, the single European currency EUR/USD will continue to develop movement in the equilibrium zone (1.1050-1.1155-1.1260) of the Minor operational scale forks - details of this movement within the specified balance zone are shown on the animated chart. A breakout of the lower border ISL38.2 equilibrium zone of the Minor operational scale forks - support level 1.1050 - will determine the further development of the movement of a single European currency within the boundaries of the channel 1/2 Median Line Minor (1.1050-1.0950-1.0845) and equilibrium zone (1.0950-1.0890-1.0830) of the Minuette operational scale forks. And if there is a breakdown of the resistance level of 1.1260 at the upper border of ISL61.8 of the balance zone of the Minor operational scale forks, then it will be possible to continue the development of the upward movement of EUR/USD to the final Shiff Line Minor (1.1370). The options for the EUR/USD movement in June 2020 are shown on the animated chart.
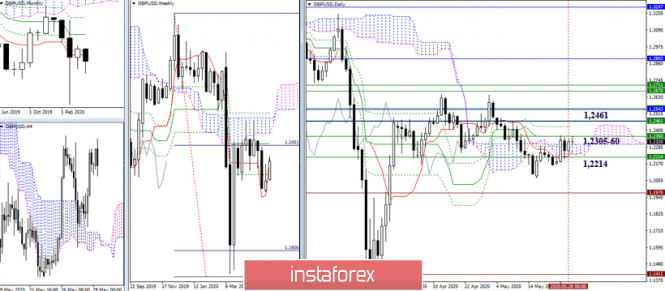
____________________ Great Britain pound vs US dollar The development of the movement of Her Majesty's currency GBP/USD/USD from June 01, 2020 will be due to the development and direction of the breakdown of the range:
If the control line of the LTL of the Minuette operational scale fork is broken, the support level of 1.2220 - the downward movement of the currency of Her Majesty can be continued to the goals:
In the case of breakdown of the upper border of the channel 1/2 Median Line Minor - resistance level 1.2355 - the upward movement of GBP/USD to the boundaries of the equilibrium zone of the Minor operational scale fork (1.2580-1.2880-1.3170) and Minute (1.3060-1.3297-1.3520). We look at the options for the GBP/USD movement in June 2020 on the animated chart.
____________________ US dollar vs Japanese yen Range development and breakdown direction:
If the resistance level of 107.80 breaks through on the Median Line Minor, the development of the upward movement of USD/JPY to the borders of the equilibrium zone will become relevant (108.80-109.40-110.00) of the Minuette operational scale forks with the prospect of reaching the final Shiff Line Minor (110.40). The breakdown of the initial line SSL of the Minuette operational scale forks - support level 107.00 - option of the movement of the currency of the "Land of the Rising Sun" to the borders of the channel 1/2 Median Line (106.40-105.00-103.70) of the Minor operational scale fork. The markup of the USD/JPY movement options in June 2020 is shown on the animated chart.
____________________ The review is compiled without taking into account the news background, the opening of trading sessions of the main financial centers, and is not a guide to action (placing "sell" or "buy" orders). Formula for calculating the dollar index: USDX = 50.14348112 * USDEUR0.576 * USDJPY0.136 * USDGBP0.119 * USDCAD0.091 * USDSEK0.042 * USDCHF0.036. Where the power coefficients correspond to the weights of currencies in the basket: Euro - 57.6 %; Yen - 13.6 %; Pound - 11.9 %; Canadian dollar - 9.1 %; Swedish Krona - 4.2 %; Swiss franc - 3.6 %. The first coefficient in the formula brings the index value to 100 on the starting date - March 1973 when the main currencies began to be freely quoted relative to each other. The material has been provided by InstaForex Company - www.instaforex.com |
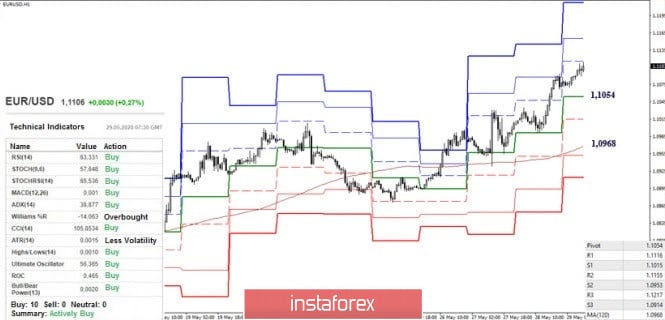
| May 29, 2020 : EUR/USD Intraday technical analysis and trade recommendations. Posted: 29 May 2020 08:50 AM PDT
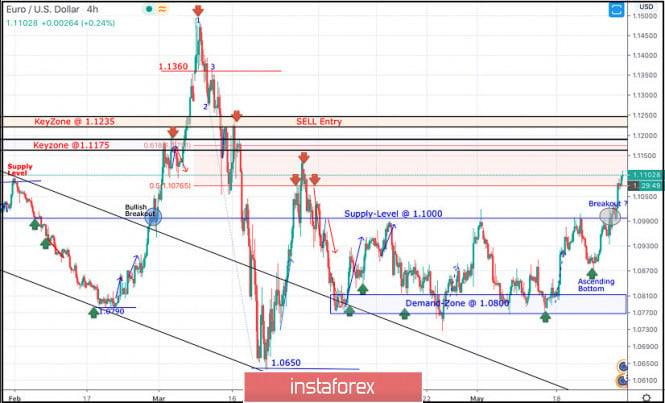
Bullish engulfing H4 candlesticks as well as the recently-demonstrated ascending bottoms indicated a high probability bullish pullback at least towards 1.0980 and 1.1075 (Fibo Level 50%). Shortly After, a bearish Head & Shoulders pattern was demonstrated around the price zone between (1.1075-1.1150). That's why, Further bearish decline was demonstrated towards 1.0800 where the nearest demand level to be considered was located near the backside of the broken channel (1.0800-1.0750). Evident signs of Bullish rejection have been manifested around the price zone of (1.0800-1.0750) leading to the recent bullish spikes up to 1.0990. On May 1, Lack of bullish momentum around 1.1000 lead to another bearish decline towards the depicted price zone around 1.0800. However, the price zone of (1.0815 - 1.0775) has been standing as a prominent Demand Zone providing quite good bullish support for the pair so far. Moreover, a recent ascending bottom has been established around 1.0870 which enhances the bullish side of the market in the short-term. Short-term technical bullish outlook remains valid as long as bullish persistence is maintained above the recently-established ascending bottom around 1.0850-1.0870. Currently, the recent bullish breakout above 1.1000 should be maintained to enhance further bullish advancement towards 1.1075 and 1.1175. On the other hand, any bearish breakdown below 1.0930 should be marked as an early Exit signal for all short-term BUY trades. Trade recommendations : Intraday traders are advised to wait for bearish pullback towards 1.1000 as a valid BUY signal. T/P levels to be located around 1.1075 then 1.1175 if sufficient bullish momentum is maintained while S/L to be located below 1.0900. The material has been provided by InstaForex Company - www.instaforex.com |
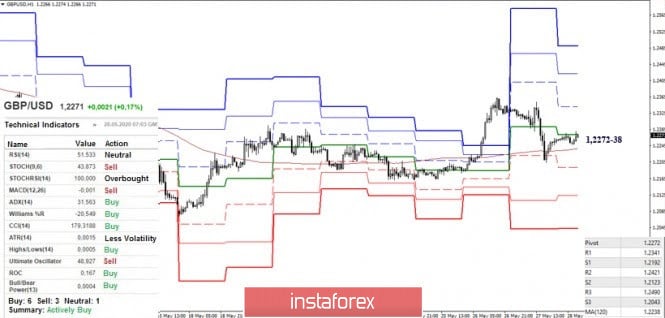
| May 29, 2020 : GBP/USD Intraday technical analysis and trade recommendations. Posted: 29 May 2020 08:31 AM PDT
Recently, Bullish persistence above 1.2265 has enhanced another bullish movement up to the price levels of 1.2520-1.2590 where significant bearish rejection as well as a quick bearish decline were previously demonstrated (In the period between 14th - 21 April). Recently, Atypical Bearish Head & Shoulders reversal pattern is in progress. The GBP/USD pair was recently demonstrating the Right Shoulder of the pattern. Hence, Bearish persistence below 1.2265 (Reversal Pattern Neckline) was needed to confirm the pattern. Thus, enhance another bearish movement towards 1.2100, 1.2000 then 1.1920. Two Weeks ago, the price zone of 1.2300-1.2280 corresponded to a short-term uptrend as well as a recently established demand zone where a low-risk short-term BUY trade could be taken. However, the recently demonstrated Lower High around 1.2440 invalidated the suggested short-term bullish trade. Shortly After, the price zone of 1.2300-1.2280 failed to provide enough bullish support for the pair. Recent transient bearish breakdown below 1.2265 should have been taken into consideration as it has temporarily confirmed the previously-mentioned reversal-top pattern. Hence, further bearish decline was expected to be enabled towards 1.2020 as a projection target for the reversal pattern. Currently, the price zone of 1.2300 - 1.2350 (Backside of the broken Uptrend) stands as a recently-established SUPPLY-Zone to offer bearish rejection and a valid SELL Entry for the pair in the short-term. Trade recommendations : Intraday traders can still consider the current bullish pullback towards the price zone of 1.2300-1.2350 as a valid SELL Entry. T/P level to be located around 1.2150, 1.2100 and 1.2000 while S/L should be placed above 1.2380. The material has been provided by InstaForex Company - www.instaforex.com |
| US-China conflict puts pressure on European stock market Posted: 29 May 2020 08:23 AM PDT
The growing tension between the US and China put pressure on European stock markets today. Most EU indices are declining, not paying attention to the positive side of the opening economies of many countries after the coronavirus pandemic. Market participants today are more engaged in the conflict between Washington and Beijing, which flared up against the backdrop of the adoption of a new bill designed to preserve and protect the national security of Hong Kong. Today, US President Donald Trump is expected to make an announcement on further actions in relation to China, which will act as a response to the plans of the Chinese authorities. China's attempt to expand its control over Hong Kong was met with extremely negative results by colleagues from America, after which there was a threat that some of the duties on Chinese goods, which were abolished earlier, could return again. Nevertheless, China did not refuse to create the law, which caused an even greater surge of negative emotions. At present, not only the United States but also Australia, Canada, and the United Kingdom express extreme concern about the planned release of the Hong Kong National Security Act. Germany's DAX index fell by 1.5% in the morning, France's CAC index fell by 1.3%. The lowest is the FTSE UK which fell by 1%. Italy's FTSE MIB Index fell 0.78%, while Spain's IBEX 35 Index lost 1.06%. The statistics, also received this morning, reflected the best dynamics of the European economy compared to preliminary assumptions of analysts. Thus, the level of German retail sales decreased by 5.3% compared with the previous month. Earlier, retail sales were expected to decrease by as much as 12%, but this did not happen. The economy of another European country, France, has also slowed down. The country's GDP fell by 5.3% compared with the previous three months, while experts expected to see a fall of at least 5.8%. However, this positive cannot be considered sufficient to support the stock market, if only because the French economy entered the recession for the first time in more than ten years. Negative emotions were added by the level of consumer spending in France, which last month showed a record drop for the entire period of statistics. The decrease amounted to as much as 20.2% against the data put forward in the forecasts of 14.7%. The general index of enterprises in the European Region Stoxx Europe 600 in the morning became lower by 1.13% and reached the mark of 351.45 points. The corporate sector is under the same pressure. Thus, the value of Renault SA securities fell by 3.2% immediately after it became known about the company's intentions to carry out a large-scale reduction of employees in all of its enterprises in the world. This measure acts as the only possible one in order to reduce the company's own expenses. Shares of another automaker from Germany - Volkswagen AG - are also falling. Today, they have already fallen by 2.6% amid news of the repurchase of 50% of the securities of the parent company. The shares of the UK construction company SIG Plc, on the contrary, show positive dynamics and grow today by 1.1%, despite the published information about the tax loss for the previous reporting year. Thus, it turns out that the last business day this week reflected an insignificant, but still negative external background, which could have an impact on the European stock market and made it rollback. The material has been provided by InstaForex Company - www.instaforex.com |
| Posted: 29 May 2020 07:47 AM PDT
The cost of crude oil at the beginning of trading this week was under significant pressure from several factors at once. The growth of stocks in America, the slowly increasing demand (fuel included), as well as the escalation of the conflict between the United States and China are just a few visible reasons for the continuation of the downward trend in the oil market. This morning, the price of futures for Brent crude oil for July delivery on a trading floor in London continued its fall yesterday, to which it added another -0.99%, or $ 0.33. Thus, the price dropped to the level of 34.94 dollars per barrel, which is lower than the closing on Thursday. Recall that the price of Brent at the end of the previous session gained 1.6%, or $ 0.5, which raised it to the mark of $ 35.29 per barrel. In addition, do not forget that contracts for delivery in July expire on Friday. Contracts for delivery in August are in great demand, but they fell in price by 0.8%, or 0.29 dollars, and began to cost 35.74 dollars per barrel. The price of WTI light crude oil futures for July delivery on the New York Stock Exchange also underwent a downward adjustment this morning. It fell by 1.6%, which is equivalent to $ 0.54, and this dropped contracts to the mark of $ 33.17 per barrel. Recall that yesterday's session ended with the growth of this brand by 2.7%, or 0.9 dollars, and its level was 33.71 dollars per barrel. Over the current month, oil has made it almost impossible but it somehow managed to grow significantly, which became a signal to exit the crisis stagnation. So, Brent increased in value by 39% in the total calculation, and WTI recorded a colossal price indicator of 76%. This is an excellent result, given the general geopolitical state and macroeconomic data. For four consecutive weeks, crude oil did not part with a positive trend, but the moment of decline somehow had to come sometime. The black gold market is taking a breath for the next flight, waiting for the prices of refining and marketing of petroleum products to catch up with those for crude oil. According to experts, in the long run, oil will have every chance to continue its rally, but in the near future, it is not worth betting on growth. There are several important reasons for this. First, yesterday's report by the Energy Information Administration reflected an increase in crude oil and distillate reserves in the United States. Moreover, the growth turned out to be quite substantial and unexpected for experts who, before that, unanimously claimed that it was worth waiting for the reduction. Against this background, the demand for oil products also looks rather weak and unstable, which, of course, is very sad for the market. Also, the fact that demand has not responded to the opening of the borders of several more states after the lifting of quarantine measures related to the COVID-19 pandemic, added more worry in the situation. It turns out that, despite the holidays, the inhabitants of America chose to stay home and not go anywhere in their cars, although analysts expected a different situation. Nevertheless, some positive is present here. On the territory of Cushing, which is a strategically important object not only for America, but also for traders, oil reserves have declined, and this is a good sign. Secondly, another important factor of pressure is the ever-new turns of the conflict between Beijing and Washington. Rising tensions are holding investors back from risky moves. Market participants were seriously worried about the Chinese side's decision to pass a bill protecting Hong Kong's national security. The American authorities regarded this step as a political and economic demarche and promised to introduce a response, drawing Beijing's attention to the fact that it was making a big mistake that would greatly affect relations at different levels between countries. As a response from the United States, the return of a portion of duties that had previously been canceled for goods from China could be made. In addition, Hong Kong risks losing its status as a global financial center, which does not suit the Chinese side at all. The third determining factor in the movement of oil quotes is the agreement between OPEC member countries to reduce the extraction of raw materials to maintain demand for it. Very soon (June 10), the next OPEC summit will take place, at which the main place will be occupied by the issue of extending the agreements on reducing oil production, adopted in May and June. Saudi Arabia urges all countries to continue the established quotas until the end of this year, but not all states support this policy. So, Russia is already expressing an unspoken desire to withdraw from the treaty. And since she is the largest participant, without her coalition forces will be very limited. No official statements on this subject have been made, but traders have already felt the tension from the current situation. The material has been provided by InstaForex Company - www.instaforex.com |
| Posted: 29 May 2020 07:46 AM PDT
Today's auction reflected a decline in the quotes of the greenback. Its price is falling relative to a larger number of major world currencies. The main attention of market participants focused on the conflict between Washington and Beijing, which is only gaining momentum and, apparently, will determine the movement of the quotes in different markets in the near future. Recall that the decision of China to pass a bill protecting the interests of the national security of Hong Kong caused a storm of emotions on the American side. Today, the American president is due to announce a new portion of sanctions designed to influence the Chinese government. Most analysts are confident that the answer will be tough due to the introduction of duties on part of the goods from China, which had previously been canceled during the bilateral agreement. The ICE index, which reflects the dynamics of the US dollar against a basket of six major world currencies, which include the euro, yen, Canadian dollar, pound sterling, Swiss franc, and Swedish krona, today showed a 0.2% drop, which made traders think. In general, the current week was not very successful for the greenback. Losses were recorded in relation to almost all significant currencies. The reasons for this should be sought in the gradual, however slow, but systematic removal of quarantine measures for the coronavirus pandemic. More pressure was exacerbated by the soft economic policies of European countries that are ready to begin implementing a new plan to stimulate the European economy. Thus, the demand for "safe havens" is falling, and investors are becoming more at risk. This morning, the single European currency against the dollar strengthened by 0.19%. The euro was at around 1.1098 dollars, while during yesterday's trading it stopped at 1.1077 dollars. The struggle of the euro against the dollar continues amid news of the creation of a special fund, where money tranches will be sent to support the economies of European countries that have been seriously affected by the pandemic. And sadly enough, there are still new numbers of positive cases up to this day, however, the outgoing statistics somehow gives encouraging results. For example, the decline in retail sales in Germany slowed down in the second spring month. Compared with the previous indicator, there was a decrease of another 5.3%. Making the drop in retail sales at 6.5%, which is much lower than the previously estimated 14.3%. US domestic economic indicators also cannot be called stable. As it became known, in the first quarter of this year, the US economy contracted by 5% per annum, although preliminary expert estimates did not reflect a fall in GDP of more than 4.8%. The price of the US dollar against the Japanese yen fell by 0.38% and reached the level of 107.24 yen per dollar. Recall that yesterday trading closed at 107.65 yen per dollar. The yen today has demonstrated its strength and rose against almost all significant currencies. Investors began to leave "in defense" in anticipation of Trumps' speech as confidence is lost, and you want to keep your own assets. In relation to the pound, the US dollar has already lost 0.27% today and is at the level of 1.2350 dollars per pound. Thus, the pound continues to move up amid an increasing trend towards the sale of the US national currency. Nevertheless, the British counterpart also could not do without the pressure that came from speculation about the possible introduction of negative interest rates, as well as the lack of movement in negotiations with the European Union about conducting trade. Australia's national currency grew by about 0.17% against the dollar and was at the level of 0.6656 in Australian dollar. This rise of the Aussie was the highest in the last few months. The New Zealand dollar, which also became stronger against the American, followed his lead. He took the mark of 0.6214 dollars for the Qiwi, which brought him closer to the maximum level recorded in the first month of spring. In Australia and New Zealand, a steady recovery in business activity is observed, which indicates the growth of economies and becomes a negative factor for the US dollar. The greenback is also declining in relation to the Swiss franc. The fall already amounted to 0.9%, which forced the greenback to take the line at 0.9627 per franc. The dollar was stable in relation to the Chinese yuan. It remained virtually unchanged at 7.1463 yuan per dollar. The material has been provided by InstaForex Company - www.instaforex.com |
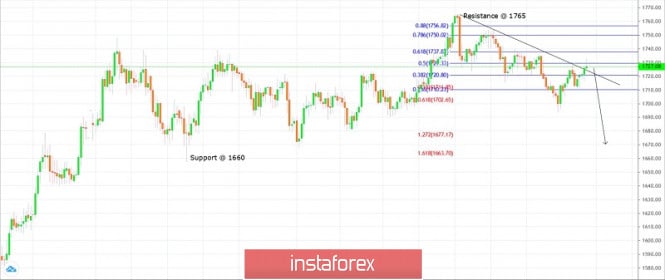
| Trading plan for Gold for May 29, 2020 Posted: 29 May 2020 06:27 AM PDT
Trading plan: Gold continues to print lower highs and lower lows since $1,765 resistance. After printing fresh lows at $1,694 yesterday, the yellow metal had rallied higher to produce a counter trend rally. It has reached the fibonacci 50% retracement of the entire drop between $1,765 and $1,664 around $1,732 and is seen to be reversing lower now. The metal is seen to be trading at around $1,727 at this point in writing and is expected to continue lower towards $1,660, going forward. Also note that Gold has tested the past support turned resistance around $1,732 along with the dropping resistance trend line. High probability remains for a turn lower towards $1,660 in the next few trading sessions. Trading plan: Remain short, stop @ 1,765, target @ 1,660 Good luck! The material has been provided by InstaForex Company - www.instaforex.com |
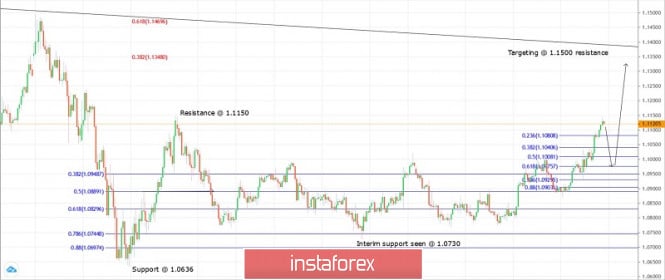
| Trading plan for EUR/USD on May 29, 2020 Posted: 29 May 2020 06:17 AM PDT
Technical outlook: EUR/USD printed an intraday high around the 1.1150 level and pulled back sharply. The overall trend looks encouraging for bulls but we can expect a short corrective drop as shown on the chart. The recent boundary which is being worked upon is between 1.0870 and 1.1150. A 61.8% drop would bring EUR/USD to the 1.0975 level as you can see on the chart. We can expect a bullish bounce there. The uptrend may resume. Furthermore, the past resistance turned into support. It can also be seen near 1.0975. It is highly possible that the level could become a reversal zone. Looking at the overall structure, EUR/USD is expected to remain under control of bulls until it hits 1.0636. Trading plan: Remain long, stop is at 1.0630, target is at 1.1500 Good luck! The material has been provided by InstaForex Company - www.instaforex.com |
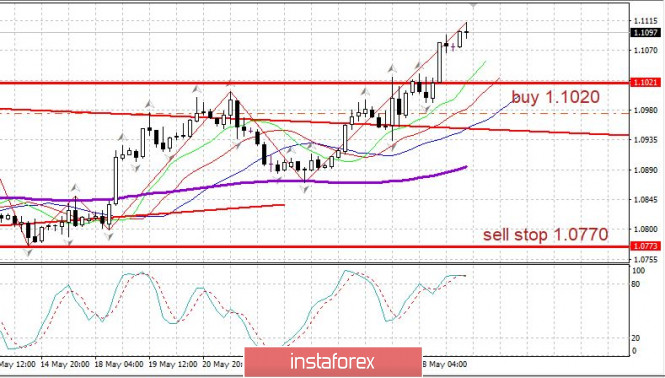
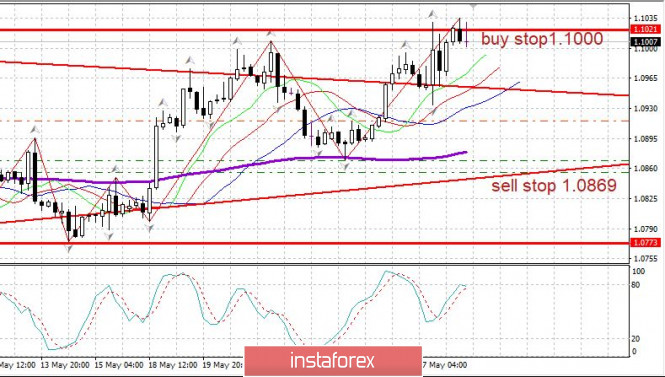
| Evening review on EURUSD for May 29, 2020 Posted: 29 May 2020 06:17 AM PDT
EURUSD: There is a signal of an upward movement, thus, we wait for a strong pullback for purchases. In the morning we recorded a profit on purchases. However, at present, there are no open positions.
US Consumer Income / Expense Report for April Released: Revenue dropped to -10%, while cost dropped to -13%. RFE inflation fell to -0.4%. EURUSD: consider purchases from a strong pullback, at least from 1.1040 and below. The material has been provided by InstaForex Company - www.instaforex.com |
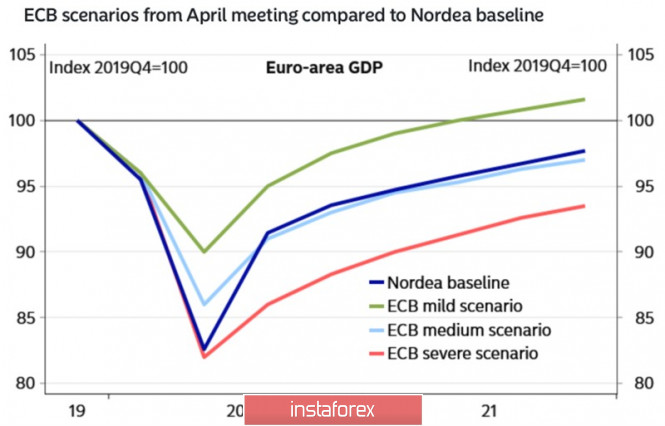
| Euro got up and powerfully answered Posted: 29 May 2020 06:07 AM PDT The end of spring has become a real benefit for the single European currency. In the week to May 29, it managed to show growth against the US dollar for all five trading days, even though US stock indices did not always support the "bulls" for EUR/USD. While the S&P 500 weighed what was more important, the opening of the US economy or Donald Trump's response to China for Hong Kong, the euro grew due to Germany's desire to save the Eurozone. The joint project of Angela Merkel and Emmanuel Macron became a reality even before the June EU summit. The European Commission has announced a €750 billion bond issue and an additional €1.1 trillion budget to provide all possible assistance to the countries affected by COVID-19. The Germans, with their potential economy sagging by a maximum of 5-6% at the end of the year, a small share of public debt in GDP, a surplus budget and capital inflows to the local debt market (as it happens, during periods of global downturns, investors flee to safe-haven assets, which in Europe are German bonds) could easily cope with a recession. For comparison, according to preliminary estimates by Christine Lagarde, the Eurozone economy will shrink by 9-12%, and the ECB forecasts an increase in Italy's debt to 160%, Greece - to 200% of GDP. Dynamics of European GDP
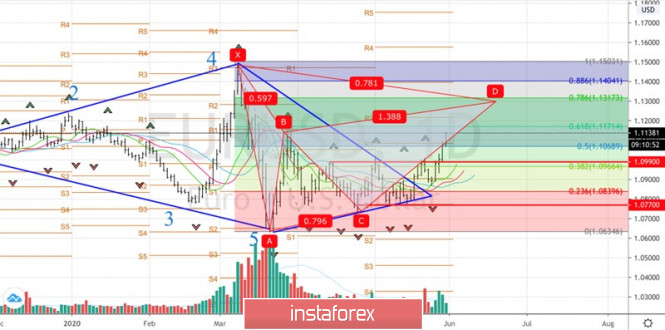
If Germany were to side with Austria, the Netherlands, Sweden, and Denmark, which do not want to give grants to the poor south, a split in the ranks of the currency bloc could lead to the return of Italy and other countries to their national monetary units. This did not happen, and EUR/USD rushed up on the euphoria of a large-scale fiscal stimulus and unity in the EU. Curiously, even the expectations of the expansion of the ECB's emergency program of quantitative easing at the June 4 meeting from € 750 billion to the expected € 1,250 billion do not bother the "bulls" in the euro. Currencies react differently to the same factors in a downturn and recovery of the global economy. When it grows, monetary expansion becomes a reason for selling, on the contrary, in times of recession, the market is flooded with hopes that a large-scale stimulus will not allow GDP to sink deep. Along with the expansion of QE, Christine Lagarde can state that the asset purchases will not be completed in December. Investors are waiting for the Frenchwoman to respond to the German Constitutional Court, although she has previously said this. The ECB is accountable to the European Parliament and is guided by the verdict of the European Court of Justice, which recognized QE as legal in 2018. Thus, the euro is basking in the rays of glory at the end of spring, but if the US stock indices go down, the "bears" for EUR/USD may come to their senses. The main danger comes from Donald Trump, who at a press conference on May 29 will report on the response of the White House to China's aggressive policy towards Hong Kong. If his speech frightens the S&P 500, I recommend fixing part of the profit on the euro longs formed on the breakout of the $ 1.099 level. In the opposite case, positions should be held until the target is reached at $ 1.13. The Gartley pattern target is located near this mark. EUR/USD, the daily chart
|
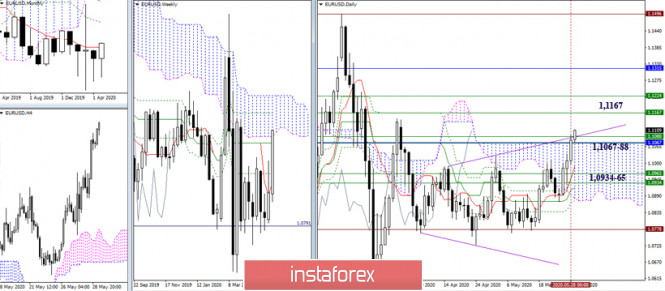
| EUR/USD and GBP/USD on May 29 - results of the analysis of the COT report (Commitments of Traders) Posted: 29 May 2020 06:06 AM PDT EUR / USD and GBP / USD on May 29 - technical analysis recommendations EUR / USD Bulls, having the support of the major players in the COT report last May 19, 2020, lived up to expectations and were the leaders of the movement throughout the current week, allowing bears only minor corrections and retests. Now, the most important action is to optimistically close the week and the month of May, forming the shortest upper shadow corresponding to the candles. The technical picture of the euro at the moment is the test of the most important resistance area 1.1067-88 (the upper border of the daily cloud + weekly Kijun and Senkou Span A + monthly Tenkan), to which the pair may form good prerequisites of a breakout, but the result of the interaction will be formed later. Such will determine the further prospects of the situation. The support for the central pivot level worked out to maintain a bullish mood in the lower time frames yesterday. Thus, the upward trend remains active today, supported by all analyzed technical analysis tools. The resistances of the classic pivot levels on H1 are now located at 1.1116 - 1.1155 - 1.1217, with key support settled at 1.1054 (central pivot level) and 1.0968 (weekly long-term trend), and intermediate support at 1.1015 (S1). Testing the weekly long-term trend, as well as a consolidation below it, will serve as a catalyst for rebound from the resistance level usually reached in the higher time frames. Thus, today, it is again advisable for bulls to successfully close the week and month with a downward correction, limiting the support in the central pivot level (1.1054). GBP / USD The absence of a significant advantage and convincing preferences among major players in the last COT report promised the continuation of the struggle. Bulls, as expected, tried to take the initiative, but were stopped by the key resistances, led by the daily Kijun (1.2360). The results for today will be indicated by the size of the upper shadow of the weekly candle, as well as the lower shadow of the monthly candle. In the lower time frames, the pair maintains support for the key levels, but players are still unable to go beyond the correction zone (1.2362). As a result, preferences were divided, with the technical indicators signalling a bearish mood, while the key support on H1 still try to defend the bullish mood of the players. Quotes are now at 1.2300 (central pivot level) and 1.2257 (weekly long-term trend), but a consolidation below promises a return of bearish mood and prospects. Ichimoku Kinko Hyo (9.26.52), Pivot Points (classic), Moving Average (120) The material has been provided by InstaForex Company - www.instaforex.com |
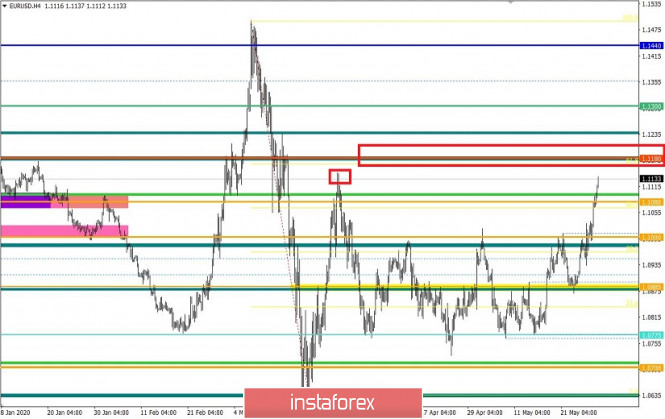
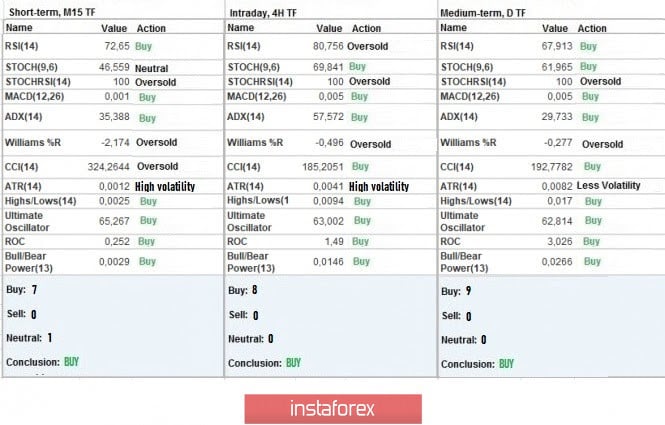
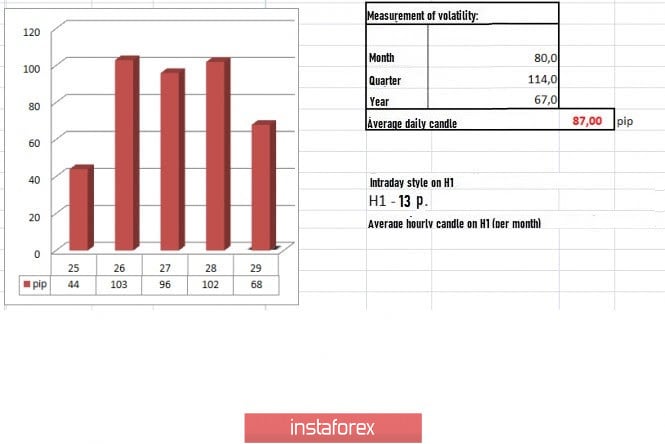
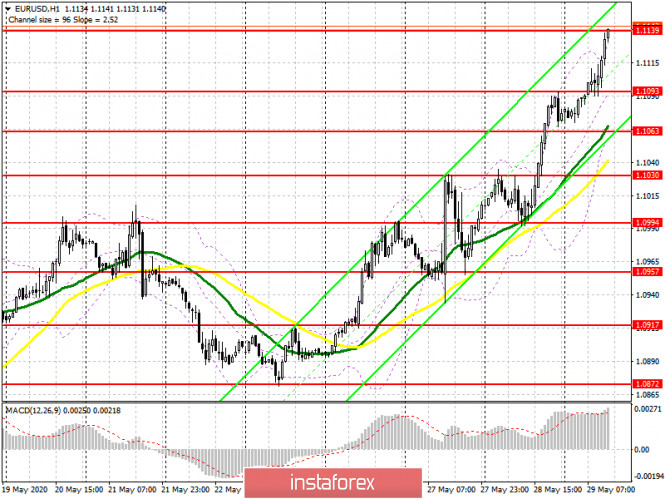
| Trading recommendations for EUR/USD on May 29, 2020 Posted: 29 May 2020 05:13 AM PDT From the point of view of complex analysis, we can see the first radical change in the trading chart in two months. The trading week is drawing to a close, so it's time to take preliminary results. The past trading days were extremely dynamic. Market participants opened long positions from the pivot point 1.0885, pushing quotes quickly to the upper border of the flat 1.0775 // 1.0885 // 1,1000. Quotes then manage to break out of the channel, recording the first radical change in the market for two months. The flat, which held back market participants for a long time, no longer plays a huge role in the market. The bearish mood was already discussed before, but was not counted on due to the crisis caused by the coronavirus pandemic. Thus, everyone was surprised with the impressive movement, bringing forth questions such as: what has changed? And have the effects of quarantine in Europe disappeared? In addition, the global trend remains downward, so the baffling baffling upward trend of the euro really shocked investors. With this activity, only one conclusion can be drawn. Trading positions at the present time should be considered exclusively with a local perspective, before the normalization of the situation in the world relative to the current crisis. That is, it should not be ruled out that soon, quotes will again return to the area of 1.0775 or lower, and then return back to the original coordinates. Analyzing the past trading day in detail, we can see that the surge in long positions took place on 15: 00-19: 00 (UTC + 1), during which the quotes broke out of 1.100, the upper border of the flat, and headed towards the next level at 1.1080 and consolidated above it. In terms of volatility, the dynamics remain stable, in which the daily indicator does not fall below 80 points. This indicates an acceleration in the market. As discussed in the previous review, traders considered price fluctuations within the range of 1,0990 / 1,1040, working on the breakout of quotes from the established boundaries. The trading idea on Thursday regarding local operations from the borders 1.0990 / 1.1040 was successfully conducted, which increased the trade deposit. [Buy positions were opened above 1.1045, towards 1.1080] Meanwhile, looking at the daily chart, we can see that the fluctuation of quotes, which began on March 20, signals a bullish mood, particularly if quotes consolidate above 1.1180. The news published yesterday contained important macroeconomic data on the United States, which played a major role in the dynamics of the market. A strong impact on market participants was made by the second estimate of US GDP for the first quarter, where the economic slowdown was -5.0%, up from the forecast of -4.8%. Data on durable goods was also published, which revealed a -17.2% drop in the index. With such indicators, recovery of market sales seem far to reach, especially since housing transactions also recorded a decline of -33.8%. Although the data led to a sharp weakening of the US dollar, the statistics help normalize the market sentiment. The weekly report on US unemployment was also published yesterday, from which, for the first time in ten weeks, the number of repeated applications did not grow, but was still catastrophic at 21,052,000. Initial applications, meanwhile, turned out worse than the forecast, but nevertheless decreased from 2,446,000 to 2,123,000. Based on the report of the US Fed, the mass unemployment is compounded by the fact that many people in the country do not want to go back to work. The reasons for which are: health problems, difficulties arising from the inability to leave children unattended (kindergartens, schools and summer camps are still partially limited), and too generous unemployment benefits. In Europe, Commissioner for Trade Phil Hogan said that England had already abandoned the prospect of concluding a trade agreement with regards to Brexit, revealing that there was no progress in the negotiations. "At present, we are not making significant progress. Perhaps, the United Kingdom has come to the conclusion that there will be no deal, "the Commissioner said. "Nevertheless, we hope that on the part of the UK, we will see more efforts than we have seen so far to advance on certain issues. Speed is important because time is short, "he added. A new round of negotiations regarding Brexit is scheduled for June 1. It is in many aspects, decisive, since the extension of the transition period is coming to an end. For this reason, British Prime Minister Boris Johnson is planning to personally visit Brussels in the second half of June to resolve issues. Meanwhile, the preliminary data on inflation in Europe was published today, where a decrease from 0.3% to 0.1% was recorded, up from the forecast of 0.2%. The inflation figures are indicators for the ECB, from which they base on the actions they take for economic recovery. The upcoming trading week promises to be busy. Data on the PMI is expected to come out at the beginning of the week, after which the report of ADP on US unemployment will be published on Wednesday. Meanwhile, the ECB will conduct its meeting on Thursday, and on Friday, the Department of Labor will release its report on US unemployment. The most important events next week are listed below: (UTC + 1) Monday, June 1 EU 09:00 - Manufacturing PMI (May) US 15:00 - ISM manufacturing index (May) Wednesday, June 3 EU 10:00 - Unemployment rate (Apr) US 13:15 - ADP national employment report US 15:00 - Volume of industrial orders (m / m) (Apr) Thursday, June 4 EU 10:00 - Retail Sales (YoY) (Apr) EU 12:45 - ECB meeting EU 13:30 - ECB press conference US 13:30 - Applications for unemployment benefits Friday, June 5 US 13:30 - US unemployment report (by the US Department of Labor) Further development Analyzing the current trading chart, we can see the upward trend, during which the quotes consolidated above the level of 1.1080 and moved upwards even further. Market participants seem to have aimed for the local high of March 27 - 1.1147, which is the level of the earlier fluctuations. The main resistance most likely will be the level of 1.1180, where stops were systematically placed. It seems that the bearish mood will remain for a long time, so carefully analyze the dynamics within the range 1.1150–1.1190. Lookout for slowdowns and possible rebounds. Based on the above information, we derived these trading recommendations: - In case of a slowdown, open sell positions in the area 1.1150-1.1190. - Open buy positions towards 1.1150-1.1190. Indicator analysis Analyzing the different sector of time frames (TF), we can see that due to the latest movement of the quotes, the indicators of the technical instruments unanimously signal a bullish mood. Volatility per week / Measurement of volatility: Month; Quarter Year The measurement of volatility reflects the average daily fluctuation calculated by Month / Quarter / Year. (May 29 was built, taking into account the time of publication of the article) Volatility is currently 68 points, which is already a lot for this time period. Thus, we can assume that speculative sentiment will continue to maintain acceleration status. Key levels Resistance zones: 1,1000 ***; 1.1080 **; 1,1180; 1.1300; 1.1440; 1.1550; 1.1650 *; 1.1720 **; 1.1850 **; 1,2100 Support areas: 1.0850 **; 1.0775 *; 1.0650 (1.0636); 1,0500 ***; 1.0350 **; 1,0000 ***. * Periodic level ** Range Level *** Psychological level The material has been provided by InstaForex Company - www.instaforex.com |
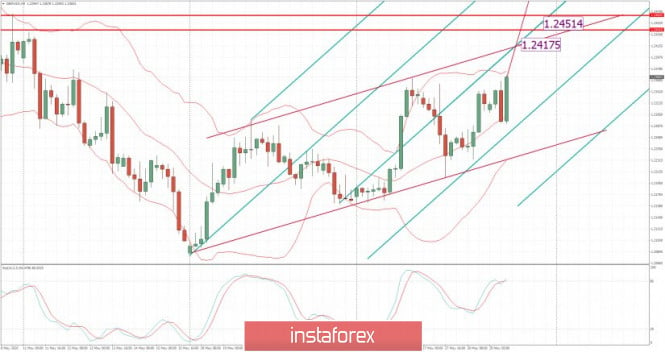
| GBP/USD analysis for May 29, 2020 - Strong upside momentum and potential for test of 1.2450 Posted: 29 May 2020 05:13 AM PDT NEWS:
Technical analysis: Trading recommendation: Watch for buying opportunities on the dips and upward targets at 1,2417 and 1,2450. There is the confirmed upward trend in the background and strong upward momentum. The material has been provided by InstaForex Company - www.instaforex.com |
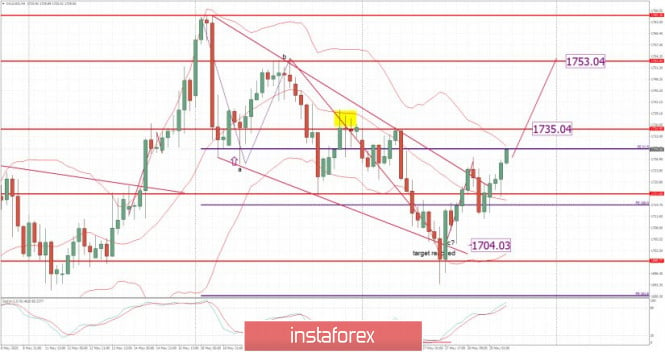
| Posted: 29 May 2020 05:05 AM PDT Corona virus summary:
The number of Americans who have lost their jobs in the past 10 weeks soared to more than 40 million as the number of unemployment claims continued to rise with 2.1 million people filing for unemployment last week. The staggering job losses mark a grim milestone in theeconomic crisis that has gripped the US since the coronavirus triggered widespread shutdowns and stay-at-home orders in an effort to halt the spread of the deadly pandemic. The latest figures from the Department of Labor show that the rate of new unemployment claims has continued to fall over the last few weeks, down from its peak in early April, when 6.6 million Americans filed for unemployment in a single week. Technical analysis: Trading recommendation: Watch for buying opportunities on the dips and upward targets at $1,735 and $1,753. The material has been provided by InstaForex Company - www.instaforex.com |
| Posted: 29 May 2020 04:57 AM PDT Corona virus summary:
According to an official announcement on the website of the UK Government, authority "unlocked" £150 million from dormant accounts "for coronavirus response." Despite the word selection, to many, this sounds much like the Government seized this amount from accounts that were inactive over a certain period. This all is made possible under the so-called Dormant Asset Scheme in the UK, which is planned to expand its purview over a "range of financial assets." An interesting take on this is provided by a recent report from Zero Hedge, which outlines that this scheme steps on the principles of laws that were prevalent back in feudal times. Among the main issues with that, apart from the fact that the Government has a legal claim over private property, is the fact that the "dormant bank account" rules can be "incredibly loose." Technical analysis: Trading recommendation: The material has been provided by InstaForex Company - www.instaforex.com |
| EUR / USD: Euro's continuous growth still uncertain Posted: 29 May 2020 04:06 AM PDT
A statement by the European Commission on the issuance of bonds worth € 750 billion allowed the EUR / USD bulls to push quotes above the 11th figure, while even the disappointing statistics for the United States did not help their opponents. The decline in US GDP in January - March was stronger (-5% on an annualized basis) than previously expected (-4.8%), while the number of applications for unemployment benefits in the country over the past ten weeks exceeded 40 million. Talks about unity in the Eurozone still remains, and euro fans continue to savor the EU's plans to save the region's economy. Although the economic rebound from the bottom in May in the eurozone turned out to be modest, this did not prevent the EUR / USD bulls to gain an advantage. If earlier Germany, the main payer to the EU budget, actively resisted a large-scale fiscal stimulus, then at the end of spring the situation would have changed dramatically. It is possible that the German government felt guilty for the controversial decisions of the country Constitutional Court, which could well split the eurozone. The Commission's ambitious plan assumes that Italy and Spain will receive the main preferences, for which grants and cheap loans in the amount of € 313 billion are reserved. If earlier the southern countries feared that their debts would grow by leaps and bounds, now they have the opportunity to receive part money for free. The final decision on the proposal is set at the EU summit on June 19 and market participants believe that there will not be any possible hindrances with its approval. The success of the euro could be more impressive if it were not for the US stock market to stop growing, which was seriously appalled by Donald Trump's promise to give an answer to the adoption of China's national security law in Hong Kong in the near future. This city-state is a kind of gateway to China for investors from the United States. The outflow of Washington, frightened by potential sanctions, threatens a new tsunami for US stock indexes. According to JP Morgan, it's time to take profits on American stocks. MUFG experts, in turn, note that so far the hopes for a recovery in the US economy are strong enough, however, as investors become more concerned about the deterioration of relations between Washington and Beijing, they will gradually fade away, which will lead to an increase in demand for safe-haven assets. The single European currency is strengthening against the US dollar for the fourth day in a row, and the next significant level for it is $ 1.1200. Closing the week and May above the 200-day moving average and a round mark of $ 1.1100 would indicate a breakdown of the downward trend formed at the beginning of 2018. However, the euro is showing very volatile growth, which is based only on technical factors and short-term impulses and does not take into account the weakness of fundamental indicators, as well as the high risks of expanding disputes between the US and China. This is a rather unstable platform which at any moment can get out from under the feet of the EUR / USD bulls. Also, the single European currency will be vulnerable to headlines in the press if the EU member states speak out against the recovery plan proposed by the European Commission. In addition, next week the ECB is likely to increase the volume of the bond redemption program and publish very gloomy forecasts, which will jeopardize the EUR / USD rally. The material has been provided by InstaForex Company - www.instaforex.com |
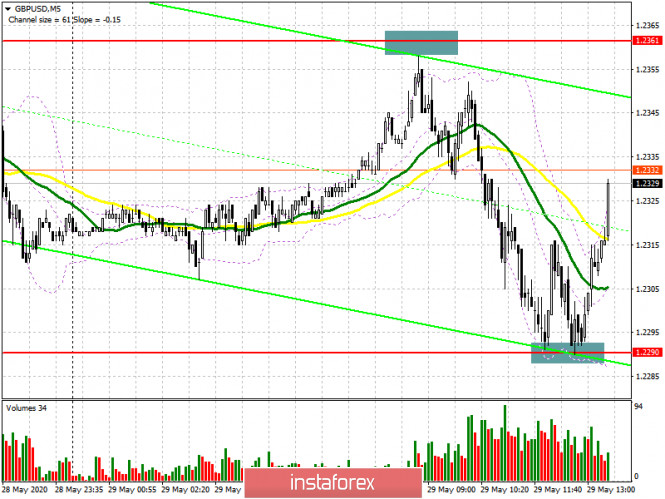
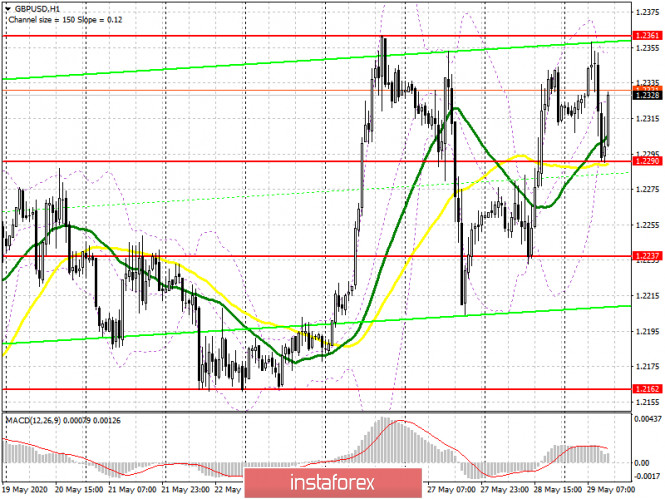
| Posted: 29 May 2020 04:00 AM PDT To open long positions on GBPUSD, you need: From a technical point of view, nothing changed in the first half of the day. And if you did not manage to sell the pound (and did everything correctly, there is no need to hurry) when approaching the resistance of 1.2361, which was just a couple of points short of the test, then you just had to act when updating the support of 1.2290, which I paid attention to in my morning forecast. Looking at the 5-minute chart, you can see how the bulls returned to the market after the repeated test of the minimum of 1.2290, which led to another upward wave in GBP/USD. At the moment, the task of buyers remains the same. A breakout and consolidation above this week's maximum in the area of 1.2361 will lead to a further major upward trend of GBP/USD, formed on May 15 this year with the update of the levels of 1.2423 and 1.2463, where I recommend fixing the profits. If the pressure on the pound returns in the second half of the day, I recommend considering new long positions only after another false breakout is formed in the area of 1.2290 or buy GBP/USD immediately on the rebound from the support of 1.2237, with the aim of an upward correction of 20-30 points at the end of this week.
To open short positions on GBPUSD, you need: The task of sellers for the second half of the day is to form a false breakout in the area of this week's maximum, where the resistance of 1.2361 passes. However, this will happen only if there are good data on the level of income and spending of Americans, which should be better than the forecasts of economists. Only this will increase the pressure on the pound, but no less important task of the bears, which they failed to cope with in the first half of the day, is the return of GBP/USD to the support area of 1.2290 and its breakdown since only fixing below this range can lead to the formation of a new downward momentum that can break below the area of 1.2237. In the scenario of growth above the maximum of this week, it is best not to rush to open short positions but wait for the update of the levels of 1.2423 and 1.2463, where you can sell immediately for a rebound in the expectation of correction of 20-30 points at the end of the day.
Signals of indicators: Moving averages Trading is conducted in the area of 30 and 50 daily averages, which indicates an active confrontation between buyers and sellers. Note: The period and prices of moving averages are considered by the author on the hourly chart H1 and differ from the general definition of the classic daily moving averages on the daily chart D1. Bollinger Bands A break in the lower border of the indicator at 1.2290 will increase pressure on the pair, while a break in the upper border of the indicator at 1.2355 will lead to a larger increase in the pound. Description of indicators
|
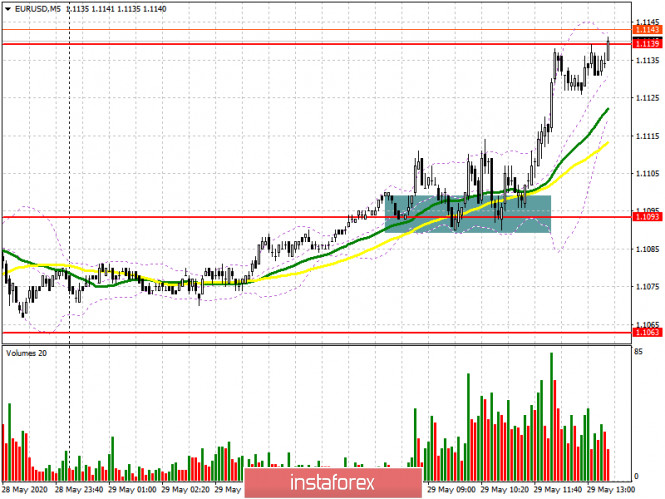
| Posted: 29 May 2020 03:58 AM PDT To open long positions on EURUSD, you need: The report on retail sales in Germany was much better than economists' forecasts. Although sales declined, demand for the euro resumed amid the belief that the Eurozone economy will be able to better survive the crisis, which is expected. A good buy signal was formed in the first half of the day at the level of 1.093. I paid attention to it in the morning forecast. If you look at the 5-minute chart, you will see a breakout and consolidation above the level of 1.093. The bears tried to break below this range tow times, however, they failed, which led to the continuation of the upward trend and the maximum test of 1.1139. At the moment, trading is conducted around this level and further movement will depend on the data on the US economy, as well as on whether the bulls will be able to gain a foothold above this range. Only by analogy with the morning situation around 1.093, I recommend continuing to open long positions above the resistance of 1.139 with the main goal of updating the maximum of 1.1231, where you can fix profits. If there is no active growth of EUR/USD above 1.139 in the second half of the day, it is best to postpone purchases and wait for the correction of the euro to the support area of 1.1093 or open long positions immediately to rebound from the larger lows of 1.1063 and 1.1030. And the lower the better, since it is not known what Donald Trump will say during his press conference on the situation in China.
To open short positions on EURUSD, you need: Sellers tried to stop the bull market, however, it did not lead to anything good. A slight pause after the resistance test of 1.1139 was quite expected, as I mentioned in the morning forecast. Now the bears need to wait for the release of fundamental statistics on income and spending of Americans, as well as the speech of the US President. The formation of a false breakout in the resistance area of 1.1139 will be the first signal to open short positions, which will be the support of 1.1093. Only fixing below this level will lead to a more serious sale of EUR/USD in the area of the lows of 1.1063 and 1.1030, where I recommend fixing the profits. In a scenario of further growth of the euro in the second half of the day, the short position is better to get back on the rebound from the high of 1.1231 not a correction of 20-30 points by the end of the week.
Signals of indicators: Moving averages Trading is conducted above the 30 and 50 daily moving averages, which indicates the continuation of the bull market. Note: The Period and prices of moving averages are considered by the author on the hourly chart H1 and differ from the general definition of the classic daily moving averages on the daily chart D1. Bollinger Bands If the euro falls, the lower border of the indicator around 1.1063 will provide support. Description of indicators
|
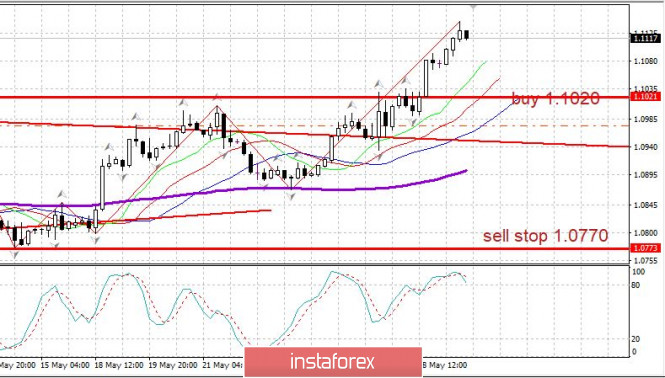
| Trading plan for May 29, 2020: EUR/USD - take profit!; Coronavirus updates from around the world. Posted: 29 May 2020 03:38 AM PDT
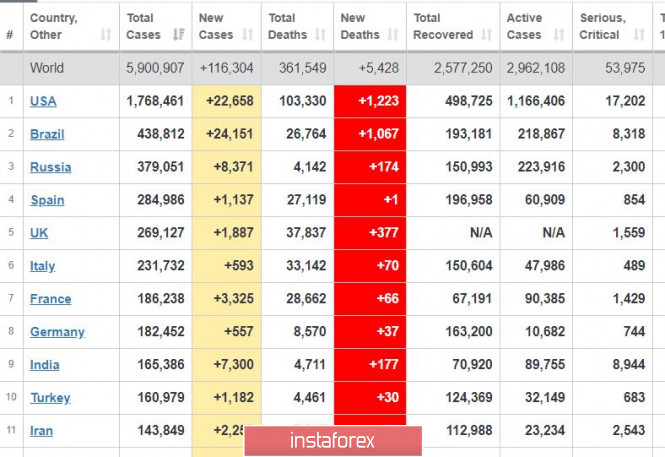
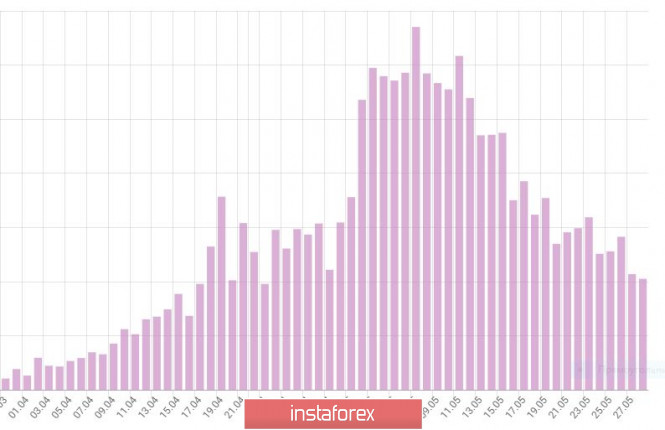
Coronavirus updates from around the world, as of May 29: the second wave is on the decline, but a third is possible. In the US, the number of new cases jumped to 22 thousand, and the number of deaths arose to more than 1,000 per day. Regions recorded these increases, with New York contributing about 10% of the cases. A record-increase was also observed in Brazil, with new cases jumping to 24 thousand. Developed countries are suggested to help Brazil with doctors and funds. Meanwhile, India will be declared as the new center of the pandemic, if the situation in the country continues to deteriorate (if the growth of new cases accelerate even further). Although there is a decline in deaths around the world (deaths in the US have decreased), new cases are still at a high level (particularly in Brazil and India). In Russia, the situation in Moscow has improved, but the statistics in other regions seem to have increased. In total, Russia records 387 thousand coronavirus cases, of which 224 thousand are "active".
EUR/USD - take profit! Open buy positions from 1.0855. At the time of this writing, the quotes are at 1.1100, so wait for the pair to move about 245 pips before closing. Such is a decent profit so we are taking it. Open buy positions from a rollback from 1.1020. US economy: the weekly data on US unemployment was published yesterday, which revealed 2.1 million new unemployed, and 21 million total unemployed. Orders for durable goods in April also dropped to -17%, but without transport is -7.4%. Sale of houses in the secondary market also fell by -21.8%. The material has been provided by InstaForex Company - www.instaforex.com |
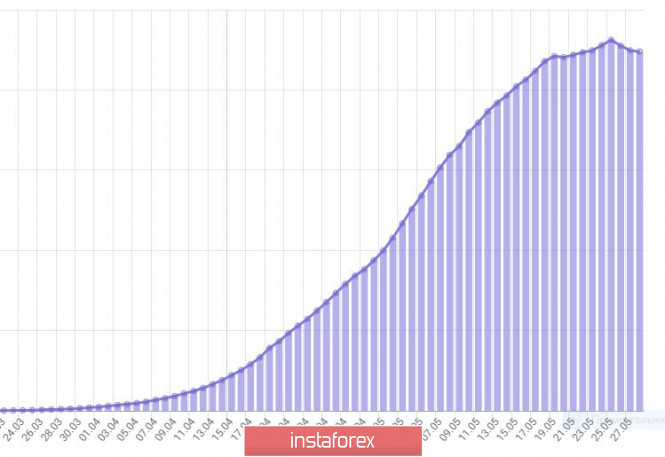
| Posted: 29 May 2020 03:11 AM PDT As we can see on the chart, in Moscow, the daily rise in the number of new cases slashed to 2,000 people a day. The number of cured people exceeds 3,000. That is why the city's authorities have deiced to soften the lockdown measures from June 1 st. It means that non-food stores and a part of the service sector will reopen. People will be able to go for a walk three days a week and to do sport until 9 a.m. Moreover, there is no need to request a pass to leave homes. The regime will be in force until June 14th. This is a chart of all active virus cases in Russia. We can see that the situation is stabilizing somehow. However, we should take into account that the chart also reflects a decline in Moscow. Thus, in other regions there still a rise in the number of active cases. That is why Russia's president asked Sobyanin to send doctors and resources to a number of regions, including Dagestan, Voronezh, and Pskov region. In my opinion, restrictive measures in these regions were not enough to contain the virus spread. Moreover, these regions have weak healthcare infrastructure. At the same time, in Saint Petersburg, the number of active virus cases totals 10 thousand that is ten times less than in Moscow. Let's take a look at the Russian ruble. The currency hit the record highs against the US dollar and the euro. The ruble is expected to held such positions until a new wave of weak oil prices and a slump in the US market. Nevertheless, it is inevitable. However, it is a good idea to buy the euro and the US dollar for the rubles at the moment. Dynamic of the EUR/USD pair depends on the US labor market data that is due for release on Thursday. Buy positions can be opened from 1.0855, if the pair drops to 1.0870. The material has been provided by InstaForex Company - www.instaforex.com |
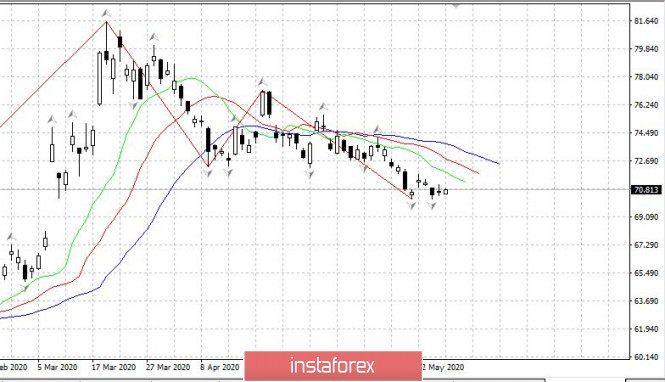
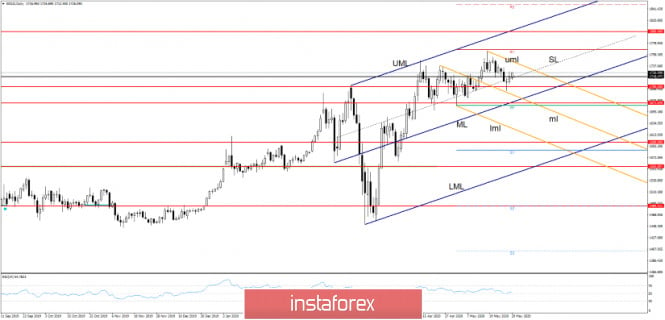
| Posted: 29 May 2020 03:07 AM PDT Gold is trading in the green for a second session after the temporary correction, the price has managed to stay above the $1,700 level signaling that the outlook is still bullish. The tensions between the US and China and the global economy slow recovery has pushed the price higher again. COVID-19 lockdown measures were eased lately, but unfortunately, the risk is high as the global economy could step into recession. The current US depreciation pushes the gold price higher in the short term.
The gold price has decreased a little in the short term but has failed to close below the $1,700 psychological level and to stabilize below the inside sliding line (SL) of the ascending pitchfork. As you already know from my analysis, the outlook is bullish as long as the price is traded somewhere above the $1,700 - $1,666 area. I've drawn a minor orange descending pitchfork to catch a potential corrective phase, but the failure to reach the median line (ml) has invalidated a significant drop. A further increase followed by a valid breakout above the upper median line (uml) of the minor orange descending pitchfork will validate a further increase towards the R1 ($1,767) level. The inside sliding parallel line (SL) remains as a very strong dynamic support, the bias is bullish in the short term as long as the precious metal is trading above this line.
Gold is bullish and it could approach and reach the upper median line (uml) of the minor descending pitchfork soon if the US data disappoints today. A valid breakout above the upper median line (uml) will signal an increase at least till the $1,765 high. A larger and significant increase will be validated only by a valid breakout above the $1,765 former high and above the R1 ($1,767) level. Only this potential breakout will really confirm a strong increase, RSI still shows a bearish divergence on the Daily chart, this divergence will be invalidated as well by such an increase. The upper median line (UML) of the ascending pitchfork and the $1,800 level are seen as viable upside targets. Gold price could develop a broader corrective phase only if the price makes a valid breakdown below the SL, $1,700 level, and most important below the median line (ML) of the ascending pitchfork and below the Pivot Point ($1,666) level. The material has been provided by InstaForex Company - www.instaforex.com |
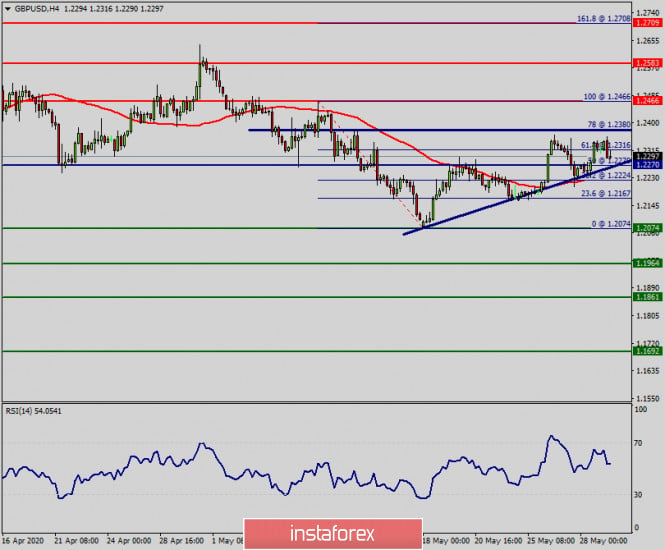
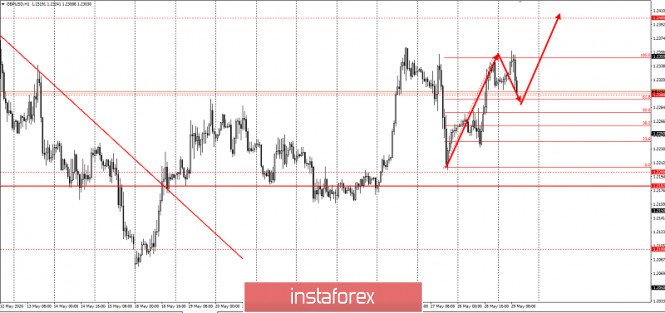
| Technical analysis of GBP/USD for May 29, 2020 Posted: 29 May 2020 03:05 AM PDT We noted clearly an ascending triangle which represents a bullish market that can be continuation in an up move or a reversal at a major support (1.2074). The GBP/USD pair is keeping continue in a bullish market from the support levels of 1.2270 and 1.2074. Also, it should be noted that the current price is in a bullish channel. We have good signals of indicators that lies in the RSI is still signalling that the trend is upward as it is still strong above the moving average (100) since yesterday. Immediate support is seen at 1.2167 which coincides with the first support. Consequently, the second support sets at the level of 1.2074. So, the market is likely to show signs of a bullish trend around the spot of 1.2167/1.2074. The market is still calling for strong bullish trend as long as the price is set above the major support level of 1.2074. In other words, buy orders are recommended above the level of 1.2167 with the first target at the level of 1.2274 in order to test the pivot point. Furthermore, if the trend is able to break through the first resistance of 1.2274. As a result, the pair will climb towards the double top (1.2466) to test it in coming hours. It is gainful to buy above the price of 1.2167 (S1) with targets at 1.2388 and 1.2466. However, the bullish trend is still expected for the upcoming days as long as the price is above 1.2075. Stop loss must set below the ascending triangle. The material has been provided by InstaForex Company - www.instaforex.com |
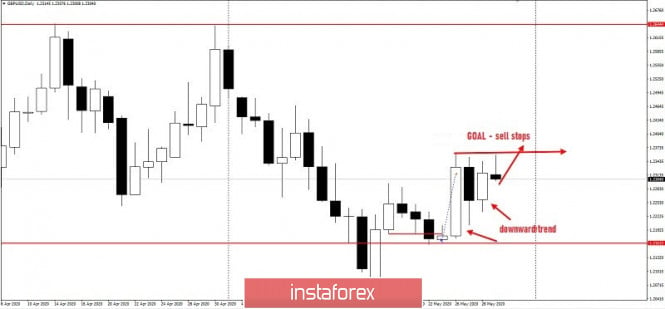
| Posted: 29 May 2020 02:54 AM PDT Good afternoon traders! A trading idea for the GBP / USD pair. The "Price Action" strategy outlines a bearish mood for the GBP / USD pair. So, from a pullback, open long positions according to the plan below: H1 chart: Use the round level 1.23 as a reference level for buy positions. The long scenario will be canceled if the quotes break out from yesterday's absorption. The target profit-taking levels are: 1.23600, 1.24 and 1.26500. Good luck! The material has been provided by InstaForex Company - www.instaforex.com |


 On March 20, the EURUSD pair has expressed remarkable bullish recovery around the newly-established bottom around 1.0650.
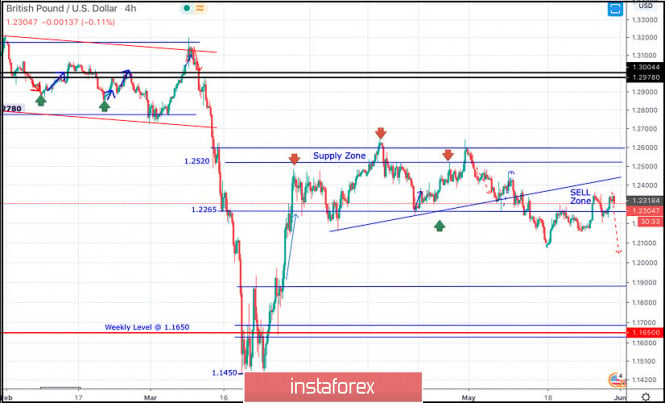


| You are subscribed to email updates from Forex analysis review. To stop receiving these emails, you may unsubscribe now. | Email delivery powered by Google |
| Google, 1600 Amphitheatre Parkway, Mountain View, CA 94043, United States | |
No comments:
Post a Comment