
Forex analysis review |
- Comprehensive analysis of movement options for #USDX vs EUR/USD, GBP/USD, and USD/JPY (H4) on June 22, 2020
- Europe and Asia stock indices changes in different directions: no signs of growth
- June 19, 2020 : EUR/USD Intraday technical analysis and trade recommendations.
- June 19, 2020 : GBP/USD Intraday technical analysis and trade recommendations.
- Short-term Ichimoku cloud indicator analysis of EURUSD
- Short-term Ichimoku cloud indicator analysis of Gold
- US dollar moves uncertainly. Quotes are changing slightly
- Analysis on EUR / USD and GBP / USD for June 19, 2020
- EUR / USD: dollar short-term demand prevents euro to grow
- EUR / USD correction
- BTC analysis for June 19,.2020 - Intraday buying climax and potential for the downside rotation towards the $9.330
- Coronavirus to hit oil prices again
- Oil cast aside all doubts and quickly rose
- Analysis of Gold for June 19,.2020 - Strong upward movement today and the rising trendline estalbished. Potential for test
- EUR/USD analysis for June 19, 2020 - Potential for the bigger rally on the EUR due to potential end of the downward correction...
- Trader's diary for June 19, 2020. EUR/USD. COVID-19 in Russia
- UK retail sales surprise traders. Pound sterling goes on sliding. Outlook for GBP/USD.
- EUR/USD and GBP/USD: Upcoming EU summit to discuss the proposed 750- billion euro aid program by the European Commission.
- Trading recommendations for GBP/USD pair on June 19
- Analysis and forecast for GBP/USD on June 19, 2020
- USD/JPY Leg Higher Incoming!
- Technical analysis of EUR/USD for June 19, 2020
- USD / JPY: Conflicting statistics and troubling news from the Korean Peninsula
- Instaforex Daily Analysis - 19th June 2020
- Analysis and forecast for EUR/USD on June 19, 2020
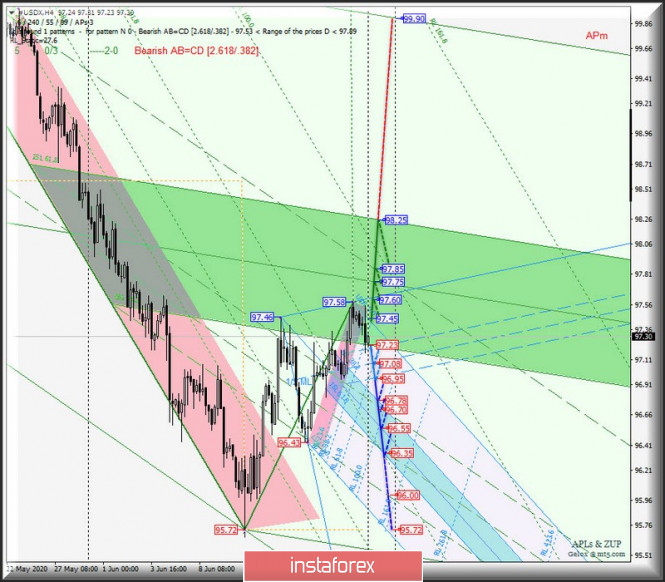
| Posted: 19 Jun 2020 10:03 AM PDT Minor operational scale (Daily) What will happen to the "majors" in the last nine days of June? Development options for the movement of #USDX vs EUR/USD, GBP/USD, and USD/JPY on June 22, 2020. ____________________ US dollar index From June 22, 2020, the movement of the dollar index #USDX will be determined by the boundaries of the equilibrium zone (97.23 - 97.75 - 98.25) of the Minute operational scale forks, taking into account the direction of the breakdown of the range:
If the resistance level of 97.20 breaks through on the initial line of the SSL of the Minute operational scale fork, the upward movement of the dollar index will be directed towards the goals:
In case of breaking the lower border ISL38.2 equilibrium zone of the Minute operational scale fork - support level of 97.23 - the development of the movement #USDX will be continued in the channel 1/2 Median Line Minuette (97.23 - 97.08 - 96.95) with the prospect of reaching the zone boundary equilibrium (96.78 - 96.55 - 96.35) of the Minuette operational scale fork and channel 1/2 Median Line (96.70 - 96.35 - 96.00) of the Minute operational scale fork. The layout of the #USDX movement options from June 22, 2020 is shown on the animated chart.
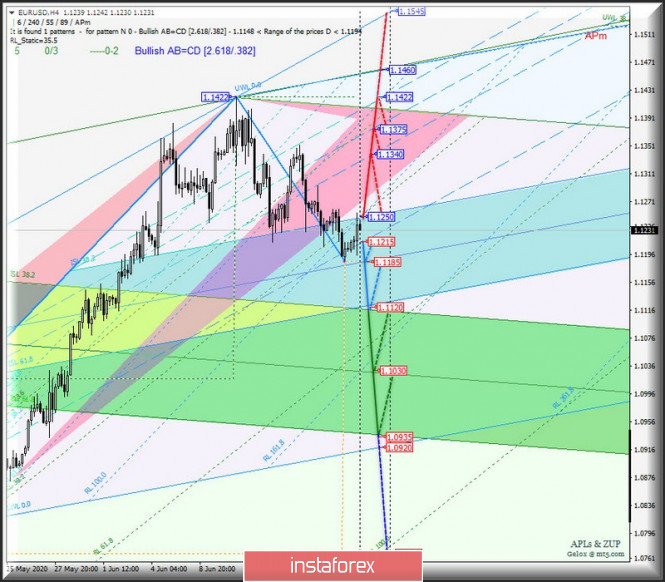
____________________ Euro vs US dollar The development of the movement of the single European currency EUR/USD from June 22, 2020 will continue, depending on the development and direction of the breakdown of the range:
If the support level of 1.1215 breaks through to the final Shiff Line Minuette followed by a breakdown of the median line Median Line (1.1185) of the Minuette operational scale fork, it will be important to continue the downward movement of the single European currency to the borders of the equilibrium zone (1.1120 - 1.1030 - 1.0935) of the Minute operational scale fork. In the case of breakdown of the top border ISL38.2 equilibrium zone of the Minuette operational scale fork - resistance level of 1.1250 - can be renewed upward movement of the EUR/USD to the borders of the channel 1/2 Median Line Minuette (1.1340 - 1.1375 - 1.1422) . The EUR/USD movement options from June 22, 2020 are shown on the animated chart.
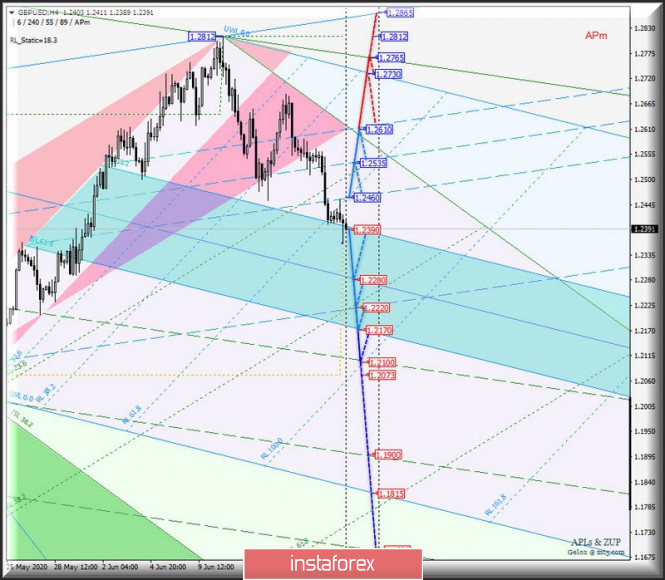
____________________ Great Britain pound vs US dollar The development of the movement of Her Majesty's currency GBP/USD/USD from June 22, 2020 will be determined by the development and direction of the breakdown of the range: Breakdown of ISL38.2 Minuette - support level 1.2390 - the GBP/USD movement will continue in the equilibrium zone (1.2390 - 12280 - 1.2170) of the Minuette operational pitchfork with the prospect of reaching the upper boundary of the 1/2 Median Line (1.2100) of the Minuette operational scale forks. In the event of a breakdown of the resistance level of 1.2460, Her Majesty's currency will continue to move in the 1/2 Median Line (1.2460 - 1.2535 - 1.2610) of the Minuette operational scale forks with the prospect of reaching the starting line FSL Minuette (1.2730) and the control line UTL (1.2765) of the Minute operational scale forks. Options for the movement of GBP/USD from June 22, 2020 are shown on the animated chart .
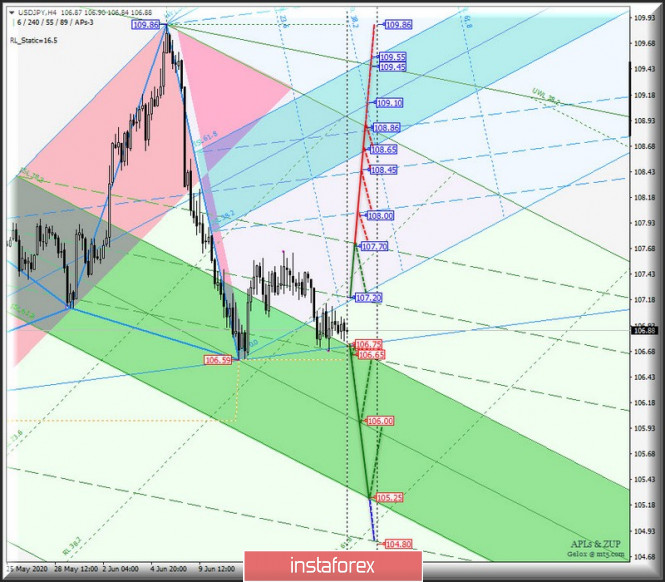
____________________ US dollar vs Japanese yen The development of the currency movement of the "Land of the Rising Sun" USD/JPY from June 22, 2020 will also be determined by testing and the direction of the range:
Breakdown of 1/2 Median Line of the Minute operational scale forks - resistance level 107.20 - continuation of the upward movement of the currency of the "Land of the Rising Sun" to the goals:
A consecutive breakout of ISL38.2 Minute - support level of 106.75 - and the lower border of the channel 1/2 Median Line Minute (106.65) will confirm the further development of the USD/JPY movement in the equilibrium zone (106.75 - 106.00 - 105.25) of the Minute operational scale forks. The markup of USD/JPY movement options since June 22, 2020 is shown on the animated chart.
____________________ The review is compiled without taking into account the news background, the opening of trading sessions of the main financial centers, and is not a guide to action (placing "sell" or "buy" orders). Formula for calculating the dollar index: USDX = 50.14348112 * USDEUR0.576 * USDJPY0.136 * USDGBP0.119 * USDCAD0.091 * USDSEK0.042 * USDCHF0.036. Where the power coefficients correspond to the weights of currencies in the basket: Euro - 57.6 %; Yen - 13.6 %; Pound sterling - 11.9 %; Canadian dollar - 9.1 %; Swedish Krona - 4.2 %; Swiss franc - 3.6 %. The first coefficient in the formula brings the index value to 100 on the starting date - March 1973, when the main currencies began to be freely quoted relative to each other. The material has been provided by InstaForex Company - www.instaforex.com |
| Europe and Asia stock indices changes in different directions: no signs of growth Posted: 19 Jun 2020 09:13 AM PDT
On the last business day this week, stocks in the Asia-Pacific region showed growth. Of course, market participants continue to be energized amid a new wave of coronavirus infections in the United States and China. The escalation of the conflict between the same countries adds even more negative. Nevertheless, today the market does not take this news with due seriousness. Recall that in the middle of last week, the Chinese authorities made a statement that new cases of COVID-19 infection began to be recorded in the country. To date, the outbreak continues to spread and the number of hospitalized is more than 200 people. Nevertheless, the state authorities hastened to assure the general public that the situation was under control and the further spread of the infection would be limited. However, neither tomorrow nor in the following days, the number of cases will not be zero, for some period you will have to deal with growth. As a result, investors were not too serious about the outbreaks of COVID-19, which began to be celebrated with renewed vigor not only in the United States and China but also in Latin America and South Asia. A possible second wave of the pandemic has ceased to frighten private traders, as it has moved into the potential zone. But the reason for the growth has appeared quite real and sustainable. So, traders believe that the Federal Reserve of the United States of America has fallen into a difficult and controversial situation. On the one hand, the stimulating policy has proved to be quite good in supporting the economy but has now ceased to operate at full strength, and on the other, it is impossible to stop it immediately, because the markets will be extremely disappointed and will inevitably roll down. Consequently, while investors have nothing to worry about, the progress will continue for some time to come. Japan's Nikkei 225 Index gained 0.33%, while the South Korean KOSPI index dropped by 0.37%. Australia's ASX 200 Index was up by 1.11%. Last month, it experienced extremely negative. Now the situation has begun to improve against the background of statistical data concerning a sharp increase in retail turnover by 16.3% immediately in the last month of spring compared to the previous period. At the same time, an equally sharp and significant drop was almost compensated for, which was recorded in April and was in the region of 17.7%. Hong Kong's Hang Seng Index declined quite a bit by 0.09%. China's Shanghai Composite Index rose to 0.50%. Followed by the Shenzhen Component Index, which showed an increase of 1.07%. European stock exchanges today have not found a single dynamic. Indices are moving in different directions, and market participants are trying to determine what is more important for them: the danger of a second wave of a pandemic or the hopes that will accelerate the recovery of the economies of the countries that are becoming real. Germany's DAX index jumped by 0.3%. The French CAC 40 index, by contrast, fell by 0.6%. The UK FTSE 100 index also fell by 0.5%. Meanwhile, market participants have high hopes that additional support measures can positively affect the acceleration of economic growth in most countries of the region. At the same time, the fear of the second wave of COVID-19 here, as well as in the Asia-Pacific region, is also almost completely ignored. It should be noted that some investors nevertheless hastened to moderate their ardor and sided with more reliable assets. The material has been provided by InstaForex Company - www.instaforex.com |
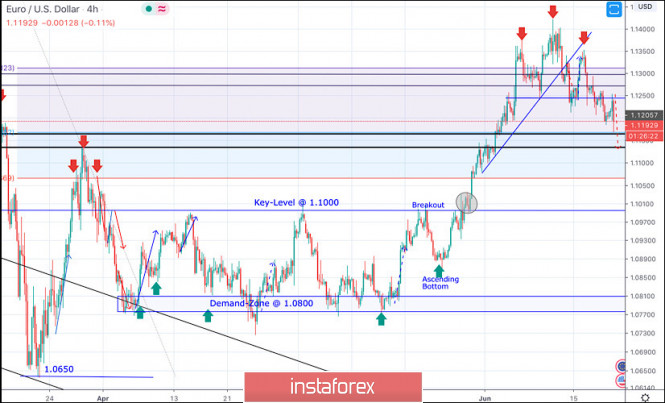
| June 19, 2020 : EUR/USD Intraday technical analysis and trade recommendations. Posted: 19 Jun 2020 08:40 AM PDT
On March 20, the EURUSD pair has expressed remarkable bullish recovery around the newly-established bottom around 1.0650. Bullish engulfing H4 candlesticks as well as the recently-demonstrated ascending bottoms indicated a high probability bullish pullback at least towards 1.1065 (Fibo Level 50%). However, a bearish Head & Shoulders pattern was demonstrated around the price zone between (1.1075-1.1150). Shortly after, a sideway consolidation range was established in the price range extending between 1.0770 1.1000. The price zone of (1.0815 - 1.0775) has been standing as a prominent Demand Zone providing quite good bullish support for the pair so far. On May 14, Evident signs of Bullish rejection have been manifested around this price zone. Moreover, recent ascending bottom has been established around 1.0870 which enhances the bullish side of the market in the short-term. Intermediate-term technical outlook remains bullish as long as bullish persistence is maintained above the recently-established ascending bottom around 1.0850-1.0870. Bullish breakout above 1.1000 has enhanced further bullish advancement towards 1.1175 (61.8% Fibonacci Level) then 1.1315 (78.6% Fibonacci Level) where bearish rejection was anticipated. Although the EUR/USD pair has temporarily expressed a bullish breakout above 1.1315 (78.6% Fibonacci Level), negative divergence as well as bearish rejection were being demonstrated n the period between June 10th- June 12th. Moreover, after such a quick bullish movement, the EURUSD pair looked oversold. This suggested a probable bearish reversal around the Recent Price Zone of (1.1270-1.1315) to be watched by Intraday traders. That's why, Bearish persistence below 1.1250-1.1240 (Head & Shoulders Pattern neckline) was needed to confirm the pattern & to enhance further bearish decline towards 1.1150. Trade recommendations : Any bullish pullback towards the price Zone around 1.1300-1.1350 (recently-established supply zone) should be considered as a valid SELL Signal. T/P levels to be located around 1.1175 then 1.1100 while S/L to be located above 1.1390. The material has been provided by InstaForex Company - www.instaforex.com |
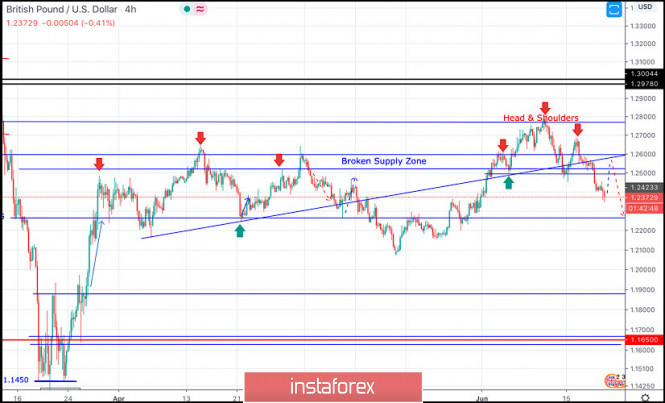
| June 19, 2020 : GBP/USD Intraday technical analysis and trade recommendations. Posted: 19 Jun 2020 08:29 AM PDT
Recently, Bullish breakout above 1.2265 has enhanced many bullish movements up to the price levels of 1.2520-1.2590 where temporary bearish rejection as well as a sideway consolidation range were established (In the period between March 27- May 12). Shortly after, transient bearish breakout below 1.2265 (Consolidation Range Lower Limit) was demonstrated in the period between May 13 - May 26. However, immediate bullish rebound has been expressed around the price level of 1.2080. This brought the GBPUSD back above the depicted price zone of 1.2520-1.2600 which failed to offer sufficient bearish rejection. Hence, short-term technical outlook has turned into bullish, further bullish advancement was expressed towards 1.2780 (Previous Key-Level) where signs of bearish rejection were expressed. Short-term bearish pullback is being expressed, initial bearish destination was located around 1.2600 and 1.2520. Moreover, a bearish Head & Shoulders pattern (with potential bearish target around 12265) is being demonstrated on the chart. That's why, bearish persistence below 1.2500 ( neckline of the reversal pattern ) pauses the bullish outlook for sometime and should be considered as an early exit signal for short-term buyers. Any bullish pullback towards 1.2520-1.2550 (recent supply zone) should be watched by Intraday traders for a valid SELL Entry. Trade recommendations : Intraday traders can wait for short-term bullish pullback towards 1.2550 (Backside of the broken uptrend) for a valid SELL Entry. S/L should be placed above 1.2600 while T/P level to be located around 1.2265. The material has been provided by InstaForex Company - www.instaforex.com |
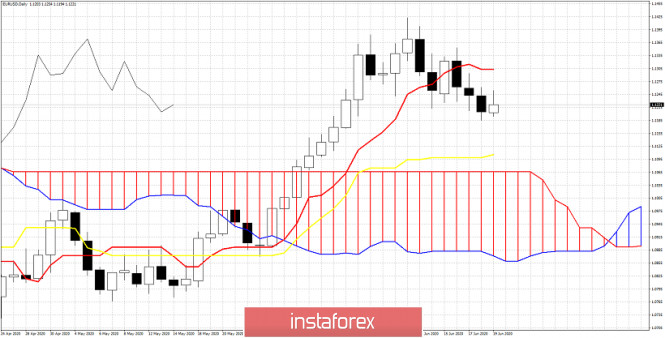
| Short-term Ichimoku cloud indicator analysis of EURUSD Posted: 19 Jun 2020 07:45 AM PDT EURUSD remains in a bearish trend. Price is vulnerable to a move towards 1.1175-1.1135. We focus on the lower lows and lower highs pattern and on the trend line resistance of the RSI. Both point to a move lower.
Black line- RSI resistance Red lines - expected path EURUSD was expected to pull back towards the 38% Fibonacci retracement. EURUSD has potential to move towards the 100% extension of the first leg down, towards the 50% retracement. As long as price is below 1.1260 and as long as the RSI is below the black trend line, we remain bearish. The material has been provided by InstaForex Company - www.instaforex.com |
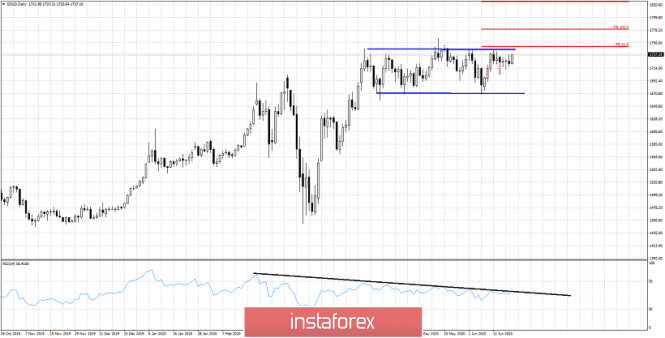
| Short-term Ichimoku cloud indicator analysis of Gold Posted: 19 Jun 2020 07:35 AM PDT Gold price is breaking above short-term resistance. Price has held above the Ichimoku cloud and did not break the short-term support of $1,700-$1,705. Gold price is approaching key long-term resistance and could already have started its next leg higher towards $1,780-$1,825.
As we explained in our last analysis, it was imperative for bulls to hold above $1,700 and recapture $1,731 in order to continue to hope for a move towards $1,780-$1,825. Gold price briefly entered the Ichimoku cloud but today price is making new higher highs. Staying above the cloud is a bullish sign. Breaking and recapturing $1,730 is another bullish sign. Price is above the Kumo and both the tenkan-sen and kijun-sen indicators. The Chikou span (black line indicator) is also breaking above the candlestick formation.
Black line -RSI resistance Red lines- Fibonacci targets Gold price is challenging the upper trading range boundary. If the RSI breaks the black trend line resistance and price above $1,750, we are heading towards $1,780-$1,825. Gold price so far has respected support levels. Now it seems that the time has come to exit the trading range its been in. The material has been provided by InstaForex Company - www.instaforex.com |
| US dollar moves uncertainly. Quotes are changing slightly Posted: 19 Jun 2020 07:35 AM PDT
This morning, greenback showed stability. There have been no significant changes in relation to the euro and the yen. The dollar index against a basket of six major currencies of the world decreased by 0.1%. This includes the Swiss franc, Canadian dollar, pound sterling, euro, Japanese yen, and Swedish krona. Currently, the level is positioned around 97.351. This was evidence of a rise to the maximum value in the last two weeks. In general, over the entire current week, the index increased by 0.3%, which has not been observed for more than a month. In the morning, the dollar fell in price against the euro. Its current level is around 1.1215 dollars per euro, while yesterday's trading ended in the region of 1.1205 dollars per euro. Yesterday, the greenback showed steady growth which provided the news about the rise in the precious metals market. Investors began to show greater interest in the safe haven, as the number of new cases of coronavirus infection in the world is growing steadily, which may be the beginning of the second wave of a pandemic and a new, more serious crisis in the economy. Another important point for market participants was the publication of unemployment statistics in the United States of America. As it became known, the indicator has become higher, that is, the number of newly submitted applications for unemployment benefits has increased dramatically. Markets and experts who previously predicted a reduction in this segment were not ready for this. The value of the US currency appreciated slightly against the yen. In the morning, the cost of 1 dollar is 106.93 yen. Recall that yesterday's exchange rate was at the level of 106.97 yen per dollar. The course of the single European currency against the Japanese yen also changed very slightly. Some reduction occurred, from 119.95 yen per euro to 119.87 yen per euro, respectively. The Japanese yen became active after the news from the official authorities of the country. According to the latest data, the forecast for changes in the country's GDP will be slightly better than previously expected. Positive will be provided by the gradual lifting of the state of emergency in the country, which was introduced in the spring against the backdrop of the COVID-19 pandemic. Meanwhile, the state's economy continues to be in an extremely difficult situation. Now even the fact that the situation is gradually getting worse and worse is already pleasing to both the country's authorities and market participants. At the same time, the greenback may reflect a record weekly growth this month. Investors in a state of uncertainty turned to a more proven and reliable asset, which again made the dollar popular. However, the growth dynamics of the greenback is limited by the narrow range provided by the news about the conflict between China and the USA. Recall that yesterday, US President Donald Trump expressed threats against Beijing, while threatening to sever all trade relations. Thus, the escalation of the conflict continues, and the negotiation process, which lasted for several months, has come to a standstill. The aussie, on the other hand, has become stronger by 25% over the past few months, which was facilitated by stabilization in the markets. However, since yesterday, the rise was not so significant, to the level of 0.6859 dollars for the aussie. Kiwi, on the contrary, was marked by negative dynamics, which amounted to 0.12%. The morning level was around 0.6418 dollars per kiwi. The pound sterling became more expensive by 0.16% and reached the level of 1.2449 dollars. This demonstrates a rise to almost the maximum values over the past two weeks. In this sector, investors are seriously worried that the country's Central Bank will not want to continue a soft stimulating monetary policy and will buy a new portion of securities. The bullish trend needs some support, but so far there are no such factors, or rather, they are not too serious to push prices upward. The material has been provided by InstaForex Company - www.instaforex.com |
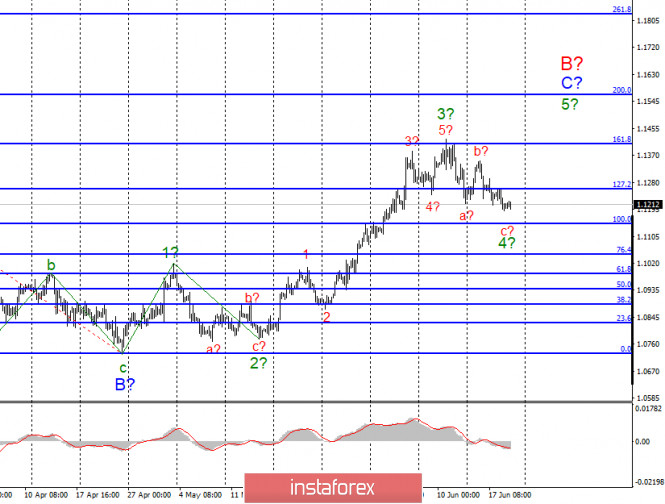
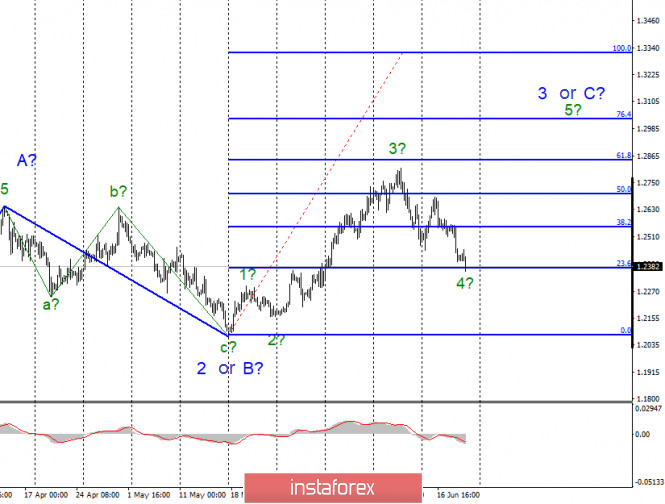
| Analysis on EUR / USD and GBP / USD for June 19, 2020 Posted: 19 Jun 2020 06:26 AM PDT EUR / USD On June 18, the EUR / USD pair lost about 40 basis points and, thus, continued construction of a prospective wave C 4 to C in B. If this is true, then the decline in quotes will continue with targets located near the level of 100.0% Fibonacci. An unsuccessful attempt to break through this mark will indicate the end of the wave. After completion of wave 4 in C in B, I anticipate the resumption increasing tool quotes with targets located above the level of 161.8% Fibonacci, within wave 5 to C to B. Fundamental component: On Thursday, nothing significantly interesting took place in the US and the European Union. However, in general, there are several interesting events that deserve the attention of the markets. The most important event is the EU summit, which is being held today as part of a videoconference, which will discuss budget issues for 2021–2027. However, it is not the budget itself that interests the markets, but the plan of the European Commission to restore the European economy. Today, the head of the European Parliament, David Sassoli, said that the plan of Ursula von der Leyen is good and can be the starting point for further negotiations. Mr. Sassoli expressed hope that the heads of state of the EU will support the anti-crisis recovery plan. Ursula von der Leyen herself expressed a similar opinion. However, there are no official results of the summit, It is hard to tell, what will be the likelihood that the northern countries namely, Denmark, Sweden, Austria, and the Netherlands will agree with the proposal of the European Commission. But if they agree, then this will be a breakthrough in the negotiations, and the demand for euro can grow significantly. I must also note that the situation in the US now remains unstable and dangerous. Rallies and protests continue, and former presidential adviser John Bolton wrote a book in which he reveals many aspects of Donald Trump's work and exposes it in clearly not the best light. Thus, new political proceedings may begin, and another shadow may be cast on Trump, which may prevent him from winning the presidential election at the end of this year. General conclusions and recommendations: The EUR / USD pair is supposedly continuing to build the rising wave C to B. Therefore, I recommend buying the instrument with targets located near the calculated marks 1.1406 and 1.1570, which equates to 161.8% and 200.0% Fibonacci for a new upward signal from the MACD indicator, which can announce the completion of construction of a wave 4 in C in B. GBP / USD On June 18, the GBP/USD pair lost another 140 basis points. Thus, at the moment, wave 3 or C complicates its internal structure and continues its construction. If the current wave marking is correct, then the increase in the quotes will resume after the completion of the construction of wave 4 with targets located above the 29th figure. An unsuccessful attempt to break through the 23.6% Fibonacci level will indicate the possible completion of the construction of wave 4 . Fundamental component: On Thursday, the UK released the results of the meeting of the Bank of England. The key refinancing rate remained unchanged at 0.1%, and the asset repurchase program was expanded by £ 100 billion. The pound sterling continued to decline along with the greenback because of this news. Also, today its position was further aggravated as markets have further reduced demand for it. Even a retail report in Britain did not help, according to which the decline in May was -13.1%, although markets expected -17.1%. General conclusions and recommendations: The GBP/USD tool supposedly continues to build a rising wave. Thus, purchases remain valid with targets located near the estimated levels of 1.2844 and 1.3030, which corresponds to 61.8% and 76.4% Fibonacci. I recommend buying the pound sterling for each upward signal from the MACD indicator, especially in the case of an unsuccessful attempt to break the 1.2372 mark. Otherwise, the entire wave pattern may require adjustments and additions. The material has been provided by InstaForex Company - www.instaforex.com |
| EUR / USD: dollar short-term demand prevents euro to grow Posted: 19 Jun 2020 05:34 AM PDT
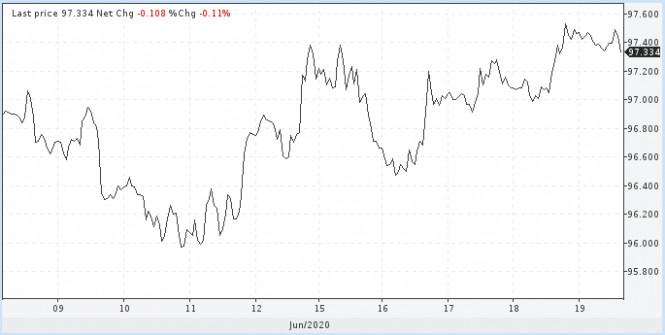
The acting protective asset, US dollar rises in price amid stocks decline. Bidding on Fridays looks mixed. The US securities market has returned to growth, despite concerns about the second wave of the spread of the coronavirus pandemic, and is preparing to complete the week with growth. At the same time, the greenback also retains the achievements in relation to a basket of key currencies received in recent days as a safe haven asset. The dollar index is within the upward trend, both medium and long term. While it is trading above 97.4, you need to look only for impulses to buy. USDX
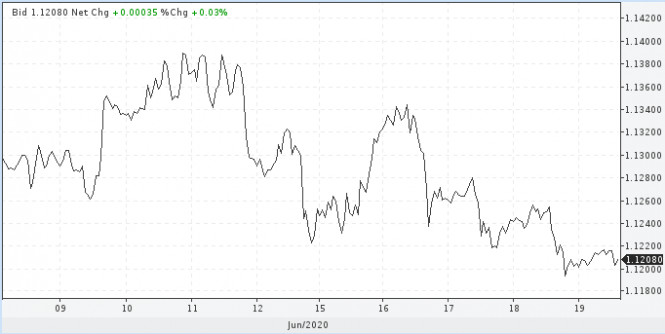
On Friday, nothing significant is expected, including macroeconomic reports. However, highlighting retail sales in Canada, traders should pay attention to the dynamics of the interbank lending market, where a contradictory situation is observed. It's quiet in New York. At a repo auction on Thursday, US banks sent applications to the Central Bank for $ 1 billion. This is the smallest amount in the last month. For example, a week earlier applications on average reached $ 59.5 billion. Consequently, there are no problems with dollar liquidity. A more interesting situation happened in London, where the Libor 3M benchmark rate approached a 3-day peak. Along with this, the annual rate is reduced. Although the problems with dollar liquidity are short-term, they still exist. It seems that some European banks urgently need dollars. We are talking about a small amount since the growth in rates is negligible. When bankers urgently need a large amount, then the rates increase accordingly, but this is not happening now. What does it mean? This means that a temporary jump in demand for dollars in London does not allow the euro to show growth this week. As soon as this process is completed, the euro will begin to storm the June highs. Now the downward trend dominates the pair. Today, the EUR / USD currency pair increased the range of consolidation downward, heading to the level of 1.1180. Nevertheless, until the end of the trading day, the upward trend is expected to reach 1.1220, then further growth is possible to the round mark of 1.11. EUR / USD
It is worth noting that on Friday the Federal Reserve should buy back assets worth $ 12.8 billion. This is the most serious amount of the outgoing week. On average, the Central Bank of the United States in recent days bought back $ 3 billion. Today's volume is four times more, the stock market will like it. The material has been provided by InstaForex Company - www.instaforex.com |
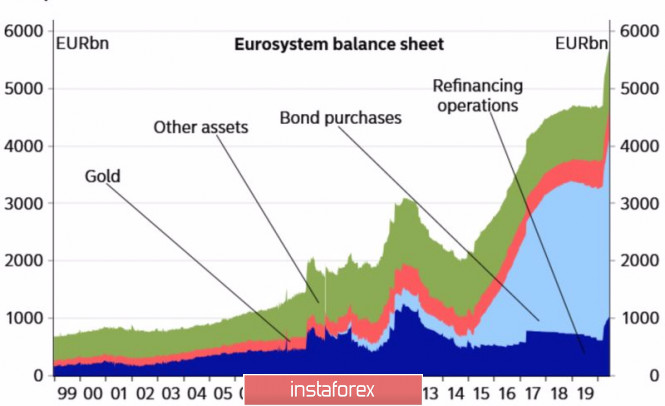
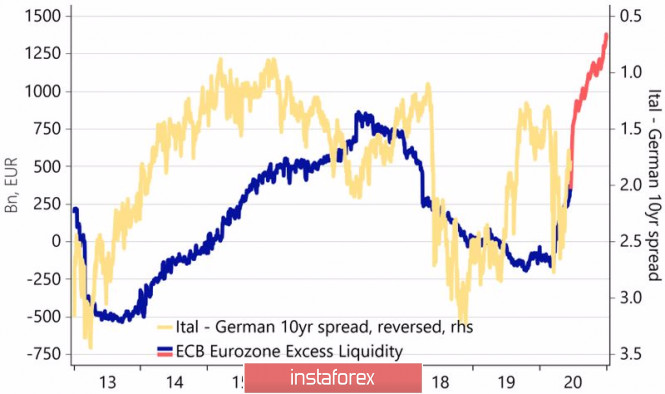
| Posted: 19 Jun 2020 05:18 AM PDT Markets grow by rumors and fall by facts. When the main bullish drivers are won back, there is a place for profit-taking, sales, which results in a correction. Best case scenario. The worst case is, the trend changes. In this regard, the fading of faith in the V-shaped recovery of the US economy, in an early victory over the coronavirus, as well as the euphoria over the large-scale fiscal and monetary stimulus of the EU and the ECB should have dropped the EUR / USD quotes significantly below the base of the 12th figure. Nevertheless, buyers are in no hurry to get rid of the single European currency, sincerely believing that soon it will have new trump cards on the horizon. In times of crisis, fundamental ties collapse, but recessions do not last forever. Its departure into the past leads to the restoration of the traditional principles of economic analysis. If the epidemiological situation does not worsen, and the trade wars do not resume, and you want to believe in it, the question on the agenda will be: whose GDP will recover faster? Europe, at least, does not lose to the States. It was able to take control of COVID-19 faster, and the size of the fiscal stimulus in Germany is higher than in the United States with a GDP of 40%. According to OECD forecasts, the German economy will not sink as deep as the US economy in 2020. Yes, the Fed is making titanic efforts to save the economy, but the ECB is impressive. It managed to inject about € 1.3 trillion into European banks as part of LTRO long-term targeted lending programs and taking into account the more significant role of loans compared to bonds in the Eurozone. Its actions deserve a strong five. In fact, the regulator flooded the markets with cheap money, increased liquidity to record levels, which ultimately will lead to a narrowing of the spreads between Italian and German debt obligations, that is, to reduce European political risks to a minimum. The dynamics of European liquidity:
The dynamics of liquidity and yield spread of bonds of Italy and Germany:
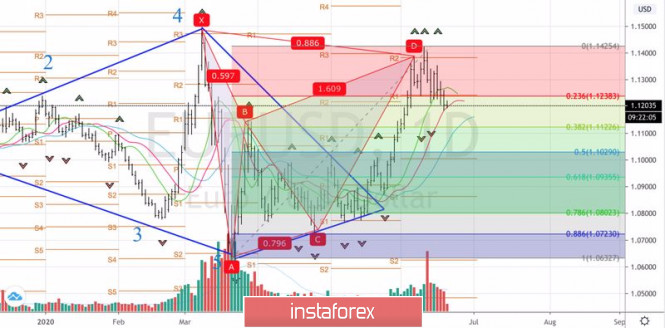
Hopes for a quick economic recovery and EU unity make the euro look good. Another thing is that this is not enough to restore the upward trend in EUR / USD. The efforts of both parties are needed. If the S&P 500 falls below 3000, the bulls will not be good for the main currency pair. Growing demand for safe-haven assets will allow the US dollar to feel the master of the situation on Forex. However, the last thing Donald Trump needs on the eve of the presidential election is the fall of US stock indices as these are perceived as an indicator of the health status of the US economy and as its personal rating. In his election program, Trump will bet on the restoration of GDP and will do everything possible to make the stock market look good. This circumstance allows us to adhere to the previous strategy for buying EUR / USD on the rebound from key support levels at 1.1155 and 1.112. Technically, on the daily chart of the main currency pair, the rollback continues in the direction of 38.2% and 50% Fibonacci from the AD wave of the "Bat" pattern. EUR / USD daily chart:
|
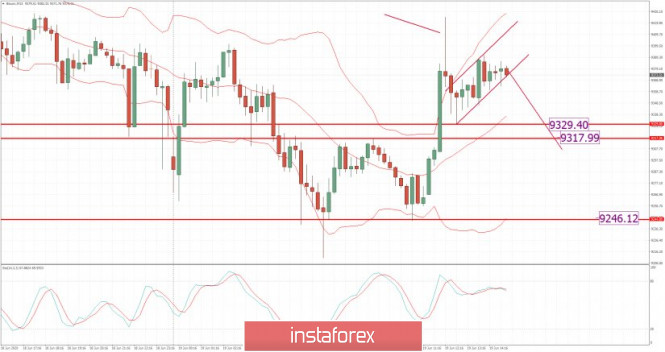
| Posted: 19 Jun 2020 05:17 AM PDT Trading recommendation:
Daily trend is still in the sideways regime and the reversion to the mean type of strategy is likely to benefit. Watch for potential selling opportunities due to intraday buying climax and potential bear flag for the further downside. The breakout of the rising channel would confirm downside movement towards the levels at $9,329, $9,317 and $9,245. Resistance level is set at $9,424 The material has been provided by InstaForex Company - www.instaforex.com |
| Coronavirus to hit oil prices again Posted: 19 Jun 2020 05:13 AM PDT
Experts believe that oil prices are about to fall again as the second wave of the coronavirus is coming. A new COVID-19 outbreak has been reported in the Chinese capital. As a result, schools, shopping centers, supermarkets, and sports facilities have been closed again. A record 26,000 new cases of coronavirus infection were confirmed in the United States almost within a month. Most new cases are registered in the south of the country. This situation creates new threats to the world economy. Thus, oil prices have been affected by the current situation. Since the beginning of the week, crude prices have lost more than 10% of their recent gains. The International Monetary Fund assumes that the global economic growth will slow down even further. For example, industrial production in China increased by 4.4% in May falling short of analysts' expectations. The market situation reveals the weakness of the global economy. According to Robert Kaplan, the President of Dallas Federal Reserve Bank, economic recovery will mostly depend on people and their observance of security measures. However, the coronavirus is still not defeated, while oil reserves are constantly increasing. It is estimated that China's oil inventories will grow by 440 million barrels in the first half of 2020 reaching an all-time record. Thanks to this growth, oil prices were able to recover, but it is not clear how long this would last. Commerzbank experts believe that current situation in the market was caused by late response to coronavirus. COVID-19 has not disappeared and continues to spread throughout the planet. However, the market reacted only to good news, such as a reduction in shale oil production in the United States. Analysts have warned that oil prices could fall again due to weak global demand for fuel. The material has been provided by InstaForex Company - www.instaforex.com |
| Oil cast aside all doubts and quickly rose Posted: 19 Jun 2020 05:04 AM PDT The cost of crude oil continued its rise this morning. The main reason for the positive dynamics was cautious optimism about the slow but sure stabilization of the market situation, in particular about the balance of supply and demand. The OPEC, which closely monitors the fulfillment of obligations under the oil production reduction treaty, held a meeting yesterday. During the meeting, the participants of the contract were reminded of the importance of timely execution of the transaction, since the future fate of the world oil market directly depends on it. In addition, sanctions measures were presented that will be used against countries that do not fulfill the full scope of their obligations. At the same time, the price of Brent crude oil futures for delivery in August on a trading floor in London made a solid jump of 0.82%, or $ 0.34 this morning, which raised them to $ 41.85 per barrel. Yesterday's trading also closed for this brand in the positive zone immediately at 2%, or 0.8 dollars, and the final price was at around 41.51 dollars per barrel. The cost of WTI crude oil futures for delivery in July on an electronic trading platform in New York is also substantially adjusted upward. In the morning, it already added 0.82%, which corresponds to 0.32 dollars. Thus, its price moved to the level of 39.16 dollars per barrel. It can be recalled that yesterday, WTI oil also made a great leap forward (2.3% or 0.88 dollars), and it began to cost 38.84 dollars per barrel by the end of trading. The situation on the implementation of the contract to reduce oil production, ratified by OPEC, began to clear up. Countries that failed to meet contractual obligations on time proposed a way out and their plans to compensate for an unfulfilled contract. In particular, it was Iraq and Kazakhstan that came to an agreement with OPEC. The rest of the debtors are given time until June 22 to provide the organization with their options for compensation. Strict sanctions may begin after this date. The fact that Iraq and Kazakhstan started negotiations with OPEC has already aroused a wave of enthusiasm among market participants. This has shown that states are interested in cooperation and understand the need for joint actions aimed at stabilizing the oil market. The current state of affairs makes investors think that in the near future, the deal to reduce the level of oil production can be completed in full, that is, by 100%, and not by 87%, as it was before. It should be noted that according to the data, more than 1.26 million barrels of crude per day were released to the market over the last month of spring. In general, OPEC member countries were able to cope with their obligations by 84%, and the excess of the permissible production level at them amounted to 0.97 million barrels per day. The countries that are not members of the organization did better: they completed the deal by 92%, and the surplus was in the region of 0.29 million barrels per day. Such news pleased the raw materials' market, and the price of it received support for further growth. At the end of the meeting, it was noted that the deal to reduce the production of raw materials can be extended for the next period only if all the agreements this time are 100% fulfilled. If there are problems with the performance of obligations again, the contract may cease to exist, which in itself will already be a blow to the black gold market. The ongoing lifting of quarantine measures related to the coronavirus pandemic is also supporting the cost of oil. However, the increase in the number of cases in the United States and China causes some tension among market participants. The new wave of COVID-19 can seriously undermine the ongoing recovery. Moreover, the next crisis will become deeper and more difficult to overcome. Meanwhile, the fact that crude oil completes the week with consolidation above the strategic mark of $ 40 per barrel is already encouraging for investors. This will most likely be the starting point for moving to the next level of $ 45 per barrel. In this regard, investors are focusing on how quickly oil reaches a new peak. The material has been provided by InstaForex Company - www.instaforex.com |
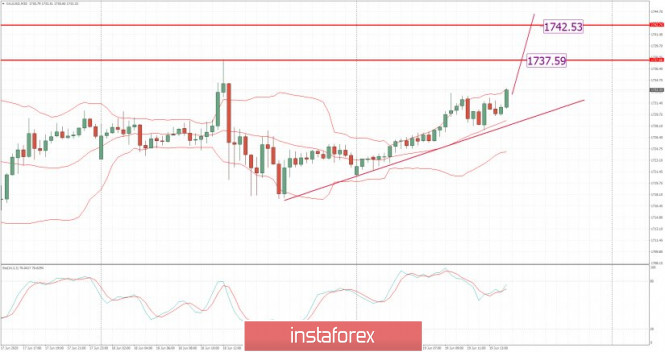
| Posted: 19 Jun 2020 05:02 AM PDT Corona virus summary:
he UK's chief medical officers have agreed that the Covid-19 threat level should be lowered one notch to "epidemic is in general circulation" from "transmission is high or rising exponentially". The joint biosecurity centre recommended the Covid-19 alert level should move from level 4 (a Covid-19 epidemic is in general circulation; transmission is high or rising exponentially) to level 3 (a Covid-19 epidemic is in general circulation). Technical analysis: Gold has been trading upwards today. The price tested the level of $1,733. I see further upward movement till end of the day and potential test of $1,737 and $1,742. Trading recommendation: Watch for potential buying opportunities on the dips using the intraday frames like 15/30 minuites for better entry location. Support level is set at teh price of $1,727. Rising trendline is active... The material has been provided by InstaForex Company - www.instaforex.com |
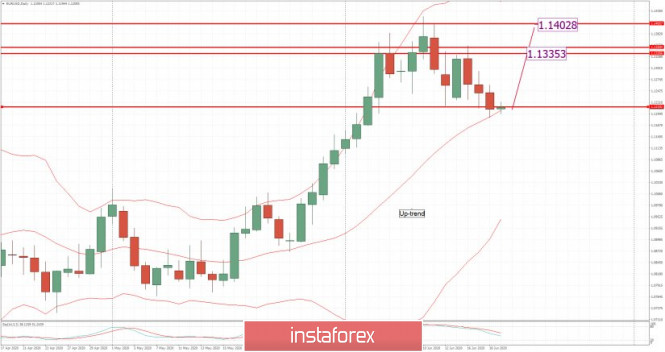
| Posted: 19 Jun 2020 04:55 AM PDT News:
EU leaders are gathering virtually for a video summit that is attempting to find consensus for an ambitious €750bn (£676bn; $840bn) EU coronavirus recovery fund. Several northern European nations are unhappy about the EU commission plan because it involves collectively raising €500bn as grants for countries worst hit by the pandemic, notably Italy and Spain. A group known as the "frugal four" – Sweden, Denmark, Austria and the Netherlands – have made clear their continued opposition to grants, rather than loans. There are also divisions over the proposed €1.1tn EU budget. Technical analysis: EUR/USD has been trading sideways at the price of 1,1210. The EUR is trading in well defined short-term up trend and I do expect upward continuation based on the daily time-frame towards the levels at 1,1335 and 1,1400. Trading recommendation: Watch for potential buying opportunities with the potential stop at 1,1180. I found that there is test and reject of the 20 EMA on the daily time-frame. Support level is set at 1,1180 and 1,1150 The material has been provided by InstaForex Company - www.instaforex.com |
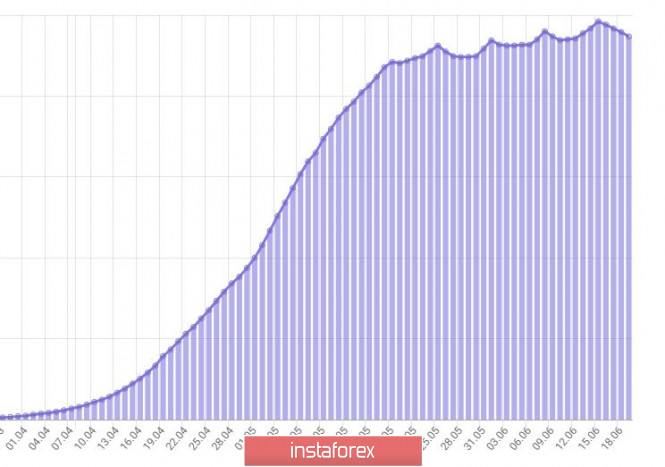
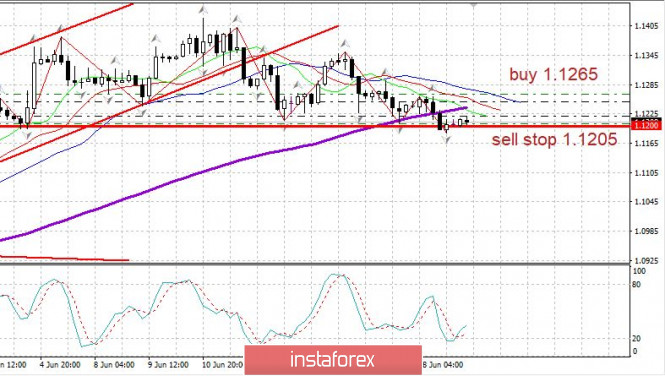
| Trader's diary for June 19, 2020. EUR/USD. COVID-19 in Russia Posted: 19 Jun 2020 04:20 AM PDT The chart of active coronavirus cases in Russia shows how many people are undergoing treatment. According to the last report, Russia has 236.8 thousand active virus cases. We can see that the infection rate is still high and there is no noticeable decline yet. Despite statements by the authorities, Russia has not passed the peak of the pandemic. The only region which has passed the peak of the epidemic is Moscow where the number of new cases decreased from 6 thousand to 1 thousand. More than 20 thousand people were released from hospitals. Some of these places of treatment return to their core business activities. For the last three days, St. Petersburg has reported a significant drop in the number of active cases which reduced by 1,300 people, that is, about 10%. However, doubts were raised by yesterday's statement of St. Petersburg Governor Alexander Beglov. He said that there were no empty hospital beds for COVID-19 patients. However, official statistics show that more than 1,000 beds became vacant (this is a large hospital in total). So, what to think? One thing is clear: St. Petersburg has lifted all quarantine measures too early. This claim relates to the province as well. Let's take a look at the chart again. Given the fact that Moscow and St. Petersburg have reported a significant drop in the number of new cases, it can be concluded that the Russian province is currently at the peak of the disease. EUR/USD - The euro cannot decide on its direction. Keep short positions from 1.1205 with a stop loss order at 1.1250. Open long positions from 1.1265. The material has been provided by InstaForex Company - www.instaforex.com |
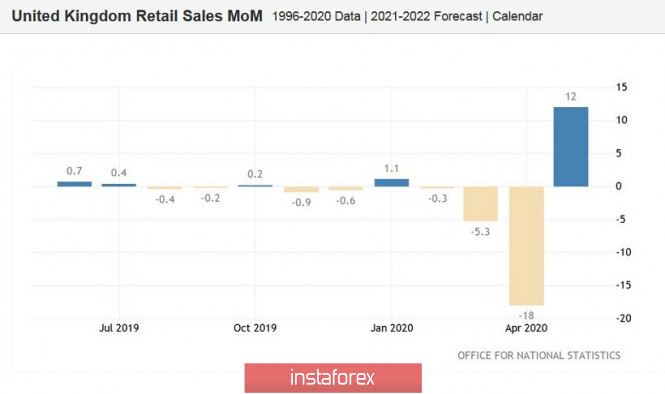
| UK retail sales surprise traders. Pound sterling goes on sliding. Outlook for GBP/USD. Posted: 19 Jun 2020 03:37 AM PDT The UK retail sales data has stopped the pair's downward movement. The pair moved up from a 3-week low of 1.2104. However, long positions on the pair are still rather risky. Any rise is a signal to open short deals. Today's retail sales report proved that the country's economy is recovering. However, the BoE's dovish rhetoric, economic record lows, and stagnation in the negotiations between London and Brussels are weighing on the pound sterling. Only one positive report cannot support the UK national currency. Moreover, today's figures are strong only at first sight. Of course, the main tendency is positive. The UK consumer activity is advancing despite the ongoing pandemic. In May, the UK authorities have loosened the containment measures. As a result, the general volume of retail sales (including fuel) climbed by 12% on a monthly basis and dropped by just 13.1% on a yearly basis. Both indicators exceeded the forecasts. Retail sales without fuel advanced by 10.2% on a monthly basis against the forecast of a 4.5% rise. On a yearly basis, the indicator declined by 9.5% instead of a 14.5% drop. In other words, the indicator, on the one hand, significantly exceeded the expectations of experts. In fact, most analysts had expected this trend amid the easing of the quarantine measures. Compared to April, there is a clear upward dynamic, which points to the economic recovery. However, if we take a bigger time period, we will see that the retail sales indicators remain lower than in 2019. Moreover, some experts doubt that the current jump may help to disperse the economy after such a strong 20% decline. Thus, today's release did not allow the pound/dollar bulls to develop a large-scale price movement. As a result, traders have started to sell it off again. At the moment, any rise should be used as a reason to open short positions. The pound sterling is under pressure of many fundamental factors. First of all, it is Brexit and relations between London and Brussels. As recent events have shown, there is no success in the negotiations. Boris Johnson's online meeting with the EU leadership have not brought any results. The head of the European Commission, Ursula von der Leyen, said that the parties had not even reached "the middle of the road". She also noted that at the moment, no one could predict the stage of the negotiations at the end of this year. That is why Boris Johnson's intention to come to an agreement by the end of July looks impossible. The European Parliament also added fuel to the fire. It accepted its own recommendations for the ongoing negotiations. The political Declaration that the parties agreed on last year remains the framework for further dialogue. The European Parliament also insists on the full implementation of the Brexit agreement, including all additional protocols. Foreign Affairs committee chair, David McAllister, said that the European Parliament will hardly come an agreement with Britain. At the end of June, the first face-to-face talks between the parties are expected to take place. Assessing the prospects of the British currency, we should not forget about the results of the June meeting of the Bank of England. To the surprise of many market participants, the head of the English regulator again spoke about the possible introduction of negative rates. BoE's economists are studying the relevant experience of other central banks. It is an unexpected event. Thus, the pound sterling tumbled by more than 150 pips against the US dollar. According to the fundamental analysis, the pound sterling remains weak. Thus, any attempt to rise should be used to open short deals on the pound/dollar pair towards the support level of 1.2300 (the lower border of the Kumo cloud on the daily chart). The material has been provided by InstaForex Company - www.instaforex.com |
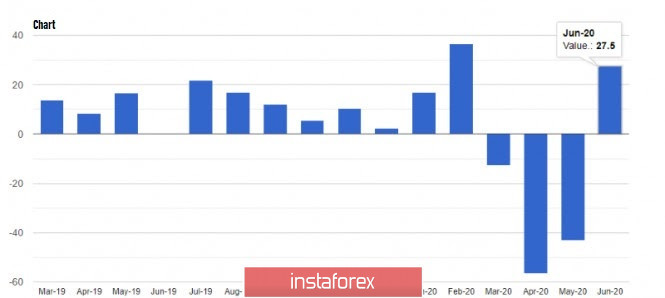
| Posted: 19 Jun 2020 03:11 AM PDT An economic summit will be held today in the EU via video conference, at which, most likely, EU representatives will raise the issue of the assistance plan proposed by the European Commission, which involves raising € 750 billion euros in debt directly to financial markets. Such a factor slightly decreased the current pressure on the euro, as it is still unclear whether the program will be approved or not. If it is passed, demand for the euro will continue to lower, as it will strengthen the disputes of the northern EU and southern EU, even though the additional financing will help the eurozone economies recover more quickly from the pandemic crisis. In addition, the question of who will pay the debts remains a big concern to the people, Approving the aforementioned plan will require rather difficult and compromise decisions, primarily with the northern EU countries, with which there are now the deepest disagreements. This is due to the reports that say approximately 40% of 500 billion can be used to save the economies of Italy and Spain, in which if implemented, can lead to quite serious questions about the size of the shares of grants and loans. The four countries who have opposed the earlier Franco-German agreement, Netherlands, Denmark, Austria and Sweden, also protested such a plan, as its approval will just increase the political risks within these countries, since taxpayers are to be the ones to pay off the debts taken to support the southern European countries. If the meeting today does not result in specifics in this direction, the euro can strengthen its position in the short term by the end of the week. As for the macroeconomic reports published yesterday, a report by the US Department of Labor indicated that over the week of June 7-13, the number of initial applications for unemployment benefits fell by 58,000 to 1.5 million, which indicates the stabilization of the situation after the jump of figures in April. However, it also indicates that lay-offs increased at a fairly high rate, which persisted as the coronavirus pandemic remains in the United States. For secondary applications of unemployment benefits for the week from May 30 to June 6, the figure decreased by 62,000, to 20.54 million. Fed representatives, including Fed Chairman Jerome Powell, repeatedly drew attention to the need to support the most vulnerable people who suffered during the pandemic. Thus, the US Congress is now considering another package of unemployment assistance, as well as the possibility of increasing unemployment benefits. Meanwhile, data on the growth of the economic index, which indicates economic cycles in the US, supported the US dollar in the afternoon. The increase in activity after the mitigation of quarantine restrictions resulted in positivity on the index, in which according to the Conference Board, the leading indicators index in May 2020 increased by 2.8% compared with the previous month, amounting to 99.8 points. Economists expected the indicator to grow by only 2.4% in May. Manufacturing activity in the area of Philadelphia Fed also pleased traders, as the report indicated an increase in the index in June this year. According to the data, the leading index of business activity in June this year finally to 27.5 points against -43.1 points in May, while economists expected the index to be -20 points. With regards to Fed statements, Loretta Mester, head of the Cleveland Fed, said yesterday that it would require strong support from the authorities and a long time for the economy to recover. According to her, it would take at least two years for the economy to return to its pre-pandemic state, which is why new fiscal support measures are being developed. As for the technical picture of the EUR / USD pair, demand for the euro could decrease sharply today, depending on the results of the upcoming EU summit. Bulls will work on a return to the resistance level of 1.1230, which will lead to a more confident increase in risky assets due to the demolition of stop orders of speculative sellers. Such a scenario could also lead to the update of highs at 1.1290. However, if pressure on the euro continues, the next support levels will be in the area of 1.1160 and 1.1100. GBP / USD The British pound remains under pressure after the decision of the Bank of England yesterday to expand its bond purchase program by another £ 100 billion pounds and maintain interest rates at its current levels. Additional problems were also provided by the reports that claim that the EU does not intend to reciprocate the UK, which plans to introduce a six-month grace period for customs duties after the end of the Brexit transition period. Such a solution would help partially alleviate the problems that companies and businesses may experience after the complete breakdown of previous trade relations. The EU was assured that from January 1, 2021, there will be no more exemptions for goods from the UK. All imports will undergo full customs control and inspection. The pound was also not supported by the recent statement of Bank of England Governor Andrew Bailey, who said that the economic downturn in the UK is not as deep as the central bank suggested. Bailey reassured the markets, noting that negative rates and controlling the yield curve were not discussed at the meeting. If the Bank of England nevertheless makes such a decision, it will have a serious impact on the income and profits of banks, insurance companies and pension funds. Accordingly, the reaction of the British pound to this decision will be similar. However, one should not be afraid that the decline will occur simultaneously, as markets will approach this scenario gradually. Bailey also noted that despite the problems observed in the labor market, the data on industrial production signals a faster economic recovery.
Meanwhile, traders are wondering why Bank of England Chief Economist Andy Haldane voted yesterday against increasing the quantitative easing program. It arose theories that perhaps, the chief economist thinks that negative interest rates would be a more effective tool at this stage. As for the technical picture of the GBP/USD pair, the bears should more actively fight today to protect the resistance at 1.2480 and in no case should the trading instrument return above the level of 1.2450. A breakout from the support level of 1.2405 will only increase pressure on the pound, which will lead it directly to the monthly lows 1.2340 and 1.2290. The material has been provided by InstaForex Company - www.instaforex.com |
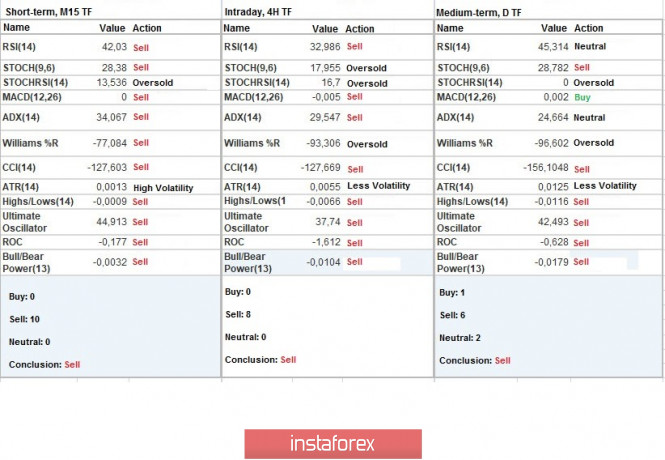
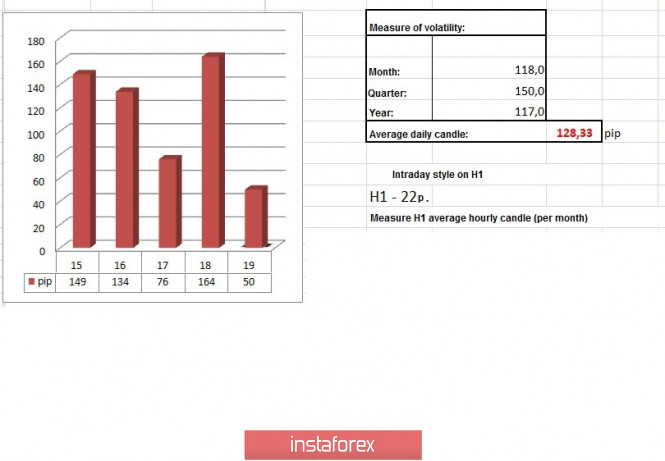
| Trading recommendations for GBP/USD pair on June 19 Posted: 19 Jun 2020 02:32 AM PDT From the point of view of complex analysis, you can see the accumulation process within the variable support, and now let's talk about the details. The trading week is coming to an end and it's time to sum up the preliminary results. So, the dream of followers of the upward development is moving further and further away, and the quote of pound sterling is already in the recovery stage from the range level of 1.2770, which did not yield to buyers for the second week in a row. The quote has not just returned to the previous range 1.2150//1.2350//1.2620, but also has generated more than 65% of the total upward impulse, which means that the speculative mood played a bad joke again before strategic operations. Is it worth upsetting that the transition to a new range of oscillations [1.2150 // 1.2350 // 1.2620 ---> 1.2770 // 1.3000 // 1.3300] is postponed indefinitely? Absolutely not, because we are in the market for only one purpose - to make money, and now the main tactic of traders is local operations due to the enormous emotional mood of the market. Thus, following the principles of reading the technical picture of the market, comparing this with the external and emotional background, a trading decision was made in terms of local positions for each individual time period. Analyzing the past trading day every minute, you can see that there was a surge in short positions, on the basis of which the quote managed to break through the level of 1.2500 and declined to the level of 1.2401. The greatest speculative activity was recorded from 11:00 [UTC+00 time on the trading terminal], which is associated with the information and news background. As discussed in the previous review, traders expected a similar development and surge in activity, so short positions lower than 1.2500 were opened in the direction of 1.1450-1.1350. The trading recommendation of Thursday regarding the positions for sale coincided, having a profit on the trading deposit. In terms of volatility, everything goes as usual, on Wednesday, the first slowdown in nine trading days was recorded [76 points], which was a signal of the concentration of trading forces before a new jump in activity. Thursday was on the wave of speculators, where the concentration of trading forces a day earlier gave the market dynamics, and as a result, daily activity was 164 points, which is 28% higher than the daily average. This pattern is combined with the technical, fundamental, and emotional components of the market. Considering the trading chart in general terms, the daily period, it is worth noting that a similar dynamic in terms of the reverse move last occurred on May 1. The focus of the news background on the last day was the meeting of the Bank of England, during which the refinancing rate was left at 0.1%, and the program of quantitative easing was expanded to 745 billion pounds. Market participants were ready for this development, but they were upset by something else: the regulator regards the current unemployment rate as a lack of desire for the British to move on after the pandemic, and the available statistics are reduced to an anomaly from the point of view of the Central Bank, and unemployment can continue to grow, as it was at first with the West. In other words, the Bank of England signaled in this not quite clever way that by the end of the year we may see a reduction in the refinancing rate with a transition to the negative zone. "Recent data indicate that the fall in world GDP in the second quarter of 2020 will be less serious than expected during the May report on monetary policy," the regulator said in a statement. Naturally, investors saw this promise and speculators just did their job, so the pound declined. [Be aware of all the trends, see how the meeting of the Bank of England influenced the European currency, a fresh review is available on the LINK ] Today, in terms of the economic calendar, we have data on retail sales in the United Kingdom, which turned out to be much better than expected, an increase of 12% in May, but this is probably due to the gradual weakening of quarantine measures in this period. In annual terms, retail sales continue to be in the negative zone -13.1%. There was no market reaction to the data on Britain so the pound still remains at the level of the minimum of the past day. The upcoming trading week in terms of the economic calendar is full of statistics, where they expect preliminary PMI indicators for June, as well as the final data on US GDP. At the same time, do not forget that the external background, in particular the Brexit divorce proceedings, still puts pressure on the market. The most interesting events displayed below (Universal Time) ---> Monday, June 22 USA 14:00 - Sales in the secondary housing market in May Tuesday, June 23 EU 8:00 - Index of business activity in the Markit services sector for June, PRELIMINARY EU 8:00 - Markit Manufacturing PMI for June, PRELIMINARY USA 13:45 - Index of business activity in the services sector for June, PRELIMINARY USA 13:45 - Index of business activity in the manufacturing sector for June, PRELIMINARY USA 14:00 - Sales of new housing in May Thursday June 25th USA 12:30 - Basic orders for durable goods (m / m) for May USA 12:30 - GDP for the 1st quarter USA 12:30 - Applications for unemployment benefits Further development Analyzing the current trading chart, we can see the slowdown after last day's rally, where the quote fluctuates within the variable range of 1.2400 / 1.1450, which indicates a regrouping of trading forces. Keeping the price in a downward cycle indicates that the recovery process has not yet reached its goal, which means that movement within the previous range of 1.2150 // 1.2350 // 1.2620 will still be relevant in the market. In terms of the emotional mood of the market, we can consider the desire of speculators for further jumps, which is confirmed by the existing stop where the regrouping of trading forces takes place. It can be assumed that in case the price consolidates below 1.2400, the downward movement will resume, where amid new speculations, the quote will return to the average level of 1.2350, which confirms the theory of movement in the previous range once again. An alternative scenario will be considered if the price consolidates above 1.2460, which will signal a price return to the area of 1.2500 during the pullback. Based on the above information, we derive trading recommendations: - Consider buy deals in case of price consolidation above the level of 1.2460, in the direction of 1.2500 - 1.2550. - Consider sell deals in case of price consolidation below the level of 1.2400, with the prospect of a move to 1.2350. Indicator analysis Analyzing a different sector of time frames (TF), we see that the performance of technical instruments on minute and hour periods signal a sale due to the concentration of the price at the level of 1.2400. On the other hand, the daily period changed the buy-sell signal for the first time in a long time as soon as the quote managed to pass the level of 1.2500. Volatility per week / Measurement of volatility: Month; Quarter; Year Measurement of volatility reflects the average daily fluctuation, calculated for the Month / Quarter / Year. (June 19 was built taking into account the time of publication of the article) The volatility of the current time is 50 points, which is 60% lower than the daily average. It can be assumed that if the downward trend continues, speculative activity will lead to an increased volatility at times. Key levels Resistance Zones: 1.2500; 1.2620; 1.2770 **; 1.2885 *; 1.3000; 1.3170 **; 1.3300 **; 1.3600; 1.3850; 1.4000 ***; 1.4350 **. Support Zones: 1.2350 **; 1.2250; 1.2150 **; 1.2000 *** (1.1957); 1.1850; 1.1660; 1.1450 (1.1411); 1.1300; 1,1000; 1,0800; 1.0500; 1.0000. * Periodic level ** Range Level *** Psychological level **** The article is built on the principle of conducting a transaction, with daily adjustment The material has been provided by InstaForex Company - www.instaforex.com |
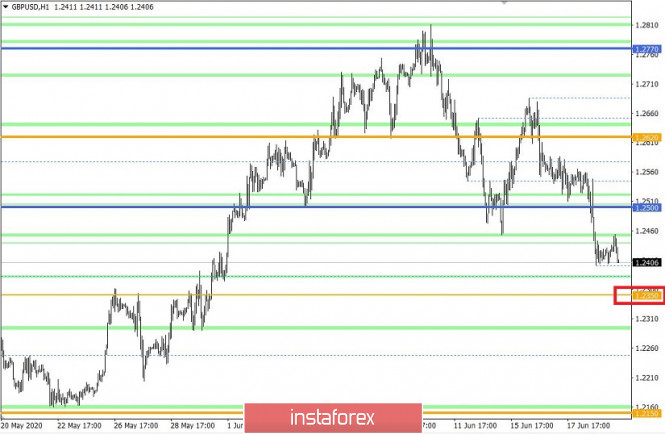
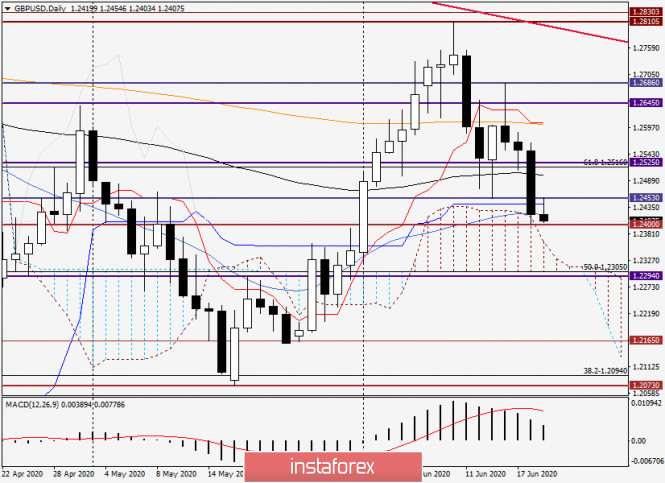
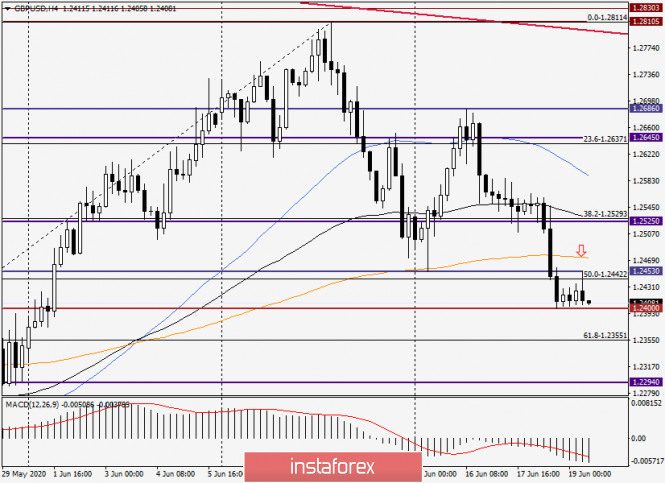
| Analysis and forecast for GBP/USD on June 19, 2020 Posted: 19 Jun 2020 02:25 AM PDT Good day, dear colleagues! Although the results of yesterday's meeting of the Bank of England coincided with the forecasts of experts, the British currency significantly sank against the US dollar. Let me remind you that the Bank of England kept the main interest rate at the same level of 0.10%. At the same time, the asset purchase program, to eliminate the negative consequences of COVID-19 for the British economy, was increased by 100 billion to 745 billion pounds. It would seem that everything is within market expectations, and the fall of the "British" should not have been so significant. However, the volatile and speculative pound collapsed. This factor was somewhat unexpected, although, knowing the nature of the British currency, it is not particularly surprising. Daily
As a result of yesterday's fall, the previous lows were updated at 1.2510, the 89 exponential moving average was broken, the significant support level of 1.2453, and the Kijun line of the Ichimoku indicator. The last factor, in my opinion, is the most important, since Kijun has long held the quote back from further decline. There were even attempts to break through the 50 simple moving average and enter the limits of the Ichimoku cloud, but its upper limit and 50 MA triggered a rebound of the pair, and trading ended at 1.2420. By the way, this is a fairly strong technical level, which has repeatedly had a significant impact on the price dynamics of the instrument, so this closing price, in my opinion, is not accidental. At the time of writing, the GBP/USD pair has already tested the strength of another important mark of 1.2400, and also managed to roll back to the support level of 1.2453 broken yesterday. At the moment, the trading is held in the range of 1.2403-1.2453. After such a negative reaction to the quite predictable decision of the Bank of England, it is time to expect a further weakening of the British currency against the USD. If the pair falls below the level of 1.2400, then the next target for bears on the pound will be the mark of 1.2346, where the weekly Kijun line runs. However, the weekly chart of GBP/USD will be considered on Monday, after the closing of weekly trading. In the meantime, let's switch to smaller timeframes and see what interesting options there are for opening positions. H4
This chart clearly shows consolidation near the important level of 1.2400. Usually, this is followed by a fairly strong directional price movement. In our case, it is most likely that sterling will continue its downward trend. At the same time, do not forget that on the last day of weekly trading before the weekend, profit-taking occurs. In this regard, a corrective pullback to yesterday's fall is not excluded. If this happens, it is possible to rise to 200 EMA and 89 EMA, which are located at 1.2474 and 1.2533, respectively. On the other hand, taking into account trading levels, a pullback was already given to the broken support of 1.2453, after which the pair turned around, demonstrating its readiness to continue the downward trend. In other words, you could try to sell the pound from current prices, if not for the strong technical level of 1.2400. Since this level is strong support from it at any moment there may be a rebound or to start a deeper pullback. However, traders who are trading at the breakout levels can try to sell GBP/USD at the breakout of 1.2400 with a goal in the area of 1.2360/50. Naturally, it is better to sell at more favorable prices after a corrective pullback to the area of 1.2450-1.2475. The question is: will it be? It is quite a good decision to postpone plans to open positions on Monday when a full analysis will be conducted taking into account the closing of the current trading week. Have a nice weekend! The material has been provided by InstaForex Company - www.instaforex.com |
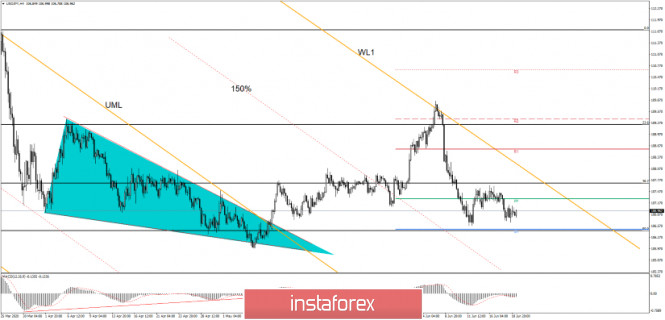
| Posted: 19 Jun 2020 02:21 AM PDT USD/JPY could rebound in the short term if the USDX and the Nikkei stock index will climb higher. The pair is trading at 106.92 level, it is moving sideways on the lower timeframes, that's why we need confirmation before we consider going long again on this pair. The pair is still under massive selling pressure, it is located below major resistance levels, only a valid breakout above the near-term obstacles could suggest buying again. The price action has signaled that the decline could end and that USD/JPY could develop a bullish momentum in the short term.
USD/JPY has decreased sharply after the rejection from the first warning line (WL1) of the orange descending pitchfork, but it has failed to reach at least the 150% Fibonacci line (descending dotted line) or the 50% level, near the S1 (106.47). The pressure is still high as long as USD/JPY is trading below the Pivot Point (107.28) level and below the warning line (WL1). Technically, only a valid breakout above the warning line (WL1) and above the 38.2% level will really confirm a reversal and a potential larger upwards movement. USD/JPY could resume its sideways move, you should be careful because another lower low, a valid breakdown below the 50% level and below the S1 (106.47) will signal a further drop. Personally, I would have liked to see a false breakdown with great separation below the S1 (106.47) because this action would have signaled a reversal and it would have given us a chance to buy it from the lows.
A valid breakdown below the S1 (106.47) will invalidate a potential reversal and will confirm a further drop towards the 150% Fibonacci line and towards the S2 (105.18) static support. We may have a long opportunity if USD/JPY will make another higher high, it if jumps and closes above the 107.63 level, and above the 38.2% level. As I've said earlier, a reversal and a major upside movement will be confirmed only if USD/JPY registers a valid breakout above the first warning line (WL1). The R1 (108.57) could be used as a potential upside target. The material has been provided by InstaForex Company - www.instaforex.com |
| Technical analysis of EUR/USD for June 19, 2020 Posted: 19 Jun 2020 02:09 AM PDT Overview: The price is still moving around the spot of 1.1190 / 1.1210. The EUR/USD pair didn't make any significant movements yesterday. There are no changes in our technical outlook. The bias remains bullish in the nearest term testing 1.1315 or higher. The EUR/USD pair continues to move upwards from the level of 1.1207. Right now, the first resistance level is seen at 1.1258 followed by 1.1315 and 1.1375, while daily support 1 is seen at 1.1207. According to the previous events, the EUR/USD pair is still moving between the levels of 1.1207 and 1.1375; so we expect a range of 168 pips. Furthermore, if the trend is able to break out through the first resistance level at 1.1258, we should see the pair climbing towards first resistance (1.1315). Therefore, buy above the level of 1.1258 with the first target at 1.1315 in order to test the daily resistance 1 and further to 1.1375. Also, it might be noted that the level of 1.1375is a good place to take profit because it will form a double top. This would suggest a bullish market because the RSI indicator is still in a positive spot and does not show any trend-reversal signs. Therefore, it will be advantageous to buy above 1.1207 with a first target 1.1258 in order to test the weekly pivot point. It may resume to .1375 if the price is able to break 1.1258. On the other hand, stop loss should always be in account, consequently, it will be of wholesome to set the stop loss below the support 1 at the price of 1.1175. The material has been provided by InstaForex Company - www.instaforex.com |
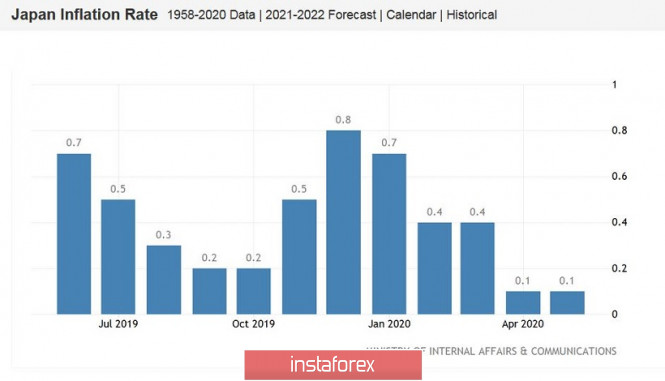
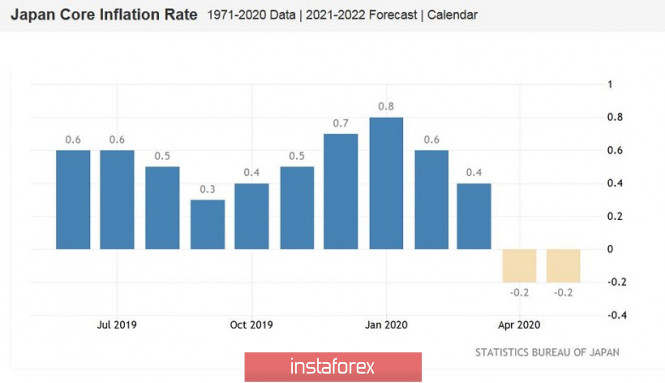
| USD / JPY: Conflicting statistics and troubling news from the Korean Peninsula Posted: 19 Jun 2020 01:50 AM PDT Today's publication on inflation in Japan is mixed. General consumer price index came out at a forecasted level, repeating the trajectory in April (the indicator also turned out to be around 0.1% in May), while the consumer price index excluding fresh food prices was in the "red zone", dropping to -0.2% (with a forecast decline to -0.1%). "Cleaned" inflation (CPI excluding food and energy prices), on the contrary, came out in the "green zone", exceeding experts' expectations by growing to 0.4%, higher than the expected 0.2%. In other words, inflation exceeded forecast values and did not provoke volatility in the USD / JPY pair. Traders of this pair have not been active recently, even amid the meeting of the Bank of Japan in June. Only the escalation of geopolitical tensions in the Korean peninsula and on the border between India and China did the bears manage to shift the quotes one step downwards, thus, if at the beginning of the week, the quotes did not leave the limits of the 107th figure, the upper "border" now is 107.30, while the pair basically resides within 106 price levels.
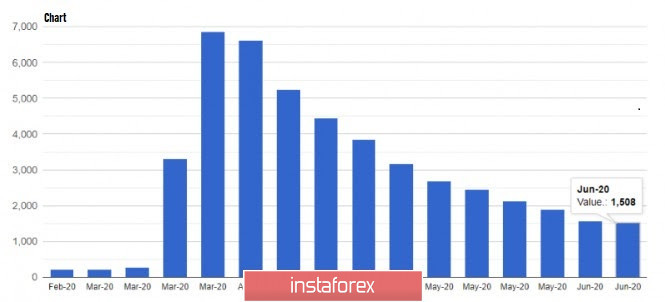
Yesterday, the USD / JPY pair updated its weekly low after the publication of weak macroeconomic statistics from the US. According to the data, the number of applications for unemployment benefits increased by 1 million 508 thousand, slightly higher than the forecasted 1 million 300 thousand. The indicator, for 10 weeks, stably and consistently showed a downward trend (after nearly reaching 7 million), but this week came out almost at the level of earlier records. This suggests that the trend in the labor market is still unhealthy, so traders should remember the Fed's warning on the slower and longer recovery of the US economy. Such a factor became another anchor for the dollar. Additional pressure was provided by the statements of the head of Cleveland Fed, Loretta Mester, who said that the regulator is ready to expand its balance "if necessary". She also noted that the issue of controlling the yield curve "remains under discussion", and the recovery of the US economy is estimated to take place at a much longer time. As for inflation, it will continue to decline which may lead to lower inflationary expectations, so the Fed will maintain a soft policy for a long period of time. Thus, interest rates will not change and remain at low levels in the future. By and large, Mester did not say anything new, but her rhetoric added to the negative background for the dollar. It allowed the bears to push the USD/JPY quotes to the middle of the 106th figure, but when it reached 106.68, the strength of the bulls intensified, which resulted to a slowdown and rebound of quotes. Hence, the quotes did not leave the range of the 106th figure, and as soon as the pair touched one of the limits of the channel, the bears seized control of the market again. Nevertheless, the yen has a reason for growth again, as tensions in the Korean Peninsula are escalating, due to the decision of North Korea to send troops into the demilitarized zone on the border with South Korea. At the previously empty border posts, several military DPRKs were noticed. According to experts, Pyongyang may have approximately 150 posts, which ceased to function after the signing of the inter-Korean peace treaty in 2018. The demilitarized zone is not only the border between the DPRK and South Korea, but also the front line, since formally the countries have been at war since 1950.
The US also responded to such events, with the Assistant Secretary of Defense for Indo-Pacific Security Affairs saying that the United States is prepared to counter and defend North Korea's threats "if necessary." Thus, further aggravation of the Korean conflict may provide additional support for the Japanese currency, which, together with the dollar, may strengthen to the base of the 106th figure. If the market sees signs of de-escalation (for example, if Pyongyang agrees to negotiations through the mediation of China), the USD/JPY pair will go to 107.30, the upper border of the price channel. In other words, the movement will depend not on macroeconomic news, but on news from the Korean Peninsula. Given the trends of recent days, it can be assumed that the next conflict between the DPRK and South Korea has not yet reached its peak, so the USD/JPY pair maintains a bearish potential. The material has been provided by InstaForex Company - www.instaforex.com |
| Instaforex Daily Analysis - 19th June 2020 Posted: 19 Jun 2020 01:33 AM PDT Today we take a look at and see GBPUSD how we are going to play the bounce! We use Fibonacci retracements, extensions, support/resistance, momentum and trend lines to identify trading opportunities in this exciting pair today! The material has been provided by InstaForex Company - www.instaforex.com |
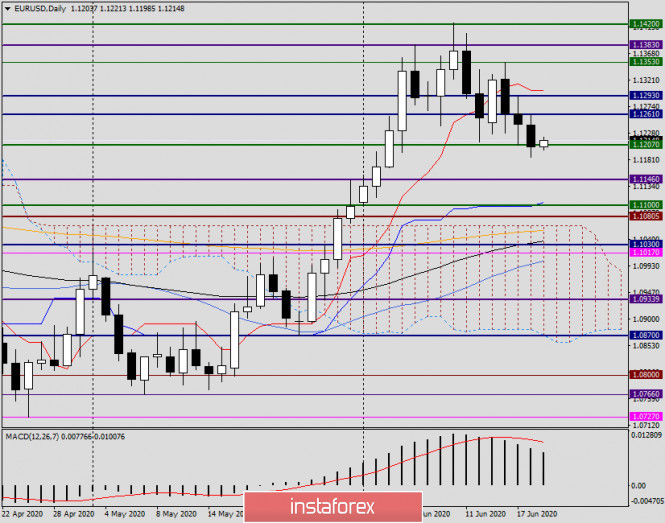
| Analysis and forecast for EUR/USD on June 19, 2020 Posted: 19 Jun 2020 01:25 AM PDT Hello, dear colleagues! If we sum up the interim results of the current weekly trading on the main currency pair of the Forex market, then, as expected at the beginning of the current five-day period, EUR/USD continued its downward movement. Investors' minds are influenced by fears of the second wave of COVID-19, as well as improving macroeconomic data from the US, which shows the recovery of the world's leading economy after the spring coronavirus pandemic. Of course, it is too early to talk about a complete victory over COVID-19, however, the signs of economic recovery in the US are obvious. So, yesterday it became known that the number of Americans who applied for unemployment benefits, although it came out worse than expected, however, it improved compared to the previous figure of 1566 (revised from 1542) and amounted to 1508. In Europe, the process of approving the stimulus package proposed by the European Commission continues. Here, as they say, there is no unity. The debate continues. Several countries are opposed to providing assistance grants to the EU states most affected by the pandemic. Looking at today's economic calendar, you can select data of the USA with trade balance, as well as speeches by senior monetary officials of the Federal Reserve System (FRS), among which stands out the speech of Powell, which is scheduled for 18:00 (London time). Daily
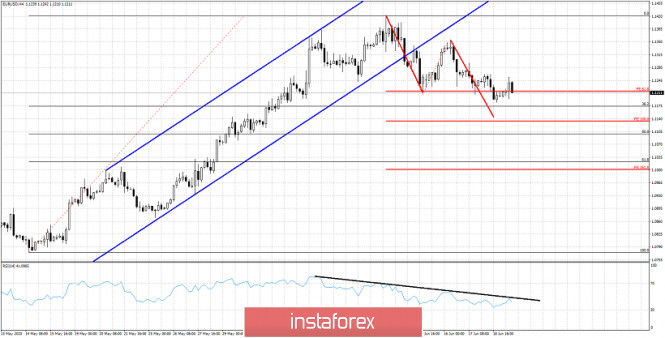
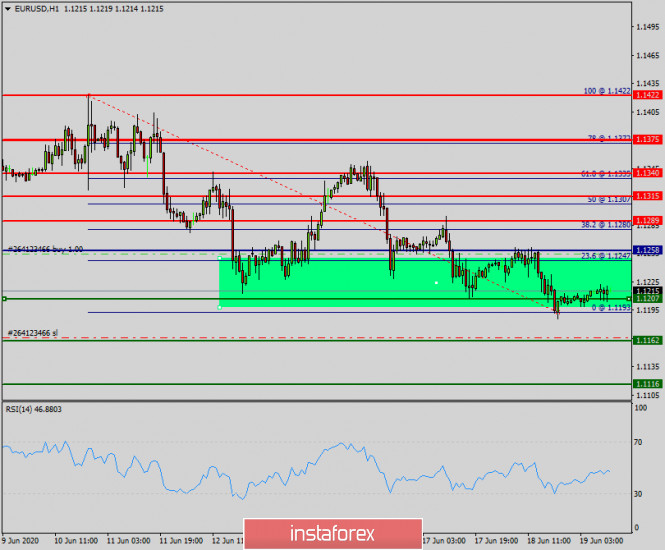
Turning to the technical picture of the euro/dollar, it is worth noting that the significant technical level of 1.1200 again stood, and Thursday's trading ended at 1.1204. On the last day of current trading, positions can be adjusted. Investors will likely start fixing positions before the weekend and the pair will grow slightly. If this happens, the nearest targets of the euro bulls will be yesterday's highs at 1.1261, and higher highs on June 17 at 1.1293 and the Tenkan line of the Ichimoku indicator, which runs at 1.1303. Closing daily and weekly trading above 1.1300 will give hope for further strengthening of the main currency pair. If the day and week end under another very important mark of 1.1200, next week we should expect a continuation of the downward scenario. H1
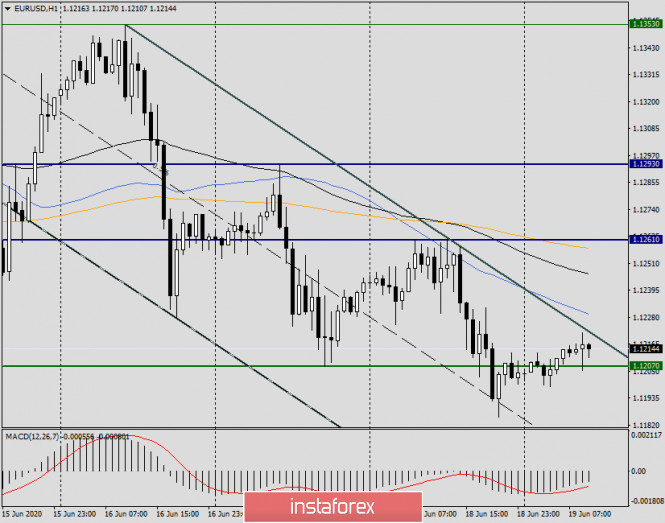
On the hourly chart, the pair is traded in a descending channel with parameters: 1.1353-1.1258 (resistance line) and 1.1227 (support line). At the time of writing, trading takes place near the resistance line of this channel. The pair shows moderate growth, and most likely, there will be an attempt to break the upper border of the channel. In this case, the situation for EUR/USD bulls is complicated by finding the moving averages used above the channel's resistance line: 50 MA, 89 EMA, and 200 EMA. I can assume that the breakdown of the upper border of the descending channel will be false, and the pair will turn to decline from one of the moving averages. Trading recommendations for EUR/USD: Taking into account the increased demand for the US currency and the technical picture on the higher timeframes (we will consider the weekly one on Monday), I consider the main trading idea to be sales, which can be tried to open on attempts to go up from the hourly descending channel, from the moving averages. I suggest considering opening short positions from 1.1230, 1.1245, and 1.1255. It is more aggressive and risky to sell from the current price of 1.1215, however, the risk of running into a rebound is high. Despite the probability of a corrective pullback, I recommend that you refrain from buying today. Good luck! The material has been provided by InstaForex Company - www.instaforex.com |


| You are subscribed to email updates from Forex analysis review. To stop receiving these emails, you may unsubscribe now. | Email delivery powered by Google |
| Google, 1600 Amphitheatre Parkway, Mountain View, CA 94043, United States | |
No comments:
Post a Comment