
Forex analysis review |
- Comprehensive analysis of movement options for #USDX vs EUR/USD & GBP/USD & USD/JPY (Daily) on August 24, 2020
- Analysis of EUR/USD on August 21
- Gold price forms a Head and shoulders pattern
- USDJPY remains inside bearish channel
- Bearish technical pattern in AUDUSD
- Analytics and trading signals for beginners. How to trade the EUR/USD currency pair on August 21? Plan for opening and closing
- EUR/USD closing week in red amid poor PMIs and Brexit jitters
- Evening review on August 21, 2020
- Technical analysis. EUR/USD. False or true breakout?
- Great Britain walks tightrope
- US and Asian stocks rise, while Europe went irresolute
- Euro loses its benchmark: value declines
- August 21, 2020 : EUR/USD daily technical review and trade recommendations.
- August 21, 2020 : EUR/USD Intraday technical analysis and trade recommendations.
- August 21, 2020 : GBP/USD Intraday technical analysis and trade recommendations.
- EUR / USD correction only a respite for conquering new highs
- The euro was hit by the second wave of the pandemic
- GBPUSD: Pound is on its own
- EURUSD: Gloomy ending of Summer 2020 for the European economy. Statistics push down the euro continuously
- BTC analysis for August 21,.2020 - Inside days pattern and potential for the breakout
- Analysis of Gold for August 21,.2020 - Testiing the bottom of the trading range at $1.925, potential for the upside rotation
- AUD/USD Lost Another Support!
- EUR/USD analysis for August 21 2020 - Exhaustion from sellers this morning and potential for upside rotation towards the
- GBP/USD: plan for the American session on August 21
- EUR/USD: plan for the American session on August 21
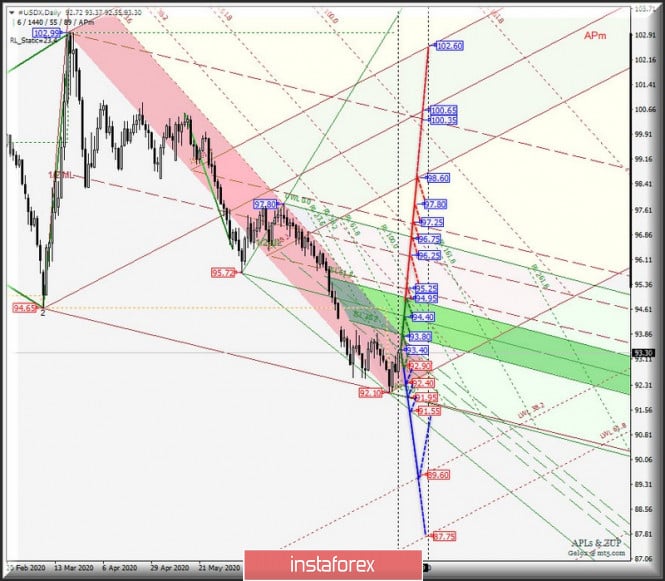
| Posted: 21 Aug 2020 09:48 AM PDT Minor operational scale (Daily) Summer is over - correction begins? Options for the development of the movement #USDX vs EUR/USD & GBP/USD & USD/JPY (Daily) on August 24, 2020. ____________________ US dollar index From August 24, 2020, the movement of the dollar index #USDX will be determined by the development and direction of the breakdown of the boundaries of the 1/2 Median Line channel (92.90 - 93.40 - 93.80) of the Minute operational scale fork - we look at the animated chart for details of working out the boundaries of the 1/2ML Minute channel. If the resistance level 93.80 is broken at the intersection of the upper border of the 1/2 Median Line Minute channel with ISL38.2 Minute, then the #USDX movement will proceed within the equilibrium zone (93.80 - 94.40 - 94.95) of the Minute operational scale fork with the prospect of reaching the boundaries of the 1/2 Median channel Line (95.25 - 96.25 - 97.25) of the Minor operational scale fork. In case of a breakdown of the support level of 92.90 at the lower border of the 1/2 Median Line channel of the Minute operational scale fork, the downward movement of the dollar index can continue to the targets:
The layout of the #USDX movement options from August 24, 2020 is shown on the animated chart.
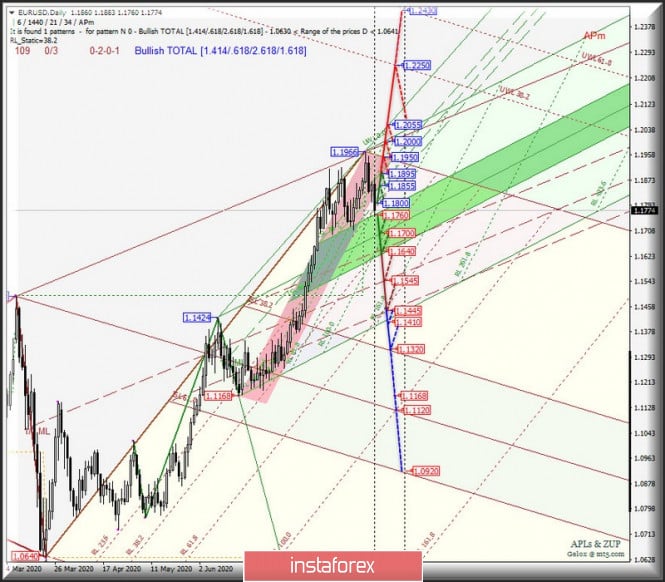
____________________ Euro vs US dollar The single European currency EUR/USD from August 24, 2020 will develop its movement depending on the direction of the breakdown of the range:
In case of breakdown of ISL38.2 Minute - support level - the development of the EUR/USD movement can be continued within the equilibrium zone (1.1760 - 1.1700 - 1.1640) of the Minute operational scale and 1/2 Median Line channel (1.1640 - 1.1545 - 1.1445) of the Minor operational scale. The breakdown of the resistance level at 1.1800 will make the development of the movement of the single European currency within the 1/2 Median Line channel (1.1800 - 1.1855 - 1.1895) of the Minute operational scale, and if the upper boundary thereof (1.1895) is broken, this upward movement can be directed to the targets:
The EUR/USD movement options from August 24, 2020 are shown on the animated chart.
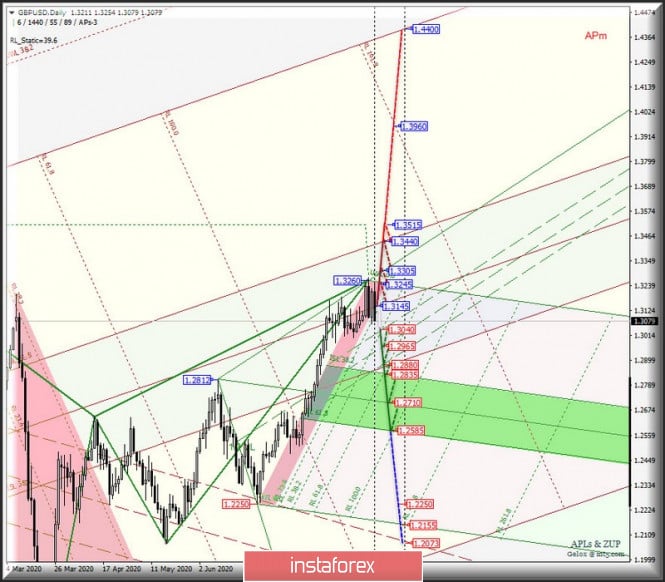
____________________ Great Britain pound vs US dollar The development of the movement of Her Majesty's currency GBP/USD from August 24, 2020, will continue its movement within the equilibrium zone (1.3440 - 1.3145 - 1.2880) of the Minor operational scale fork and will be determined by the development and direction of the breakdown of the range:
The breakdown of the support level of 1.3040 will determine the development of the movement of GBP/USD in the channel 1/2 Median Line Minute (1.3040 - 1.2965 - 1.2880), and the breakdown of the lower boundary of this channel at the intersection with the lower border ISL38.2 (1.2880) equilibrium zone of the Minor operational scale fork will be the achievement price of this tool a zone boundary equilibrium (1.2835 - 1.2710 - 1.2585) of the Minute operational scale fork. The breakdown of the resistance level 1.3145 on the Median Line Minor will make it relevant to develop the movement of the currency of Her Majesty to the goals:
We look at the options for the movement of GBP/USD from August 24, 2020 on the animated chart.
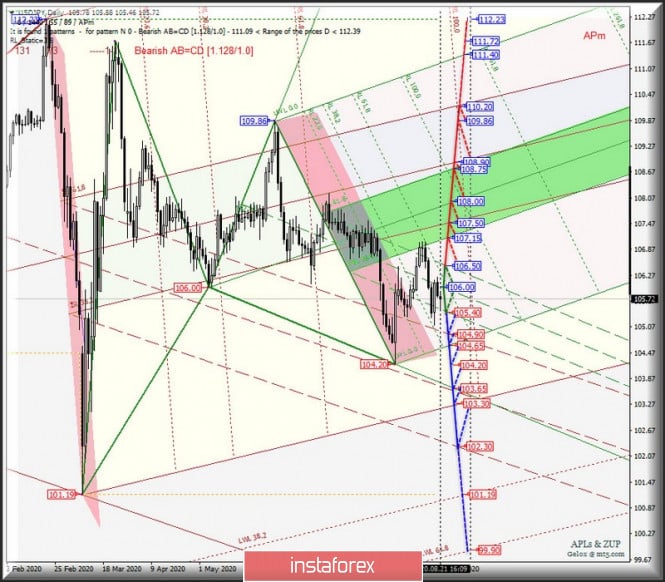
____________________ US dollar vs Japanese yen The development of the movement of the currency of the "Land of the Rising Sun" USD/JPY from August 24, 2020 will be due to the development and direction of the breakdown of the boundaries of the 1/2 Median Line channel (105.40 - 106.00 - 106.50) of the Minute operational scale forks - we look at the animated chart for details of the movement within this channel. The breakdown of the resistance level of 106.50 on the upper border of the channel 1/2 Median Line Minute will be the actual continuation of the upward movement of USD/JPY to the borders of the equilibrium zone of the Minute operational scale fork (107.15 - 108.00 - 108.75) and Minor (107.50 - 108.90 - 110.20). A breakdown of the lower boundary of the 1/2 Median Line channel of the Minute operational scale fork - support level 104.80 - will make it possible to continue the downward movement of USD/JPY to the boundaries of the 1/2 Median Line channel (104.90 - 103.65 - 102.30) of the Minor operational scale fork. The markup of USD/JPY movement options from August 24, 2020 is shown on an animated chart.
____________________ The review is compiled without taking into account the news background, the opening of trading sessions of the main financial centers and is not a guide to action (placing "sell" or "buy" orders). Formula for calculating the dollar index: USDX = 50.14348112 * USDEUR0.576 * USDJPY0.136 * USDGBP0.119 * USDCAD0.091 * USDSEK0.042 * USDCHF0.036. Where the power coefficients correspond to the weights of currencies in the basket: Euro - 57.6 %; Yen - 13.6 %; Pound - 11.9 %; Canadian dollar - 9.1 %; Swedish Krona - 4.2 %; Swiss franc - 3.6 %. The first coefficient in the formula brings the index value to 100 on the starting date - March 1973, when the main currencies began to be freely quoted relative to each other. The material has been provided by InstaForex Company - www.instaforex.com |
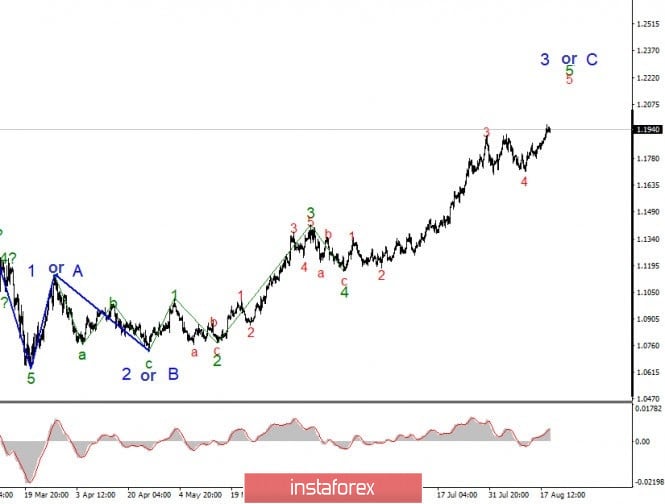
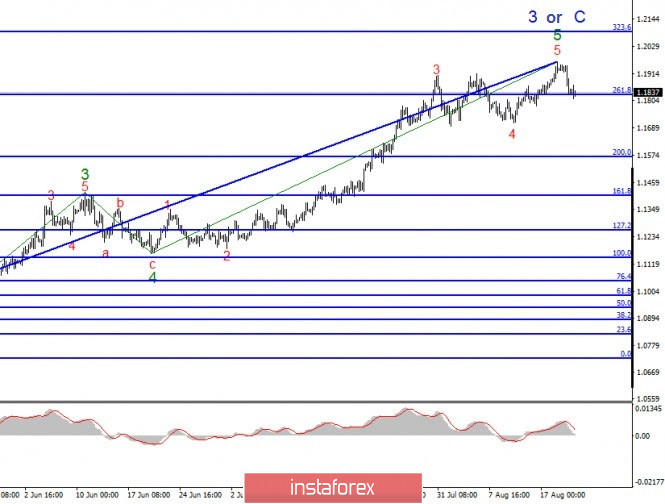
| Analysis of EUR/USD on August 21 Posted: 21 Aug 2020 09:48 AM PDT In the most global terms, the wave marking of the EUR/USD instrument has undergone certain changes this week, however, at this time, it looks coherent and convincing. The upward section of the trend is presumably nearing its end or has already been completed. Thus, in the near future, wave 4 should begin its construction (or has already begun). Or the first wave of a new downward trend section. A successful attempt to break through the low wave 4 will confirm the readiness of the markets to reduce the instrument. A smaller-scale wave markup refines data obtained from a higher timeframe. The attempt to break the peak of the supposed wave 3 was successful, but, as mentioned above, wave 5 can now end at any moment. At the same time, the quotes of the instrument can continue to increase if the wave 5, 5, 3 or C takes a complex and extended form. At the moment, everything looks as if the upward section of the trend or its wave 3 or C is completed. Thus, I expect to build at least one global wave, possibly 4 upward trend sections, possibly the first of a new downward trend section. On Thursday, August 20, the day after the release of the minutes, the FOMC presented its minutes of the last meeting and the European Central Bank. Thus, it turned out that the ECB Monetary Committee believes that the economy will need additional stimulus measures in the near future. Representatives of the ECB note new downward risks for the economy, as, first, many EU states have eased quarantine measures to a minimum, and secondly, they began to curtail programs to help the population and small businesses in times of a pandemic. Members of the ECB Monetary Committee did not agree at the July meeting on the possible expansion of the program to counter the economic crisis caused by the COVID pandemic. Some ECB members support its expansion from the current 1.35 trillion euros, while some do not support this proposal. Also in the second half of yesterday, data on applications for unemployment benefits in America was released. The report showed a new increase in the number of initial applications compared to the previous week. The total number of secondary applications fell to 14.844 million. On Friday morning, the European Union released reports on business activity in the manufacturing sector (51.7), the service sector (50.1). As well as similar indices in Germany and France. All indices were significantly below market expectations, which indicates that the services and manufacturing sectors, if not started to decline again, are on the verge of starting this process. If the business activity indices go below 50.0 again, it will mean that the EU economy will start to slow down again. General conclusions and recommendations: The euro/dollar pair resumed the construction of the expected global wave 3 or C. Thus, at this time, I recommend new purchases of the instrument with targets located near the calculated mark of 1.2089, which corresponds to 323.6% of the Fibonacci, for each MACD signal up. At the same time, the wave 5, 5, 3 or C could have already ended. If the low of wave 4 is passed, then after building a corrective wave 2 or b, it will be possible to open sales of the instrument. The material has been provided by InstaForex Company - www.instaforex.com |
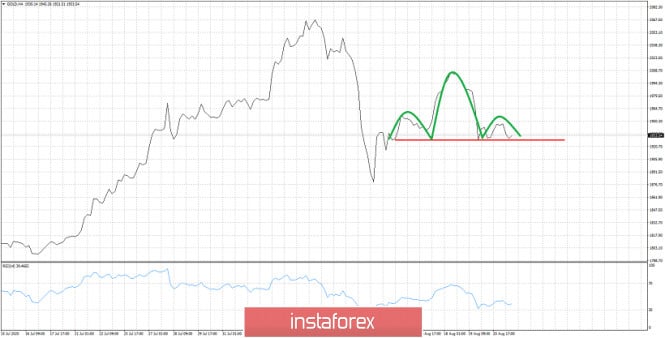
| Gold price forms a Head and shoulders pattern Posted: 21 Aug 2020 09:37 AM PDT Gold price is forming in the 4 hour chart a Head and shoulders pattern. With the neckline support at $1,928 it is important for bulls to defend this price level. Breaking below this level will open the way for a move towards $1,900 and lower.
Green lines - Head and Shoulders pattern Gold price is challenging the neckline support at $1,928. We get a bearish signal if price breaks and closes below the red line support. Bulls want price to bounce off support and break above the right hand shoulder. This means that bulls want price to break above $1,950 in order to lower the chances of success of this bearish pattern. The material has been provided by InstaForex Company - www.instaforex.com |
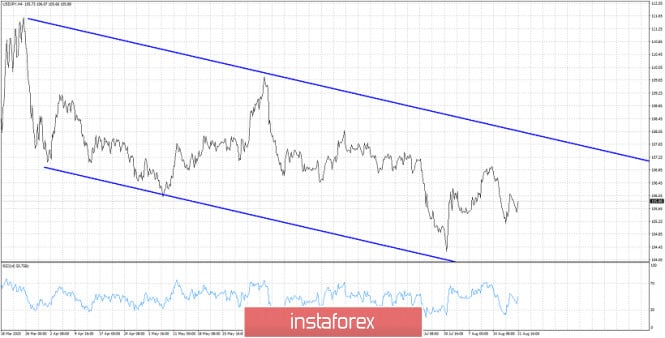
| USDJPY remains inside bearish channel Posted: 21 Aug 2020 09:32 AM PDT USDJPY is trading around 105.90. Price continues to form lower lows and lower highs since March where it made a top around 111.60. Price remains vulnerable to a move towards 102. Short-term resistance is found at 107.
USDJPY has resistance at 107-107.50 area. Support is at 105.20 and next at 104.30. Price will most probably move lower over the next couple of weeks. Bulls in order to change trend to bullish they will need to recapture 107.50. On the other hand bears need to hold price below 107 and eventually break support at 104. The material has been provided by InstaForex Company - www.instaforex.com |
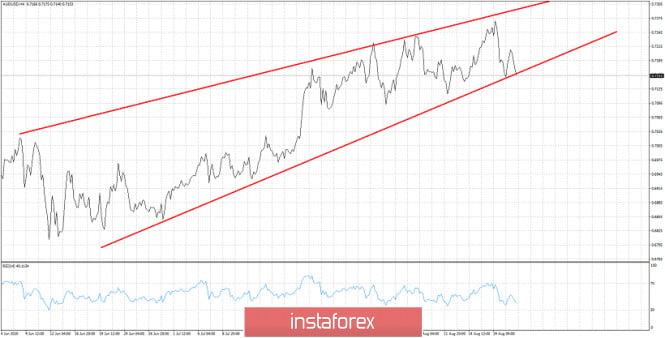
| Bearish technical pattern in AUDUSD Posted: 21 Aug 2020 09:26 AM PDT AUDUSD is forming a bearish wedge pattern. Price is in an upward sloping triangle pattern. Price is challenging lower support boundary at 0.7150 and breaking it will be the first weakness signal.
|
| Posted: 21 Aug 2020 09:15 AM PDT
The EUR/USD currency pair fell by 128 points during the last trading day of the week (at the time of writing). For most of the past day and on Friday morning, an upward correction took place. In yesterday's evening article, we said that it is best to wait for the new MACD signal to sell. And they emphasized that the closer the indicator turns down to zero, the better. In practice, it turned out that the indicator turned down just around the zero mark and began a strong fall. Thus, it was necessary to open short positions on this signal and by the end of the day, the price reached (almost) the third support level of 1.1751. Even if novice traders have not closed positions near this level, it can be done now, which will also bring about 60-70 points of profit. It is recommended to consider options for opening new positions in the new week. On August 21, the European Union was scheduled to publish business activity indices in the services and manufacturing sectors. Recall that these indicators reflect the activity of purchasing managers and are an indicator of changes in business conditions in the industry. Any value above 50 means that everything is fine in the area. However, if the index value decreases, it means that the situation is still slightly worse, but as long as the value is above 50, everything is fine. Today, all three indices of business activity in the Eurozone were worse than expected by traders, and significantly decreased compared to the previous month – July. It cannot be said that these indices were the reason for the fall of the European currency. Most likely, they lie in the fact that the fall of the euro has been long overdue. But the very fact of a downturn in services and manufacturing suggests that the European economy may again face slowing problems in the coming weeks. Moreover, in some EU countries, there are signs of a new wave of the "coronavirus" pandemic. If Europe is hit again by a pandemic, it will mean that its economy will start to slow down again by almost 100%. In turn, this will affect the euro currency itself and its rate. The US dollar has fallen in price for a long time and strongly, and if problems start in the European Union now, this will be an additional motive for traders to get rid of the European currency. Thus, in the future, the euro currency may begin to experience problems. US business activity indices, on the contrary, exceeded the forecast values, which speaks in favor of the US economic recovery. On August 21, the following scenarios are possible: 1) Buying a pair at this time is not recommended to consider. Even if the upward trend resumes from the current positions (which is unlikely), signals are needed for new purchases of the euro currency. Technical factors now speak in favor of the growth of the dollar. Thus, to consider the pair's purchases, you need to wait for the formation of a new upward trend, building trend formations and patterns. 2) But we recommend selling the pair at this time. However, today it is better, on the contrary, to close all transactions for sale, and consider new ones next week. However, the downward trend remained at the end of Friday, so you need to wait for a new pullback of quotes to the top, and then wait for the signal to sell again. New goals will be formed on Monday. Today, all the goals were fulfilled. What's on the chart: Price levels of support and resistance – levels that are targets when opening purchases or sales. You can place Take Profit levels near them. Red lines – channels or trend lines that display the current trend and indicate which direction it is preferable to trade now. Up/down arrows – show when you reach or overcome which obstacles you should trade up or down. MACD indicator (10,20,3) – a histogram and a signal line, the intersection of which is a signal to enter the market. It is recommended to use it in combination with trend lines (channels, trend lines). Important speeches and reports (always contained in the news calendar) can greatly influence the movement of the currency pair. Therefore, during their exit, it is recommended to trade as carefully as possible or exit the market in order to avoid a sharp reversal of the price against the previous movement. Beginners in the Forex market should remember that every trade cannot be profitable. The development of a clear strategy and money management are the key to success in trading over a long period of time. The material has been provided by InstaForex Company - www.instaforex.com |
| EUR/USD closing week in red amid poor PMIs and Brexit jitters Posted: 21 Aug 2020 08:03 AM PDT EUR/USD is closing the week in the red. For the first time in a few weeks, the decline is triggered by weakening of the single European currency. In fact, the USD advance is of secondary importance here. A series of PMIs for the eurozone discouraged traders as all of them logged lower scores that signals a slowdown in the economic recovery. Besides, EUR/USD is trading under pressure on the back of the Brexit saga. The talks between London and Brussels have come to a stalemate again, though the parties were optimistic about the trade deal not long ago, sending a message about a breakthrough. Unfortunately, this has not happened. Brexit negotiators had to admit the impasse. In response, the sterling plummeted immediately, dragging down the euro from its record highs. Such fundamental background enabled the euro bears to test the level of 1.17, though the downward momentum was muted in the early New York trade. Let's start with European statistics. Today, the Market research group published PMIs for the key European economies, which were mostly in the "red zone". For example, in France, the manufacturing PMI declined and again crossed the threshold 50-point mark, reaching 49 points. For two months - in June and July - this index posted an increase in the manufacturing business activity. But the August result was disappointing: contrary to the expected growth to 53 points, it fell below the key level. A similar situation has developed in the service sector: the indicator slipped to 51.9 points, while in July it jumped to 57 points. German figures showed mixed dynamics: in the manufacturing sector, the PMI index rose to 53 points to the strongest level on a year, but in the service sector, it dropped to 50.8 points, defying the forecast for a significant increase to 55 points. The pan-European PMI indices followed the trajectory of the French indicators: in the manufacturing sector, the indicator fell to 51 points (after growing by almost 53 points), the services PMI dropped to 50.1 points almost to the threshold level. The fresh data put bearish pressure on the single currency, despite the rise in the German manufacturing PMI. Besides, Michel Barnier, the chief Brexit negotiator of the EU authorities, added to the overall strain. Today he held a press conference at which he summed up the results of the latest round of the talks. In essence, the policymaker stated the lack of progress in these negotiations. Barnier admitted that the British side is too adamant "to his surprise" and does not tolerate any compromise. Therefore "it will not be easy to agree." He also made it clear that the parties failed to come to the common denominator on key points of the deal. A little later, his colleague from the British side, David Frost, held his press conference, where he voiced similar rhetoric, only of a "mirror" nature. In particular, he said that the European Union continues to insist that the UK should agree with the policy of state aid and with the policy in the field of fisheries. Importantly, at the beginning of August there were rumors that Brussels might compromise in the negotiations with London. According to Reuters, Europe is ready to soften one of its key demands on Britain - the requirement to adhere to EU rules on state aid. According to unofficial information, Brussels is considering a dispute resolution mechanism that will allow London to fully control the cash injections and tax breaks for UK companies after a transition period at the end of this year. Thus, Britain will not have to adjust to EU requirements under equal competitive terms. The provision on ensuring fair competition along with fisheries policy are the main stumbling blocks in the negotiations between London and Brussels. Therefore, the lack of progress on these issues is a legitimate concern - both for traders of GBP/USD and for traders of EUR/USD. From a technical point of view, the pair has not completed its correctional decline. The bears broke the 1.1800 support level, thus pushing the price below the average line of the Bollinger Bands indicator on the daily chart. The next support level is located at the lower line of this indicator (on the same timefras low as 1.17 even before the end of Friday trade. The material has been provided by InstaForex Company - www.instaforex.com |
| Evening review on August 21, 2020 Posted: 21 Aug 2020 07:32 AM PDT
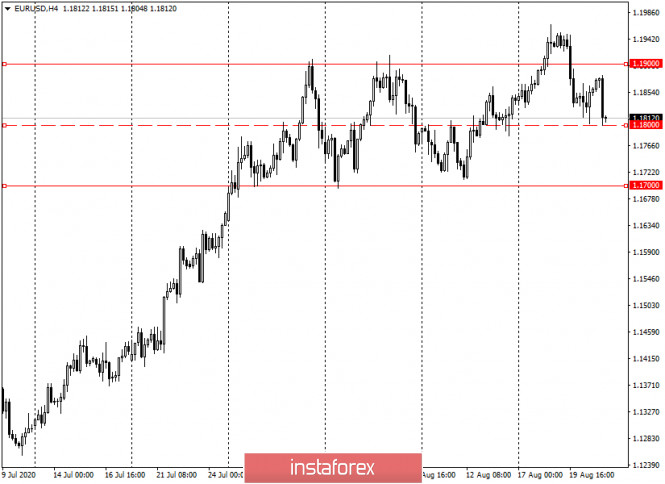
EURUSD: Euro breaks the downward range border, but can it also break the upward trend? The euro is at critical levels - the opening price and the minimum of the month. These are important points. It should be noted that if it breaks down, there will be a strong depletion. You may consider selling from 1.1800, stop at 1.1845. In case of a complete upward reversal, you may consider buying from 1.1885. The material has been provided by InstaForex Company - www.instaforex.com |
| Technical analysis. EUR/USD. False or true breakout? Posted: 21 Aug 2020 06:45 AM PDT This week we have an opportunity to observe an interesting pattern. The ability to use it is one of the key skills in technical analysis. This is a false breakout, which is a powerful signal for making a tradedeal in the opposite direction. However, not all traders understand how to distinguish a false breakout from a true one. Their descriptions available on the web do not provide clear understanding and only analyze graphic charts after the event has occurred. In this article, I will try to describe as clearly as possible the algorithm for detecting a false breakout so that you will be able to use it when analyzing the situation in the FOREX market. The EURUSD exchange rate will help us with this. The concept of a time frame usually falls out of sight of many traders. Meanwhile it is a key factor that affects the definition and operation of technical patterns. The time frame determines not only how long a trade will be in the market, but also the development of chart patterns in the trading terminal.
A deal opened in the daily time frame will be in the market for one to three months. A deal opened in a 4-hour time frame will be in the market from one week to one month. A deal opened in an hourly time frame will be in the market from one day to one week. We are talking about 70% of cases, and deviations in one direction or another will occur within the normal distribution. Some of the deals will be closed outside the announced ranges, but their number will not exceed 30% Understanding of the time a trade is in the market is very important not only for determining the amount of charged swaps, but also for the so-called "closing prices", which are the main element of technical analysis. Accordingly, for the daily time frame, the key closing prices will be the month and the quarter, for the four-hour frame time - the week and month, for the hourly time frame - the day and the week. On InstaForex platforms, in the chart properties ("F8" key), traders need to set the "show period separators" parameter, after which the chart will automatically display horizontal lines showing the beginning and end of the period for each specific timeframe (Fig. 1). Thus, it will be easier to determine a false and true breakout. A breakout will be considered true when the closing price is above the key level and the price moves up, or below the key level when the price moves down and the main time period of the time frame is closed. Let's analyze the situation using a specific example of the current EUR/USD rate (Fig. 1).
Fig. 1 As seen from Chart 1, in the 4-hour time frame in July 2020, the European currency rate formed an upward trend, which formed a range in the area of 1.17–1.19 in late July and early August. In theory, any range is a trend continuation pattern, which in our case corresponds to an upward movement. However, some traders saw a "double top" on the EURUSD chart and rushed to take a short position, which was wrong, since the euro had not yet broken the bottom at 1.17. The mistake of traders who rushed to sell the euro was that they did not wait for the price to close below the base level at 1.17. Moreover, traders had to wait not only for the breakout at the bottom of the range from top to bottom, but also for the week to close below this level. Reversing from the level of 1.17, the euro headed to the upper border of the range, made a breakout at the level of 1.19 from the bottom up. Traders, expecting the growth of the euro rate to the level of 1.24, began to open long positions, but that was not the case, and the price, having made a false breakout, returned back to the range. I am a little ahead of the events, calling the breakout "false", but with some confidence I assume that the EURUSD rate for the time remaining until the end of the trading week - several hours of the American session - will not be able to consolidate above the level of 1.19. As we can see in both cases, traders made the same mistake - they opened a position before the end of the key period and lost money in both cases. However, a false breakout is a significant trend reversal pattern. Therefore, after the current false breakout can we expect the EURUSD rate to reverse and decline? Yes, that's exactly what you can expect - you can't open a position. Anyone who is now in a hurry to open a position to sell the EURUSD risks losing money again. No one knows where the price will go next, including me. We don't need it. We are required to outline targets at the top and bottom, and then wait for the price breakout in one direction or another. Using the methods of technical analysis, which are beyond the scope of this article, I can assume that the target of EURUSD at the top will be the level of 1.24, and the target of a possible decline will be the level of 1.12. Now I just have to wait in which direction a true breakout will occur. In other words, I am going to observe where at the end of the next week the price will be: above the level of 1.19 or below the level of 1.17. Then I am going to find a place to set a stop order and check the profit and risk ratios. Possibly, while we are waiting for the close of the week, the price will change significantly and opening a position in one direction or another will no longer be profitable. As you can see, applying a simple rule for the end (close) of the key period before making a decision can allow the trader to avoid unnecessary losses. Be careful and follow the money management rules. The material has been provided by InstaForex Company - www.instaforex.com |
| Posted: 21 Aug 2020 06:05 AM PDT
UK retail sales for July were much higher than expected. As a result, the British pound jumped to a 1.5-month high against the euro. Economists expected sales to remain unchanged. However, retail sales rose year-on-year compared to the previous month. Monthly indicators also exceeded expectations. Derek Halpenny, the head of research at MUFG, claims that this is the only way to keep the pound afloat. Moreover, the weakening of the American currency may contribute to the strengthening of the British one. However, the expert believes that such an impressive growth should be feared. The pound sterling rose by 0.3% to 89.46 against the euro. Last time this situation was observed in July. The pound also rose by 0.1% to $1.3225 against the US dollar. Now the pound has lost some gains amid the general strengthening of the US dollar. The British pound exchange rate is influenced by several internal and external factors, such as the interest rate, inflation rates, data on GDP and economic activity, employment and unemployment rates, and the volume of national debt. Obviously, not everything is as good as we would like to see. Moreover, Brexit negotiations still have no results. According to some information, the latest round of negotiations this week did not lead to a breakthrough on key issues. Great Britain and the European Union are far away from making a trade deal after Britain left the EU. In addition, British Prime Minister Boris Johnson fears that Northern Ireland and Scotland will want to secede from the country after Brexit. He ordered to provide assistance to the regions. The pound is sure to face problems in this case. Moreover, the UK national debt has hit a record low. It has exceeded £2 trillion ($2.65 trillion) for the first time as the officials increased government spending to cope with the COVID-19. The worst thing here is that the size of the national debt has already exceeded the size of the country's GDP. The budget deficit in July was £26.7 billion ($35 billion), while borrowings rose to £150.5 billion ($197.7 billion). The UK economy contracted 20.4% in the second quarter of 2020 compared to the previous three months. The Bank of England predicts that GDP will fall by 14% this year, the worst point since 1706. The unemployment rate is also expected to rise from 4% to 9%. A deep debt, serious deficits, and tensions with a major trading partner fuel fears among wealth managers and investors. As a result, Britain may lose investments in the country as traders would like to invest in other countries with more stable economies. The material has been provided by InstaForex Company - www.instaforex.com |
| US and Asian stocks rise, while Europe went irresolute Posted: 21 Aug 2020 05:57 AM PDT
US stock exchanges closed Thursday's trading with a substantial increase in the main stock indicators. The day before, it went through a slight correction and was not performing well. It somehow managed to gain back it's lost positions on Thursday. Nasdaq was able to complete trading at its maximum level, which happened due to increased demand from investors for securities of companies in the technology sector. At the beginning of the trading day, market participants were still under the heavy impression of the publication of the minutes of the July meeting of the Federal Reserve System, which reflected the very vague prospects for economic recovery in the country. The statistics also added pressure, which turned out to be an order of magnitude worse than analysts predicted earlier. Nevertheless, the main regulator of the state indicated that it is ready to take all possible and affordable measures that can provide broad support to the economy in order to recover from the crisis associated with the impact of coronavirus infection. However, the document does not state anything specific about what these measures will be. Of course, investors tensed after such controversial statements. The statistics on the US labor market also added unpleasant feelings. Thus, the Ministry of Labor has published a new portion of statistics, according to which the number of applications for unemployment benefits last week, ended August 14, increased by 135,000 leaving to a total of 1.106 million. This came as a surprise not only to the markets but also to analysts, who for the most part argued that there should be a reduction in the indicator to 925 thousand units. Greater fears emerged after the news that the index of manufacturing activity in Philadelphia for the current month was significantly lower than preliminary forecasts. The main regulator of Philadelphia - the Federal Reserve Bank - cited calculations according to which the indicator dropped to 17.2 points, while in the previous month it was already at a fairly low level of 24.1 points. The current drop has led to its minimum values over the past three months. Still, there is a positive for market participants. It is primarily related to the fact that the United States of America intends to establish trade relations with China. Thus, the American authorities announced that they are ready to set a new date for negotiations in the near future on major issues that require urgent solutions. Of course, this does not mean yet that the conflict is over, but at least some steps towards a settlement have already been outlined. In addition, it became known that companies in the technology sector have grown well in the first half of this year. Thus, the growth dynamics of Facebook Inc. accounted for 30%, Apple Inc. increased by about 60%, and the leader was Amazon.com Inc., whose securities rose in price by an average of 78%. Traditionally, the tech sector has been good at supporting stock markets, forcing major stock indicators to move up. However, as some experts point out, the growth of tech companies has almost come to an end and will be extremely limited in the future. In the meantime, market participants do not attach too much importance to this. The Dow Jones Industrial Average closed Thursday's trading with an increase of 0.17% or 46.85 points, which moved it to the line of 27,739.73 points. The Standard & Poor's 500 Index rose 0.32% or 10.66 points. Its current level was 3,385.51 points. The Nasdaq Composite index added 1.06% or 118.49 points, which allowed it to move to the area of 11,264.95 points. Thus, the indicator has renewed its record for the 35th time this year. Asian stock markets also traded positively on Friday. Major stock market indicators jumped on news of the upcoming coronavirus vaccine release. The drug against COVID-19, which is being developed by the US pharmaceutical company Pfizer in partnership with the German biotechnology corporation BioNTech, is scheduled to be launched on the market in October this year. This news even managed to overshadow the uncertainty of investors about the economic recovery and its growth in the near future, which was emphasized in the minutes of the US Federal Reserve meeting. Japan's Nikkei 225 Index is up 0.3% Friday morning. The level of consumer prices in the country was marked by an increase in dynamics by 0.3% on an annualized basis. Such a high rise has not happened since mid-spring. The main growth was in the food sector. China's Shanghai Composite Index rose 0.4%. The Hong Kong Index followed suit and rose more dramatically by1.3%. South Korea's Kospi Index became the leader of the recovery with an increase of 1.7%. Australia's S & P / ASX 200 was the only one in the red zone, dropping 0.2%. Here, investors are concerned that the government may not give the go signal for a deal to buy the second-largest milk producer Lion Dairy & Drinks from China Mengniu Dairy Corporation from the PRC. The reason for this decision may be an unpleasant incident that happened just recently: the Chinese authorities have launched an investigation into wines from Australia, as they suspect the producers of dumping. Meanwhile, there are no uniform dynamics observed on the European stock markets: the main stock indicators rushed in different directions. The reason for the uncertainty was the preliminary forecasts for PMI in the EU. The general index of large enterprises in the Stoxx Europe 600 region continued its growth Friday morning, which this time amounted to 0.31%. Allowing it to get to reach 366.76 points. The German DAX Index gained 0.36%. France's CAC 40 index rose 0.21%. Italy's FTSE MIB index moved in the opposite direction and lost so far only slightly by 0.04%. Spain's IBEX 35 index was marked by a similar loss of 0.04%. The UK's FTSE 100 Index suffered the most, with a 0.27% drop. The material has been provided by InstaForex Company - www.instaforex.com |
| Euro loses its benchmark: value declines Posted: 21 Aug 2020 05:57 AM PDT
Euro moved to a negative correction on Friday against the background of a new preliminary portion of statistics on the decline in business activity in the EU. At the same time, the greenback may once again demonstrate its weekly decline in relation to the major currencies of the world. The euro became cheaper by 0.53%, which moved it to the level of 1.1796 dollars per euro. At the same time, the USD index in relation to a basket of six major world currencies strengthened slightly and rose by 0.36%, which allowed it to take a position of 93.129 points. According to preliminary data of analysts, the composite PMI index in the EU, reflecting changes in business activity in the region, in the last month of summer may reach 51.6 points, while in July it was 54.9 points. This is a significant decline that market participants were not prepared for. PMI data for selected countries in the region also indicate a plateau. So, this is evidenced by statistics in France and Germany. Moreover, the increase in the number of COVID-19 cases in these countries indicates that a new factor of pressure may form in the service sector, which in turn will then be reflected in economic activity. Meanwhile, the greenback traded in positive territory on Friday. However, the pressure on it has not ended, and in general, by the end of the week, another decline will most likely be recorded, which will become the ninth in a row. If the dollar nevertheless reflects negative weekly dynamics, this will be the longest series of falls in the last ten years. It is especially worth paying attention to the growth in the number of new applications for unemployment benefits in the US, which neither analysts nor market participants expected. This unpleasant surprise can further spoil the mood in the markets. The material has been provided by InstaForex Company - www.instaforex.com |
| August 21, 2020 : EUR/USD daily technical review and trade recommendations. Posted: 21 Aug 2020 05:46 AM PDT
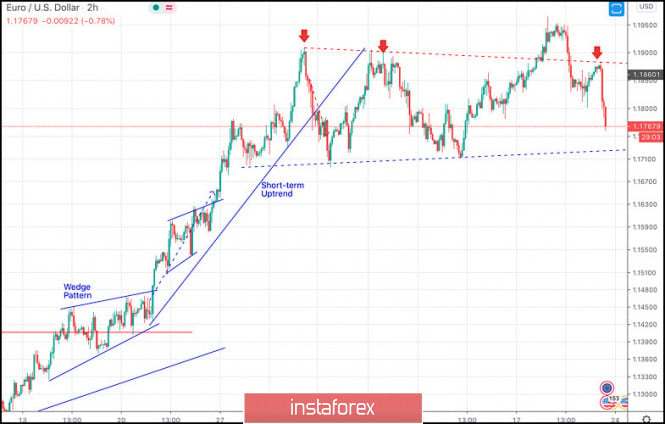
The EUR/USD pair has been moving-up since the pair has initiated the depicted short-term uptrend line on July 21. By the end of July, a resistance level was formed around 1.1900 which prevented further upside movement for some time and forced the pair to have a downside pause towards 1.1715 in the form of a Wedge-Pattern.On August 12, a new short-term uptrend line was initiated around 1.1715. Since then, the EURUSD pair has been moving upward until we had significant bearish rejection around the previously mentioned resistance zone @ 1.1950. Short-term outlook turns negative for the pair. Hence, SELL Positions are preferred at the current time. Hence, Intraday traders should wait for the current downside movement to achieve a breakout below 1.1710 ( the upcoming trendline) or a valid SELL Position. Initial target would be located around 1.1670 and 1.1630 while Stop Loss should be set at 1.1750. The material has been provided by InstaForex Company - www.instaforex.com |
| August 21, 2020 : EUR/USD Intraday technical analysis and trade recommendations. Posted: 21 Aug 2020 05:37 AM PDT
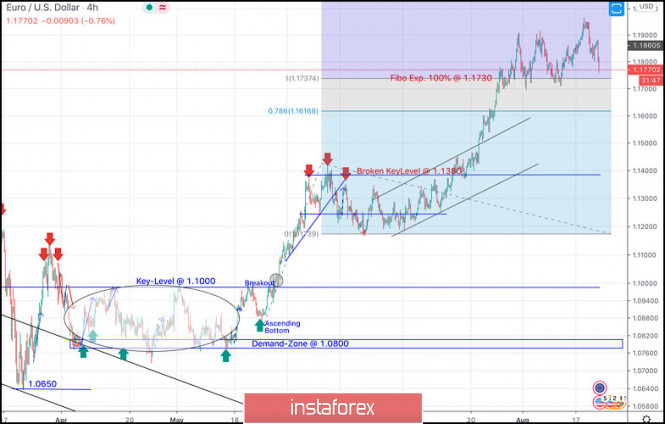
On March 20, the EURUSD pair has expressed remarkable bullish recovery around the established bottom around 1.0650. Shortly after, a sideway consolidation range was established in the price range extending between 1.0770 - 1.1000. On May 14, evident signs of Bullish rejection as well as a recent ascending bottom have been manifested around the price zone of (1.0815 - 1.0775), which enhances the bullish side of the market in the short-term. Bullish breakout above 1.1000 has enhanced further bullish advancement towards 1.1150 then 1.1380 where another sideway consolidation range was established. Hence, Bearish persistence below 1.1150 (consolidation range lower limit) was needed to enhance further bearish decline. However, the EURUSD pair has failed to maintain enough bearish momentum to do so. Instead, the current bullish breakout above 1.1380-1.1400 has lead to a quick bullish spike directly towards 1.1600 (Fibonacci Expansion 78.6% level) which failed to offer sufficient bearish pressure. That's why, further bullish advancement pursued towards 1.1730 (Fibonacci Expansion 100% level) which failed to offer sufficient bearish rejection for a few days until Today. Bullish persistence above 1.1730 will probably favor further bullish advancement towards 1.2075 (161% Fibo Expansion Level) in the intermediate-term. On the other hand, bearish re-closure below 1.1730 indicates lack of bullish momentum and enhances further bearish decline initially towards 1.1600. Trade recommendations : Conservative traders should wait for the current bullish movement to pause and get back below 1.1730 as an indicator for lack of bearish momentum for a valid SELL Entry.T/P levels to be located around 1.1600 and 1.1500 while S/L to be placed above 1.1800 to minimize the associated risk. The material has been provided by InstaForex Company - www.instaforex.com |
| August 21, 2020 : GBP/USD Intraday technical analysis and trade recommendations. Posted: 21 Aug 2020 05:36 AM PDT
In the period between April and June 2020, the GBPUSD has been moving sideways within the depicted consolidation range extending between (1.2265 - 1.2600) Transient bearish breakout below 1.2265 (consolidation range lower limit) was demonstrated in the period between May 13 - May 26, denoting some sort of weakness from the ongoing bullish trend. However, immediate bullish rebound has been expressed around the price level of 1.2080 bringing the GBP/USD back towards 1.2780 (Previous Key-Level) where another episode of bearish pullback was initiated. Short-term bearish movement was expressed towards 1.2265 where Significant bullish rejection was originated bringing the GBP/USD pair back towards 1.2780 where the mid-range of the depicted wedge-pattern failed to offer enough bearish rejection. Intermediate-term Technical outlook for the GBP/USD pair remains bullish as long as bullish persistence is maintained above 1.2780 (Depicted KeyLevel) on the H4 Charts.On the other hand, the pair looks overbought after such a quick bullish movement. Hence, upcoming bearish reversal shouldn't be excluded provided that early bearish breakout occurs below 1.2980 (the depicted wedge pattern upper limit). Trade recommendations : Technical traders are advised to wait for any upcoming bearish breakdown below 1.2980 as a valid SELL Entry. Initial T/p level is to be located around 1.2780. On the other hand, bullish persistence above 1.2980 invalidates this trading scenario. The material has been provided by InstaForex Company - www.instaforex.com |
| EUR / USD correction only a respite for conquering new highs Posted: 21 Aug 2020 05:33 AM PDT
In the absence of new dovish signals from the Fed, the greenback headed upwards, however, stronger-than-expected growth in weekly jobless claims in the US forced the dollar to retreat. It came literally a day after Fed officials warned that the country's hiring recovery was starting to slow, sowing doubts about how quickly the world's largest economy could recover from the coronavirus pandemic. According to data released on Thursday, in the week ended August 15, the number of new applications for unemployment benefits in the United States increased to 1.106 million against the forecast of 930,000. On Friday, the US dollar resumed its attack on the positions of its main competitors, including against the euro. After reaching local highs around 1.1880, the EUR / USD pair reversed and sank rather quickly below 1.1800. According to Markit Economics, in August, the composite PMI in the euro area dropped to 51.6 points, compared with 54.9 points recorded in July. Experts stressed that this may indicate a slowdown in the pace of economic recovery in the currency bloc. Currently, the EUR / USD pair is showing a correction from the overbought levels, which is supported by the bearish divergence of the RSI indicator. The 1.1690-1.1700 area will become strong support in the event that the bears do gain the upper hand. After the collapse of recent months, the greenback looks pretty oversold. Under the current conditions, the buyers of the US dollar may be those investors who will fix a part of the profit from the sale of USD earlier, as well as those who stake on accelerating the recovery of the American economy against the slowdown of that of Europe. In the US, the number of new cases of COVID-19 infections has declined, contrary to Europe which continues to record additional cases. Against this backdrop, European authorities may return some of the coronavirus restrictions, which will increase concerns about a W-shaped economic recovery in the eurozone instead of a V-shaped one. "After a strong rally in EUR / USD during the summer, which was mainly driven by the sale of the dollar rather than the rise in the euro, we see downside risks for the main currency pair for the rest of the year, mainly due to an upward greenback correction," said strategists at Bank of America. They point to overly positive outlooks for the global economy, overly optimistic expectations regarding the development of a coronavirus vaccine, and overly pessimistic views on the situation with COVID-19 in the US compared to the situation in Europe. "With so many unknowns, risk aversion will be a negative factor for EUR / USD," BofA said. Although the EUR / USD pair, which previously hit two-year highs, has pulled back, it has not yet suffered crushing losses. More significant would be a failure of the pair below 1.1700. However, as the events of recent weeks have shown, investors are ready to buy out even small drawdowns. Based on this, the current decline in EUR / USD should be viewed as a respite for the bulls before a new attempt to renew multi-month highs and push quotes above 1.2000. The material has been provided by InstaForex Company - www.instaforex.com |
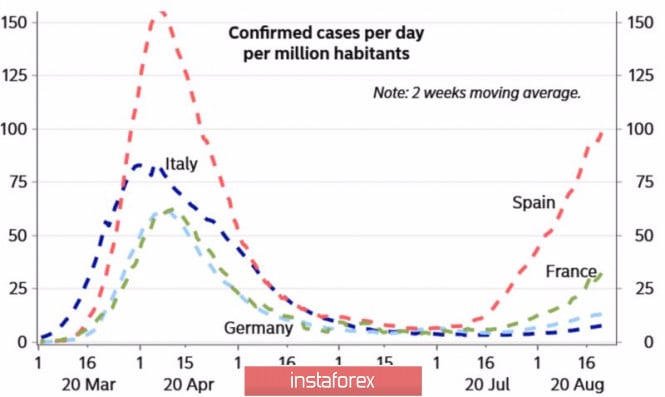
| The euro was hit by the second wave of the pandemic Posted: 21 Aug 2020 05:31 AM PDT An asset cannot grow indefinitely. The 8-week rally of EUR/USD ended with a natural correction: the pair closed in the red zone at the end of the five-day period to August 21. The reason for the pullback was the disappointing statistics on European business activity, however, we must admit that the bears made attempts to go on a counterattack after the Fed meeting. Jerome Powell and his colleagues did not want to put a stick in the wheels of US Treasury bond yields, which is good news for the dollar. It is no secret that the main driver of the EUR/USD rally is the divergence in the economic growth of the Eurozone and the United States. The complex epidemiological situation in the New World and the opening of the old economies have convinced investors that Europe will get out of the hole faster than America will. Let this hole be deeper. As a result, demand for the euro grew by leaps and bounds, asset managers have never been so bullish about the single European currency, and in the options market, contracts with strikes at 1.22, 1.23, 1.25 and even 1.28 are selling like hot cakes. Unexpectedly, this coherent theory was hit by the rise in the number of COVID-19 infections in Europe, the so-called second wave of the pandemic, which will increase the risks of repeated lockdown and W-shaped recovery of GDP. The situation in Spain and France looks particularly sad, while Italy and Germany are still looking good. Dynamics of the number of infected COVID-19
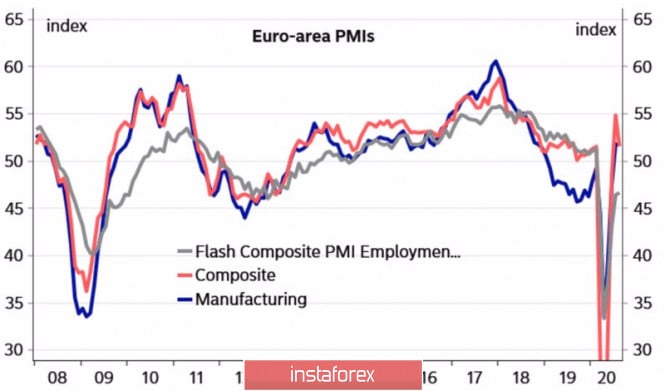
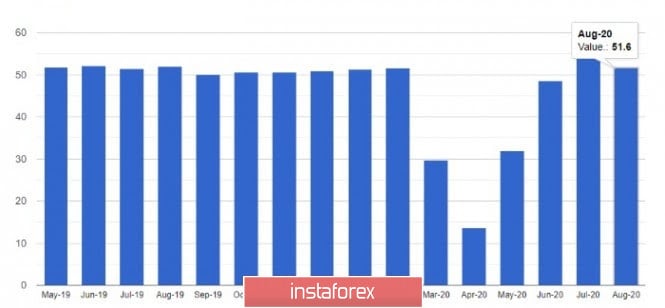
Naturally, this situation cannot but affect business activity – which is a leading indicator for GDP. In August, the Eurozone composite purchasing managers' index fell from 54.9 to 51.6, reflecting weakness primarily in the services sector. Currently, domestic demand in the currency bloc is supported by fiscal assistance programs, but what will happen when their terms are completed? An increase in unemployment, a reduction in consumer spending and a blow to the key EUR/USD purchase investment based on divergence in economic growth. Dynamics of European business activity
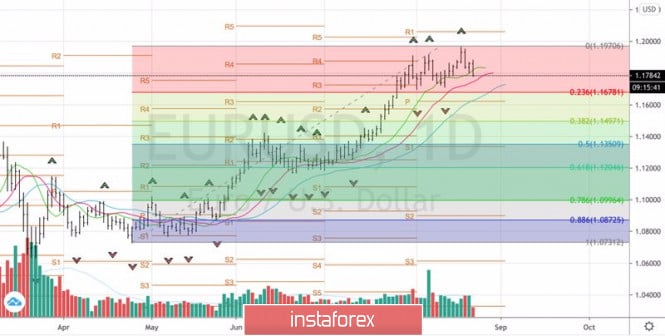
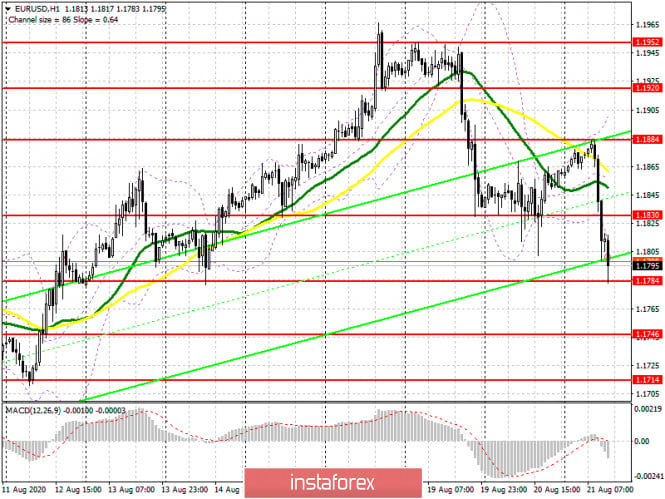
Thus, the prerequisites for the correction of the pair are obvious, the question is how deep it will be. Personally, I do not believe that the second wave of COVID-19 in Europe will be more terrible than the first. The current increase in the number of infected people is most likely temporary, due to holidays and the holiday season. In addition, in the Old World, the number of deaths and hospitalizations is not growing, and a vaccine is on the way. Most likely, the Eurozone will manage to cope, which keeps my faith in the recovery of the "bullish" trend for EUR/USD. It should also be understood that the euro has other growth drivers in the form of diversification of gold and foreign exchange reserves, capital inflows to the Old World securities market, and, finally, the US presidential election. Investors used to believe that everything that is good for Donald Trump is good for the US dollar, and, judging by the ratings, the current head of the White House will lose to Joe Biden. Therefore, the strategy remains the same: EUR/USD rollbacks to 1.175, 1.725 and 1.1675 with subsequent closing above these levels should be used for purchases. EUR/USD, the daily chart
|
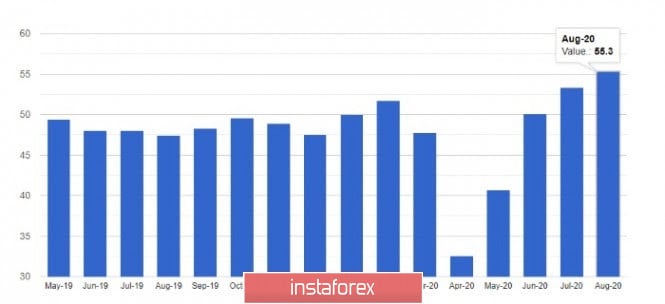
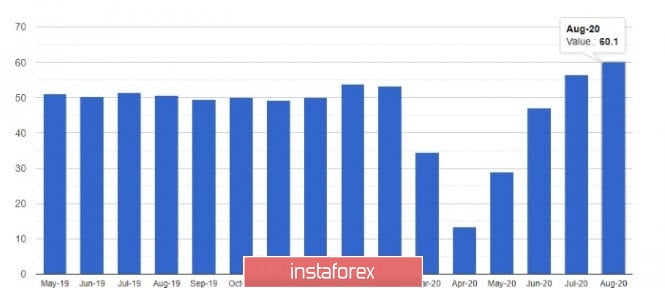
| Posted: 21 Aug 2020 05:31 AM PDT Something strange is happening with the pound. It initially ignores the good inflation data that came out earlier this week and then simply declines against the US dollar following the general trend in the market. The next day, without any reason, the pair returns to almost its monthly highs. But if we sort of figured out that situation, then today's reaction was once again surprising. Let me remind you that the inflation data at the present time cannot be considered as representative, or reliable, due to the distortions that were caused by the coronavirus pandemic in the spring of 2020. It will be possible to get a real picture only after the economy recovers from the consequences of the pandemic, but for now this is very far away. So, it turns out that the statistics waiting for us in the future will continue to be unpredictable, and in August we may see a sharp reduction in the indicator, although many economists will bet on continued growth. A similar situation and opposite reaction to the very good data on retail sales and activity in the service sector will most likely occur today. Let me remind you that a report was released in the morning, which indicated that retail sales in the UK in July of this year increased significantly thanks to the resumption of operations of shops and restaurants, which are gradually returning to normal after the coronavirus pandemic, during which they were forced to suspend my job. According to the data, retail sales in the UK in July rose by 3.6% compared to June, while economists had expected growth of 1.4%. However, it's worth noting that clothing and fuel sales are far behind pre-pandemic levels. A rather interesting report on the growth of borrowings from the UK public sector was also released today. However, the significant increase in this indicator against the background of the fight against the consequences of the coronavirus pandemic did not surprise anyone. The report indicated that the UK public sector net borrowing in July was 26.7 billion British pounds, and the borrowing rate increased. Economists expected the figure to be £ 29.9 billion. Now, let's move to the most important report. The British pound began to gradually lose its positions, sliding back to the lows of the week. The sharp rise in activity in the UK manufacturing and service sectors in August this year came amid a further relaxation of quarantine and social distancing measures. Such a sharp jump in indicators surely suggests that the UK economy will recover at a faster pace than expected, and that the situation with Brexit and the lack of progress in trade negotiations may be less damaging than was expected at the beginning of this year. But it remains a mystery why the pound reacted with a fall. Thus, the preliminary PMI for the manufacturing sector in the UK in August was 55.3 points, while it was at 53.3 points in July. Economists had forecast a figure of 53.6 points. As for the service sector, it is even better. There, the preliminary PMI jumped right up to 60.1 points in August against 56.5 points in July and with the forecast of 57.0 points. The composite purchasing managers index, which takes into account both areas, rose to an 82-month high of 60.3 points in August from 57.0 points in July against the forecast of 56.4 points. Let me remind you that the indicator values above 50 signal an increase in activity. From the point of view of technical analysis of GBP/USD pair, the sharp collapse of the pound is likely to continue after the data on the US, the release of which is scheduled for the second half of the day. The nearest targets of the bears are the support levels 1.3070 and 1.3040. In order for buyers to be able to return the market to their side, it is necessary to return the resistance at 1.3180, which will be extremely difficult given the fact how traders react by selling to good news. I think we will find out about what will happen then when the statistics start to deteriorate very soon, when the rebound from the bottom is over, and the indicators begin to shift to more real ones. The material has been provided by InstaForex Company - www.instaforex.com |
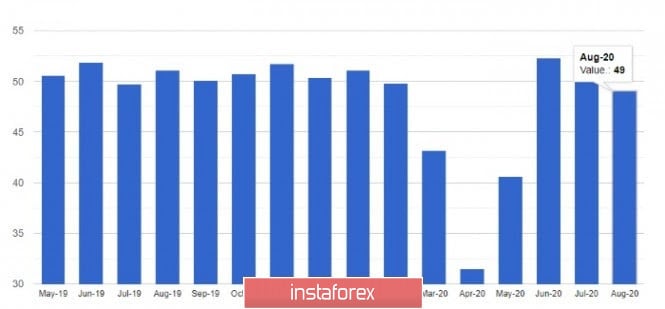
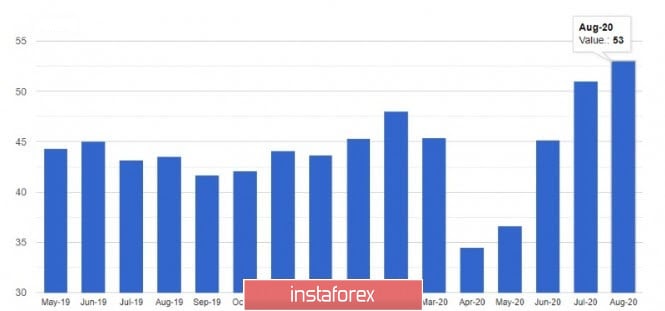
| Posted: 21 Aug 2020 05:31 AM PDT The pressure on the euro rose sharply after the publication of the first preliminary data on activity in the eurozone countries, which surprised many economists and traders, as no one expected such a large and sharp decline in indicators. On the contrary, the indicators were predicted to grow further. The decline in the preliminary composite purchasing managers' index for the euro zone suggests that the V-shaped economic recovery that began after the abolition of quarantine measures is slowing down. This suggests that the mechanical rebound, which must have happened, has occurred and has come to its end. Now, everything depends on the real form of companies and enterprises. The current decline in indicators is starting to bring the picture closer to a more real one. It is already clear that the economy will remain below pre-crisis levels for at least 1-2 years, and a new resumption of growth in the number of infections with the virus creates an obvious risk of a halt in the recovery, and even worse, will lead to its reversal. Many companies and enterprises are surprised by the future uncertainty that is felt across all sectors, since any deterioration in the situation with the coronavirus and the lack of support from the authorities will lead to a rapid collapse of the barely cured manufacturing sector. This is especially true of the automotive industry. Most likely, GDP data will show strong growth in the 3rd quarter, but expecting a V-shaped recovery is unlikely to be correct. Now, let's look at the numbers. In France, the preliminary manufacturing PMI for August this year has fallen below 50, indicating a contraction in activity after a recent rebound to growth in early summer this year. The index was predicted at 53.1. Back in July, the indicator was 52.4 points. As for the service sector, then the preliminary index of purchasing managers in August fell to 51.9 points, against 57.3 points in July with a forecast of 56.0 points. In Germany, things are a little better, but only in the manufacturing sector due to the deferred demand for cars. According to the report, the preliminary PMI for the manufacturing sector in Germany rose to 53.0 points in August, against 51.0 points in July, while the forecast was at 52.5 points. But the service sector has just sharply declined. There, the preliminary index of supply managers in August barely remained above 50 points and amounted to 50.8 points, while in July it was at the level of 55.6 points. Economists had forecast a reading of 55.4 points. As for the data for the euro area as a whole, there is a drawdown in all directions, which led to such a sharp drop in the European currency against a number of other world currencies. According to the Markit report, the preliminary index of purchasing managers for the manufacturing sector of the euro zone in August fell to 51.7 points, while the forecast of growth to 53.0 points. Services PMI, in turn, fell to 50.1 points in August from 54.7 points in July. As a result, the preliminary composite PMI of the eurozone PMI in August fell to 51.6 points. From the point of view of technical analysis of EUR/USD pair, if the bears could not cope with the support at 1.1830 yesterday, then today, this range was broken at the very first test, which led to a large sale of the trading instrument in the area of the minimum at 1.1780. A breakout of this area after the US PMI reports will open a direct path for risky assets to the lows of 1.1740 and 1.1710. It will be possible to speak about the stabilization of the situation and equalization of the balance of forces only after the trading instrument returns to the resistance area of 1.1830. The material has been provided by InstaForex Company - www.instaforex.com |
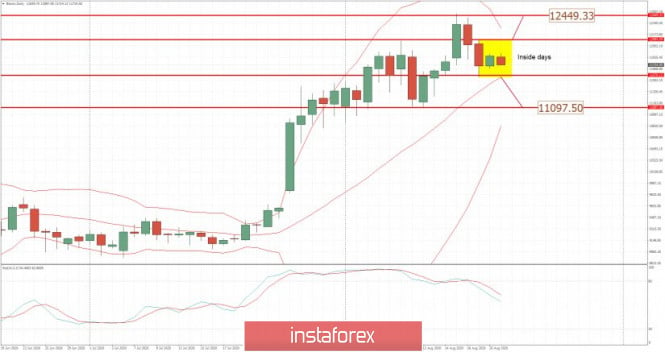
| BTC analysis for August 21,.2020 - Inside days pattern and potential for the breakout Posted: 21 Aug 2020 04:45 AM PDT Further Development
Analyzing the current trading chart of BTC, I found that we got inside days in previous 2 days, which is sign of balance. I would wait for the breakout of support at $11,570 with potential to drop towards $11,100 or breakout of resistance at $12,000 with potential for test of $12,450 Watch for breakout of the inside bar formation to confirm further direction Bollinger bands started to contract, which is another sign of the balancing market. Key Lvels: Resistance: $12,095 Support level: $11,100 The material has been provided by InstaForex Company - www.instaforex.com |
| Posted: 21 Aug 2020 04:38 AM PDT Markit/CIPS - August 21 2020Prior 54.7
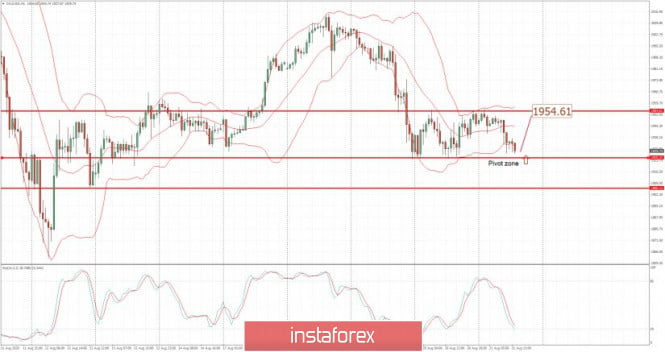
The earlier release from Germany and France pointed to a slow down in the PMI data and the European data is below expectations across the board. EURUSD down a few ticks towards session lows. This does not bode well for Friday in terms of risk, UK PMI's to come in 30 minutes. This is a pivotal point for the eruozone and the slowing recovery picture will be eyed carefully by the ECB. As I discussed in the previous review, the Gold is testing the lower part of the trading range at the price of $1,925, which is potential for the upside rotation. The level at $1,925 seems like solid support for the price today and there is potential for the upside rotation towards the Middle Bollinger band at $1,945 Further Development
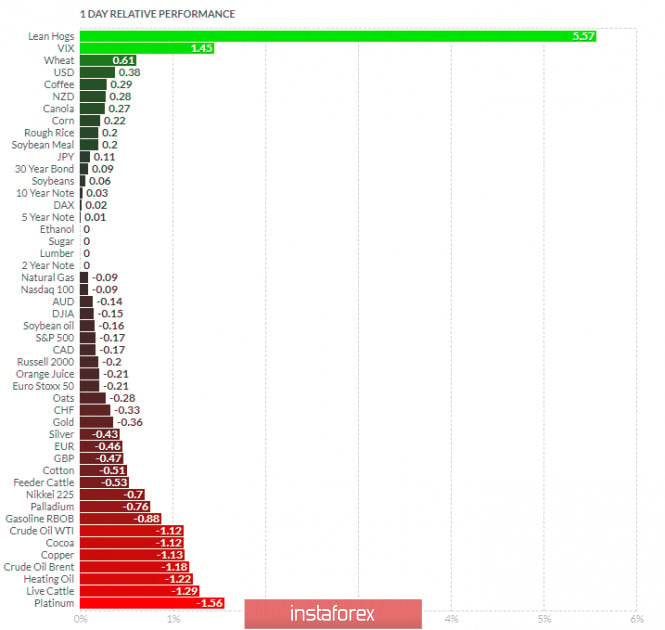
Analyzing the current trading chart of Gold, I found that the bottom of the trading range is serving like support and that is very risky for selling at this stage. Watch for buying opportunities with the target at $1,954 1-Day relative strength performance Finviz
Based on the graph above I found that on the top of the list we got Lean Hogs and VIX today and on the bottom Platinum and Live Cattle Gold is on the bottom of tthe lust but with the test of the lower part of the trading range Key Lvels: Resistance: $1,954 Support level: $1925 The material has been provided by InstaForex Company - www.instaforex.com |
| Posted: 21 Aug 2020 04:31 AM PDT
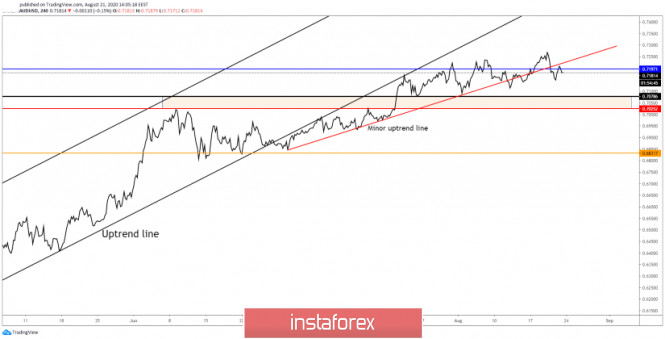
AUD/USD is vulnerable in the short term after falling under the minor red uptrend line. Technically, the pair has escaped from the major up channel, but it has continued to increase along the black uptrend line. Now, the pair as run away from the major uptrend line signaling and exhaustion and an overbought environment. The most recent drop below the minor red uptrend signal a potential retreat, corrective phase, downside movement.
Sell if AUD/USD will drop below the former peak low, somewhere below 0.7140 level, the early target will be at 0.7078 static support. The second downside target is observed at 0.7025 level. The probable drop is questionable how long the price is located, traded, above 0.7140 level. Therefore, another rally, jump above 0.7220 will suggest buying as the rate will invalidate a potential decline. The material has been provided by InstaForex Company - www.instaforex.com |
| Posted: 21 Aug 2020 04:23 AM PDT Prior 56.5
So, there is a surprise. A nice little uptick for the UK. Services leading the charge and surely this is in large part to the UK Government's 'eat out to help out' scheme. Basically it means 50% off your food bill from Monday through to Wednesday. It's been very successful.
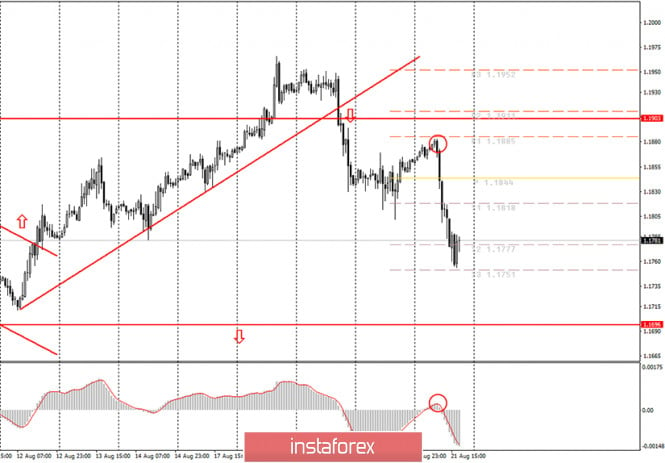
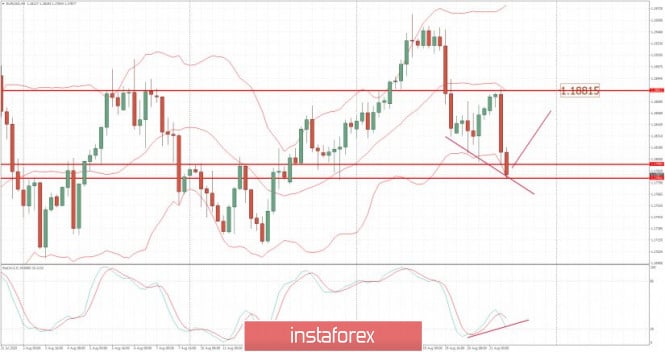
As I discussed in the previous review, the EUR/USD is about to finish the downside cycle in my opinion and start the another upside cycle towards the 1,1880. The level at 1,1780 seems like solid support for the price today and there is potential for the upside rotation towards the Middle Bollinger band at 1,964 Further Development Analyzing the current trading chart of EUR, I found that the sellers got exhausted today and the upside rotation is possible. Watch for buying opportunities on the dips with the targets at 1,1880. 1-Day relative strength performance Finviz
Based on the graph above I found that on the top of the list we got Lean Hogs and VIX today and on the bottom Platinum and Live Cattle Key Levels: Resistance: 1,1880 Support level: 1,1780 The material has been provided by InstaForex Company - www.instaforex.com |
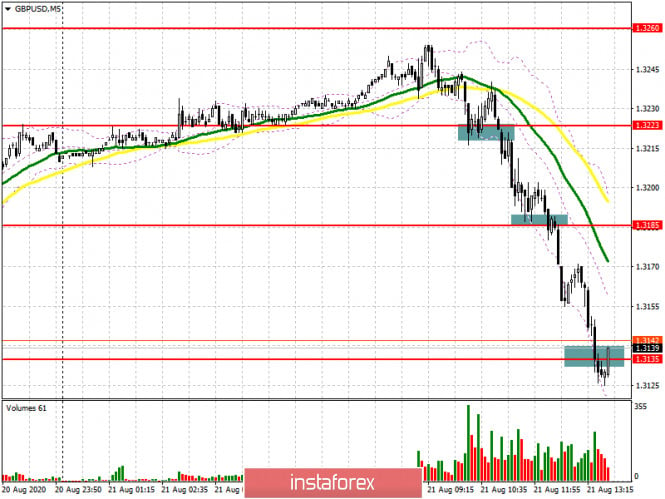
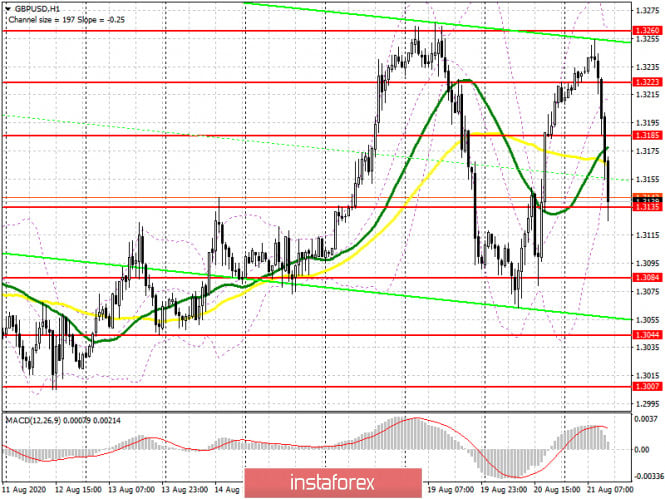
| GBP/USD: plan for the American session on August 21 Posted: 21 Aug 2020 04:17 AM PDT To open long positions on GBPUSD, you need: At the beginning of the week, the British pound was surprised by its reaction to rising inflation, when it began to lose ground sharply against the US dollar. The same thing happened today in the first half of the day, after the release of just excellent data indicating a sharp jump in activity in the services and manufacturing sectors of the UK. But our task here is not to understand the subtleties of the economic calendar, but to trade, so let's see what signals were in the first half of the day, and where you can and should have earned. Even in the morning forecast, I recommended opening short positions after fixing below the level of 1.3223, which happened. On the 5-minute chart, you can see how the pair bounces from this level during the first test, but then the bears achieve its breakdown and test it from the bottom up. After making sure that the level was held, it was necessary to sell the pound to reduce to the support of 1.3185, where you could watch a very small rebound of the pair up. At the moment, the bulls are active in the area of 1.3135, where I recommended opening long positions immediately on the rebound. While trading is above this range, we can expect an upward correction of 30-40 points within the day, but the more important task of the bulls will be to return the resistance to 1.3185. Only then can we talk about a larger growth of the pound to the maximum of 1.3223, where I recommend fixing the profits. If the bears gradually pull the pair back to the support of 1.3135, it is best to postpone long positions until the low of 1.3084 is updated, since it is far from clear what the market reaction to the US PMI indices will be, especially in a pair with the British pound. From 1.3084, you can open long positions immediately for a rebound in the expectation of correction of 30-40 points.
To open short positions on GBPUSD, you need: Most likely, sellers will not rush to break through the support of 1.3135 and wait for the release of data on US PMI indices. However, fixing below this range will certainly lead to a new sell signal in the hope of reducing and updating the lows of yesterday in the area of 1.3084 and 1.3044, where I recommend fixing the profits. In the scenario of growth of GBP/USD in the second half of the day, it is best not to rush with sales and wait for the update of the resistance of 1.3185, where you can open short positions immediately on the rebound. If there is no bear activity at this level, I recommend selling then only after the 1.3223 resistance test, counting on correction of 30-40 points within the day. Signals of indicators: Moving averages Trading is conducted in the area of 30 and 50 daily averages, which indicates a very serious struggle for the direction of the market. Note: The period and prices of moving averages are considered by the author on the hourly chart H1 and differ from the general definition of the classic daily moving averages on the daily chart D1. Bollinger Bands The volatility is huge. Bears are already trying to break through the lower border of the indicator around 1.3160. In the case of an upward correction of the pair, you can open short positions on a rebound from the average border of 1.3210.
Description of indicators
|
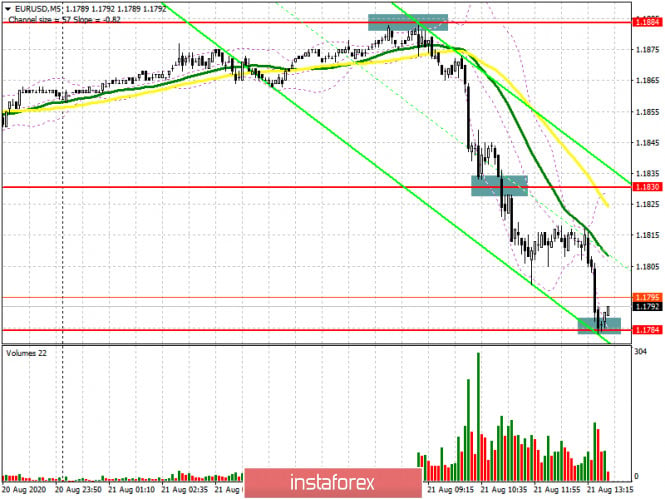
| EUR/USD: plan for the American session on August 21 Posted: 21 Aug 2020 04:04 AM PDT To open long positions on EURUSD, you need: Data that would seem to help the euro further strengthen its position against the US dollar, on the contrary, led to a sharp collapse of the pair in the first half of the day. The values were much worse than the forecasts of economists, and in some countries, there was a decrease in activity in the service and manufacturing sectors. Unfortunately, it was not possible to wait for the formation of a false breakout from the level of 1.1884 in the first half of the day, and as you can see on the 5-minute chart, several resistance tests of 1.1884 could not form a signal to sell the euro. Already breaking through the support range of 1.1830 and then fixing under it, where there was a temporary stop of the first wave of the euro's fall, formed a good entry point into short positions, which led to a decrease to the low of 1.1784. At the moment, the bulls are active in this range, from which in the morning I recommended opening long positions immediately on the rebound, which can lead to a small movement of the pair up by 20-30 points. In the scenario of a repeated decline in EUR/USD to the area of 1.1784, it is best to postpone long positions until the update of the minimum of 1.1746, a fall to which may occur after the release of good fundamental data on the US economy. An equally important task for the bulls in the second half of the day will be to regain the resistance of 1.1830. Fixing at this level will be a good buy signal in the expectation that the pair will return to the opening area of the day and update the maximum of 1.1884, where I recommend fixing the profit.
To open short positions on EURUSD, you need: The bears have already come a long way in the first half of the day and achieved a support test of 1.1784, which will not be easy to break below. Only good fundamental data on the activity of the US PMI indices will lead to a consolidation below this range and a further sell-off of EUR/USD to the area of lows 1.1746 and 1.1714, where I recommend fixing the profits. If the demand for the euro returns in the second half of the day, a safer scenario will be sales if a false breakout is formed in the resistance area of 1.1830. I recommend opening short positions immediately for a rebound only from the maximum of 1.1884, counting on a correction of 30-40 points within the day.
Signals of indicators: Moving averages Trading is conducted below the 30 and 50 daily moving averages, which indicates the continuation of the downward correction of the market. Note: The period and prices of moving averages are considered by the author on the hourly chart H1 and differ from the general definition of the classic daily moving averages on the daily chart D1. Bollinger Bands A break in the lower border of the indicator around 1.1784 will increase pressure on the euro. Growth will be limited by the upper level of the indicator in the area of 1.1884. Description of indicators
|


| You are subscribed to email updates from Forex analysis review. To stop receiving these emails, you may unsubscribe now. | Email delivery powered by Google |
| Google, 1600 Amphitheatre Parkway, Mountain View, CA 94043, United States | |
No comments:
Post a Comment