
Forex analysis review |
- Forecast for EUR/USD on October 2, 2020
- Forecast for GBP/USD on October 2, 2020
- Forecast for AUD/USD on October 2, 2020
- Forecast for USD/JPY on October 2, 2020
- Hot forecast and trading signals for GBP/USD on October 2. COT report. Pound in a precarious situation. Bears preparing a
- Hot forecast and trading signals for EUR/USD on October 2. COT report. Traders not impressed by eurozone and US data
- Overview of the GBP/USD pair. October 2. The European Union begins legal proceedings with London regarding the Brexit agreement
- Overview of the EUR/USD pair. October 2. Trump awarded himself a victory in the debate.
- EUR/USD: Investors mulling over legal prospects of London, US nonfarm payrolls, and eurozone's inflation
- Analytics and trading signals for beginners. How to trade EUR/USD on October 2. Analysis of Thursday deals. Getting ready
- October 1, 2020 : EUR/USD daily technical review and trade recommendations.
- October 1, 2020 : EUR/USD Intraday technical analysis and trade recommendations.
- October 1, 2020 : GBP/USD Intraday technical analysis and trade recommendations.
- Gold price rejected at $1,900 resistance
- EUR/USD at a crossroads: dollar's hopes and euro's fears
- Technical analysis of EURUSD
- H&M Quarterly Profit Decreases Beyond Forecasts
- USDCAD reaches pull back target
- Trade Of The Day: GBPUSD High Probability Setup (Video)
- AUDJPY push up towards descending trendline resistance!
- XAUUSD bouncing from 1st support, further rise expected !
- NZDUSD is approaching major resistance, potential for drop!
- What can trigger the market?
- Dollar adds optimism to gold
- Tokyo Stock Exchange will resume operations tomorrow after a system failure
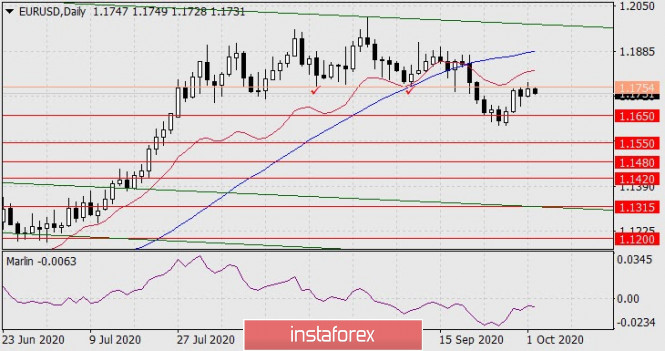
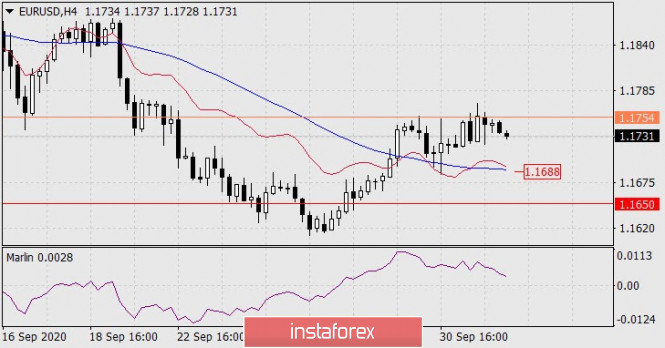
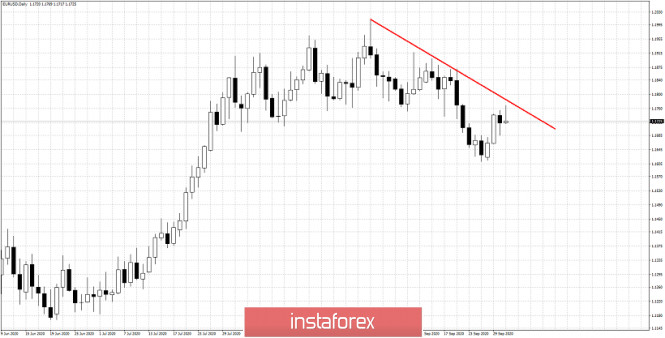
| Forecast for EUR/USD on October 2, 2020 Posted: 01 Oct 2020 08:25 PM PDT EUR/USD The euro rose by 26 points yesterday, a stronger movement was prevented from developing the signal level of 1.1754, created by the lows of August 21 and September 9. The Marlin oscillator is showing the first signs of a reversal. Perhaps with the release of US employment data, this reversal will intensify. The US unemployment rate for September is expected to fall from 8.4% to 8.2%. The first target for the euro is 1.1650, then 1.1550. The price formed a divergence with the oscillator on the four-hour chart. In order to confidently decline, The price needs to settle below the MACD line below 1.1688. We are waiting for the development of events. |
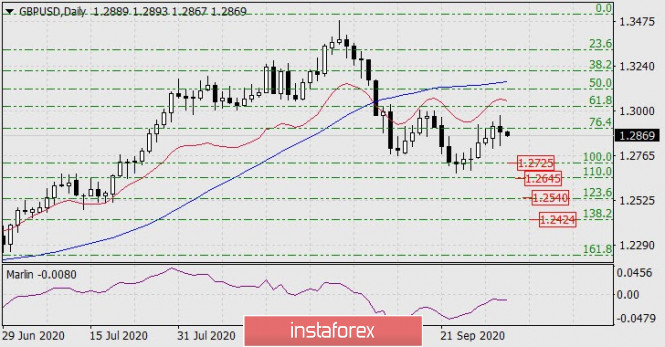
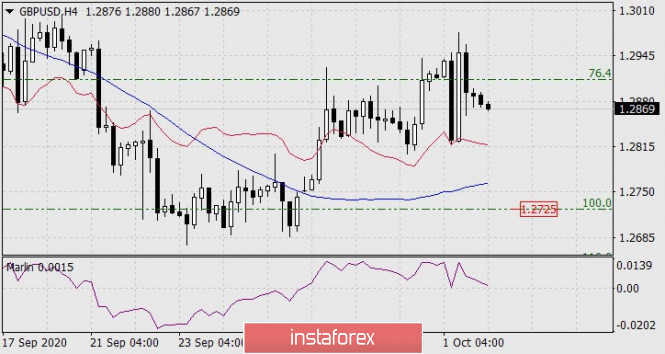
| Forecast for GBP/USD on October 2, 2020 Posted: 01 Oct 2020 08:25 PM PDT GBP/USD The pound traded in a wide range of 157 points on Thursday due to conflicting information about the Brexit deal. In the current situation, the pound is falling under the general pressure of the dollar until we receive a positive portion of news (if they turn out to be such) from the camp of negotiators. Technically, there is a reversal, when the growing correction from September 24 is completed. The Marlin oscillator moves down without going into the growth zone. The nearest target for a decline is 1.2725 (100.0% Fibonacci), followed by 1.2645, 1.2540. The price is above the balance line and the MACD line on the four-hour chart, the growing short-term sentiment remains, but Marlin is already trying to penetrate the bears' territory, which will significantly facilitate the price's move to leave the area below the indicator lines. But before that, there are more than a hundred points. |
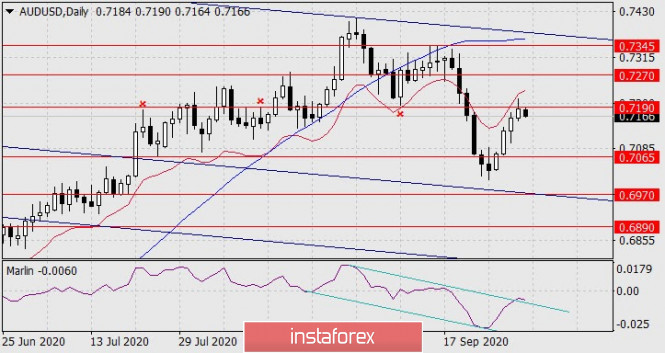
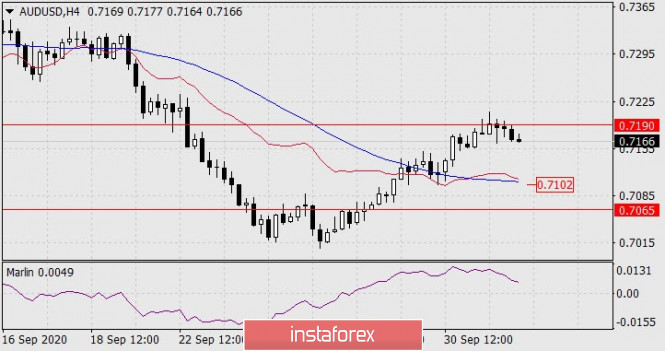
| Forecast for AUD/USD on October 2, 2020 Posted: 01 Oct 2020 08:25 PM PDT AUD/USD The Australian dollar tried to go beyond the strong resistance of 0.7190 yesterday, but the price only managed to pierce the level. However, the Marlin oscillator channel has been disrupted and is being canceled. The oscillator turned slightly higher. As before, the aussie's first target is the 0.7065 level, then the support of the price channel at the 0.6970 area. We attribute this optimism with the expected positive data on employment in the US. The unemployment rate is expected to decline from 8.4% to 8.2%. The Marlin oscillator is on track for an active decline on the four-hour chart. The price is above the indicator lines, but the MACD line has kept its downward direction, indicating the corrective nature of the growth of the last five days. The MACD line itself acts as an intermediate support in the 0.7102 area. |
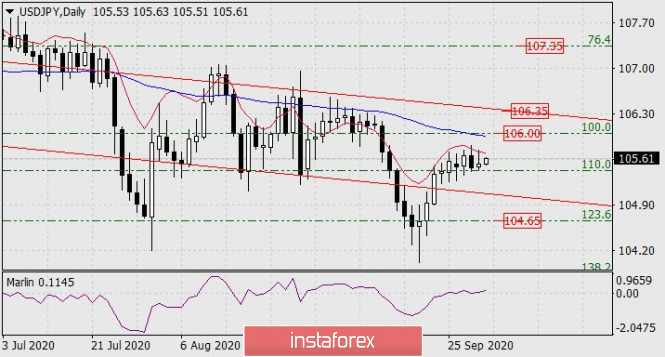
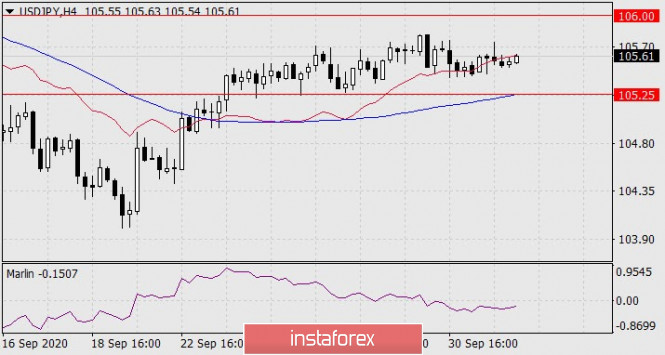
| Forecast for USD/JPY on October 2, 2020 Posted: 01 Oct 2020 08:25 PM PDT USD/JPY The Japanese yen cannot go beyond the area above the balance indicator line on the daily chart for the seventh consecutive day, but it is firmly holding on to its target with the support of the Marlin oscillator, which started a barely noticeable growth from the border of the positive trend zone. The price is supported by the Fibonacci level of 110.0%. The targets remain the same: the Fibonacci level of 100.0% with the coinciding MACD line at 106.00, and the embedded price channel line at 106.35. The Marlin oscillator eased on the four-hour chart, now it is turning to the upside from the zone of negative values. The price overcomes the resistance of the balance line. Going beyond the area above it will mean a shift in the mood mainly towards buy positions. Setting the price under the MACD line (105.25 level) can return the yen to 104.65 - to the Fibonacci level of 123.6%. |
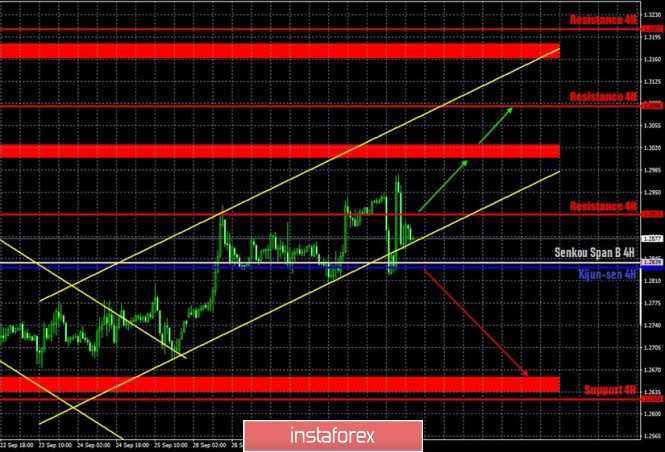
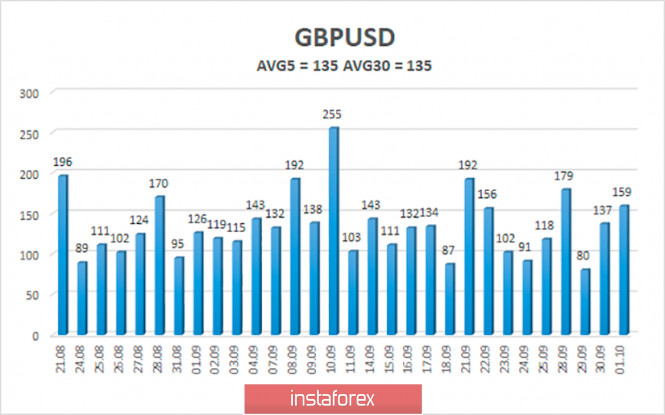
| Posted: 01 Oct 2020 06:02 PM PDT GBP/USD 1H The GBP/USD pair continued to trade within the ascending channel on October 1, leaving it only for a short time since the market reacted to an extremely important fundamental background. However, sellers could not remove the pair from the area below the Kijun-sen and Senkou Span B lines, so the quotes returned to the channel very quickly. Thus, at the moment we can say that the upward trend continues. Today we can expect a renewed strengthening of the British currency. Sellers failed to seize the initiative on the first attempt, however, given the fundamental background from the UK, it is possible that there will be new attempts. And in the very near future. Bears need to move the pair below the Senkou Span B and Kijun-sen lines in order to count on a new downward trend. GBP/USD 15M Linear regression channels are directed towards different directions on the 15-minute timeframe, displaying trades in multiple directions throughout the day. The latest Commitment of Traders (COT) report for the British pound showed that non-commercial traders got rid of buying the pound and opened Sell-contracts (shorts). A group of commercial traders got rid of huge amounts of both longs and shorts of the pound. We then concluded that the pound sterling is now, in principle, not the most attractive currency for large traders. The new COT report showed absolutely minor changes for the "non-commercial" group. Buy-contracts (longs) fell by 2,000 while Sell-contracts decreased by 1,500. Thus, the net position for non-commercial traders remained practically unchanged for the reporting week (September 16-22). The British pound continued to fall, which can be considered a consequence of the previous reporting week, when the net position of non-commercial traders greatly decreased, by 11,500 contracts. No changes in the rate of the pound/dollar pair on the 23rd, 24th, 25th, which will be included in the next report. Thus, a long term decline in the pound's quotes is quite questionable, although the pound is still the most unattractive currency in the foreign exchange market. The key news of the day was a statement from Brussels claiming that the European Union is starting a lawsuit against London because of British Prime Minister Boris Johnson's resonant UK Internal Market Bill. They jumped, as they say. After that, the pound was thrown from side to side, and the pair only managed to calm down in the evening. All other news of the day certainly fell into the shadows. We have already talked about US reports in the article on the euro/dollar. The index of business activity in the manufacturing sector was published in Britain, which marginally changed. There were no more reports in Britain. No scheduled macroeconomic publications for Britain on Friday, however, at any time, traders may receive new information on the confrontation between Brussels and London. Which, naturally, can cause a new storm in the foreign exchange market. In addition, the US will publish an important NonFarm Payrolls report for September. The forecast is +850,000. A value less than this figure may create additional pressure on the dollar, but in general, the pound sterling is in a precarious situation due to events related to Britain, Brexit and negotiations with the EU. We have two trading ideas for October 2: 1) Buyers continue to push the pair up, but they remain inside the ascending channel. Therefore, you are advised to stay with long positions while aiming for the resistance area of 1.3004-1.3024 and the 1.3086 level as long as the pair remains above the Senkou Span B line and is within the channel. Take Profit in this case will be from 100 to 170 points. The current fundamental background is simultaneously bad for both the pound and the dollar, but it seems to be worse for the pound. 2) Sellers failed to settle below the Kijun-sen line several times in a row, so they remain out of the game for now. They need to wait for the price to settle below the Kijun-sen line (1.2831) and only after that should you resume trading downward while aiming for the support area of 1.2636-1.2660. Take Profit in this case can be up to 130 points. Explanations for illustrations: Support and Resistance Levels are the levels that serve as targets when buying or selling the pair. You can place Take Profit near these levels. Kijun-sen and Senkou Span B lines are lines of the Ichimoku indicator transferred to the hourly timeframe from the 4-hour one. Support and resistance areas are areas from which the price has repeatedly rebounded off. Yellow lines are trend lines, trend channels and any other technical patterns. The material has been provided by InstaForex Company - www.instaforex.com |
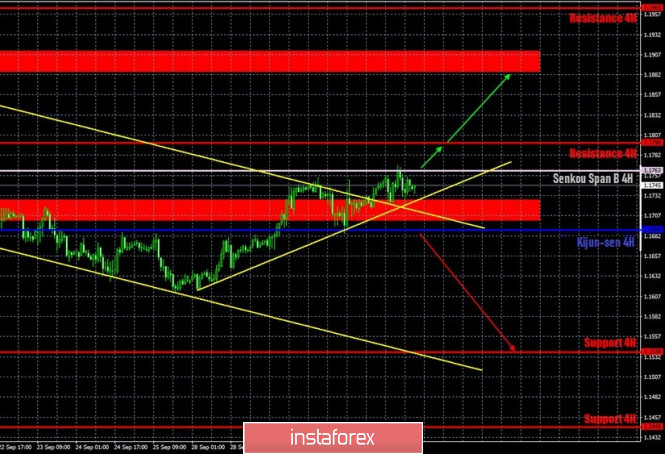
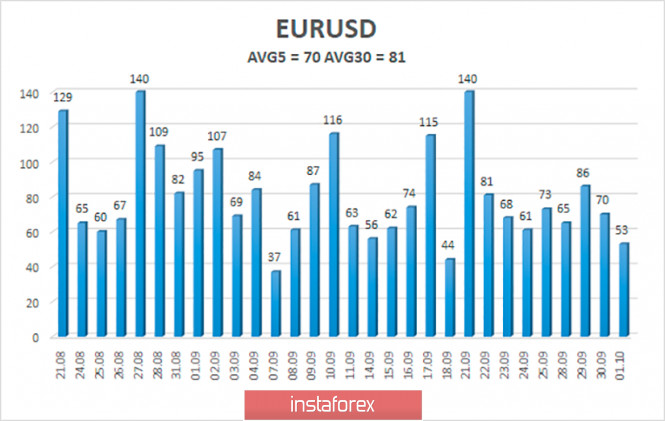
| Posted: 01 Oct 2020 06:01 PM PDT EUR/USD 1H The EUR/USD pair continued absolutely indistinct trading on the hourly timeframe on October 1, which it has done in recent months. Recall that the pair's quotes left the 200-point horizontal channel just recently, in which it has spent around two months in. Yesterday, trading was held in a narrow, approximately 60-point range with no specific direction. Nevertheless, this was enough to leave the descending channel, even though it was met with difficulty, but it still retained the prospect of a downward trend in recent days. Buyers also managed to overcome the resistance area of 1.1704-1.1728, but have not yet managed to gain a foothold above the Senkou Span B line. Thus, moving further up is also questionable. EUR/USD 15M Both linear regression channels are directed slightly to the upside on the 15-minute timeframe, but they can change the direction at any moment. The euro/dollar fell by about one and a half cents last reporting week (September 16-22). Recall that the previous Commitment of Traders (COT) report showed that the "non-commercial" group of traders, which we have repeatedly called the most important, sharply reduced their net positions. Thus, in general, the downward movement that began later on was sufficiently substantiated. The only problem is that it started late. The new COT report, which only covers the dates when the euro began its long-awaited fall, showed completely opposite data. Non-commercial traders opened 15,500 new Buy-contracts (longs) and almost 6,000 Sell-contracts (shorts) during the reporting week. Thus, the net position for this group of traders has increased by around 9,000, which shows that traders are becoming bullish. Accordingly, the behavior of the EUR/USD pair and the COT report data simply do not match. For the second week in a row. However, if you try to look at the overall picture, you can still take note of a very weak strengthening of the bearish sentiment, so the COT report allows a slight fall in the euro. The question is, will it continue to decline or is it already over? The pair even managed to rise by 40 points from September 23-29. Therefore, there are no such changes again. The European Union and some of its countries published indexes of business activity in industrial sectors on Thursday. Without going into the numbers, we can say that none of the indices fell below the key level of 50.0 and did not significantly decline compared to the previous month. The unemployment rate in the European Union rose, as predicted by experts, to 8.1%. There have also been several relatively significant publications in the United States. The number of initial claims for unemployment benefits was 837 thousand, and the total number of secondary claims fell to 11.767 million. Thus, the overall unemployment rate in the United States continues to decline. Personal incomes of Americans decreased by 2.7% in August, personal expenses increased by 1%. The ISM manufacturing PMI fell from 56.3 points to 55.4. Markit PMI - from 53.5 to 53.2. Thus, we see that all the reports of the past day were either secondary initially, or their real values did not differ much from the forecasted ones. And also do not forget that market participants continue to ignore almost all macroeconomic data. We have two trading ideas for October 2: 1) Buyers continue to put pressure on the pair, but it is still not enough to break the downward trend, although the price still went out of the descending channel with grief. Therefore, long positions will formally be relevant above the Senkou Span B line (1.1763) with targets at 1.1798 and the resistance area of 1.1886-1.1910, but the upward movement is now extremely uncertain. Take Profit in this case will be from 20 to 110 points. 2) Bears have finally released the market from their hands. However, an upward trend line may come to their aid. If the price settles below this line, then the trend for the pair will change to a downward one. We recommend resuming bearish trading while aiming for the support level of 1.1538 if the bears manage to get the pair back below the critical line (1.1690). In this case, the potential Take Profit is up to 130 points. Explanations for illustrations: Support and Resistance Levels are the levels that serve as targets when buying or selling the pair. You can place Take Profit near these levels. Kijun-sen and Senkou Span B lines are lines of the Ichimoku indicator transferred to the hourly timeframe from the 4-hour one. Support and resistance areas are areas from which the price has repeatedly rebounded off. Yellow lines are trend lines, trend channels and any other technical patterns. The material has been provided by InstaForex Company - www.instaforex.com |
| Posted: 01 Oct 2020 05:26 PM PDT 4-hour timeframe
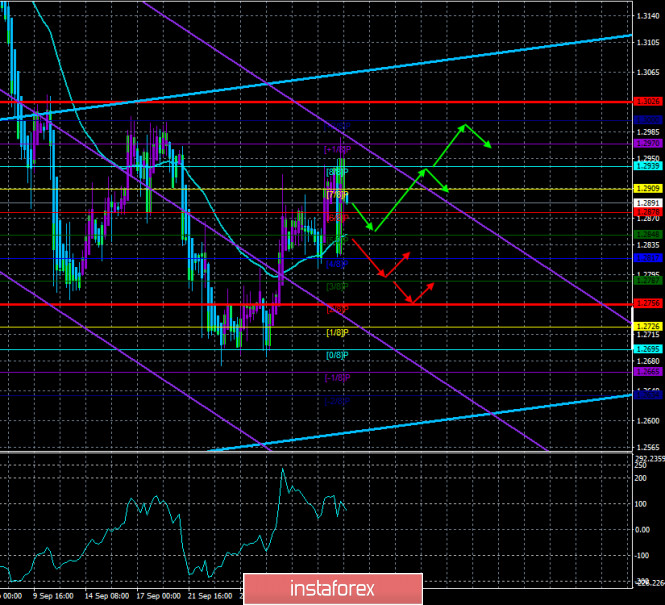
Technical details: Higher linear regression channel: direction - upward. Lower linear regression channel: direction - downward. Moving average (20; smoothed) - upward. CCI: 73.9072 On Thursday, October 1, the British pound paired with the US dollar showed enviable volatility. Within 7-8 hours, the British pound quotes first fell by 120 points, so they rose by 140, then fell again by more than 100 points. Such movements are called a "storm" when the pair is thrown from side to side. However, there were reasons for this on the first day of October. We will discuss them below. In the meantime, let's get back to the technical picture. Although the pound plowed down twice by 100 points, it still failed to confidently overcome the moving average line. Thus, first of all, we cannot yet make a clear conclusion that the upward trend has ended, and secondly, now we need to wait for the markets to calm down and re-evaluate the entire current technical picture. The fundamental background suggested sharp movements of the pair in different directions yesterday. The fact is that the European Union sent an official notification to the government in London, in which it announced that it was starting legal proceedings for violating the Brexit agreement. This is exactly the scenario we expected, as we have repeatedly discussed in previous articles. Boris Johnson decided once again to bluff and scare Brussels with a violation of the agreement on Brexit if a trade deal is not signed. However, now the British Prime Minister will receive the international trial, which will further lower the reputation of the UK, which was tarnished the last action 10 Downing Street. European Commission President Ursula von der Leyen said that the UK authorities had to fix a new bill "on the domestic market" so that it is not contrary to the already signed agreement on Brexit. London had until September 30, but instead of making adjustments to the bill, the British Parliament approved it in the second reading. Von der Leyen called such actions by London "a de facto refusal to comply with agreements and principles of international law". "This bill is by its very nature a breach of the obligation of good faith set out in the Brexit agreement. Moreover, if it is adopted in its current form, it will completely contradict the protocol on Ireland and Northern Ireland," the head of the European Commission said. However, these are far from the only problems the UK has faced in recent days. The fact is that the "coronavirus" is again attacking Foggy Albion. The beginning of the second "wave" was announced by Boris Johnson a few weeks ago. Now, health experts have said that "the virus is essentially out of control". "We don't keep it under control at the moment," the UK's chief scientific adviser, Patrick Vallance, said at a government press conference. Chief medical officer of Britain Chris Whitty confirmed that the number of illnesses and hospitalizations is growing. In the last two days, 7 thousand new cases were recorded. Boris Johnson himself makes only vague statements: "I know that some people think that we should give up and let the virus go its way, despite the huge human losses that could potentially be. But I don't think that's what the British people want." According to Johnson, "the country is in a critical situation," but the Prime Minister does not answer the question of why the country was unprepared for the second "wave" of the pandemic. We can only once again note that for the economy, the pandemic is much worse than Brexit or the absence of trade agreements with the United States or the European Union. However, since the country is ruled by Boris Johnson, who has already received an unofficial nickname in Britain "Brexit Prime Minister", he decided that one trouble will not prevent another. Now the Kingdom has lost 20% of GDP in the second quarter and 40,000 lives, the second "wave" could claim more lives and percent of GDP in the third and fourth quarters (current levels of disease in the early "wave" is already above the maximum levels the first "wave"), in addition to this, agreements with the EU and the US on free trade "do not smell", and Johnson managed to fall out with Brussels and now, most likely, London will face long litigation and the destruction of international reputation and prestige. We have written several times about Boris Johnson's victories as Prime Minister, but this list has not expanded beyond one point. But Johnson's list of defeats is growing. Unfortunately, ordinary Britons will have to pay for everything, who gave all the power in the country to one person. As for the prospects of the pound/dollar pair, the quotes remained above the moving average line, so the upward trend is still maintained. As we said earlier, we need to pay more attention to technical factors now, as all macroeconomic statistics continue to be ignored by market participants. The general fundamental background is extremely important, however, it remains approximately the same in the US and Britain. Equally bad. Thus, the pound/dollar pair remains one of the most difficult pairs at this time. On the last trading day of the week in the States, a rather important report is scheduled to be published – Nonfarm Payrolls – the number of new jobs created outside the agricultural sector. However, as we have already said, traders now ignore any statistics. Today may be the same picture. Thus, it is not desirable to skip this report, however, you can't expect a serious market reaction.
The average volatility of the GBP/USD pair is currently 135 points per day. For the pound/dollar pair, this value is "high". On Friday, October 2, therefore, we expect movement inside the channel, limited by the levels of 1.2756 and 1.3026. A new reversal of the Heiken Ashi indicator downwards signals a new round of corrective movement. Nearest support levels: S1 – 1.2878 S2 – 1.2848 S3 – 1.2817 Nearest resistance levels: R1 – 1.2909 R2 – 1.2939 R3 – 1.2970 Trading recommendations: The GBP/USD pair resumed its upward movement on the 4-hour timeframe, bouncing off the moving average line once again. Thus, today it is recommended to stay in the longs with the goals of 1.2939 and 1.3000 as long as the Heiken Ashi indicator is directed upwards. It is recommended to trade the pair down with targets of 1.2787 and 1.2756 if the price returns to the area below the moving average line. The material has been provided by InstaForex Company - www.instaforex.com |
| Overview of the EUR/USD pair. October 2. Trump awarded himself a victory in the debate. Posted: 01 Oct 2020 05:26 PM PDT 4-hour timeframe
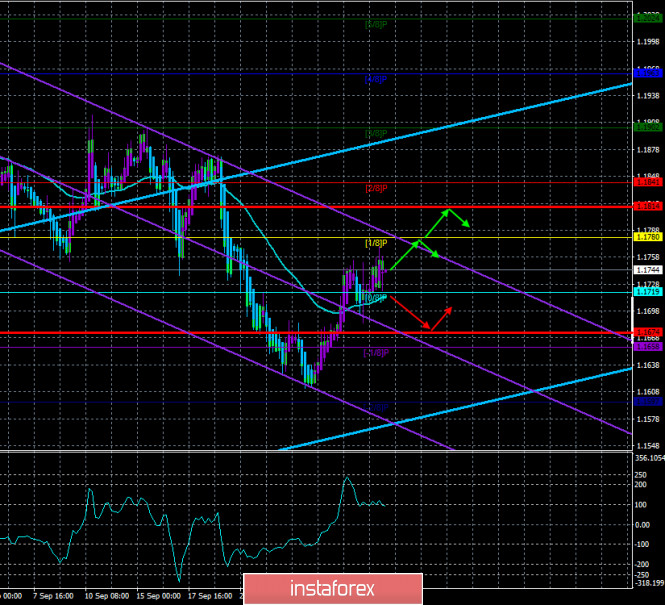
Technical details: Higher linear regression channel: direction - upward. Lower linear regression channel: direction - downward. Moving average (20; smoothed) - upward. CCI: 92.9474 On October 1, the European currency paired with the US dollar continued fairly calm trading. Market participants still do not understand why they should force events, as well as which way to trade the pair now. The problem lies in the same fundamental background. For the US currency, it remains extremely weak, dangerous, and the future is uncertain. For the European currency, the fundamental background is more favorable, however, all the negative from overseas has already been worked out by traders several times (the pair's rise by 1300 points in the last 4 months), and we can't wait for a super-positive from the European Union either. Therefore, there is a stalemate in which market participants are very reluctant to trade, moreover, they are trying to return to the side channel of $ 1.17- $ 1.19, in which they spent about two months. Meanwhile, US President Donald Trump evaluated the past first round of debates with his opponent Joe Biden. According to Trump, "he enjoyed the debate". "The verdict is out, and they say we won a major victory last night," Trump said. As usual, it is unknown who made such a verdict. However, Trump is confident of his victory despite the results of opinion polls that indicate a victory for Joe Biden. The US leader also believes that he brought Biden to justice "for all 47 years of lies, betrayal, and failures". And again, it is unclear how he brought the Democrat to justice. The US President also noted that the TV debate ratings were the highest in the country's history. We can say that this is not surprising, since the upcoming elections promise to be the most interesting in the history of the country. At the same time, Democrats and Republicans in the faces of Nancy Pelosi and Steven Mnuchin continue to work on a new stimulus package that they cannot agree on. The situation with the new aid package is beginning to resemble the negotiations between London and Brussels. No one wants to give in on the most important issues, but both sides say they want to reach an agreement. The stumbling block is the scale of the aid itself. Democrats offer a minimum of 2 trillion, Republicans believe that one trillion is a lot. Thus, the negotiations stalled in fact on this issue at the beginning of August. According to the latest information, Democrats are preparing to submit a new $ 2.2 trillion stimulus package to Congress. What's the point if Republicans think it's too much and won't approve of it? Earlier, the Republicans themselves put forward a $ 300 billion aid package for consideration, which was rejected by the Democrats. "We are both working hard to achieve results. We are trying to understand whether we will be able to do this, and if not, we need to move on," Mnuchin said, expressing hope that an agreement will be reached. Meanwhile, another speech by ECB head Christine Lagarde clarified some aspects of future monetary policy. It seems that Lagarde decided to follow in the footsteps of the Fed and introduce so-called "compensatory inflation". In other words, inflation will be allowed to go above the 2% level, which is the target for both the Fed and the ECB. It is when this level is reached over a long period that both central banks are ready to tighten monetary policy. Another thing is that monetary policy in the EU has not been tightened since 2012. Thus, Lagarde's statements about achieving and exceeding 2% inflation even sound like a mockery. Moreover, deflation is now registered in the EU, that is, prices are falling, not rising. "Although compensation strategies may be less successful when people are not completely rational in their decisions, the feasibility of such an approach can be studied," said Christine Lagarde. Interesting news, but what about the euro/dollar pair itself? What are its prospects for the near future? In the European Union, everything now depends on the "coronavirus" epidemic and the scale of its second "wave". If the second "wave" is stronger than the first, then a new "hard" quarantine and even a "lockdown" is possible. And this, of course, will harm the bloc's economy. Although all macroeconomic indicators are ignored by market participants, they are now linked to the "coronavirus crisis". As for the US, the fundamental background is much more diverse. First, if the second "wave" has just begun in the EU, then the first "wave" has not even ended in America. And this factor puts pressure on the US currency. Secondly, there may be a change of government in the United States soon. And before this very change of power, there may be fierce battles in the elections, and then in the courts. It's no secret that many investors and traders fear uncertainty. Therefore, the US dollar is now far from the most attractive currency. Also, many traders and investors fear that Trump will be re-elected for a second term. And many investors and traders are wary of the uncertainty surrounding TTrump's second term. Third, we remind you that the conflict with China has not gone away, it is only put on pause. Thus, immediately after the election or after a while, it can flare up with a new force. Of course, this will depend on who will be the next US President. If Trump, it will flare up again. If Biden, there are options. Thus, we believe that until November 3, the US dollar will remain under pressure from market participants and is unlikely to be able to strengthen much before this date. On the US currency side, there are only technical reasons. The technical picture now speaks in favor of continuing to strengthen the euro currency, as the price first overcame, and then rebounded from the moving average, and the Heiken Ashi indicator is directed upwards.
The volatility of the euro/dollar currency pair as of October 2 is 70 points and is characterized as "average". Thus, we expect the pair to move today between the levels of 1.1674 and 1.1814. A reversal of the Heiken Ashi indicator back down may signal a new round of downward correction. Nearest support levels: S1 – 1.1719 S2 – 1.1658 S3 – 1.1597 Nearest resistance levels: R1 – 1.1780 R2 – 1.1841 R3 – 1.1902 Trading recommendations: The EUR/USD pair continues to be located above the moving average line. Thus, it is now recommended to stay in long positions with targets of 1.1780 and 1.1814 until the Heiken Ashi indicator turns down or the price fixes below the moving average. It is recommended to consider sell orders again if the pair is fixed back below the moving average with the first targets of 1.1674 and 1.1597. The material has been provided by InstaForex Company - www.instaforex.com |
| Posted: 01 Oct 2020 10:16 AM PDT The EUR/USD pair has been trading within a narrow range for two days following a spike on Tuesday. The American currency now looks vulnerable, but the euro does not look too brave either. Recent events both in Europe and the United States arouse more questions than answers. Therefore, traders are in no hurry to open either long or short large positions. As a result, the pair has come to a standstill in anticipation of a powerful information driver. Tomorrow's US nonfarm payrolls may serve as such a driver, especially if the actual figures are better than expected. The same is true about the eurozone's CPI. So, the situation looks extremely uncertain. Both the euro and the dollar are under fundamental pressure that does not allow traders to determine the trajectory. The single European currency suffered today due to Brexit problems. As a rule, the euro is unaffected by the news on the Brexit negotiation process, but in this case the situation is different. Let me remind you that yesterday the British parliament approved in the third (that is, in the final) reading a bill that crosses out some points of the Brexit Agreement. Although the bill has not yet been approved by the House of Lords (the upper house of parliament), Brussels' reaction was immediate. Representatives of the European Commission sent to London an official letter of notification that Britain has violated the agreement approved by the country to leave the European Union. Remarkably, this letter is not a formality, but one of the stages of the legal process, which may eventually lead to a lawsuit. The UK now has one month to respond to the European Commission's appeal. If there is no response, or if the British response does not satisfy Brussels, European lawyers will move on to the next stage of the procedure. A political dispute may end up with a lawsuit in the Luxembourg court. By a court decision, the UK can face significant fines, and a trade war may begin between the UK and the European Union, in which the EU will impose sanctions on British exports. This is the most negative scenario, but it cannot be ruled out. The response from the European Commission hit the pound first of all. However, the prospects for litigation between London and Brussels and even a trade war affected the European currency. In addition, weak data on German inflation, which was released yesterday, also caps the growth of the European currency, especially in the context of tomorrow's release on inflation in the euro area. Forecasts are rather pessimistic: according to analysts, the CPI will remain in the negative area and is expected to slow down to -0.1%. Core inflation is likely to show also a negative dynamic. Experts believe that the core index will come out at 0.3%. If September inflation figures in Europe come out at least one tenth of a percent lower than expected, the euro will come under strong pressure. The US dollar is also weighed down by fundamental problems. Democratic and Republican lawmakrers have resumed talks on additional aid to the American economy. The market is already skeptical about such news: the parties held similar negotiations almost all summer, but eventually they reached a dead end. According to the latest news from Capitol Hill, the viewpoints of Democrats and Republicans still differ significantly. Speaker of the House of Representatives Nancy Pelosi announced this today. If lawmakers come to a compromise solution, the greenback will strengthen across the board, no matter what data the nonfarm payrolls will reveal tomorrow. But if the negotiations drag out again, then the US data on the labor market will be in the focus of traders' attention. According to the consensus, September Nonfarms are expected to show strong results. The US provate sector should add almost a million (980 thousand) jobs, and the level of average hourly wages on an annualized basis may rise to almost 5 percent (4.8%). The unemployment rate, in turn, should decline to almost eight percent (8.1%). For your reference, in April this indicator was at almost 15%. Thus, EUR/USD has got stuck sideways for obvious reasons. Friday will be loaded with events, so traders do not risk opening large positions. If European inflation disappoints, and Nonfarms, on the contrary, encourage investors, then the bears will push the pair to the level of 1.16. Otherwise, (strong inflation in the eurozone with catastrophically weak Nonfarms), buyers can push the pair towards 1.18 (possibly testing the 1.1920 level). If the indicators spring some surprises (some data will disappoint and some will come out in the "green zone"), then in this case the market will have to decide on sentiment, which, in my opinion, will be in favor of the US dollar. Plus, don't forget about the negotiations in Congress. Any decision made by the negotiators will have a strong impact on the market - the only question is who will benefit from this volatility. Taking into account such a hard puzzle, it is better to avoid trading EUR/USD for a while. Investors are braced for extreme volatility tomorrow. The material has been provided by InstaForex Company - www.instaforex.com |
| Posted: 01 Oct 2020 10:07 AM PDT EUR/USD hourly chart On Thursday, October 1, the EUR/USD pair was again showing mixed dynamics which could be difficult to analyze, especially for novice traders. When the price consolidated above the descending channel, the uptrend began. It is now supported by an ascending trendline. We also mentioned that the pair has not actually finished the correction phase after a 120-pips rally on September 28-30. Thus, the trendline displays a steep slope which means that almost any correction can lead to the price settling below it. Today, trading has been even more difficult than before. During the session, the price changed its direction several times, while the MACD indicator turned twice to the downside. Therefore, there were no good signals for opening short positions during the day. In the morning, we also advised you not to rush with placing buy orders, and, as it turned out, we were right. Novice traders can follow a bullish trend using other indicators and trading systems. However, we recommend doing this with extreme caution. On Thursday, there was almost no important news for the EUR/USD pair. Basically, we could tell this based on the pair's trajectory during the day. It is also worth noting that since the beginning of the coronavirus pandemic, markets began to downplay macroeconomic statistics which is actually not so common. For instance, traders expectedly have not reacted to the PMI data from Germany, the EU, and the US. However, we should mention that the changes in these indicators were minor and none of them went below the mark of 50.0, which would mean bad news for the economy. The unemployment rate in the EU rose by 0.2%, but this data also did not impress market participants. On Friday, October 2, the European Union is scheduled to publish the inflation data for September. The inflation rate is expected to reach -0.2% year-on-year. This report is rather important. However, even this release can be ignored by market participants. A real change in investor sentiment may happen later in the day when the NonFarm Payrolls report is published in the US. This report shows how many new jobs have been created in the country outside the agricultural sector. This data is considered extremely important and best reflects the state of the labor market in the country. Analysts expect that 850 thousand new jobs have been created. If this indicator is exceeded by 100 thousand or more, this may cause a rise in the US currency and, therefore, a drop in the euro/dollar pair. In addition, Vice President of the ECB Luis de Guindos will deliver a speech on Friday, which can possibly encourage the markets. Besides, the US will publish the data on unemployment rate in the country. Possible scenarios for October 2 1) As the ascending line is still in place, long positions remain relevant. However, we mentioned several times that the pair needs to complete correction. Therefore, we recommend being extremely careful when opening buy deals on the euro. Otherwise, you should refrain from trading at this time. The problem is that at any moment the price can settle below the trendline, and change its direction several times during the day. The upward targets are found at the levels of 1.1790 and 1.1825. 2) Selling the pair is not relevant at the moment. The technical picture confirms the continuation of the upward movement. To open sell positions, you need to wait until the price settles below the ascending trendline. Even in this case, it may be a false signal which just shows the beginning of correction. To sum up, the current situation is quite difficult for novice traders. On the chart Support and Resistance Levels are the Levels that serve as targets when buying or selling the pair. You can place Take Profit near these levels. Red lines are the channels or trendlines that display the current trend and show in which direction it is better to trade now. Up/down arrows show where you should sell or buy after reaching or breaking through particular levels. The MACD indicator (14, 22, and 3) consists of a histogram and a signal line. When they cross, this is a signal to enter the market. It is recommended to use this indicator in combination with trend patterns (channels and trendlines). Important announcements and economic reports that you can always find on the economic calendar can seriously influence the trajectory of a currency pair. Therefore, at the time of their release, we recommend trading as carefully as possible or exit the market in order to avoid sharp price fluctuations. Beginners on Forex should remember that not every single trade has to be profitable. The development of a clear strategy and money management are the key to success in trading over a long period of time. The material has been provided by InstaForex Company - www.instaforex.com |
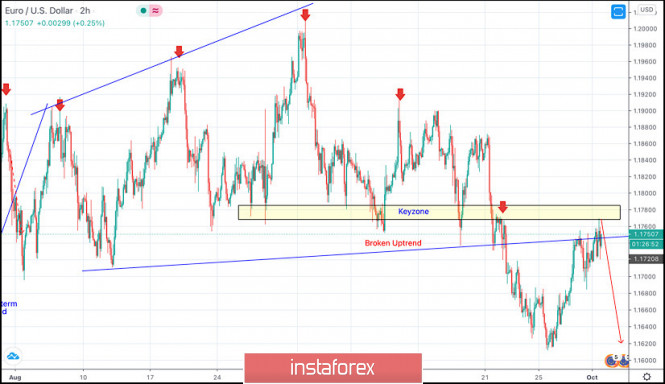
| October 1, 2020 : EUR/USD daily technical review and trade recommendations. Posted: 01 Oct 2020 08:38 AM PDT
By the end of August, the EURUSD pair has achieved a temporary breakout above the previously mentioned resistance zone located around 1.1900. However, Significant SELLING pressure was applied around 1.2000 where the upper limit of the movement pattern came to meet the pair. That's why, the EUR/USD pair has demonstrated a quick bearish decline towards 1.1800 then 1.1770-1.1750 which failed to offer sufficient Support for the EUR/USD. Earlier Last week, a breakout to the downside was executed below the price level of 1.1750 (Lower limit of the depicted movement pattern). Hence intraday technical outlook has turned into bearish. Intraday traders should consider any pullback towards the recently-broken key-zone (1.1750-1.1770) for a valid SELL Entry. On the other hand, a breakout above 1.1820 (Exit Level) will probably enable further upside movement towards 1.1860-1.1900. The material has been provided by InstaForex Company - www.instaforex.com |
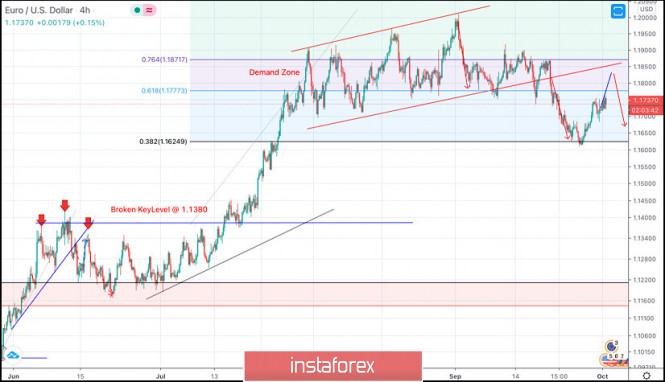
| October 1, 2020 : EUR/USD Intraday technical analysis and trade recommendations. Posted: 01 Oct 2020 08:18 AM PDT
The EURUSD pair has failed to maintain enough bearish momentum below 1.1150 (consolidation range lower zone) to enhance further bearish decline. Instead, bullish breakout above 1.1380-1.1400 has lead to a quick bullish spike directly towards 1.1750 which failed to offer sufficient bearish pressure. Bullish persistence above 1.1700-1.1760 favored further bullish advancement towards 1.1975 where some considerable bearish rejection has been demonstrated. The price zone around 1.1975-1.2000 ( upper limit of the technical channel ) stood as a strong SUPPLY-Zone to offer bearish reversal. Intraday traders should have considered the recent bearish closure below 1.1700 - 1.1750 as an indicator for a possible bearish reversal. The price zone of 1.1775-1.1850 remains a solid SUPPLY Zone to be considered for signs of bearish reversal upon the ongoing bullish pullback by Intermediate-term traders. Trade recommendations : Conservative traders should wait for the current bullish pullback to pursue towards the recently-broken DEMAND Zone around 1.1800 - 1.1850 for a valid SELL Entry. T/P levels to be located around 1.1770,1.1645 and 1.1600 while S/L to be placed above 1.1860 to minimize the associated risk. The material has been provided by InstaForex Company - www.instaforex.com |
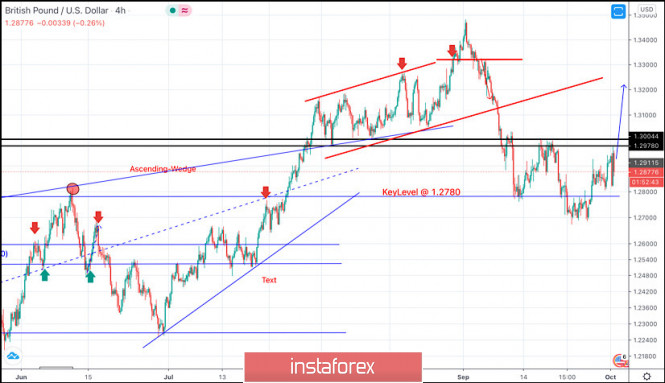
| October 1, 2020 : GBP/USD Intraday technical analysis and trade recommendations. Posted: 01 Oct 2020 08:14 AM PDT
Intermediate-term technical outlook for the GBP/USD pair has remained bullish since bullish persistence was achieved above 1.2780 (Depicted Key-Level) on the H4 Charts. On the other hand, the GBPUSD pair looked overbought after such a quick bullish movement while approaching the price level of 1.3475. That's why, short-term bearish reversal was expected especially after bearish persistence was achieved below the newly-established key-level of 1.3300. A quick bearish decline took place towards 1.2900 then 1.2780 where considerable bullish rejection has been expressed during the past few weeks. The price zone of 1.3130-1.3150 (the backside of the broken trend) remains an Intraday Key-Zone to offer bearish pressure if retested again. However, the GBPUSD pair has shown lack of sufficient bullish momentum to pursue above the price level of 1.3000 upon the past few bullish trials. Bullish Persistence above the depicted price zone of 1.2975 -1.3000 is currently needed to allow bullish pullback to pursue towards 1.3100. Otherwise, further bearish decline would be expected towards the price level of 1.2600. Trade recommendations : Conservative traders are advised to wait for the current bullish pullback to pursue towards 1.3130-1.3150 (the backside of the broken trend) for a valid SELL Entry. Initial T/p level is to be located around 1.3050 and 1.2900 if sufficient bearish pressure is maintained. The material has been provided by InstaForex Company - www.instaforex.com |
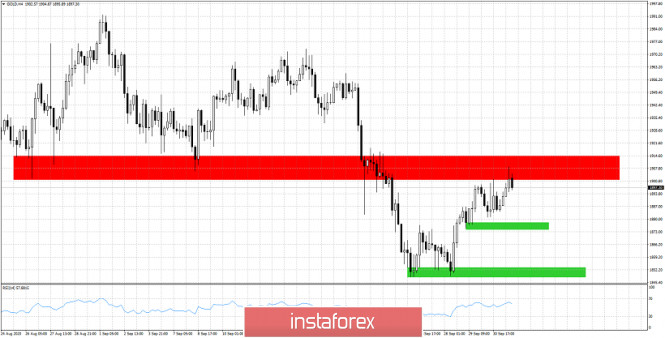
| Gold price rejected at $1,900 resistance Posted: 01 Oct 2020 07:49 AM PDT Gold bulls managed to push price briefly above $1,900 today but as we previously said, the $1,900 level is very important resistance. The first signs we have from this test are not optimistic for bulls as price got rejected.
Green rectangle - short-term support Although price got rejected at the key resistance, bulls still have hopes for a move higher as price is still above the key short-term support shown in the 4 hour chart above as green rectangles. Bears not only need to defend $1,900, they will need to push price below the $1,870 level initially and below $1,850 later, in order to hope for a move towards $1,800. For the time being price is making higher highs and higher lows. It is not wise to be very optimistic now as price has reached key resistance area, but bears also should not get carried away thinking that this rejection is a reversal sign. Bears need to see price break below $1,870 in order to confirm the reversal and the end of the bounce. The material has been provided by InstaForex Company - www.instaforex.com |
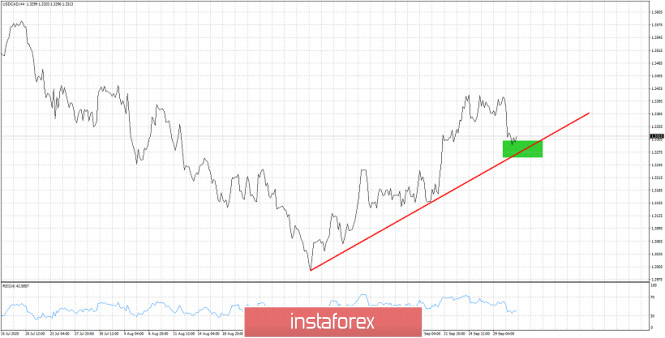
| EUR/USD at a crossroads: dollar's hopes and euro's fears Posted: 01 Oct 2020 07:45 AM PDT
The main currency pair was at a crossroads. On the one hand, positive market sentiment pushes it up, while on the other hand, downside risks remain high. On Wednesday, US Treasury Secretary Steven Mnuchin expressed optimism about another stimulus package. "We are going to make another serious attempt," he said. Along with strong US private-sector employment data from ADP, this helped stocks rise and lowered the USD index to a one-week low of 93.6 points. While the market believes a deal is close, Senate Majority Leader Mitch McConnell believes it is still a long way off. The size of the next financial aid package for the United States remains a stumbling block. Democrats are offering to accept a $2.2 trillion stimulus package for the national economy, while Republicans are willing to accept only $1.5-1.6 trillion. The failure of negotiations may lead to a fall in stock indices and a resumption of growth in the USD. Another risk comes from Donald Trump. The head of the White House said that he would refuse to accept the election results if Joe Biden wins. If Trump really loses and refuses to accept the election results, the situation may get out of control. Against the background of the growing internal political confrontation in the United States, the stock market may once again go into a deep peak, returning demand for a safe greenback. The third risk factor is the continued increase in cases of coronavirus in the Old World. Although the number of deaths in the EU is still lower than in the United States, the fear of a worsening situation may put pressure on the euro. "The EUR/USD pair rose after completing the formation of a short-term base above 1.1688 and is now approaching the area of stronger resistance, which begins at 1.1764 and extends to 1.1804 (55-day moving average, a downward trend from the peak of early September and 38.2% rollback of the September fall)," Credit Suisse experts noted. "Support is at 1,1709, then at 1,1693. A break of 1.1665-1.1661 will cause bearish pressure on the pair and target it at 1.1642, 1.1598, and 1.1485-1.1495. Meanwhile, a break of 1.1804 will contribute to the resumption of the upward trend and will target the pair at 1.1827, 1.1873-1.1883, 1.1918, and 1.2011," they added. The material has been provided by InstaForex Company - www.instaforex.com |
| Posted: 01 Oct 2020 07:45 AM PDT EURUSD moved as high as 1.1770 but bulls were not strong enough today to break above the downward sloping trend line resistance at 1.1785. Price is back near the Daily lows and this is not a good sign.
EURUSD has resistance at 1.1785-1.18. Support is at 1.1660. Price is very close to key resistance. As long as price is below this key resistance we prefer to take short-term bearish bets for a move towards 1.16 and lower. Breaking above 1.1785-1.18 will open the way for a move towards 1.19. Currently we continue to consider this bounce as a pause to the bigger pull back we see coming towards 1.15. The material has been provided by InstaForex Company - www.instaforex.com |
| H&M Quarterly Profit Decreases Beyond Forecasts Posted: 01 Oct 2020 07:40 AM PDT
Hennes & Mauritz AB (H&M), one of the largest European fashion retailers, reported that its profit fell 2.1 times to 1.821 billion Swedish kronor ($202.7 million) in the third fiscal quarter, which ended on August 31. This figure exceeded analysts' forecasts. Their estimates reached 1.41 billion kronor. As follows from the press release of the company, it has already passed the most difficult stage associated with the pandemic. Strict cost control, good consumer demand and strong sales of no-discount products did their job, and H&M recovered faster than expected. In the second financial quarter, H&M's revenues fell 19% to 50.87 billion kronor from 62.57 billion kronor a year earlier. The drop in revenue in national currencies was 16%.It should be noted that the situation began to improve in September. The decline in revenue in national currencies was only 5%. Still, 166 of more than 5 thousand H&M clothing stores remain closed. Due to the global lockdown, consumers prefer to shop online. As a result, the company is working on optimizing its store portfolio and developing an online shopping system. H&M plans to close approximately 250 stores next year. Thus, about a quarter of H&M stores are eligible for annual renegotiation or cancellation of leases, which gives the company the opportunity to close some of them. H&M shares are growing steadily during today's trading. Since the beginning of the year, the company's capitalization has decreased by 12.4% to approximately 255 billion kronor. The material has been provided by InstaForex Company - www.instaforex.com |
| USDCAD reaches pull back target Posted: 01 Oct 2020 07:37 AM PDT USDCAD has pulled back as expected inside the 1.33-1.3260 area. Price has now reached very close to key trend line support. Turning bullish again at current levels is preferred as price is just above key support.
Green rectangle - pull back target area USDCAD is trading just above the red upward sloping trend line support. This support is at 1.3260. As long as price is above this level bulls remain in control of the short-term trend. So now that we have reached the pull back target we could turn short-term bullish once again. Price can now bounce off the red trend line and continue higher towards 1.35. Bulls do not want price to break below 1.3250 that is why we now prefer to turn bullish again just by risking 50 pips. The material has been provided by InstaForex Company - www.instaforex.com |
| Trade Of The Day: GBPUSD High Probability Setup (Video) Posted: 01 Oct 2020 07:09 AM PDT Today we take a look at GBPUSD. Combining advanced technical analysis methods such as Fibonacci confluence, correlation, market structure, oscillators and demand/supply zones, we identify high probability trading setups. The material has been provided by InstaForex Company - www.instaforex.com |
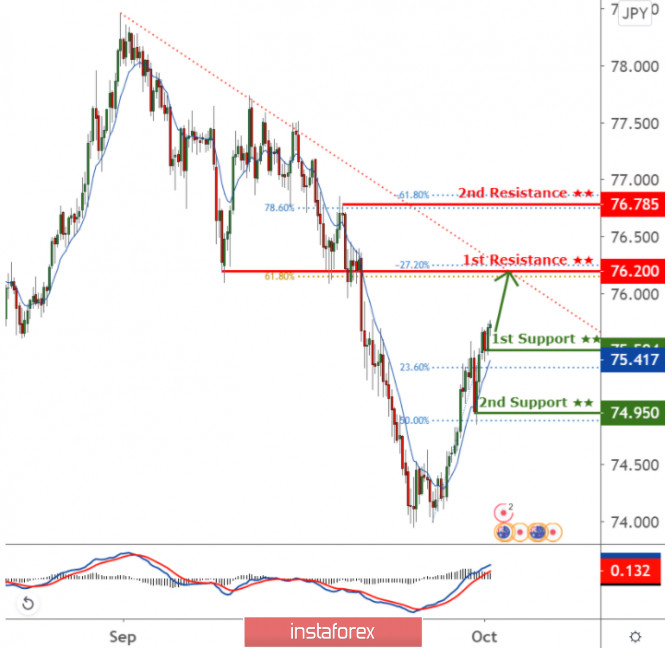
| AUDJPY push up towards descending trendline resistance! Posted: 01 Oct 2020 07:09 AM PDT
AUDJPY holding above moving average support and 23.6% Fib retracement. MACD is above 0 as well showing room for further bullish momentum. A short term push up towards 1st resistance at 76.200 can be expected. Trading Recommendation Entry: 75.504 Reason for Entry: 23.6% fib retracement, moving average Take Profit : 76.200 Reason for Take Profit: -27.2% fib retracement, 61.8% Fib extension, descending trendline resistance Stop Loss: 74.950 Reason for Stop loss: 50% Fib retracement ,Recent swing low The material has been provided by InstaForex Company - www.instaforex.com |
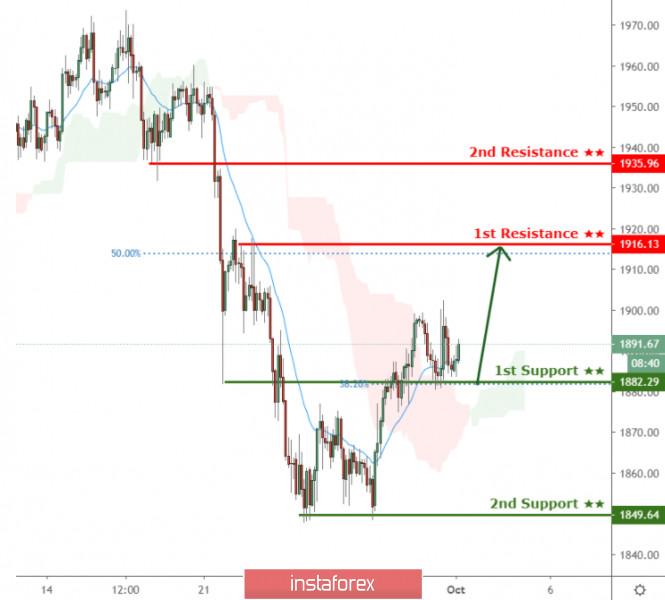
| XAUUSD bouncing from 1st support, further rise expected ! Posted: 01 Oct 2020 07:08 AM PDT
Price is facing bullish pressure from our first support, in line with our 38.2% fibonacci retracement and horizontal overlap support where we could see a further bounce above this level. Both the Ichimoku cloud and 20 period EMA are showing signs of bullish pressure . Trading Recommendation Entry: 1882.29 Reason for Entry: 38.2% fib retracement Take Profit: 1916.33 50% fib retracement Stop Loss: 1849.64 Reason for Stop Loss: Horizontal swing low The material has been provided by InstaForex Company - www.instaforex.com |
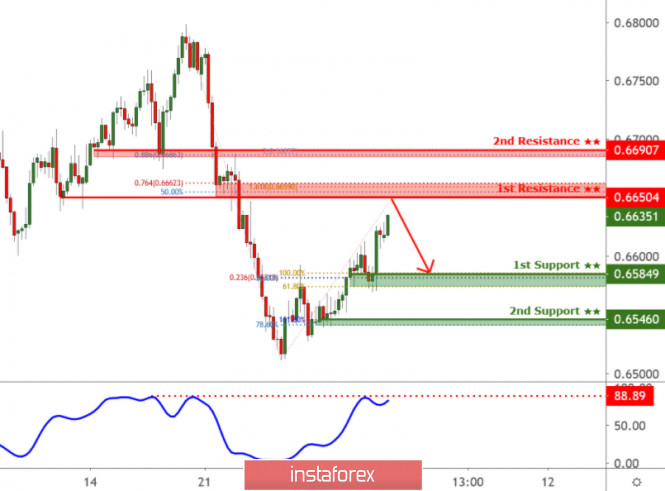
| NZDUSD is approaching major resistance, potential for drop! Posted: 01 Oct 2020 07:07 AM PDT
Trading Recommendation Entry: 0.66504 Reason for Entry: 161.8%, 76.4% fibonacci extension, 50% fibonacci retracement, and horizontal graphical resistance Take Profit: 0.65849 Reason for Take Profit: 61.8%, 50% fibonacci retracement and 100%, 23.8% Fibonacci extension. Stop Loss: 0.66907 Reason for Stop Loss: 61.8% fibonacci retracement, 88.6%, 200% fibonacci Extension, and horizontal graphical resistance The material has been provided by InstaForex Company - www.instaforex.com |
| Posted: 01 Oct 2020 06:30 AM PDT
The events that ended the depressing month for the market on the last day of the quarter are as follows: The growth of stock indices was marked yesterday. On the other hand, House Speaker Nancy Pelosi and US Treasury Secretary Steven Mnuchin have not reached an agreement regarding the coronavirus stimulus bill. Meanwhile, the Dow Jones Industrial Average, which controls the development of the US stock markets and covers the 30 largest US companies, rose more than 500 points at the beginning of the trading session. It should be admitted that so far, it has managed to return only some of these results, showing an increase of 329 points, which equates to 1.2%. Investors had high hopes for the bill designed to improve the state of the US economy, and so, the market could be shaken neither by the situation with the spread of the coronavirus, nor even the last televised debate between Trump and Biden. Now, it is worth hoping for more scenarios that will be able to significantly shake up the market on Thursday. For example, the US retail chain Bed Bath & Beyond Inc., which sells household goods, is due to report on earnings soon. Investors are expecting news of a significant loss of funds, namely 32 cents per share on revenues of $ 2.6 billion. At the same time, the wine and spirits producer Constellation Brands Inc. Class A shares will be valued at $ 2.50 (on $ 2.2 billion in revenues), while soda and snack maker PepsiCo Inc. shares will be valued at $ 1.48 (on income of $ 17.2 billion). A weekly indicator that measures unemployment in the United States cannot be ignored either. It is planned to compare the data of the report with the growth of vacancies in the private sector. Analysts believe that over the past week, the number of new applications for unemployment benefits should be 850 thousand, while the number of secondary applications should be 12.3 million. However, data on personal income and expenditures of the population for August is not that important for investors. Analysts forecast that September revenues will decline 2.4% compared to the previous month, while expenses will rise 0.7%. The material has been provided by InstaForex Company - www.instaforex.com |
| Posted: 01 Oct 2020 06:30 AM PDT
The price of December gold futures on the New York Comex exchange rose by 0.14%, reaching $ 2.65. December silver futures also rose (by 1.03% to 23.735 dollars per ounce). Futures for the USD index, which reflects the ratio of the US dollar to a basket of six major currencies, were 0.19% lower, trading at $ 93.752. Today is characterized by an increase in gold futures prices during the Asian trading period. In general, the price of gold rose by 3.9% in the third quarter, and by 22% in the first nine months. Statistics for the United States, which was published on Wednesday, fully met the expectations of investors regarding the recovery of the country's economy. There is no doubt that the US dollar is a guarantor for traders and a more reliable asset. For this reason, strong macro statistics added confidence to investors and pushed them to take risks. This kind of phenomenon restrained the demand for the currency. It is worth recognizing that gold is also as important for investors as the US dollar, being no less a safe asset. However, according to analysts, the main indicator and incentive for gold remain the US dollar exchange rate. The falling dollar can support gold prices. Gold, in turn, loses value for investors who use a different currency. Today, there is some relief in the market, and this is because the dollar rally has come to an end, and many investors are focusing their attention on the problems of restoring the global economy. The material has been provided by InstaForex Company - www.instaforex.com |
| Tokyo Stock Exchange will resume operations tomorrow after a system failure Posted: 01 Oct 2020 06:30 AM PDT
There is equally exciting news coming from Japan, while the entire world emotionally debates on America's future. Today, the Tokyo Stock Exchange was shut down for a day due to a system failure. According to the Kyodo agency, the Nikkei index, which reflects the stock quotes of more than 200 leading organizations in Japan, as well as the Topix index, which represents the stock prices of companies in the first section, could not correctly show the stock prices. It can be recalled that shares of 3,700 companies are represented in both sections of the Tokyo Stock Exchange. It should be noted that the legendary restraint and calmness of the Japanese did not let them down even in such a stressful situation. As soon as the work of the Tokyo Stock Exchange stopped, its president, Koichiro Miyahara, addressed the public with a brief statement. He said that they intend to replace the failed devices and are preparing so that operations can resume tomorrow. The president also apologized for the suspension of trading for the whole day and explained that if work will be resumed earlier, it could lead to a confusion in the market. At the same time, technical specialists at the Tokyo Stock Exchange gave the most detailed explanation of what happened and said that the failure was due to the Arrowhead trading system. The possibility that a cyberattack caused the technical problems was rejected even at the initial stages of identifying the causes of the failure. Despite such calmness on the part of the exchange's representatives, I would like to outline the real scale of the tragedy. First, this is the biggest system failure since 1999, when the Tokyo stock exchange switched completely to electronic trading. Secondly, due to a halt in trading in Tokyo, the exchanges in Nagoya, Sapporo and Fukuoka were also forced to suspend trading. Only the exchange in Osaka was not affected by Tokyo's technical issues and continued to operate normally, since the basis of its transactions is futures trading. The material has been provided by InstaForex Company - www.instaforex.com |


| You are subscribed to email updates from Forex analysis review. To stop receiving these emails, you may unsubscribe now. | Email delivery powered by Google |
| Google, 1600 Amphitheatre Parkway, Mountain View, CA 94043, United States | |
No comments:
Post a Comment