Forex analysis review |
- Forecast for EUR/USD on October 14, 2020
- Forecast for GBP/USD on October 14, 2020
- Forecast for AUD/USD on October 14, 2020
- Forecast for USD/JPY on October 14, 2020
- Overview of the GBP/USD pair. October 14. The EU's position in the negotiations with London is softening, despite the opposite
- Overview of the EUR/USD pair. October 14. Donald Trump wins the battle for the Supreme Court of the United States and Joe
- Gold & Silver - H4. Comprehensive Analysis of APLs & ZUP traffic options from October 13, 2020
- Analytics and trading signals for beginners. How to trade EUR/USD on October 14? Getting ready for Wednesday session
- EUR/USD depends on downbeat ZEW indexes, expected slowdown in US inflation, and stubborn Democrats
- What will finally return EUR/USD to the "bearish" trend?
- October 13, 2020 : EUR/USD daily technical review and trade recommendations.
- October 13, 2020 : EUR/USD Intraday technical analysis and trade recommendations.
- October 13, 2020 : GBP/USD Intraday technical analysis and trade recommendations.
- EURUSD shows weakness signs
- Trading plan for Gold
- AUDUSD gets rejected at short-term resistance
- Pound with and without Brexit agreement
- Stocks Europe declined while Asia traded multidirectional
- Evening review on October 13, 2020
- Dollar rises as complications impede progress on the development of COVID-19 vaccine
- Oil dynamics amid COVID-19 and US Presidential elections
- BTC analysis for October 13,.2020 - Strong progress on our long position from few days ago and potential for test of $12.000
- EUR/USD analysis for October 13 2020 - Completion of the bull flag pattern and potential for new wave to the upside towards
- Analysis of Gold for October 13,.2020 - Completed downside correction (bull flag pattern) and potential for rise towards
- Will the euro become digital in the future?
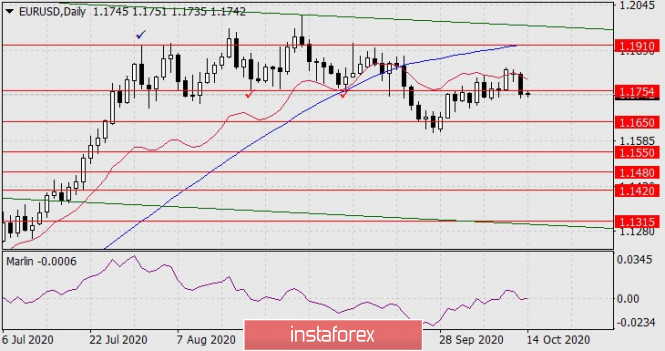
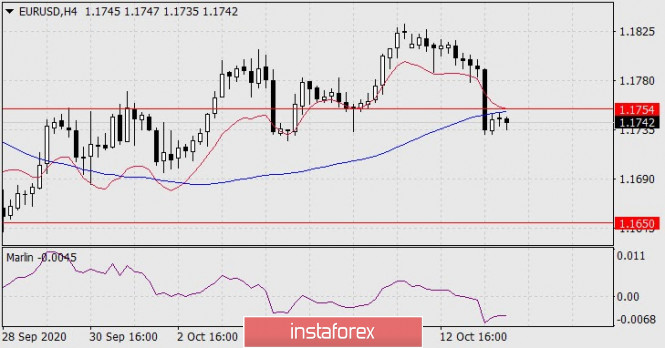
| Forecast for EUR/USD on October 14, 2020 Posted: 13 Oct 2020 08:01 PM PDT EUR/USD The S&P 500 lost 0.63% on Tuesday, on the news that Johnson & Johnson's anti-skin vaccine trial was suspended due to severe side effects, and so the euro fell by 66 points. This, as we see it, stopped the speculative growth over the euro that has been ongoing for the past two weeks. The price moved below the target level of 1.1754, having reversed from the resistance of the balance line on the daily chart. The Marlin oscillator is back in the negative territory. Now we are waiting for the price to drop to the target level of 1.1650, then to 1.1550 (November 2017 low). The price settled under the MACD line on the four-hour chart, while Marlin is in the negative zone. Conditions for a further decline have been formed, we are waiting for the price at the indicated levels. |
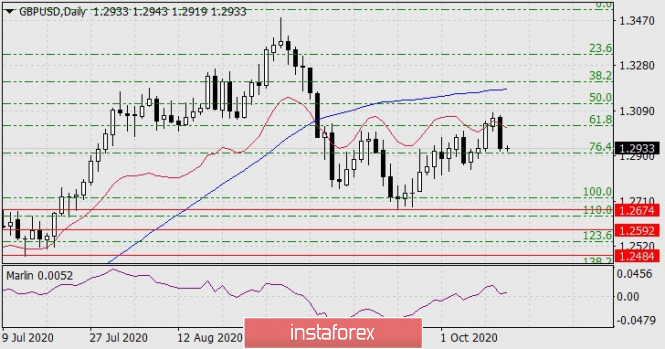
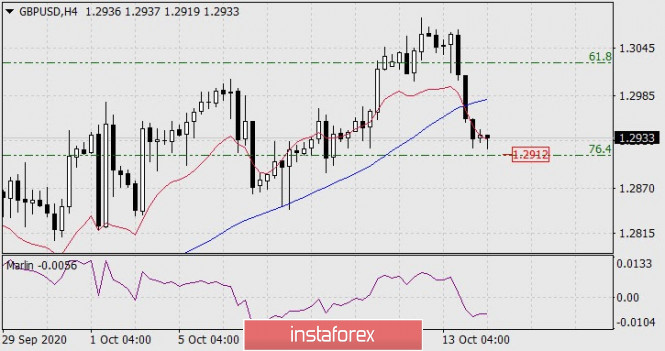
| Forecast for GBP/USD on October 14, 2020 Posted: 13 Oct 2020 08:01 PM PDT GBP/USD The pound sterling was down more than 120 points yesterday, almost hitting the first decline target at 76.4% Fibonacci 1.2912. Take note that the Fibonacci grid, built according to the base branch of the movement on December 13, 2019-February 28, 2020, loses its accuracy in determining the target levels. It will be replaced by other technical tools. But the price still needs to settle below the level of 76.4% (1.2912) in order for it to advance further towards the target of 1.2674 - to the low on September 23. Getting the price to settle below 1.2912 will also allow the Marlin oscillator to move into a negative trend zone, which will become a confirmation signal for a decline. |
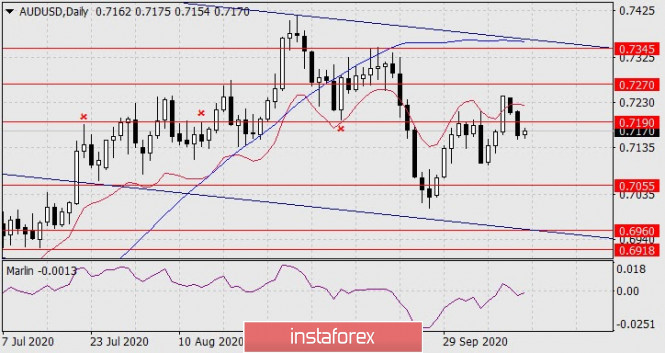
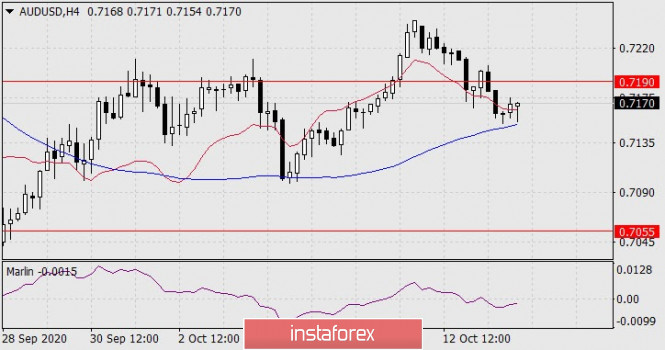
| Forecast for AUD/USD on October 14, 2020 Posted: 13 Oct 2020 08:01 PM PDT AUD/USD The Australian dollar broke the target level and support at 0.7190 yesterday, identified by the extremes of September 9, August 13 and July 22. The level is strong, overcoming it, obviously, will cause the price to decrease further. The nearest target is 0.7055. It will be helped by the Marlin oscillator, which has moved into the downward trend zone on the daily chart. The decline stopped before the support of the MACD line on the four-hour chart. If the price moves below yesterday's low of 0.7151, it will also correspond to the price moving below this indicator line. This will be a signal for the price to decline further to the designated level of 0.7055. |
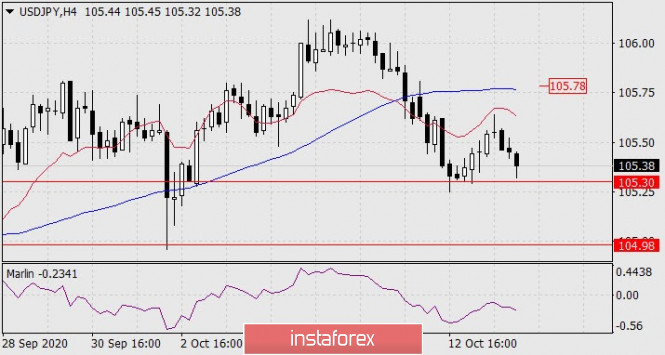
| Forecast for USD/JPY on October 14, 2020 Posted: 13 Oct 2020 08:01 PM PDT USD/JPY The USD/JPY pair failed to grow yesterday, as the US stock market fell by an average of 0.45% on indices. The yen has not been able to break away from support at 105.30 for three weeks now. This becomes dangerous in the sense that the market may fall to a rather low target level of 103.75. But before that, the price needs to settle below the embedded price channel line, below the 104.98 level. But even the probability of such an event cannot be determined, the situation has become even more uncertain than it was yesterday. The signal line of the Marlin oscillator is also in the dark at the border of the growth territory. The trend is completely downward on the four-hour chart: the price falls below both indicator lines, while Marlin is directed to the downside in the negative zone. Getting the price to settle below the 105.30 level will enable it to fall to the support of 104.98, but the price may also increase from this level. As before, we are waiting for the development of events. We can only talk about growth when the price goes beyond the MACD line (105.78). |
| Posted: 13 Oct 2020 05:06 PM PDT 4-hour timeframe
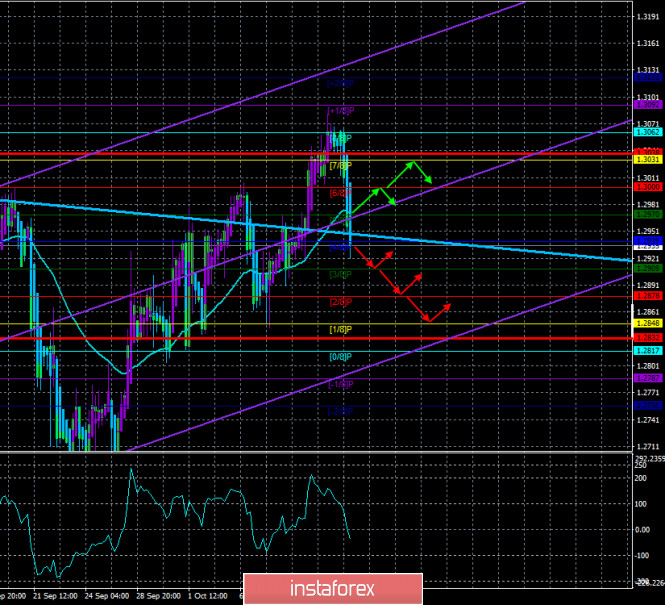
Technical details: Higher linear regression channel: direction - downward. Lower linear regression channel: direction - upward. Moving average (20; smoothed) - sideways. CCI: -39.4630 The British pound sterling paired with the US currency also fell down in the second half of the last day. It is difficult to say what caused a sharp rise in the US dollar. However, we would not recommend giving it too much importance. If you look at the chart of the pound/dollar pair carefully, there have been at least three such price collapses in the last two weeks alone. So, from our point of view, nothing extraordinary happened. Moreover, in the very near future, the pair may return to the area above the moving average line and resume the upward trend. The most interesting thing for the GBP/USD pair is the fundamental background. Because it is equally or almost equally bad for both the British pound and the US dollar. Thus, now it is simply impossible to draw a conclusion like: "The pound has a much better chance of growth due to a favorable background". This is why we recommend paying more attention to technical factors and keeping in mind that the fundamental background is equally weak for both currencies. We have already talked about the United States. Most of their problems, which have put pressure on the dollar in recent months, may be resolved before the New Year. Elections will be held, election courts will be held, and Democrats and Republicans, presumably, will have already agreed on a new package of assistance to the American economy. And the situation for the US currency will become more calm and favorable. But for the pound, it's just getting started. We have repeatedly said that from 2021, Britain's GDP will be reduced again in any case, even with a deal with the EU, even without it. And no one can say what will be the consequences of a new outbreak of coronavirus for the British economy. The only mitigating factor for Britain is a free trade agreement with the European Union. And I must say that in recent weeks, everything in this issue has become confused and now it does not look as clear as before. Recall that from the very beginning, the European Union has taken an exceptionally tough position on negotiations. EU leaders have repeatedly stated that London will not be able to enjoy all the preferences of EU membership without being in the EU itself. Alliance leaders have accused the UK of excessive desires and unwillingness to give in and have repeatedly stated that London will not achieve anything by using such a strategy in negotiations. After the "Johnson bill" became known in early September, the European Union reiterated that the negotiations could become even more complicated. However, despite all these statements, negotiations continue according to the scenario of Britain. First, Boris Johnson sets deadlines for these negotiations and graciously agrees to postpone them from time to time. Second, London's position is also notable for its steadfastness. Third, there is only one conclusion that can be drawn now. If negotiations continue, then there is still minimal progress. However, in what question? Recall that the key differences between the parties are issues of fishing in British waters, fair and transparent competition between European and British companies, the supremacy of the European Court of Justice and Law, as well as compliance with European rules and regulations. What is known for certain is that London refuses to grant the right to European countries to have unrestricted access to British waters for fishing. Thus, several EU countries may lose entire fishing industries at once, since they do not have their own waters. One way or another, the negotiations continue and there may be either a breakthrough or a failure at the next EU summit, which will be held this week. We don't want to get so far ahead of ourselves and try to predict the results of the summit and the negotiations. We would just like to note that it seems that the European Union is ready to make big concessions in order to reach an agreement with London. It is difficult to judge now if this is true or not. However, not all EU countries are ready to be loyal and soft in the Kingdom. For example, France is also taking an extremely tough position in the negotiations, as it is its fishing industry that could be severely affected by the ban on fishing in British waters. According to rumors, it is Paris that can "hack" the deal if its interests are not taken into account or satisfied. It should be remembered that the European Union consists of 27 states and at least five of them have a significant voice in any issues discussed. At the same time, Boris Johnson made another "reassuring and encouraging" statement regarding the COVID-2019 epidemic. The British Prime Minister said that there is no hope for an effective vaccine, at least in the near future. The British Prime Minister believes that the chances of getting a vaccine are very high, but "SARS/SARS (severe acute respiratory syndrome) appeared 18 years ago and we still do not have a vaccine against it". Meanwhile, the second "wave" of the pandemic in the UK continues to progress, with approximately 14-15 thousand new cases registered each. Quarantine measures have been tightened, but this does not yet affect the spread of the virus. And of course, it is impossible not to note the possible reduction of key rates by The Bank of England in the negative area. Of all the inaccurate factors, this one is the least doubtful. Traders have little doubt that the BA will go to expand the quantitative easing program by another 50 or 100 billion pounds, as well as to reduce the key rate. It's just a question of timing. Most experts still believe that the regulator will resort to such serious measures only at the moment of greatest danger and threat. In other words, when the British economy suffers another setback. We don't know when that will happen. Many experts agree that at the beginning of 2021, BA will be forced to take such a step because of Brexit and the new reality in which Britain will now have to exist. Thus, after the month of November, we would say that the chances of growth are much higher for the US currency than for the pound sterling. Moreover, even now the pound looks somewhat overbought.
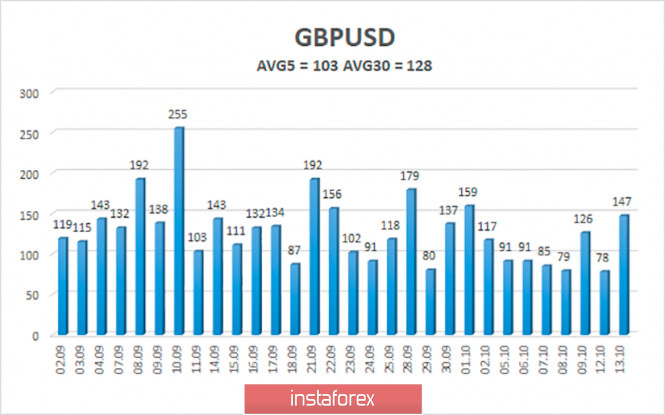
The average volatility of the GBP/USD pair is currently 103 points per day. For the pound/dollar pair, this value is "high". On Wednesday, October 14, therefore, we expect movement inside the channel, limited by the levels of 1.2832 and 1.3038. A reversal of the Heiken Ashi indicator to the top signals a round of upward correction or a resumption of an upward trend. Nearest support levels: S1 – 1.2939 S2 – 1.2909 S3 – 1.2878 Nearest resistance levels: R1 – 1.2970 R2 – 1.3000 R3 – 1.3031 Trading recommendations: The GBP/USD pair started a strong downward movement on the 4-hour timeframe. Thus, today it is recommended to stay in short positions with targets of 1.2909, 1.2878, and 1.2848 as long as the Heiken Ashi indicator is directed down. It is recommended to trade the pair for an increase with targets of 1.3000 and 1.3031 if the price returns to the area above the moving average line. The material has been provided by InstaForex Company - www.instaforex.com |
| Posted: 13 Oct 2020 05:06 PM PDT 4-hour timeframe
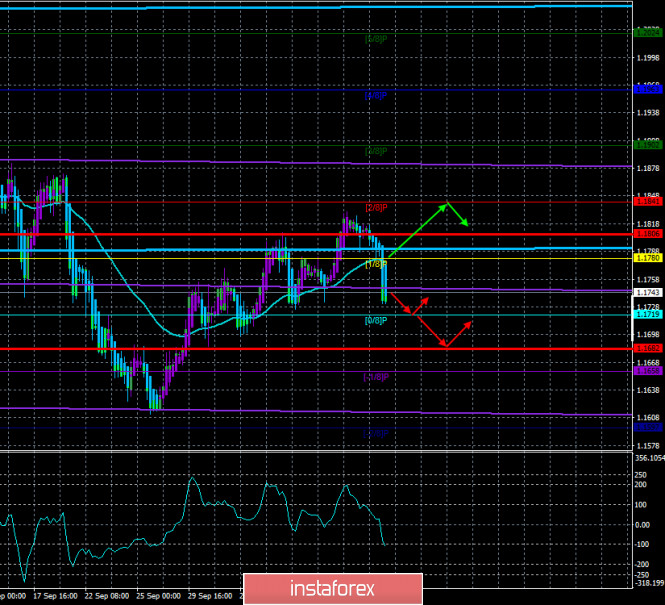
Technical details: Higher linear regression channel: direction - sideways. Lower linear regression channel: direction - sideways. Moving average (20; smoothed) - sideways. CCI: -106.2926 For the EUR/USD pair, the second trading day of the week again passed in fairly calm trading. On Tuesday, October 13, a new round of corrective movement began, which even turned into a collapse of quotes in the afternoon. However, in general, all trades in recent months continue to pass between the levels of 1.1620-1.1940. Of course, for a one-week cut, this is quite a lot, however, for two and a half months, it's not much. This is how much the pair's quotes are in the specified range. Thus, there is no formal flat at this time. Since there are no clear borders of the side channel. If you look at the 24-hour timeframe, you can even conclude that the downward trend is very weak. However, this does not change anything. The main thing is that trading takes place in a very narrow range, thus, there is no trend as such at this time. The fundamental background at the beginning of a new week also remains the same - without changes. There is no news on the topic of negotiations between Democrats and Republicans. There is also no new data on the topic of elections and the election race. In fact, traders receive the same news every day. The US dollar has risen in price over the past day, but nothing changes for it globally. And what can change if there is still no positive news from the US? According to the latest information from US news agencies and TV and radio companies, Joe Biden continues to increase the gap from Donald Trump three weeks before the election. The most interesting thing is that the Democrat does nothing special for such popularity among the people. Recent research shows that Biden has almost the highest ratings among all presidential candidates since 1936. What does this mean? About Biden being so good? Or Trump is so bad. Trump has lost almost every battle as President of the United States. At least, those that are known to the whole world. It is possible that Trump also worked for his own well-being, as a true businessman, however, we do not know this and it is not for us to judge. Most importantly, Trump lost the battle against the "coronavirus", the battle against China, and won the battle against the Democrats only at the expense of more Republicans in the Senate, which could turn into his impeachment. The most interesting thing is that Trump did not understand that in order to please the voters, you need to make the lives of these very voters better. Let's face it, in the first three years of Trump's presidency, the standard of living in America grew, macroeconomic indicators grew, however, Trump's policy was aimed primarily at making the rich richer, and not at the middle and lower class of Americans. Well, the epidemic and the crisis that happened in 2020 only finished off the results of Trump's presidency for four years. Perhaps, without the crisis and the pandemic, the results would not have been so bad. However, the most important thing that the current president has not yet understood is that not only the results are important, but also how you achieved them. Trump has been at war with anyone who refused to accept his point of view throughout his term as president. In the end, he turned half the country against him. He is criticized by the Democrats, disliked by the Pentagon, ignored by the Fed, denied by the country's chief epidemiologist, Anthony Fauci, criticized outside the United States, constantly quarrels with journalists, and constantly insults everyone who asks him uncomfortable questions and points out his mistakes. That is, even if there were no pandemic and crisis, half of America would still be against Trump. And even now, with the election only three weeks away, Trump is directing his forces to populism (the story of the miraculous recovery from the "coronavirus") and the war for the US Supreme Court. We have repeatedly said that the elections will most likely not end at the polling stations. On November 3, chaos is possible, some sections may be disrupted, anything is possible. And almost no one doubts that Trump will appeal to the Supreme Court if he loses the election. That is why he is in such a hurry to appoint "his" judge to replace the untimely deceased Ruth Ginsburg. On Monday, the Senate select committee began hearings on the confirmation of a new member of the Supreme Court, Amy Coney Barrett, a protege of Trump. If she is appointed to the position despite all the efforts of Democrats to postpone this process to a later date, the position of Republicans on the Supreme Court will be strengthened many times. After all, six of the nine judges will be appointed to their posts by Republicans. In this situation, Biden has only one choice. And this is not the hope of a fair trial. The 78-year-old Democrat needs to win the election by a wide margin. And this option now seems more likely and less difficult than trying to win the court from the Republicans. The fact is that if Trump loses several key and controversial states at once, no court can declare illegal or rigged elections in all these states. As practice shows, the court can consider claims for one to two states. And if a review of the vote in these states is enough for Trump to win in the end, then we have bad news for the Democrat. But if the revision of the results for one state is not enough to change the overall picture, then Trump will have nothing to hope for. Because even a court made up of nine Republicans cannot simply overturn the results of the voting in those states that Trump points the finger at. This is all bad news for the US dollar paired with the euro. The more uncertainty, the worse. Yesterday the US dollar slightly strengthened its position, but in the overall picture of the situation, such growth is nothing more than market noise or just one turn inside the 320-point side channel. We do not put an end to the US currency, however, its prospects remain very vague.
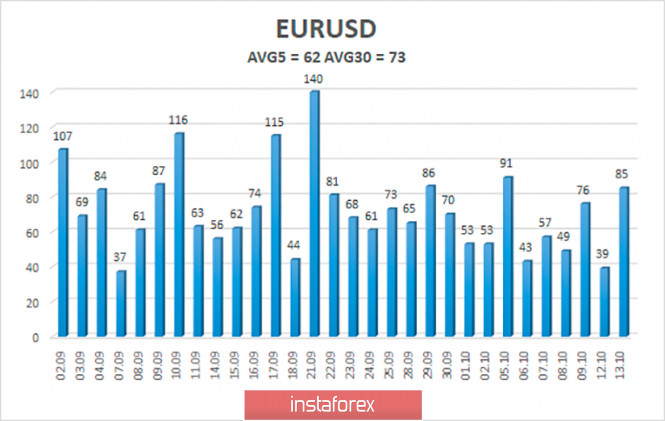
The volatility of the euro/dollar currency pair as of October 14 is 62 points and is characterized as "average". Thus, we expect the pair to move today between the levels of 1.1682 and 1.1806. A reversal of the Heiken Ashi indicator back to the top may signal a round of upward correction. Nearest support levels: S1 – 1.1719 S2 – 1.1658 S3 – 1.1597 Nearest resistance levels: R1 – 1.1780 R2 – 1.1841 R3 – 1.1902 Trading recommendations: The EUR/USD pair fixed below the moving average, changing the trend to a downward one. Thus, today it is recommended to stay in short positions with targets of 1.1719 and 1.1682 open on the signal of overcoming the moving average until the Heiken Ashi indicator turns up. It is recommended to consider purchase orders if the pair is fixed and returns to the area above the moving average with the first targets of 1.1806 and 1.1841. The material has been provided by InstaForex Company - www.instaforex.com |
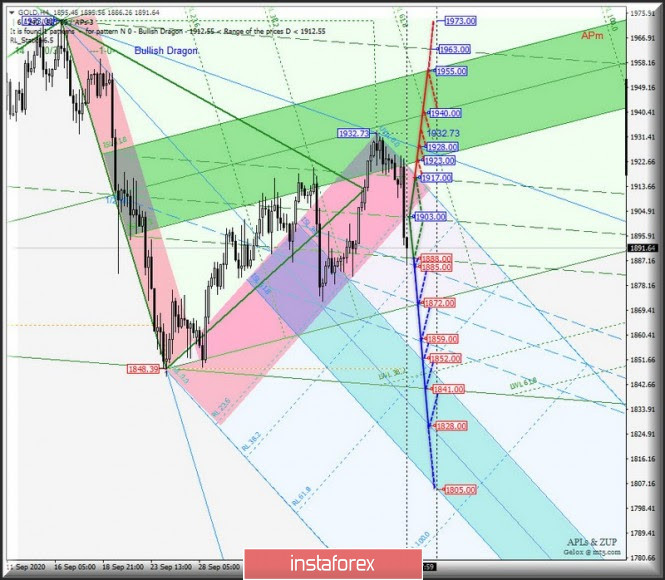
| Posted: 13 Oct 2020 04:51 PM PDT Operational Scale Minute (H4 time frame) Local US Dollar victory in the battle for metal? Review of options for the movement of Gold & Silver from 13 October 2020. ____________________ Spot Gold The movement of the Spot Gold from October 13 2020 was caused by the breakdown development and the direction of the breakout of the channel borders 1/2 Median Line (1888.00 - 1903.00 - 1917.00) of the Minuette Operational Scale Fork. Joint breakdown the lower boundary of the 1/2 Median Line channel of the pitchfork of the Minute operating scale - the support level of 1888.00 and the upper boundary of the 1/2 ML Minuette ( 1885.00 ) channel will make the development of the Spot Gold movement within the boundaries of the 1/2 Median Line channel ( 1885.00 - 1872.00 - 1859.00 ) and the zone relevant equilibrium ( 1852.00 - 1828.00 - 1805.00 ) pitchfork operating scale Minuette. A breakdown of the upper border of the channel 1/2 Median Line Minute - the resistance level of 1917.00 - will direct the development of the Spot Gold movement to the borders of the equilibrium zone (1923.00 - 1940.00 - 1955.00) of the Minuette Operational Scale Fork. ____________________ Spot Silver From October 13, 2020, the Spot Silver movement will develop depending on the development and direction of the range breakout:
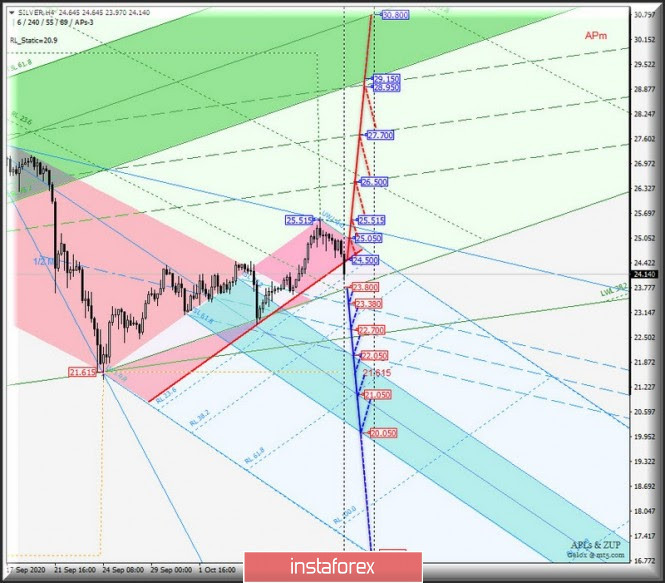
In the event of a breakout of the initial SSL line of the operating scale pitchfork - support level 23.800 - the downward movement of Spot Silver may continue to the boundaries of the 1/2 Median Line channel ( 23.380 - 22.700 - 22.050 ) and the equilibrium zone ( 22.050 - 21.050 - 20.050 ) of the operational scale pitchfork Minuette. Sequential breakdown of the border red zone fork operational scale Minuette - resistance 24.500 - and the initial line SSL Minuette (25.050), and then updating the local maximum 25.515 will make the actual continuation of the upward movement of Spot Silver to the borders of the channel 1/2 Median Line (26.500 - 27.700 - 28.950) fork operational scale Minute. ____________________ The review is compiled without taking into account the news background, the opening of trading sessions of the main financial centers and is not a guide to action (placing "sell" or "buy" orders). The material has been provided by InstaForex Company - www.instaforex.com |
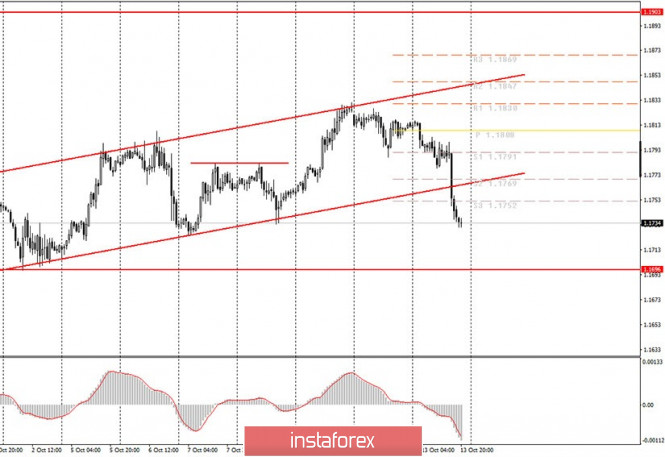
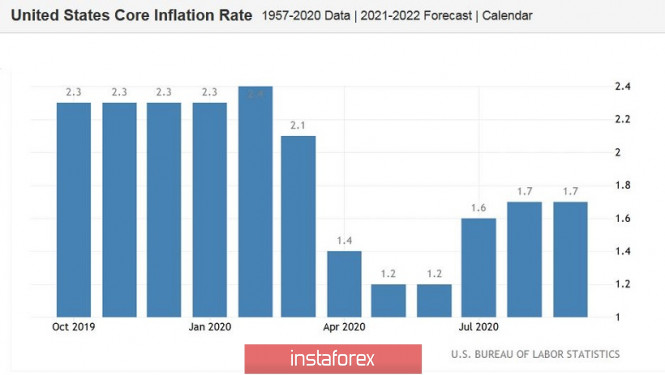
| Posted: 13 Oct 2020 02:15 PM PDT Hourly chart of the EUR/USD pair The EUR/USD pair continued the corrective movement on Tuesday, October 13, which gained strength by the end of the trading day, and the pair's quotes left the ascending channel. Therefore, today's trend for the pair has changed from an upward to a downward one, at least this is the conclusion that can be drawn at this time. As for today's deals, there is absolutely nothing to analyze, since the MACD did not generate a buy signal. We do not recommend selling the pair in case the upward trend continues. Thus, novice traders were deprived of the opportunity to open long positions and received neither profit nor loss at the end of the day. Unfortunately, signals are not generated every day, this is the foreign exchange market. To minimize losses and maximize profits, you need to strictly adhere to a trading strategy. If it does not provide signals, then you should not enter the market. What's next? Now we expect a downward movement in the coming days and even weeks. Tomorrow, quotes may pull back to the upside, after which it will be possible to search for entry points to open short positions in the EUR/USD pair. Take note that today's macroeconomic reports have absolutely nothing to do with the currency pair's movement. Quotes only started to drop (dollar growth) a few hours ago, when the most important inflation report of the day was published in America. However, the main indicator was fully in line with forecasts and reached 1.4% y/y. The consumer price index, excluding food and energy products, reached 1.7%, that is, it did not change compared to August. Thus, we cannot call this data overly positive. Therefore, they could not provoke the rise in the US dollar. In the same way, the data from the EU could not provoke the fall of the European currency. Yes, the European reports turned out to be weaker than the forecasted values, but they were not important and meaningful. We can hardly assume that traders reacted to the EU economic sentiment report by selling off the euro.The same goes for the Business Sentiment Index and inflation in Germany. Thus, we can conclude that economic activity and investor sentiment in the European Union is beginning to deteriorate, but so far this does not mean anything serious. European Central Bank President Christine Lagarde is set to deliver her next speech in the European Union on Wednesday, October 14 and, perhaps, this is all the news for the day. No reports for today according to the calendar of events. Thus, market participants will still have to primarily pay attention to technical factors and to the fundamental background, which cannot be predicted in advance. For example, news from the White House or the US Congress or the Federal Reserve will still have a high value for the dollar. However, no one knows in advance what Donald Trump or Steven Mnuchin or Jerome Powell will say this time. Thus, you need to be on the move to react to potentially important news. Possible scenarios for October 14: 1) Buy positions on the EUR/USD pair have ceased to be relevant at the moment, as the pair has left the ascending channel and will now form a new downward trend. Thus, in order to be able to consider new long positions on the pair, you should wait until new technical patterns appear, such as trend lines or channels, which would support the upward movement. 2) Sell positions have become relevant at the moment. However, following the results of the last few days, the EUR/USD pair dropped by 100 points in total. Therefore, it would be logical to assume that an upward correction will begin now. In any case, the MACD indicator needs to discharge after a strong fall to zero. Therefore, we advise you to wait for the pair's correction, after which it will be possible to look for new sell signals. On the chart: Support and Resistance Levels are the Levels that serve as targets when buying or selling the pair. You can place Take Profit near these levels. Red lines are the channels or trend lines that display the current trend and show in which direction it is better to trade now. Up/down arrows show where you should sell or buy after reaching or breaking through particular levels. The MACD indicator (10,20,3) consists of a histogram and a signal line. When they cross, this is a signal to enter the market. It is recommended to use this indicator in combination with trend lines (channels and trend lines). Important announcements and economic reports that you can always find in the news calendar can seriously influence the trajectory of a currency pair. Therefore, at the time of their release, we recommended trading as carefully as possible or exit the market in order to avoid a sharp price reversal. Beginners on Forex should remember that not every single trade has to be profitable. The development of a clear strategy and money management are the key to success in trading over a long period of time. The material has been provided by InstaForex Company - www.instaforex.com |
| EUR/USD depends on downbeat ZEW indexes, expected slowdown in US inflation, and stubborn Democrats Posted: 13 Oct 2020 09:28 AM PDT Today the EUR/SD pair accelerated the downward move. At present, its price is making efforts to fix below support of 1.1750 (the median line of the Bollinger Bands which coincides with the Tenkan-sen line on the daily chart). The downbeat indexes in the ZEW survey and decent inflation data from the US triggered the downward move of EUR/USD. So, the pair entered its habitual trading range. Since September 30 until October 8, the currency pair was trapped in a narrow range of 1.1710-1.1750. The bears failed to enter the area below 1.17. On the other hand, the bullish momentum faded at near 1.1750. Then, amid the greenback's weakness, the buyers were able to overcome the resistance level aiming for 1.18. However, the bulls found it hard to push the price higher. EUR was weighed down by the figures in the ZEW survey. The business sentiment index for Germany tumbled to 56 points, the weakest score since May this year when Germany was restating the national economy after lockdown. Experts warned of a negative figure with a 2-point decline. In fact, the index slumped 20 points at once. The indicator came in at 76 in September. The figure for October revealed low morale among German businesses.
The index for the Eurozone showed a similar negative dynamic. The ZEW index for Eurozone surged to 72 points in September but it fell steeply to 52 in October. Following a burst of optimism in in the summer when the business sentiment was logging steady improvement both in Germany and the euro area in the wake of the pandemic, the business morale looks gloomy. This information is certainly bearish for EUR. In one of the recent comments, ECB President Christine Lagarde acknowledged that a series of macroeconomic indicators signal a new downturn in the eurozone's economy. So, the economic outlook might be downgraded. The latest news on the coronavirus front is dismal. For example, the largest European economy admitted that the second coronavirus wave is about to hit its national economy. The red alert has been announced in 28 cities and counties, including 3 cities with a million-like population such as Berlin, Munich, and Cologne. In the neighboring France, the number of COVID-19 patients in intense care wards has rebounded to the levels recorded 4 months ago. The situation remains challenging in the Czech Republic, where restrictive measures have been significantly tightened. And although representatives of the authorities of European countries unanimously assert that they do not intend to repeat the spring scenario, the mood in business circles has significantly deteriorated. The ZEW indices published today prove such prospects.The US inflation data came in as expected. Both the headline CPI and the core CPI slowed down to 0.2% on month. In annual terms, the CPI rose to 1.4% while the core CPI remained flat at 1.7% like in the previous month. In other words, the US consumer inflation sank considerably on a monthly basis but keeps afloat on a yearly basis.
Such a fundamental background intraday enabled the bears to hold the upper hand. At present, the sellers are eager to hold the price at the level below support of 1.1750 aiming for lower support of 1.1700. Nevertheless, from my viewpoint the ongoing decline of EUR/USD should be used as an excuse to open long positions. In essence, EUR lost the battle today but it has not been completely defeated by USD. In turn, USD found temporary support from the inflation data. However, it has to survive a tough challenge amid political jitters. In addition, political battles continue over the notorious bill on new financial aid. Today, House Speaker Nancy Pelosi criticized the White House proposal, whose representatives agreed to increase the bill to $ 1.8 trillion. The Democrats still insist on their option of $ 2.2 trillion. At the same time, Pelosi clarified that negotiations are still underway at least until next Friday. If the parties again fail to come to the common denominator, USD will lose ground and the buyers of EUR/USD will assert strength. Thus, considering the medium-term strategy, it would be a good idea to plan long positions with the main target at 1.1880 that the upper border of the Kumo cloud coinciding with the upper line of the Bollinger Bands on the daily chart. Speaking about the short-term strategy, it would be better to be in the wait-and-see mood because it is difficult to recognize a pivot point. The material has been provided by InstaForex Company - www.instaforex.com |
| What will finally return EUR/USD to the "bearish" trend? Posted: 13 Oct 2020 09:19 AM PDT
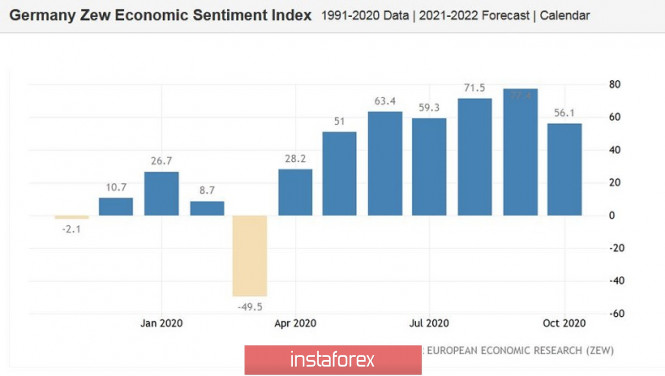
The euro accelerated its fall against the dollar on Tuesday after the publication of data from Germany. The index of investor confidence in the country's economy collapsed to 56.1 points in October from September's 77.4 points. Recall that in two weeks, the EUR/USD pair has risen by more than 200 points. However, the upward trend that has been developing since the end of September was unstable, and the pair failed to overcome its previous high at 1.1870. If the European currency closes Tuesday's session at levels below 1.1750, then it can quickly fall to the level of 1.1600. A breakdown of the local support level of 1.1610 will strengthen the downward trend. A breakout of the support level of 1.1285 can finally return the EUR/USD pair to the bearish trend.
However, despite today's decline, the further forecast for EUR/USD remains positive. The formation of the EU recovery fund and the general weakening of the dollar should contribute to the upward dynamics of the euro. One of the reasons for the decline in the US currency is the outcome of the US presidential election. Joe Biden is ahead of incumbent President Donald Trump and the gap in the rating is constantly increasing. Markets are betting that this time the majority in the Senate will be with the Democrats, who will begin to control the work of Congress. In this case, the economy will receive the expected financial assistance, which will support the population and businesses. The Fed will also do its part, and the regulator will continue to do everything possible to restore the economy. Societe Generale expects that the EUR/USD exchange rate will be trading around 1.20-1.30 in the new year. As mentioned above, the EU recovery fund will help to strengthen the economic growth in the region. It is worth noting that in the medium term, the gap in the rate of economic recovery will grow and the difference in real interest rates will be corrected. The euro should benefit from this. The aggressive reaction of the US regulator to the coronavirus crisis indicates that the dollar is now only at the beginning of a long decline. Meanwhile, on Tuesday, the greenback managed to strengthen its position after news of Johnson & Johnson's failure with the coronavirus vaccine. However, the growth of the dollar is unlikely to be large and even more stable. In addition, the overall tone remains positive for risk.
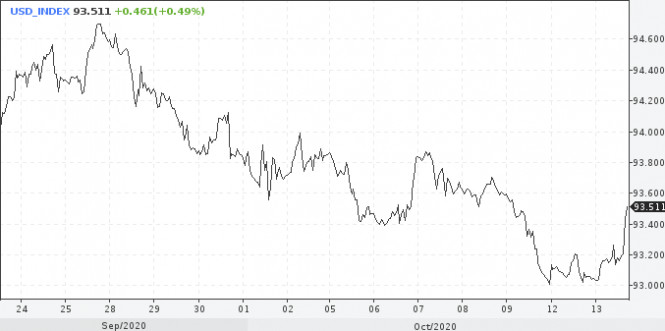
Today in the US session, the dollar index hinted at a change in the trend, breaking up the boundaries of the downward trend. The US currency is only trying to gain a foothold at higher levels, thus, the stability of this trend is out of the question now. The material has been provided by InstaForex Company - www.instaforex.com |
| October 13, 2020 : EUR/USD daily technical review and trade recommendations. Posted: 13 Oct 2020 09:17 AM PDT
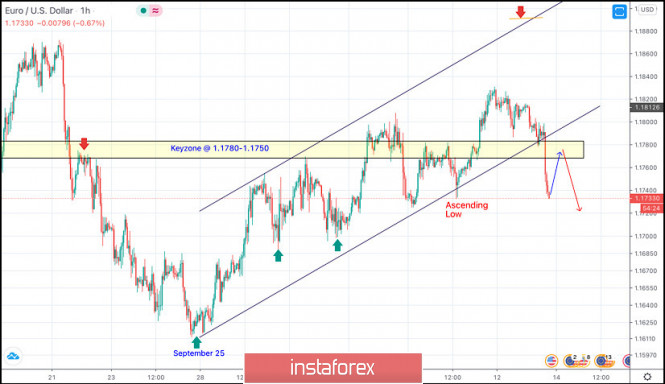
On September 25, The EURUSD pair has failed to maintain enough bearish momentum to enhance further bearish decline. Instead, recent ascending movement has been established within the depicted movement channel leading to bullish advancement towards 1.1750-1.1780 which failed to offer sufficient bearish pressure in the first attempt. Intraday traders should have noticed the recent temporary breakout above 1.1750 as an indicator for a possible bullish continuation towards 1.1880 where the upper limit of the movement channel comes to meet the pair. However, immediate bearish decline brought the pair back below 1.1750. Hence, the price zone around 1.1750-1.1780 remains a Prominent Resistance-Zone as long as bearish persistence is maintained below it. Any upside pullback towards the depicted zone (1.1750-1.1780) should be considered for a SELLING Opportunity, a valid Intraday SELL Entry. The material has been provided by InstaForex Company - www.instaforex.com |
| October 13, 2020 : EUR/USD Intraday technical analysis and trade recommendations. Posted: 13 Oct 2020 09:11 AM PDT
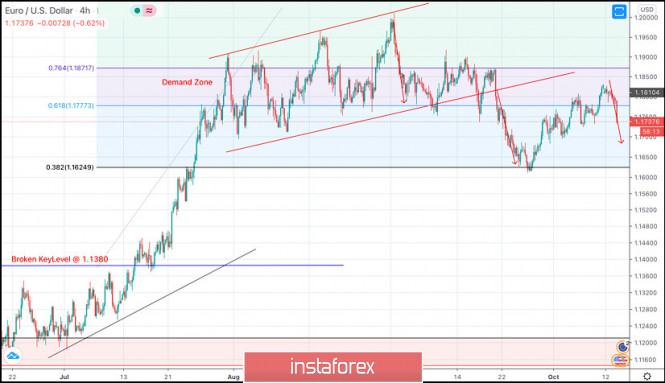
The EURUSD pair has failed to maintain enough bearish momentum below 1.1150 (consolidation range lower zone) to enhance further bearish decline. Instead, bullish breakout above 1.1380-1.1400 has lead to a quick bullish spike directly towards 1.1750 which failed to offer sufficient bearish pressure. Bullish persistence above 1.1700-1.1760 favored further bullish advancement towards 1.1975 where some considerable bearish rejection has been demonstrated. The price zone around 1.1975-1.2000 ( upper limit of the technical channel ) constituted a SOLID SUPPLY-Zone which offered bearish pressure. Intraday traders should have noticed the recent bearish closure below 1.1700 - 1.1750 as an indicator for a possible bearish reversal. On the other hand, the price zone of 1.1850 - 1.1870 remains a solid SUPPLY Zone to be considered for bearish reversal upon any upcoming bullish pullback by Intermediate-term traders. Trade recommendations : Conservative traders should wait for the current bullish pullback to pursue towards the recently-broken Uptrend Line around 1.1850 for a valid SELL Entry. T/P levels to be located around 1.1770, 1.1645 and 1.1600 while S/L to be placed above 1.1900 to minimize the associated risk. The material has been provided by InstaForex Company - www.instaforex.com |
| October 13, 2020 : GBP/USD Intraday technical analysis and trade recommendations. Posted: 13 Oct 2020 09:10 AM PDT
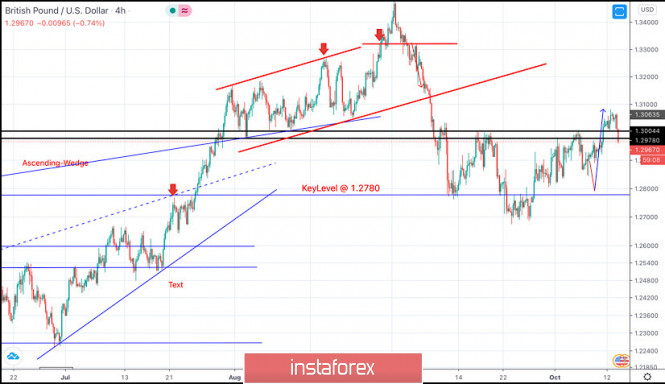
Intermediate-term technical outlook for the GBP/USD pair has remained bullish since bullish persistence was achieved above 1.2780 (Depicted Key-Level) on the H4 Charts. On the other hand, the GBPUSD pair looked overbought after such a quick bullish movement while approaching the price level of 1.3475. That's why, short-term bearish reversal was expected especially after bearish persistence was achieved below the newly-established key-level of 1.3300. A quick bearish decline took place towards 1.2900 then 1.2780 where considerable bullish rejection has been expressed during the past few weeks. The price zone of 1.3130-1.3150 (the backside of the broken-trend) remains an Intraday Key-Zone to offer bearish pressure if retested again. Bullish Persistence above the depicted price zone of 1.2975 -1.3000 was needed to allow bullish pullback to pursue towards 1.3100. However, the GBPUSD pair has shown lack of sufficient bullish momentum to pursue above the price level of 1.3000 upon the past few bullish trials. Hence, another bearish decline towards the price level of 1.2780 was expected to gather enough bullish momentum. Instead, earlier signs of bullish rejection were expressed around 1.2850. Currently, the current bullish breakout above 1.2980-1.3000 should be maintained to enable further bullish advancement initially towards 1.3100 and 1.3150. The material has been provided by InstaForex Company - www.instaforex.com |
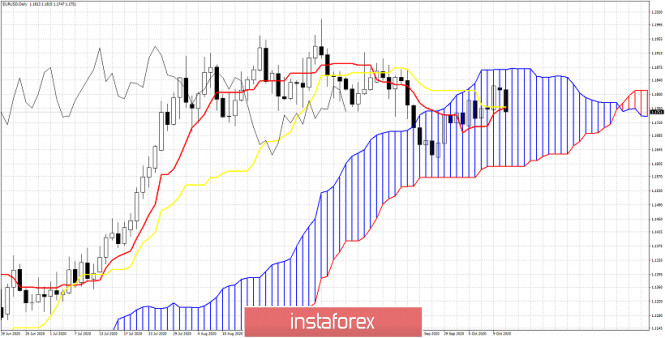
| Posted: 13 Oct 2020 07:04 AM PDT EURUSD is breaking below the tenkan-sen and kijun-sen indicators implying more weakness to come. Trend is neutral still as price remains inside the Kumo (cloud) but there is a tendency to move lower if price stays below 1.1760.
|
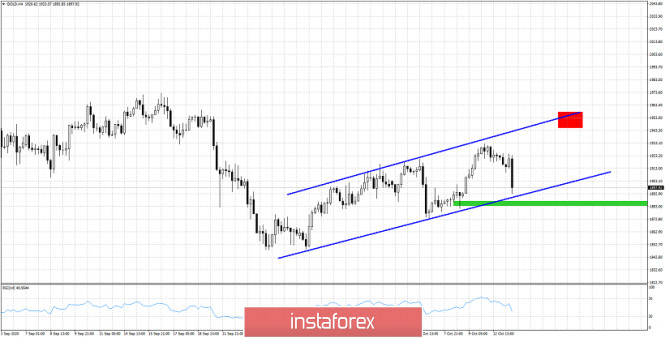
| Posted: 13 Oct 2020 06:59 AM PDT Gold price is trading below $1,900 just on top of critical support levels. Price is still above the short-term upward sloping supper trend line and as long as it holds above it we remain optimistic. Gold is now at $1,895 and we prefer to be short-term buyers with stops placed at $1,882.
Green rectangle - support/stop loss Red rectangle - target I'm bullish Gold at current levels with stops placed at $1,882 and a target of $1,950-60. If price breaks below the green support area then I expect price to fall even further towards $1,850 and lower. Bulls need to continue making higher highs and higher lows. The material has been provided by InstaForex Company - www.instaforex.com |
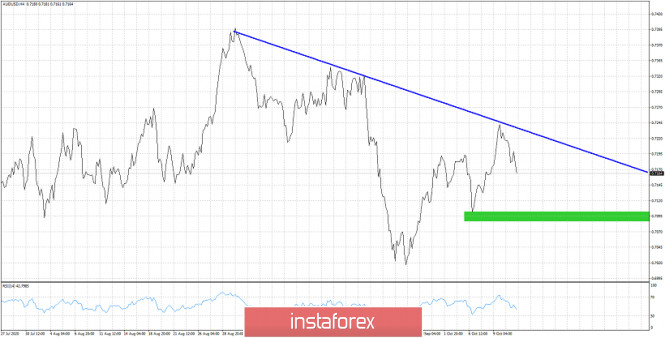
| AUDUSD gets rejected at short-term resistance Posted: 13 Oct 2020 06:56 AM PDT Yesterday we mentioned the importance of the resistance at 0.7235-0.7245. Price today got rejected and is moving lower. Bulls still have hopes of resuming the short-term up trend but they will need to defend the 0.71 price level.
Green rectangle - support area AUDUSD bulls need to break above the blue trend line resistance that has been tested already twice. Both previous times price got rejected. Bulls need to hold above the green support area and eventually break above the blue trend line. My preferred scenario is for price to make another higher low and resume its short-term upward move with a break above the blue trend line. The material has been provided by InstaForex Company - www.instaforex.com |
| Pound with and without Brexit agreement Posted: 13 Oct 2020 06:52 AM PDT
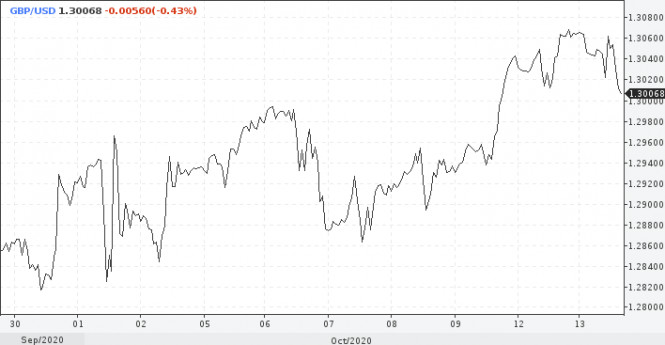
The Brexit X-hour is rapidly approaching, and investors froze in anticipation. Boris Johnson made it clear that he expects to conclude a deal in the coming days. If it cannot be concluded by Thursday, it could mean leaving the EU without a deal. The pound, meanwhile, was relatively calm at the beginning of the day and continues to trade at highs with the dollar around the 1.30 mark. It should be noted that the outcome of the transaction will be important not only for the pound sterling but also for the markets in general. So, what's blocking the deal? The reasons are the same. Britain wants to maintain access to the single market but does not want to comply with EU rules. It is not just extremely difficult, but impossible to reach an agreement in such conditions. Nevertheless, there is a chance for a compromise. This requires London to agree to comply with EU rules in key sectors within the agreed time frame. Then it will be possible to think about organizing joint committees to monitor these agreements. If we talk about sectors that are not included in the deal, the transitional agreement must weaken the original impulse. This is due to the fact that economic growth is weakened on both sides. The new trade deal will be more limited than the current one, and both the EU and Britain can claim victory. Despite the approaching date of the transaction, it can break, and in the very last minutes. At the moment, the pound has two scenarios for development: with or without a deal. If the parties manage to reach an agreement, the exchange rate for sterling may rise by about 5%, as the risks of economic shocks will disappear due to the lack of a deal. In the event of a breakdown in negotiations, which may result in the absence of a deal, the pound will be seriously affected. In this case, it's rate is expected to fall by 10%. During the daytime trading, the GBP / USD pair traded downward, breaking through the important level of 1.30.
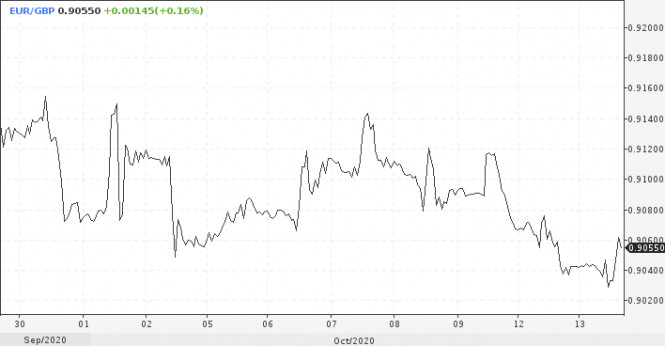
As for EUR/GBP, the pair is likely to continue trading around the 0.90 mark until there is more clarity on the deal. When the deal becomes a reality, the euro should fall to 0.86. In the future, the growth of sterling against the euro will be limited, the EUR/GBP pair may trade around this mark for several months or even a year.
Almost everything is clear with the pound, in fact, it is more difficult to predict the behavior of the FTSE 100 index. There is a negative relationship between the currency and the British benchmark. There is speculation that weaker sterling increases the value of repatriated foreign income, and hence the underlying index. However, not everything is as simple as we would like: the relationship between the pound and the FTSE 100 is unstable. In practice, there is a negative correlation, there were also long periods when a direct relationship was observed. As an example, consider the British referendum that took place four years ago. The FTSE 100 collapsed, then rose and went down again. The pound two weeks after a significant political event became cheaper by 12%, the FTSE gained 2%. Now, when the economies of many countries are going through hard times due to the pandemic, this is not the time to argue and prove your position. Both Europe and the UK need this deal. A destructive outcome of the negotiations will have a negative effect on both sides and worsen the risk appetite of global investors. As a result, corporate and consumer sentiment will suffer, the period of economic weakness will continue, and commodity prices and interest rates will also fall. Market players will have to look for other options to hedge their portfolios if there is no deal. This is a fallback scenario. The basic one is the existence of a trade agreement between Brussels and London. In this case, it will be the best time to buy UK securities. The material has been provided by InstaForex Company - www.instaforex.com |
| Stocks Europe declined while Asia traded multidirectional Posted: 13 Oct 2020 06:44 AM PDT
There was no unity in the dynamics of the movement of the major stock indexes in the Asian stock exchanges on Tuesday morning. All of them went on different sides ahead of the new reporting season. Japan's Nikkei 225 Index rose 0.23%. China's Shanghai Composite Index, on the other hand, fell 0.23%. The Hong Kong stock indicator is undefined today as the stock exchange is closed due to bad weather conditions, squally winds, and the threat of a hurricane. Nevertheless, the statistics on growth in this region are quite good. The level of exports in China in terms of US dollars jumped by 9.9% for the first month of autumn this year. It is particularly significant that the increase is recorded for the fourth consecutive month. This time, the initial estimates almost coincided with the real figures: an average growth of 10% was expected. The level of imports in the country also increased by 13.2% in September compared to the same period last year. This happened for the first time after two months of falling indicators. This increase was very rapid, since, according to the initial estimates, the growth was not expected to exceed 0.3%. South Korea's Kospi Index went down 0.18%. Australia's S&P/ASX 200 index is up 1.04% on Tuesday. Investors were encouraged by the fact that the restrictive measures imposed on travel between countries within the region are gradually being lifted, as new cases of coronavirus infection are becoming fewer. Meanwhile, there is a negative mood on the European stock exchanges as major stock indexes are losing ground before the publication of new statistics in the US. The general index of large enterprises in the European region Stoxx Europe 600 fell 0.15%, which moved it to 372.43 points. The UK's FTSE 100 fell 0.4%. The German DAX index fell 0.27%. France's CAC 40 index fell 0.31%. Italy's FTSE MIB Index parted from 0.2%. Spain's IBEX 35 Index sank 0.23%. The UK's FTSE 100 index fell 0.4%. Germany's DAX index also sank 0.27%. So was France's CAC 40 index by 0.31%. Index Italy's FTSE MIB has gained 0.2%. While Spain's IBEX 35 index sank 0.23%. American companies will start publishing their financial statements for the third quarter of this year starting Tuesday. According to the expectations of market participants, the main indicators should exceed the levels of previous periods and be much higher than the initial estimates. Most of all, investors are concerned about changes in companies in the technology sector. Moreover, the main threat to market stability continues to put pressure on stock indicators. The cases of coronavirus infection in Europe is growing at a fairly rapid pace. With each passing day, there are more restrictive measures are implemented in order to contain the spread of the virus, which, of course, does not please investors. In addition, clinical trials of the COVID-19 vaccine, which were conducted by Johnson & Johnson, were stopped indefinitely due to the unexpected detection of the disease in one of the test patients. The etiology of which has not yet been established. Some statistics in the region were also ambiguous. The level of consumer prices in Germany finally entered the framework of EU standards. In September, there was a reduction of 0.4% in the indicator on an annualized basis. The unemployment rate in the UK increased by 4.5% for the three summer months, as evidenced by the revision of previously published data. Initial estimates expect the growth will not exceed 4.3%. The material has been provided by InstaForex Company - www.instaforex.com |
| Evening review on October 13, 2020 Posted: 13 Oct 2020 05:53 AM PDT
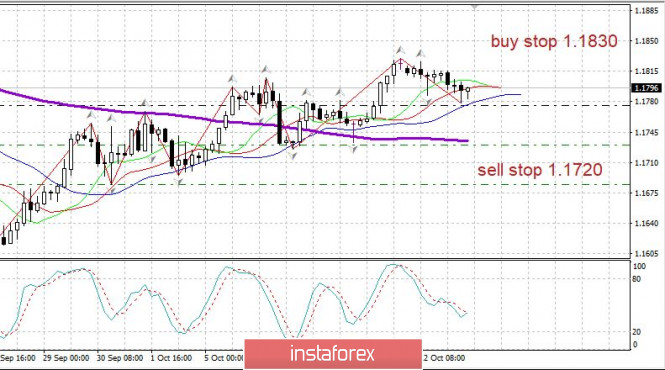
We are waiting for an upward impulse of the EUR/USD pair. To those expecting strong news on US inflation, as the Federal Reserve has initially stated, the indicator remains weak. Both CPI inflation and CPI core are strictly at the forecast level of 0.2% - no signal for the market. A purely technical move does not work. You may keep buying the pair with a stop at 1.1730, and a downward reversal from 1.1730. Buy from 1.1830. The material has been provided by InstaForex Company - www.instaforex.com |
| Dollar rises as complications impede progress on the development of COVID-19 vaccine Posted: 13 Oct 2020 05:17 AM PDT
News that Johnson & Johnson has paused development of a COVID-19 vaccine due to unexpected complications in one of the subjects has triggered a risk aversion and spurred demand for a protective greenback. Against this backdrop, the USD index rose to 93.28 points, slightly recovering its positions after falling to a three-week low of 92.99 points, which occurred on Friday. "The dollar may continue to strengthen in the near future amid the continuing contradictions between American politicians regarding the next stimulus package," said experts at CBA. "It is also possible that the results of the presidential elections in the United States will not be known immediately or will be challenged, which may provide additional support to the greenback," they added. This week's economic calendar is full of US data. In addition, representatives of the Federal Reserve will speak almost every day.
The inflation report is expected on Tuesday, but according to the initial statements of the Fed, the indicator remains very weak, and the statistics should reflect this. On Thursday, the weekly report on unemployment claims is expected. Although the number of new filings last week was the lowest since March, they remain at an all-time high after falling below 1 million in August. Meanwhile, September reports on retail sales, as well as industrial production and consumer confidence, are due Friday. Lack of progress on stimulus negotiations in Congress could lead to more pessimistic statements from Fed officials. The rebound of the dollar amid resurgent demand for safe assets contributed to the fall of the EUR / USD pair below 1.1800. Hopes for a new fiscal stimulus package in the US begin to fade again, as the second wave of the coronavirus pandemic is marching across Europe. And this puts pressure on the euro. According to the research institute ZEW, the index of business confidence in the eurozone economy fell to 52.3 points in October from 73.9 points recorded a month earlier. "Although the indicator is still in positive territory, the euphoria of August and September seems to be fading away. The sharp increase in the number of COVID-19 cases has heightened uncertainty about the future economic development of the region," ZEW said. If a downward movement develops, the EUR / USD pair may visit the 1.1700 area again. On the other hand, the absorption of recent highs near 1.1830 will clear the way for the pair to 1.1900 and further to 1.1960 and 1.2000.
The fate of the pound remains closely tied to the Brexit negotiations. British Prime Minister Boris Johnson made it clear that the trade deal with the EU must be concluded by Thursday, otherwise, there will be no deal at all. Fishing and government support issues remain a stumbling block. Although GBP / USD has pulled back from Monday's five-week highs, it still holds above the key 1.3000 level. Market participants remain cautious in anticipation of the EU leaders' summit on October 15-17. The favorable outcome of the meeting may push the GBP / USD pair to the 1.3100 area and further to 1.3200. The loss of support for 1.3000 will bring the levels 1.2800 and 1.2700 back into play. The material has been provided by InstaForex Company - www.instaforex.com |
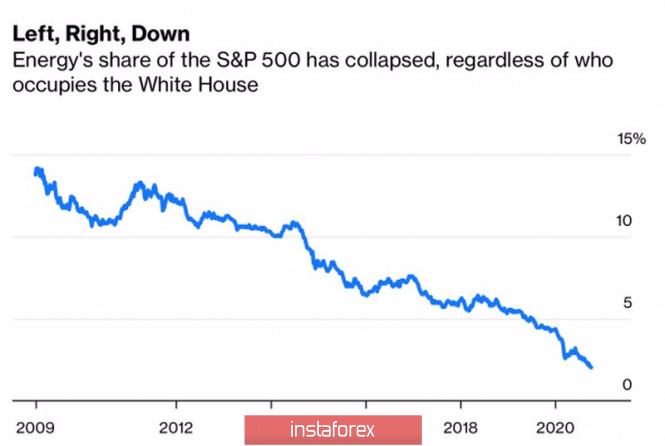
| Oil dynamics amid COVID-19 and US Presidential elections Posted: 13 Oct 2020 04:56 AM PDT A pandemic can have about the same consequences for the oil market as a meteorite falling to Earth for dinosaurs. The price of $100 per barrel is not worth dreaming about, because the gradual replacement of black gold with alternative energy sources can gradually lead to its death. The processes have accelerated due to COVID-19 and increased demand for shares of "green" companies whose activities are aimed at improving the climate. Their share in the S&P 500 structure is rising, while the share of oil corporations, on the contrary, is falling. Under Barack Obama, it was about 15%, while at the beginning of the presidency of Donald Trump, it dropped to 5-7%, and in the run-up to the elections on November 3, it fell to 2%. Dynamics of the share of oil companies in the structure of the S&P 500:
The victory of Joe Biden may completely ruin the industry because of the Democrat's intentions to switch to alternative energy sources. It is possible that he will return to the nuclear agreement with Iran, which will increase the export of black gold from the US by 500,000 b/d by the third quarter of 2021. However, by that time, the growth of global demand and the weakening of the US dollar can compensate for this negative. According to the IEA forecasts, in 2020 and 2021, oil demand will be 8.4 million b/d and 2.1 million b/d less than in 2019. At best, the indicator will return to its pre-crisis levels in 2023. And then with the massive use of vaccines and the associated return of the global economy to the trend. Otherwise, there will be a delayed recovery – demand will be able to rise to the levels of 2019 only in 2025. Such dynamics of the indicator makes the next couple of years an unpleasant time for all black gold producers. Dynamics of global demand:
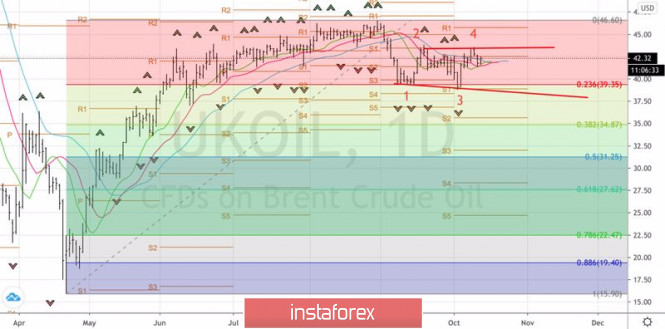
Thus, long-term prospects of Brent and WTI look bearish due to a large-scale transition to alternative energy sources, medium-term prospects, on the other hand, seems bullish due to recovery in global demand, and depressed supply. In the short-term, the North Sea variety has found a refuge in consolidation in the range of $39 - $43.5 per barrel. And there are reasonable explanations for this. Factors such as the resumption of work after strikes in Norway, the restoration of Libyan mining and black gold production on the Gulf Coast, and the consideration of repeated restrictions due to COVID-19 in Britain, Italy, and the Czech Republic are offset by rising Chinese demand. In September, China's oil imports increased by 5.5% compared to August and by 17.5% compared to the same period last year. The indicator rose to 11.8 million b/d, which is one of the bright spots in the black gold market that leaves much to be desired. Technically, a very interesting picture has developed on the daily Brent chart. A break in the resistance at $43.5 per barrel may lead to the recovery of the upward trend, but if the bulls fail to keep quotes above this level, the risks of forming a "Widening wedge" pattern will increase with the threat of oil falling to $39 per barrel or lower. Based on the closing price of the breakout bar at $43.5, we will build a trading strategy: buy above and sell below this level. Brent daily chart:
|
| Posted: 13 Oct 2020 04:32 AM PDT Further Development
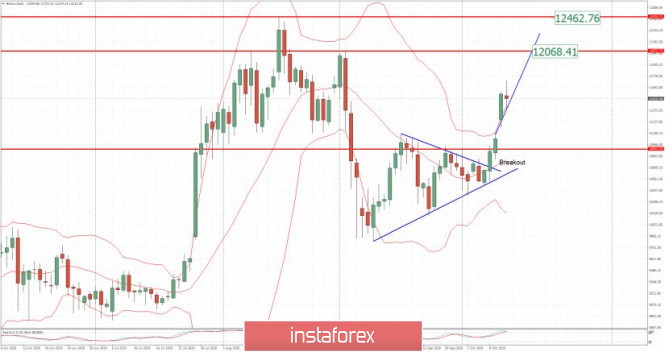
Analyzing the current trading chart of BTC. I found that our analysis from yesterday is doing good progress and that the upside breakout from symmetrical triangle was the main reason for the current rise. I would advice you to still watch for buying opportunities on the dips with targets at $12,000 and $12,400. The strong momentum kicked in and and the condition is very bullish.... Key Levels: Resistance levels: $12,070 and $12,450 Support level: $11,400 The material has been provided by InstaForex Company - www.instaforex.com |
| Posted: 13 Oct 2020 04:27 AM PDT
Knot may be a perennial hawk on the ECB board but the comments above pretty much reflects the wait-and-see approach the central bank is largely adopting currently. Further Development
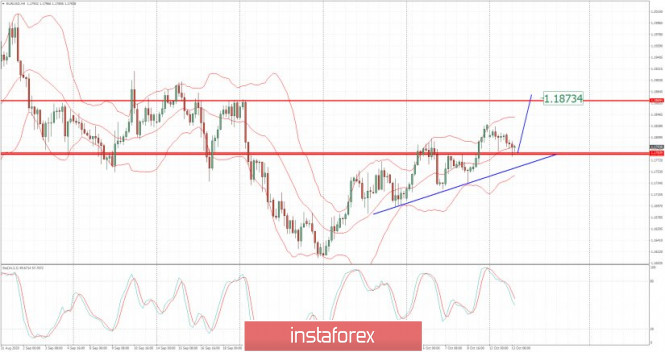
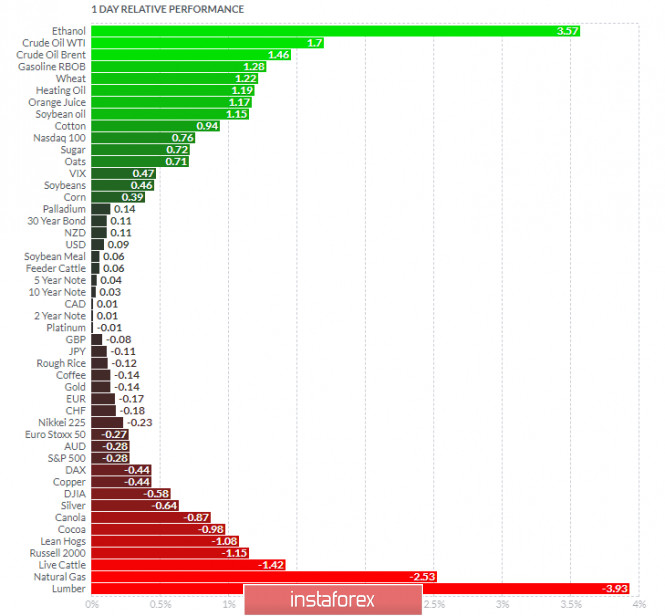
Analyzing the current trading chart of EUR. I found that there is completion of the downward correction (bull flag pattern), which is good indication for the further rise on the Gold. Additionally, there is the test-reject of the middle Bollinger band, which is another confirmation for further rise.... My advice is to watch for buying opportunities with the targets at 1,1830 and 1,1875. 1-Day relative strength performance Finviz
Based on the graph above I found that on the top of the list we got Ethanol and Crude Oil today and on the bottom Lumber and Natural Gas. EUR is slightly negative on the the list but with no evidence of any strong downside momentum. Key Levels: Resistance levels: 1,1830 and 1,1873 Support level: 1,1780 The material has been provided by InstaForex Company - www.instaforex.com |
| Posted: 13 Oct 2020 04:16 AM PDT He reinforces that there is 'strong' EU unity ahead of the European Council meeting later this week and that they will continue to work for a fair Brexit deal in the coming 'days and weeks'. I think the mention of 'weeks' says a lot about what they are expecting.
Further Development
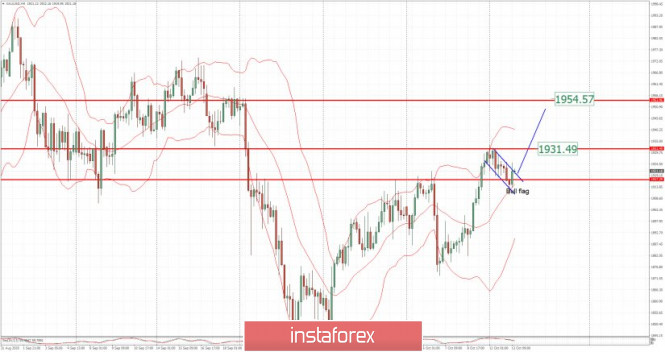
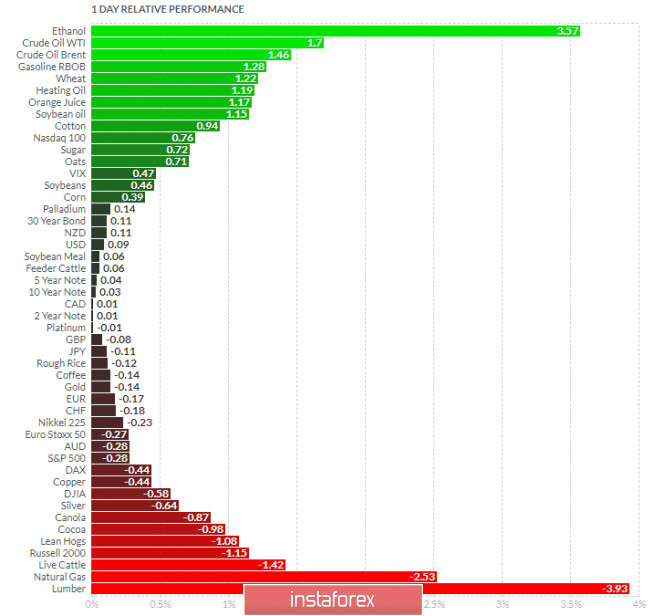
Analyzing the current trading chart of Gold, I found that there is completion of the downward correction (bull flag pattern), which is good indication for the further rise on the Gold. 1-Day relative strength performance Finviz
Based on the graph above I found that on the top of the list we got Ethanol and Crude Oil today and on the bottom Lumber and Natural Gas. Key Levels: Resistance levels: $1,931 and $1,954 Support level: $1,910 The material has been provided by InstaForex Company - www.instaforex.com |
| Will the euro become digital in the future? Posted: 13 Oct 2020 04:14 AM PDT
At a virtual meeting hosted by the International Monetary Fund, Christine Lagarde said that the ECB is taking digital Europe very seriously, saying that the closure of countries to quarantine forced people to switch to digital services, thus increasing the volume of digital payments even in countries like Italy and Germany, where they loved cash. Sales have grown by about one-fifth since February, and the statistics for this pilot period showed that significant changes have been taking place, and that digital payments are much more trusted. "We must be ready to issue the digital euro when needed," said Fabio Panetta, Italian economist and board member of the European Central Bank. The bank had previously stated that the Eurosystem - the ECB and national central banks - would decide by mid-next year whether to continue to gradually move Europe into the digital world. The Eurosystem will have to take into account serious issues such as potential cyber risks, the right to privacy and whether the Central Bank's introduction of digital currency means the possibility of obtaining confidential information about users. It will also need to examine legal aspects such as the implications of different design features, as well as the grounds for extradition. Lagarde said that the digital euro will not replace cash, but simply supplement it. Cryptocurrencies like Bitcoin or Ethereum have become popular with traders and online shoppers. According to data from CoinMarketCap.com, the total value of the crypto market has surged to about $ 360 billion this month, from about $ 175 billion in just three years. In addition, many central banks have already started trying digital payments. Just earlier this year, the People's Bank of China began its trial of the digital yuan, thereby making it the world's first central bank-backed digital currency. Even the Swedish Riksbank has been testing the electronic form of the krona for several months. Meanwhile, other major central banks, such as the Federal Reserve, Bank of Japan, and Bank of England, have taken a more sophisticated approach to introducing central bank-backed digital currencies. The material has been provided by InstaForex Company - www.instaforex.com |
| You are subscribed to email updates from Forex analysis review. To stop receiving these emails, you may unsubscribe now. | Email delivery powered by Google |
| Google, 1600 Amphitheatre Parkway, Mountain View, CA 94043, United States | |










No comments:
Post a Comment