Forex analysis review |
- EUR / USD: greenback keeps the intrigue alive
- Analytics and trading signals for beginners. How to trade the GBP/USD currency pair on October 23? Analysis of Friday's deals.
- Analytics and trading signals for beginners. How to trade the EUR/USD currency pair on October 23? Analysis of Friday's deals.
- Ichimoku cloud indicator analysis of EURUSD
- Weekly Ichimoku cloud analysis for Gold
- USDCHF at major support
- EUR/USD. PMI Indices, Hitler Factor and Dollar Vulnerability
- AmEx's quarterly profit was worse than market expectations, revenue exceeded forecasts
- Stocks rise amid encouragement in stimulus package negotiations
- How to avoid losing in the cryptocurrencies market
- Gold may have unlimited growth potential
- October 23, 2020 : EUR/USD Intraday technical analysis and trade recommendations.
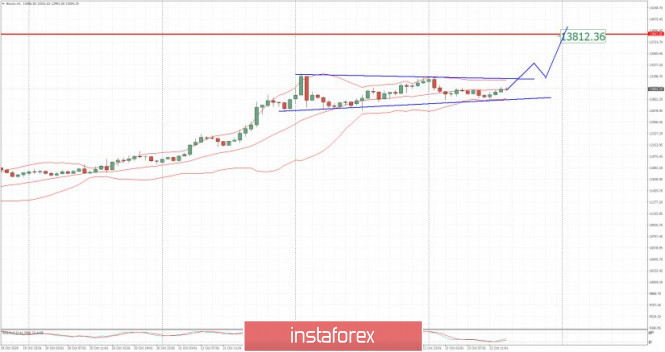
- BTC analysis for October 23,.2020 - Symmetrical triangle in creation. Watch for the breakout to confirm further direction
- October 23, 2020 : GBP/USD Intraday technical analysis and trade recommendations.
- Dollar may face 1.5% medium-term loss in Biden's victory
- October 23, 2020 : EUR/USD daily technical review and trade recommendations.
- Analysis of Gold for October 23,.2020 - Rejection of the support trendline and potential for the rally towards $1.930
- Biden's victory may lead to dollar's long-term bearish trend
- GBP/USD analysis for October 23, 2020 - Completed downside correction and bull flag pattern. Potential for rally towards
- Trading recommendations for the GBP/USD pair on October 23
- Oil price continues to decline as it fears second wave of COVID-19
- WTI oil: signs of growth and factors of decline
- EUR/USD Strongly Bullish
- Trading idea for gold
- GOLD Accumulates Bullish Energy
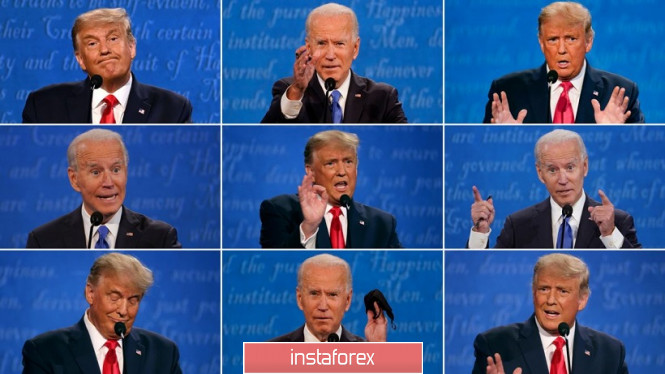
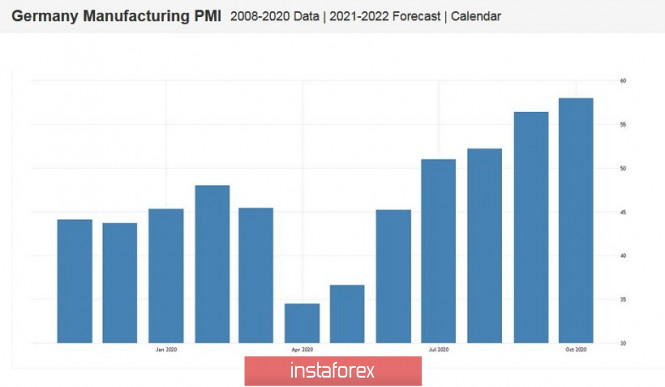
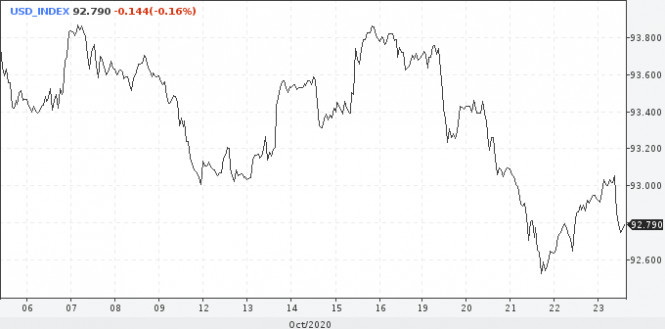
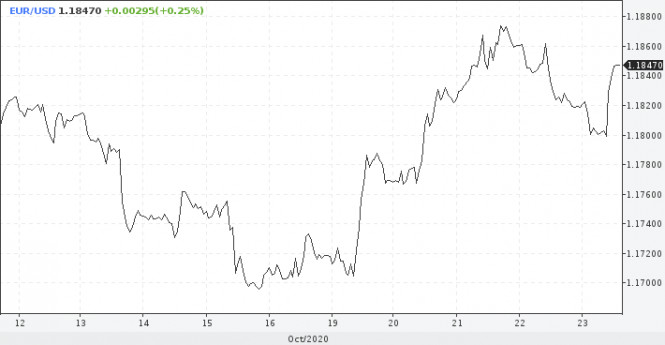
| EUR / USD: greenback keeps the intrigue alive Posted: 23 Oct 2020 08:06 AM PDT On Friday, the greenback slightly strengthened after the final election debate between Donald Trump and Joe Biden, but then came under pressure across almost the entire spectrum of the market after the release of statistical data on Germany. During the final televised debate, the current US President and the democratic candidate once again emphasized the difference in their approaches to solving the issues under discussion, seeking to enlist the support of still undecided voters. "The market reaction was quite passive but slightly shifted towards a more conservative mood," Natixis experts said. Against this background, the US Dollar rose by 0.12% but failed to develop a bullish momentum and faced strong resistance near 93.1 points. According to data released today, the PMI in the German manufacturing sector rose to 58 points against the forecast of 55 points and compared with 56.4 points recorded in September. "I am glad that the German economy shows a certain resilience. Despite the second wave of the COVID-19 pandemic, the decline in the country's services sector is still limited, " said Phil Smith, a spokesman for IHS Markit. Positive news from Germany put pressure on the greenback and helped the Euro recover after it fell 0.17% to $1.1796. On Thursday, the EUR/USD pair declined, as hopes for the early adoption of the next stimulus package in the United States somewhat weakened. Market participants are still betting on a confident victory for the Democrats in the upcoming elections and, accordingly, on a generous package of incentives. If Republicans hold the Senate, the amount of incentives will be less. The size of the stimulus may be an average value between the positions of Democrats and Republicans in the case that Trump will be re-elected and convince party members to accept additional incentives. The intrigue surrounding the potential winner of the US Presidency may continue until the very last moment and even longer, given the fact that the election results may be disputed, and the mail vote will not reveal a clear winner in key states. The electoral college will meet on December 14. While it is only a matter of time before a new US aid package is agreed on, the uncertainty surrounding the November 3 US election may force investors to withdraw some capital from the stock market. Against the background of profit-taking on shares, the EUR/USD pair will quickly fall to 1.1700. The ECB will hold its next monetary policy meeting next week. Most likely, the regulator will not lower interest rates, but may hint at the prospects for such a step in the future. The fact that the ECB may resort to aggressive measures within the next two months, especially in light of the Federal Reserve's unwillingness to adjust monetary policy, will be the basis for selling the Euro. The material has been provided by InstaForex Company - www.instaforex.com |
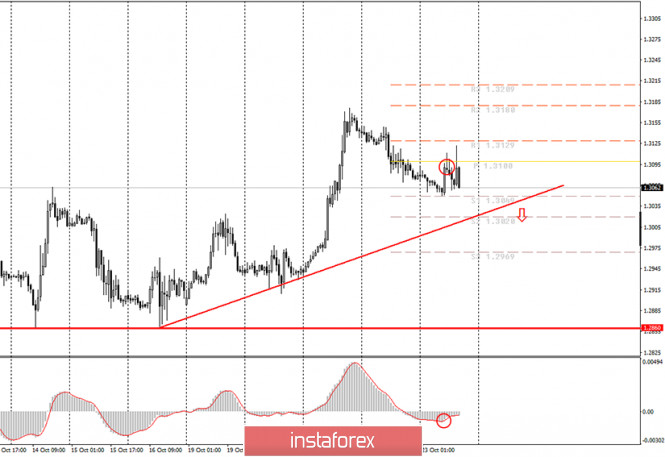
| Posted: 23 Oct 2020 07:53 AM PDT The hourly chart of the GBP/USD pair.
For the GBP/USD currency pair, trading during the day ending at this time was quite difficult. If the euro currency has clearly been corrected within the new downward trend and is also clearly trying to resume its downward movement, the pound sterling was trading in different directions during the day. Moreover, there is no clear trend for the pound/dollar pair at this time. The upward trend line is quite formal, as the price has moved very far away from it. Now, correcting for the third day in a row, it has not yet been able to reach it. Thus, formally, novice traders can expect a price rebound from this line, however, we would recommend counting on a breakout. If a rebound is made, long positions can still be considered. Also today, novice traders could open longs on a signal from the MACD, however, this had to be done in small lots, since the upward trend is ambiguous now. The fundamental background for the British currency remains an extremely important factor, although it does not always have any impact on trading. The topic of Brexit is inexhaustible and does not want to end. However, there hasn't been much news on this topic recently. For the most part, they concerned mutual accusations from London and Brussels about their unwillingness to concede in negotiations on a trade agreement. Such stubbornness on both sides leads to a drop in the chances of reaching an agreement to almost zero, which is primarily not beneficial for Britain and its pound. However, it is the pound that has become more expensive in recent days and even weeks. We believe that this is an illogical behavior of traders and the pound will resume its downward trend in the near future. As for today's macroeconomic reports, the statistics from the UK turned out to be quite strong and interesting. For example, retail sales for September exceeded forecasts and amounted to +4.7% in annual terms. The index of business activity in the service sector fell quite seriously, however, it still amounted to 52.3 points. The index of business activity in the manufacturing sector also declined, however, it exceeded forecasts and amounted to 53.3 points. Thus, in general, you can even call this statistics package quite good. However, the pound tried several times to start a new round of upward movement, however, it still fell most of the day. We believe that the fall in the pound is now justified by the fundamental background. As of October 23, the following scenarios are possible: 1) We still recommend buying the pound/dollar pair, as the upward trend is still maintained. However, we do not recommend that novice traders do this with large lots since from our point of view, the upward trend will be canceled in the near future. However, an eloquent rebound from the trend line will allow you to open long positions with targets of 1.3100 and 1.3129. 2) Sales, from our point of view, are now much more appropriate, however, you should not rush to open them until the price is fixed below the ascending trend line. In this case, the targets will be the support level of 1.2969 and 1.2860. At the same time, for the pound, it may be better to wait until Monday to assess the situation in a new way, since today's trading was extremely difficult and ambiguous. What's on the chart: Price support and resistance levels – target levels when opening purchases or sales. You can place Take Profit levels near them. Red lines – channels or trend lines that display the current trend and indicate which direction is preferable to trade now. Up/down arrows – show when you reach or overcome which obstacles you should trade up or down. MACD indicator – a histogram and a signal line, the intersection of which is a signal to enter the market. It is recommended to use it in combination with trend lines(channels, trend lines). Important speeches and reports (always included in the news calendar) can greatly influence the movement of the currency pair. Therefore, during their exit, it is recommended to trade as carefully as possible or exit the market to avoid a sharp reversal of the price against the previous movement. Beginners in the Forex market should remember that every trade cannot be profitable. The development of a clear strategy and money management is the key to success in trading over a long period. The material has been provided by InstaForex Company - www.instaforex.com |
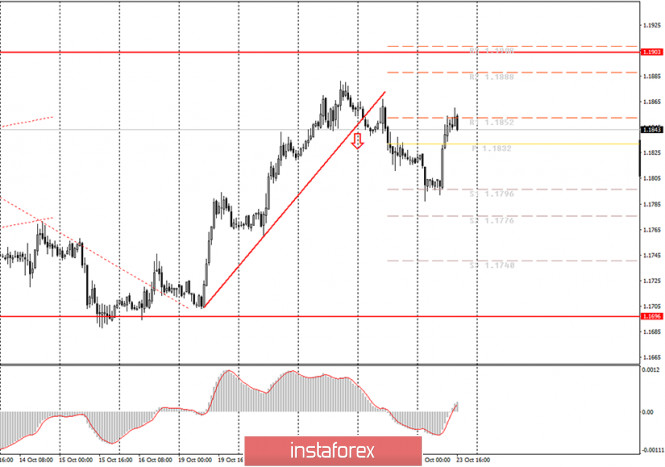
| Posted: 23 Oct 2020 07:53 AM PDT The hourly chart of the EUR/USD pair.
The EUR/USD currency pair was trading higher for most of the day on Friday, October 23. This is exactly what we talked about this morning. The pair needed to adjust to resume the downward movement later. Likely, a downward trend has also formed now, as the quotes once again failed to overcome the level of 1.1900 over the past three months, which is still the upper limit of the side channel. An eloquent downward turn was made on the way to this level. Thus, the trend is now characterized by a downward trend. Therefore, a new reversal of the MACD indicator down, which may happen in the next few hours, can be regarded as a signal for sales. In general, we have repeatedly drawn the attention of novice traders to the fact that the euro/dollar pair continues to trade mainly inside the side channel. Thus, if the upper line could not be overcome, respectively, there is a high probability of going down to the lower border of this channel. Therefore, we expect a drop to the level of 1.1696. On Friday, there was once again very little important news in the European Union and America. Last night, the final round of debates between President Donald Trump and presidential candidate Joe Biden took place in the United States. That night, the US dollar rose by about 30 points, however, it began to fall sharply against the euro in the morning. We can only highlight the indices of business activity in the service sectors of the European Union and some of its countries. For example, in Germany, business activity in the service sector declined further to 48.9 points. Recall that any value below 50.0 is considered negative and means a decline in the sector. In the European Union as a whole, the indicator of business activity in the service sector and the composite index went below the 50-point mark. Thus, the European indicator of business activity is declining faster than the German and only the service sector is declining. This is not surprising. It is the service sector that is suffering the most from the pandemic and the restrictions imposed by governments to contain the spread of the virus. What is remarkable here is the fact that business activity is falling, which means that the EU economy itself should be expected to shrink or slow down. But in the United States, all three business activity indices remain above the mark of 50.0, so the American economy has nothing to worry about yet if only these indicators are taken into account. Unemployment is falling. Thus, although the virus continues to spread in America, business activity overseas is still in order. Accordingly, the strengthening of the US currency to 1.1700 becomes even more likely. On October 23, the following scenarios are possible: 1) Purchases of the EUR/USD pair have ceased to be relevant at the moment since the price is fixed below the ascending trend line. The previous local maximum (1.1867) price also failed to breakthrough today. Thus, it is recommended for novice traders to resume trading for an increase after the formation of a new upward trend or the refraction of a downward one, which is still not expected during the current day. 2) Novice traders are recommended to trade on the downside. The pair corrected during the day, and the MACD indicator was discharged, so you can expect a sell signal from the MACD today. In this case, we recommend opening new short positions with targets of 1.1796 and 1.1776. What is on the chart: Price support and resistance levels – target levels when opening purchases or sales. You can place Take Profit levels near them. Red lines – channels or trend lines that display the current trend and indicate which direction is preferable to trade now. Up/down arrows – show when you reach or overcome which obstacles you should trade up or down. MACD indicator(14,22,3) – a histogram and a signal line, the intersection of which is a signal to enter the market. It is recommended to use it in combination with trend lines (channels, trend lines). Important speeches and reports (always included in the news calendar) can greatly influence the movement of the currency pair. Therefore, during their exit, it is recommended to trade as carefully as possible or exit the market to avoid a sharp reversal of the price against the previous movement. Beginners in the Forex market should remember that every trade cannot be profitable. The development of a clear strategy and money management is the key to success in trading over a long period. The material has been provided by InstaForex Company - www.instaforex.com |
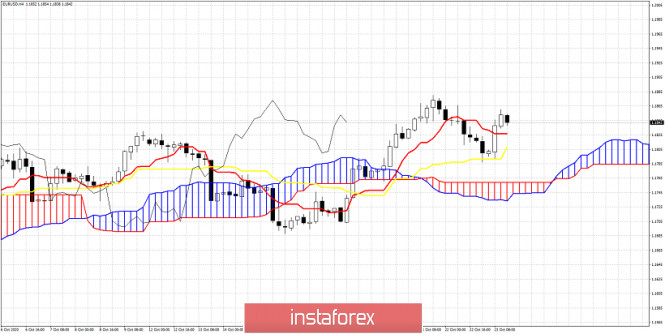
| Ichimoku cloud indicator analysis of EURUSD Posted: 23 Oct 2020 07:11 AM PDT Today we use the Ichimoku cloud indicator in order to identify key short-term support and resistance levels. What will be the target if price breaks any key short-term support level? EURUSD price is currently in a bullish trend as the Ichimoku cloud indicator indicates in the 4 hour chart.
|
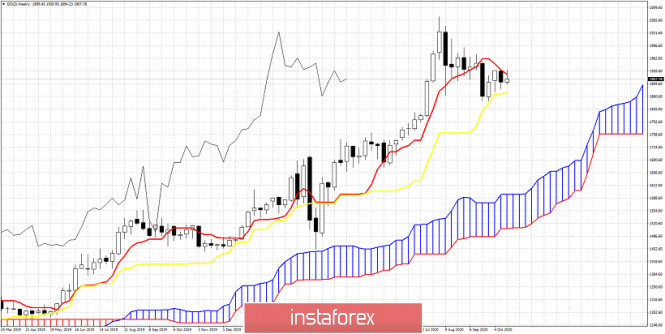
| Weekly Ichimoku cloud analysis for Gold Posted: 23 Oct 2020 07:04 AM PDT Gold price is trapped between the kijun-sen and the tenkan-sen indicators. Although longer-term trend in Ichimoku cloud terms remains bullish, there are some worrying signs that a bigger pull back could unfold until the end of the year.
|
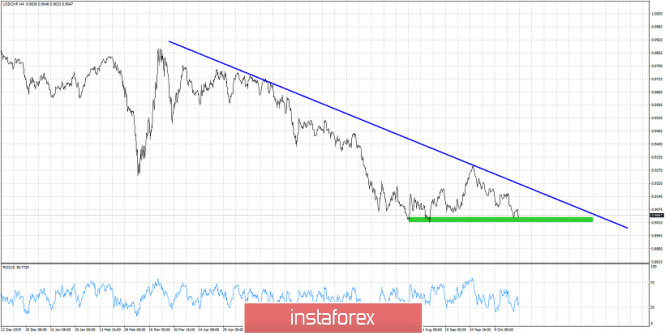
| Posted: 23 Oct 2020 06:59 AM PDT USDCHF is trading at 0.9050 for the third time the last three months. Last time USDCHF was at current levels, price reversed trend and made a bounce all the way to 0.93. Longer-term trend remains bearish as price continues to make lower lows and lower highs since April of 2019.
Blue line - resistance trend line USDCHF remains in a bearish trend as long as price is below the blue trend line resistance. If the green support area fails to hold then we should expect USDCHF to remain under pressure and make a move towards 0.89 at least. If price manages and breaks above the blue trend line then we should expect the September high at 0.93 to be broken. Any bounce towards the blue trend line resistance is seen as a chance to sell again, specially if price breaks the green support area. The material has been provided by InstaForex Company - www.instaforex.com |
| EUR/USD. PMI Indices, Hitler Factor and Dollar Vulnerability Posted: 23 Oct 2020 06:11 AM PDT The euro-dollar pair is again stuck in a flat. The downward impulse organized by the bears of the EUR/USD failed as soon as it started. Despite the general weakness of the euro against the background of the second wave of the coronavirus pandemic, the dollar looks even weaker amid political uncertainty in the US. The last election debate between Trump and Biden, which took place during the Asian session on Friday, did not help the greenback. The preliminary results of the TV debate left more questions than answers. Therefore, dollar bulls are disoriented, and this fact is reflected in all key dollar pairs. The euro, in turn, received a small, but, importantly, unexpected support from macroeconomic reports. Some PMI indices came out better than expected, surprising traders and experts. All of America for several weeks has been waiting for the last pre-election debate between the main rivals in the presidential election. Let me remind you that the September TV debate was won by Joe Biden - according to various opinion polls, he looked more convincing and "truthful" for 60-70% of American TV viewers. The results of this battle were reflected in the ratings of the Democrat: Biden increased the gap from Trump to 11%. That is why the final televised debate was so important for the incumbent. If he had failed the verbal confrontation this time too, the Democratic leader would have widened the gap, celebrating an early victory. But the reality turned out to be somewhat different: according to a number of experts, Biden made a serious mistake, which could cost him dearly.
The fact is that during the debate, Biden mentioned Adolf Hitler. And according to estimates of many viewers (who otherwise support Biden), he did it incorrectly and out of place. So, in disputes with Trump about North Korea, the current US President said that he had good relations with the head of the DPRK Kim Jong-un. To this Biden replied that "... it's like saying that we had a good relationship with Hitler before he started the war in Europe." According to the FOX NEWS television channel (which, however, is close to the Republicans), many viewers criticized the former US vice-president, saying that Washington did not have "good relations" with Hitler on the eve of World War II. In general, Trump behaved more restrained and more decisive than Biden, so the overall superiority of the latter according to the results of the first polls is small - he was preferred by 53% of respondents. All of this suggests that the incumbent can close the gap in national polls. This scenario is not positive for the dollar. After all, if at the end of the election there is no clear winner, Trump will fight for every vote, appealing the results of the "mail vote" in court. By the way, the market again began to recall the events of 20 years ago, when the confrontation between Bush Jr. and Gore lasted more than a month after the elections (the US Supreme Court put an end to this confrontation). Such prospects put background pressure on the US dollar. However, the euro, as mentioned above, received little support from macroeconomic statistics. The October PMI indices in leading European countries was released on Friday, which was mostly in the "green zone". The exception was France, where all indicators showed a significant decline. Germany's index of business activity in the manufacturing sector unexpectedly turned out to be better than expected, rising immediately to 58 points (while the forecast of growth to 56.1 points). The indicator has risen consistently for the sixth consecutive month, reflecting production expansion. The pan-European index of business activity in the manufacturing sector also showed positive dynamics, being in the "green zone". In other words, despite the coronavirus anti-records, the manufacturing sector remains optimistic. Although, the same cannot be said about the services sector - the PMI indices here were disappointing. But this result was very predictable since it is the service sector that is most vulnerable against the background of tightening quarantine restrictions in European countries.
Thus, the latest political events in the USA and European macroeconomic reports were able to at least extinguish the downward impulse for the EUR/USD pair. Buyers returned the points they had lost on Thursday, and the dollar once again demonstrated its vulnerability. On the other hand, the EUR/USD bulls still cannot gain a foothold above the 1.1850 resistance level. This requires a news impulse (negative for the dollar), which will allow traders not only to break through the resistance level but also to settle higher, in the range of 1.1850-1.1900. Until then, longs look risky - especially on the last trading day of the week. But in general, in the medium term, the pair retains its upside potential not only to the borders of the 19th figure but also to the next resistance levels 1.1950 and 1.2000. The material has been provided by InstaForex Company - www.instaforex.com |
| AmEx's quarterly profit was worse than market expectations, revenue exceeded forecasts Posted: 23 Oct 2020 06:01 AM PDT
One of the leaders of the American market of plastic cards American Express (AmEx) said that its net profit in July-September 2020 decreased by 39% and amounted to $ 1.07 billion, or $ 1.3 per share, compared to $ 1.76 billion , or $ 2.08 per share, a year earlier. Experts gave forecasts at $ 1.34 per share. The revenue of the financial company fell by 20% to $ 8.75 billion due to a decrease in card spending compared to the third quarter of last year amid the COVID-19 pandemic. The consensus revenue forecast was $ 8.66 billion. In the past quarter, AmEx allocated $ 665 million to provisions for possible loan losses. Whereas last year this amount was $ 879 million. The company's current strategy is correct, even as revenue declines as a result of the coronavirus pandemic, said Stephen Squarey, chief executive of AmEx. There is also a positive trend in the volume of card spending in comparison with April this year. AmEx shares lost 2.8% in preliminary trading on Friday. Since the beginning of the year, the company's capitalization has dropped 15.8%, while the Dow Jones Industrial Average has dropped 0.6% over the period. The material has been provided by InstaForex Company - www.instaforex.com |
| Stocks rise amid encouragement in stimulus package negotiations Posted: 23 Oct 2020 05:22 AM PDT
Asian stock exchanges mostly traded in the green zone on Friday. The good mood was transmitted from across the ocean. Thus, US and European stock exchanges also show strong growth. The main positive point is related to the progress of the negotiation process on the adoption of new financial incentives in the US. The urgent issue seems to have moved forward, which means that its final solution is not far off. The same opinion is shared by House Speaker Nancy Pelosi, who said that an agreement is about to be reached. One thing is clear now: the parties are tired of being in a state of uncertainty and want to end this issue once and for all. Japan's Nikkei 225 index was up 0.36% in the morning. Statistics for the country also remained without much negative. For example, the level of consumer prices for the first month of autumn did not change, which is already good against the background of the overall growth of this indicator in the world. The level of consumer prices, excluding fresh products, decreased by 0.3%, while the previous drop was 0.4%. Initial forecasts estimated an increase of 0.1% and 0.4%, respectively. China's Shanghai Composite Index fell 0.33%. In contrast, the Hong Kong Hang Seng Index rose 0.5%. South Korea's KOSPI Index rose 0.34%. Australia's S&P/ASX 200 index showed a slight decline of 0.1%. At the same time, the PMI indicator in the country's services sector for the second month of autumn has already become larger and reached 53.8 points. Recall that its previous value was 50.8 points. It is noteworthy that the growth of the indicator is recorded for the second time in a row, which indicates a fairly rapid increase in activity in this area of the economy. A steady rise was also observed in the major stock indexes of the European stock markets. The positive factor is also in light of the progress in the negotiation of the adoption of the stimulus package in the US. In addition, optimism is growing on the back of good quarterly reports from the banking sector and car manufacturing sector. The general index of large enterprises in the European region Stoxx Europe 600 rose 0.8%, which allowed it to move to a new level of 363.17 points. The UK FTSE 100 Index is up 1.17%. The German DAX index went up 0.94%. France's CAC 40 jumped 1.3%, making it the top gainer by morning. Italy's FTSE MIB Index rose 1.17%. Spain's IBEX 35 Index climbed 1.23%. To date, the second wave of the coronavirus pandemic is the most negative constraint on growth. The spread of the disease is so rapid that the pressure on stock markets is also inevitably growing. The epidemiological situation is particularly serious in Europe. New restrictive measures may further undermine the region's economy, which has not recovered from the effects of the pandemic last spring. Statistical data on changes in the region's economy is another confirmation of this. The composite PMI index of the European region has already fallen to the lowest levels in the last four months, and this, according to analysts, is far from its final reduction. This month alone, the indicator has already reached the level of 49.4, which was previously at 50.4 points. Initial forecasts estimated a reduction to 49.3 which almost coincided with the real figures. The PMI indicator in the services sector of the region also declined to 46.2 points, compared to the previous value of 48 points. It should be noted that the negative dynamics is recorded for the second time in a row, which becomes an indicator of the worsening crisis. Meanwhile, the PMI index in the eurozone industrial sector, on the contrary, managed to rise from 53.7 points to 54.4 points. And this is its most significant growth over the past two years. Initial forecasts estimated a decrease in the indicator to 53.1 points. The material has been provided by InstaForex Company - www.instaforex.com |
| How to avoid losing in the cryptocurrencies market Posted: 23 Oct 2020 05:08 AM PDT
Through cryptocurrencies, people can earn by trading, mining and investing. However, it should be noted right away that each of these options has very high risks of defeat, not only because of high volatility, but also because of the risks of fraud. Because of this, it is rather important to be careful when trading in the market, and this can be done only by minimizing the risk. For example, on the topic of mining, BitCluster founder, Sergey Arestov, notes that it is not magic at all, but a real business. Therefore, it is quite logical to expect both a victory and a grandiose failure. And, as with any business, reliable partners are key to efficiency. Cryptocurrency mining involves the purchase and maintenance of equipment or hardware, as well as the rental of premises. Each stage in this segment carries certain risks. For example, the equipment may be of poor quality or broken. Arestov defined a number of rules to help avoid losses:
How about investing? Here, too, there is an arsenal of "chips" that any successful investor must not neglect. Investing is generally recognized as one of the most understandable ways to make money on cryptocurrency. The main thing here is to understand that simply buying any cryptocurrency in order to make a profit is not enough. High volatility and many projects reduce the chances of income, mainly because miscalculation is very possible. For example, you could wrongly invest in coins that may not grow or simply depreciate. Nikolay Klenov, an analyst at the Raison Asset Management, gave advice on how to make an effective investment. First, it is better to diversify, or, more simply, not to single out any one asset: be it Bitcoin or Ethereum. It is important to form your investment portfolio, consisting of different cryptocurrencies. Second, it is necessary to manage risks, that is, to control the volume of entering a position, to limit losses (stop losses). Here, it is important for an investor to immediately determine what part of his own funds he is ready to lose. Loss of an investment portfolio by 20-30% is quite normal and not at all fatal, but if the portfolio "drawdown" reached 50-70%, then this is already a problem (it is extremely difficult to win back such a position) ... Third, you need to invest long-term. With cryptocurrencies, investing for 3-5 years or more is the most sane decision. Speculation or scalping in this area is likely to fail. Fourth, it's better to keep your finger on the pulse all the time - to study assets and the market itself. And lastly, trading. There is nothing to do without some knowledge on it and experience. Trading classic assets is extremely difficult and not always justified. It many risks failures, griefs and unfulfilled hopes, because in just one day, the market can grow and fall by tens of percent. Therefore, the liquidation of positions on crypto-exchanges for hundreds of millions of dollars is not a rare occurrence. So, minimizing risks is possible when trading on any type of market. However, learning risk management is very much advisable, as such allows you to reduce the possibility of losing your deposit. Vladislav Antonov, an analyst at IAC Alpari, advises to, first of all, identify the risk for the transaction and, as in the case of investing, be prepared for certain risks. The material has been provided by InstaForex Company - www.instaforex.com |
| Gold may have unlimited growth potential Posted: 23 Oct 2020 04:42 AM PDT
Each new crisis leads to an increase in the already gigantic debt. The current coronavirus crisis has proven this again. To support the economy and the lives of citizens, printed money comes to help. This has already become the rule. Governments cannot imagine life without printing money. How long will it last? And to what level will the price of gold rise? At present, welfare in society is no longer created through pure economic activity. The world seems to have reached its limit of growth. It all began in 1971 when the US abolished the Gold Standard. Since then, money supply and economic growth have been independent from each other. World debt is only expanding every year. And the value of gold is growing by about 7% every year due to the depreciation of paper currencies. They are losing their purchasing power due to the unprecedented printing of new bills. The global debt has reached gigantic proportions, which it seems impossible to repay. There is an urgent need to change the monetary system, but who cares if it is much easier to start printing? On the other hand, if politicians come to their senses and try to smooth out the negative aspects of the financial and economic structure, other problems may occur. Economic interests will be more important than civil rights and freedom. This may lead to an imbalance, division of society and, sooner or later, chaos. Gold has always been in high demand. It is the most reliable asset today. Gold is hard to manipulate, unlike statistics of unemployment and interest rates. In nearly every country in the world, central banks hold large reserves of gold. When the world drowns in debt, gold will be the only means of survival. Therefore, there is no doubt that gold will continue to rise. The price of gold has a negative correlation to paper money. When the value of paper currencies plunges to zero, the precious metal can become increasingly valuable. Meanwhile, gold futures for December delivery rose by 0.14% to trade at $1,907.35 per troy ounce. Silver lost 0.07% to settle at $24.727 per troy ounce, while copper price decreased by 0.60% to hit $3.1458 per pound as well. The US Dollar Index Futures, which measures the US dollar against a basket of six major currencies, grew by 0.10% to trade at $93.055. The material has been provided by InstaForex Company - www.instaforex.com |
| October 23, 2020 : EUR/USD Intraday technical analysis and trade recommendations. Posted: 23 Oct 2020 04:38 AM PDT
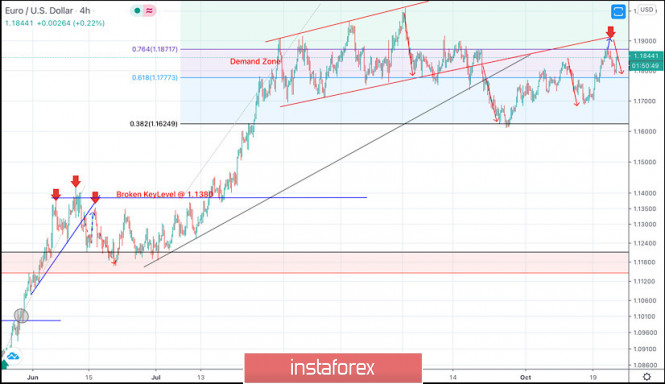
In July, the EURUSD pair has failed to maintain bearish momentum strong enough to move below 1.1150 (consolidation range lower zone). Instead, bullish breakout above 1.1380-1.1400 has lead to a quick bullish spike directly towards 1.1750 which failed to offer sufficient bearish pressure. Bullish persistence above 1.1700 - 1.1760 favored further bullish advancement towards 1.1975 - 1.2000 ( upper limit of the technical channel ) which constituted a Solid SUPPLY-Zone offering bearish pressure. Moreover, Intraday traders should have noticed the recent bearish closure below 1.1700. This indicates bearish domination on the short-term. On the other hand, the EURUSD pair has failed to maintain sufficient bearish momentum below 1.1750. Instead, another bullish breakout was being demonstrated towards 1.1870. As mentioned in previous articles, the price zone of 1.1870-1.1900 stands as a solid SUPPLY Zone corresponding to the backside of the broken channel if bullish pullback occurs again soon. The material has been provided by InstaForex Company - www.instaforex.com |
| Posted: 23 Oct 2020 04:37 AM PDT Further Development
Analyzing the current trading chart of BTC, I found that there is consolidation and the symmetrical triangle in creation based on the 1H time-frame. Stochastic just came out from oversold zone and there is the fresh bull cross, which is another sign for the fuhrer rise.... Key Levels: Resistances: $13,190 Support levels: $12,850 The material has been provided by InstaForex Company - www.instaforex.com |
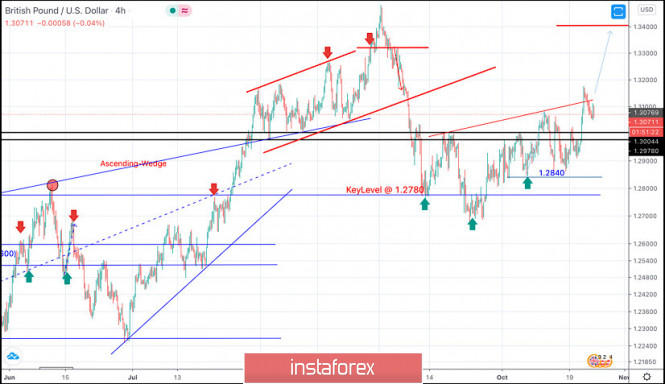
| October 23, 2020 : GBP/USD Intraday technical analysis and trade recommendations. Posted: 23 Oct 2020 04:37 AM PDT
Intermediate-term technical outlook for the GBP/USD pair has remained bullish since bullish persistence was achieved above 1.2780 (Depicted Key-Level) on the H4 Charts. However, On September 1, the GBPUSD pair looked overbought after such quick bullish movement while approaching the price level of 1.3475. That's why, short-term bearish reversal was expected especially after bearish persistence was achieved below the newly-established key-level of 1.3300. A quick bearish decline took place towards 1.2780 where considerable bullish rejection brought the pair back towards 1.3000 and 1.3100 during the past few weeks. The current price zone of 1.3130-1.3150 (the depicted trend line) remains an Intraday Key-Zone to determine the next destination of the GBPUSD Pair. Bullish Persistence above the mentioned price zone of 1.3100-1.3150 will probably allow bullish pullback to pursue towards 1.3400 as a final projection target for the suggested bullish pattern. Otherwise, another bearish movement may be expressed towards the price level of 1.2840 where bullish SUPPORT exists. The material has been provided by InstaForex Company - www.instaforex.com |
| Dollar may face 1.5% medium-term loss in Biden's victory Posted: 23 Oct 2020 04:36 AM PDT
Pre-election uncertainty continues to cover the markets. Despite of the final debate between Joe Biden and Donald Trump, the situation did not become clearer. Indeed, Biden leads in polls, but previous experience does not allow investors to be at least a little confident in these estimates. In the last election, Trump's opponent, Hillary Clinton, was the clear favorite. However, the finals results turned out to favor Trump. Later it became known that some preliminary results were incorrect due to the fact that many people did not want to openly show support for Trump because of his eccentric statements. No one can say for sure that the same thing is happening now. At present, market players seem to avoid making explicit bets on one outcome or another. As a result, this causes moderate pressure on the US markets. We see a downward trend in the stock markets and on the dollar, which has been going down in the last four weeks. These trends may increase immediately before the election, as well as at the time of the first results. An increase in volatility is inevitable. On Thursday, the dollar index recovered as part of a correction. The reason was the escalated disagreements in the US Congress over the adoption of the fiscal aid package. It is more likely that support measures will not be taken before the election. However, by Friday, the greenback has lost its achievements and seems to be aiming at new lows.
The negative trend in the dollar was further strengthened by the publication of macroeconomic statistics for Germany. The country's economy continues to recover steadily after lockdowns. The manufacturing PMI soared in October to a 2.5-year peak of 58.00 against September's 56.4. the services sector looks the weakest. However, despite the decline, the indicator still exceeded market expectations. Greenback risks losing about 1.5%, or even 3% of its value in the medium-term. This scenario will favor the euro. The main currency pair may rise to new annual highs above 1.20.
The renewed decline in the USD index on Friday is also associated with speculations about the future state aid to the US economy. Investors' attention is still focused on the negotiation process. House Speaker Nancy Pelosi and US Treasury Secretary Steven Mnuchin continue to discuss the amount of the package. The material has been provided by InstaForex Company - www.instaforex.com |
| October 23, 2020 : EUR/USD daily technical review and trade recommendations. Posted: 23 Oct 2020 04:34 AM PDT
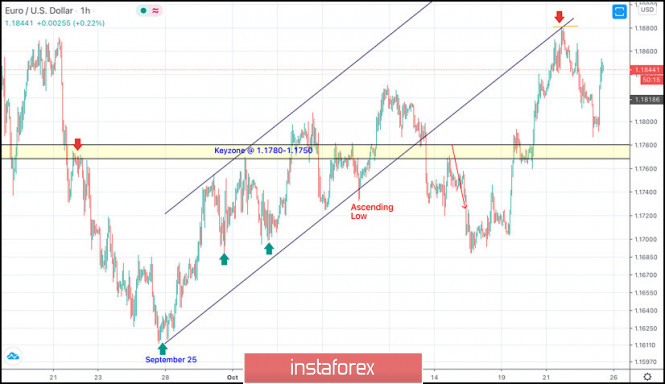
On September 25, The EURUSD pair has failed to maintain enough bearish momentum to enhance further bearish decline. Instead, recent ascending movement has been demonstrates within the depicted movement channel leading to bullish advancement towards 1.1750-1.1780 which failed to offer sufficient bearish pressure in the first attempt. Last week, temporary breakout above 1.1750 was demonstrated as an indicator for a possible bullish continuation towards 1.1880 where the upper limit of the movement channel comes to meet the pair. However, temporary downside pressure pushed the EUR/USD pair towards 1.1700. This is where the previous bullish spike was initiated. Currently, the price zone around 1.1880-1.1900 constitutes a KEY Price-Zone as it corresponds to the backside of the depicted broken ascending channel. The recent Upside breakout above 1.1780 enabled further advancement towards the price levels around 1.1880-1.1900 where bearish pressure and a reversal Head & Shoulders pattern were demonstrated. Trade Recommendations :- Earlier This Week, A valid SELL Entry was anticipated upon the recent upside movement towards 1.1880. Suggested Bearish target around 1.1780 was almost reached by the end of Yesterday. The material has been provided by InstaForex Company - www.instaforex.com |
| Posted: 23 Oct 2020 04:28 AM PDT Latest data released by Markit - 23 October 2020Prior 53.7
The readings here fit with the narrative with what we have seen from the German and French readings - more so the former - earlier in the past 45 minutes. It reaffirms a two-paced 'recovery', where the manufacturing sector is keeping more resilient overall while the services sector momentum continues to fade into Q4.
Further Development
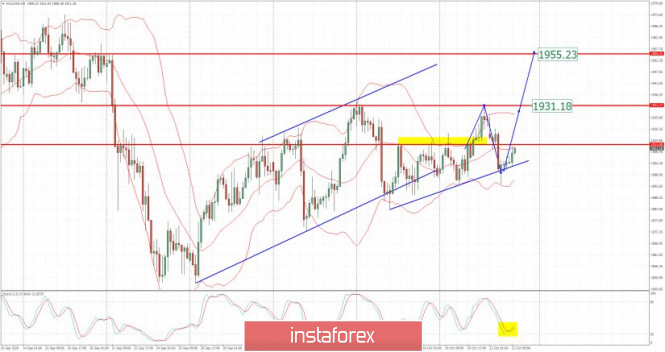
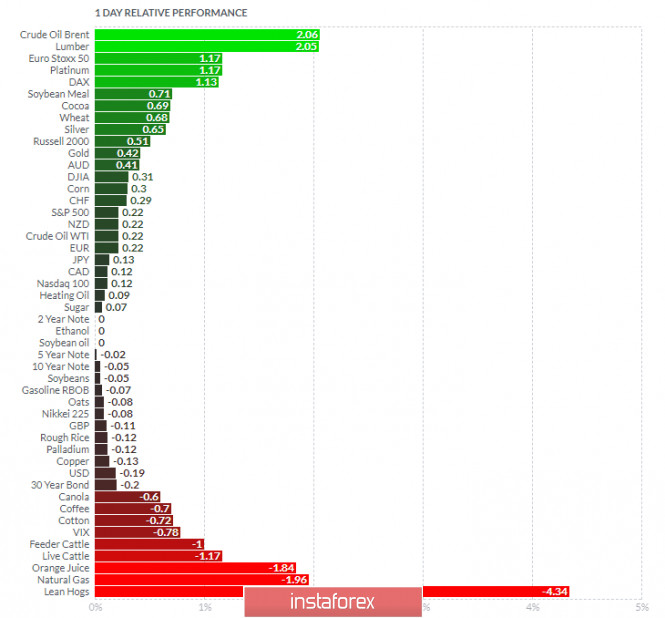
Analyzing the current trading chart of Gold, I found that there is potential completion of the downside corretion, which is sign for further rise. I would watch for buying opportunities with the targets at $1,931 and $1,955. Stochastic just came out from oversold zone and there is the fresh bull cross, which is another sign for the furher rise.... 1-Day relative strength performance Finviz
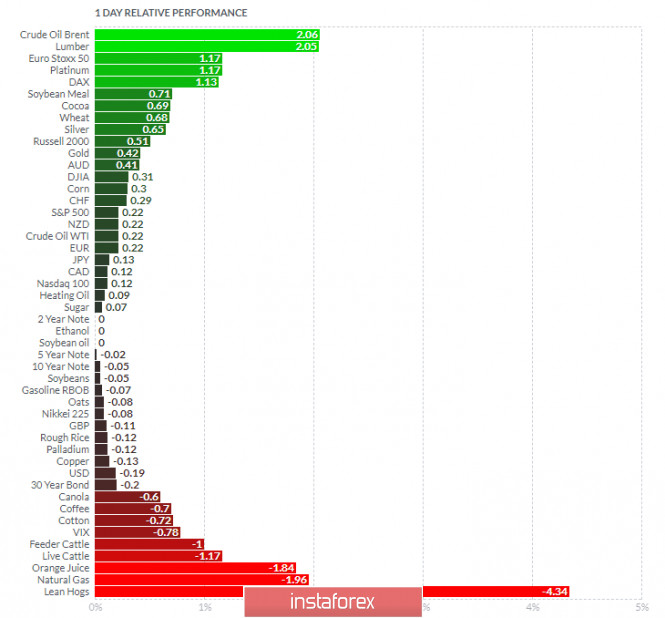
Based on the graph above I found that on the top of the list we got Crude Oil and Lumber today and on the bottom Natural Gas and Lean Hogs. Key Levels: Resistances: $1,931 and $1,955. Support levels: $1,894 The material has been provided by InstaForex Company - www.instaforex.com |
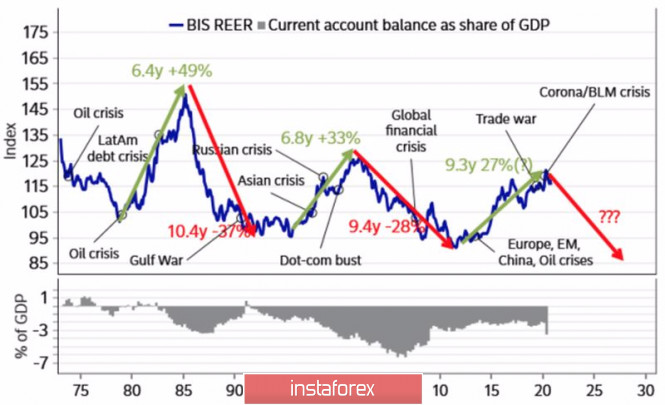
| Biden's victory may lead to dollar's long-term bearish trend Posted: 23 Oct 2020 04:27 AM PDT While the entire market was burying the seemingly falling euro, the EUR / USD bulls stood up and responded powerfully seriously counting on a correction to $1.15-1.16. At first, it looked like an accident amid the fall of the S&P 500 and the increase in the number of COVID-19 cases in Europe to record highs. Nevertheless, strong data on German business activity in the manufacturing sector, which soared to its highest level in the last 2.5 years, put everything in its place. The leader of the European economy is not going to lose heart because of the pandemic, and if so, then it is premature to talk about divergences in the monetary policy of the Fed and the ECB and in economic growth in favor of the US dollar. The higher Joe Biden's rating rises, the worse the situation turns out for the greenback. The dollar is sold for several reasons. First, the "blue wave" will lead to a large-scale fiscal stimulus, money will need to be borrowed somewhere, and the growth of foreign demand for increased volumes of bond issues is possible only in two cases: with a weak currency, and at high real rates of the debt market. The Fed will not allow the latter. Second, the degree of protectionism under Biden is likely to decrease, which will improve the state of international trade, create a tailwind for the export-oriented economy of the eurozone and lead to an increase in the double US deficit, which will negatively affect the dollar. Trends in the real trade-weighted dollar rate and the US current account:
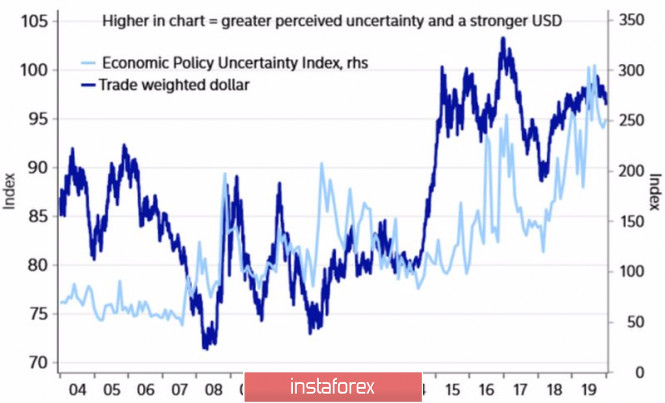
Finally, an unconditional victory of the Democrats in the elections will significantly reduce political uncertainty, thus depriving the dollar of an important trump card - the demand for safe-haven assets. Dynamics of the global uncertainty index and the trade-weighted US dollar exchange rate:
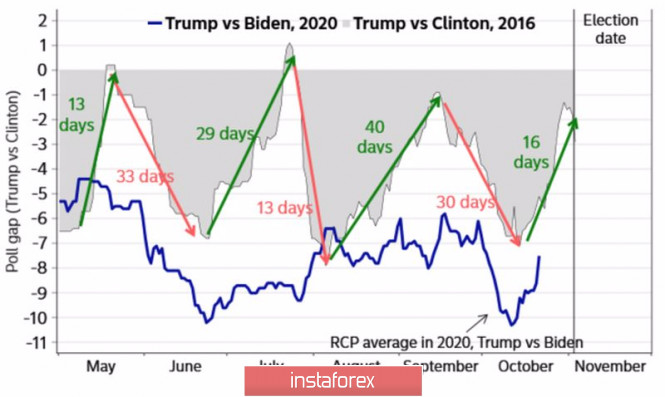
Thus, the long-term prospects of the dollar look bearish, and at the slightest sign of positive from Germany and the Eurozone, investors are happy to buy EUR / USD, which was demonstrated by the week to 23 October. At the end of the second month of spring, traders' attention will be focused on the release of data on US and German GDP for the third quarter, on the ECB meeting, on the negotiations between Democrats and Republicans on the fiscal stimulus, Brexit, as well as the ratings of Donald Trump and Joe Biden. Trump has recouped his lag a little, while current events have a lot in common with 2016, which forces us to take into account the risks of an unexpected Republican victory. Dynamics of ratings of Trump and his rivals:
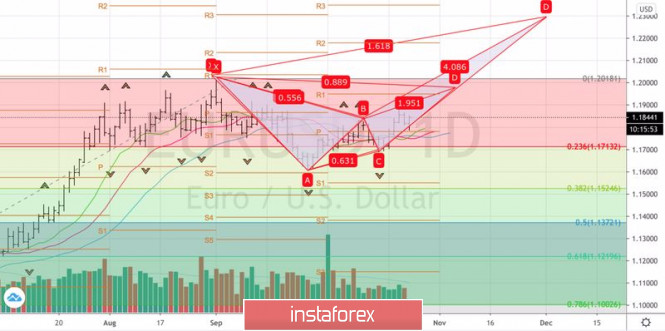
If Trump can maintain his seat, the markets will be shaken to the core, which is likely to result in a collapse in the S&P 500 and a strengthening of the US dollar. In this regard, EUR / USD bulls need to be doubly careful and use stop orders. Technically, a breakout by the main currency pair of resistances at 1.1865 and 1.189 will be a signal for opening long positions and will increase the risks of target realization by 88.6% and 161.8% according to the "Bat" and "Crab" harmonic trading patterns. They are located near 1.197 and 1.229. EUR / USD daily chart:
|
| Posted: 23 Oct 2020 04:21 AM PDT UK's Truss: If EU won't do a Brexit deal, we will go to Australia terms
For those confused by the terminology, Australia terms simply means a no-deal outcome. This mainly reaffirms the UK's stance ahead of talks once again. As things stand, the supposed deadline will be the end of the transition period i.e. 31 December but given how many times we've been down this road before, it is hard to take that at face value. Further Development
Analyzing the current trading chart of GBP, I found that there is potential completion of the Intraday ABC downside correction, which is good sign for further rise.... 1-Day relative strength performance Finviz
Based on the graph above I found that on the top of the list we got Crude Oil and Lumber today and on the bottom Natural Gas and Lean Hogs. Key Levels: Resistance: 1,3150, 1,3180 Support levels: 1,3050 The material has been provided by InstaForex Company - www.instaforex.com |
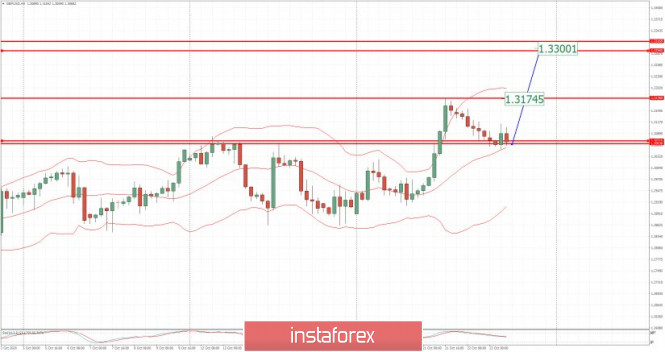
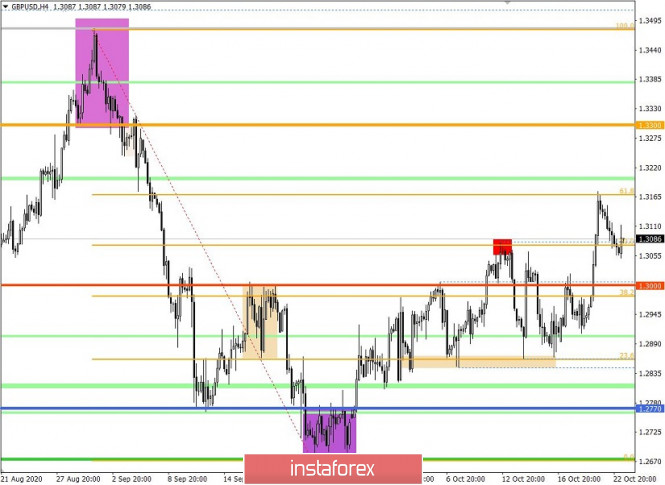
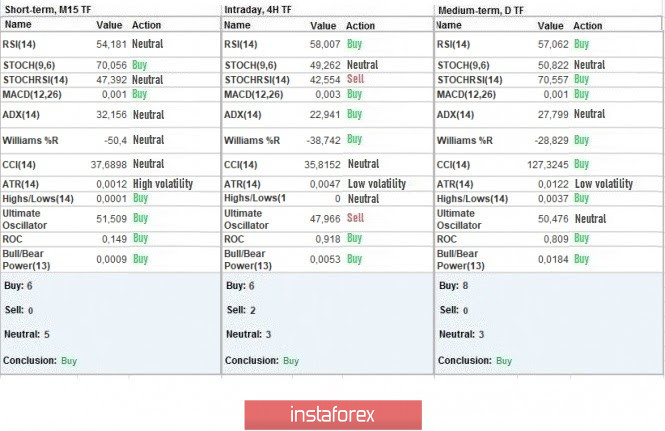
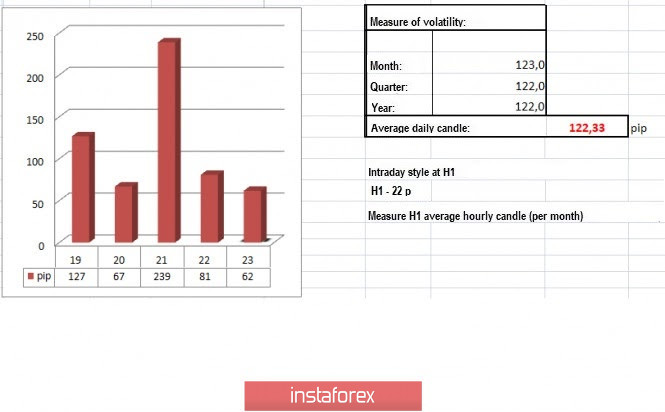
| Trading recommendations for the GBP/USD pair on October 23 Posted: 23 Oct 2020 04:18 AM PDT The GBP / USD pair, after rising sharply on October 21, reached the local high of 1.3175, relative to which a correction arose, which returned the overheated quote to the level of 1.3080. This technical correction is exactly what the pound needs amid its overbought status, because if we look at the dynamics, we will see that the market is not really active, and that it was speculation that drove the pound into rising. Should we expect a new local high soon? Probably. Speculators have already set the pace that no one is confused anymore why the pound is rising despite many problems in the UK. The market will remain in control of speculative positions, to which information noise will become a lever for. So, if we look at the M15 chart and analyze the trades set up yesterday, we will see that the main trading volume fell during the European session, so as a result, a low activity of only 81 points was recorded. To add to that, as discussed in the previous review, traders were already waiting for a technical correction towards 1.3080, which really happened in the market. With regard to news, a rather good data was published on the US labor market, and this is a decrease in jobless claims. According to the report, repeated applications decreased from 10,018,000 to 9,397,000, while initial applications fell from 898,000 to 840,000. This recovery in the US labor market had a positive effect on the US dollar. Meanwhile, today, data on UK retail sales was released, the figure of which grew from 2.7% to 4.7%, against the forecast of 3.7%. This growth in consumer activity had a positive effect on the British pound. However, after that, preliminary data in UK business activity was published, which indicated a decline in the indicators. Services PMI: Prev - 56.1 ---> Forecast - 52.3 Manufacturing PMI: Prev - 54.1 ---> Forecast - 53.3 In the afternoon, a similar data for the United States will be published, but here, the forecasts are practically the same as their previous levels. Services PMI: Prev - 54.6 ---> Forecast - 54.6 Manufacturing PMI: Prev - 53.2 ---> Forecast - 53.4 The upcoming trading week highlights data for Europe and the United States. However, the market, as before, will focus more on the information background, particularly on hot topics such as the coronavirus, Brexit and the US elections Monday, October 26 US 15:00 - New Home Sales (September) Tuesday, October 27 US 13:30 - Orders for durable goods (September) Thursday, October 29 US 13:30 - Claims for unemployment benefits US 13:30 - Preliminary GDP (Q3) EU 13:45 - ECB meeting and press conference Further development As we can see on the daily chart, activity surged in the GBP / USD pair during the European session, which led to a local move towards 1.3100. However, after that, price returned again to its previous level. If the quote continues to concentrate at the level of 1.3080, a short-term flat may occur on the pair. But if it consolidates below 1.3055, the pound will move down to the psychological level of 1.3000. Indicator analysis Looking at the different sectors of time frames (TF), we can see that the indicators on the minute and hourly periods signal BUY due to the quote stopping at the local high, whereas the daily period is signaling BUY because of the general upward move of the British pound in the market. Weekly volatility / Volatility measurement: Month; Quarter; Year Volatility is measured relative to the average daily fluctuations, which are calculated every Month / Quarter / Year. (The dynamics for today is calculated, all while taking into account the time this article is published) Volatility is currently at 62 points, which is 49% below the average level. It is presumed that speculative activity will again appear in the market, and, after a slight slowdown, an acceleration above 100 points will occur. Key levels Resistance zones: 1.3200; 1.3300 **; 1.3600; 1.3850; 1.4000 ***; 1.4350 **. Support Zones: 1.3000 ***; 1.2770 **; 1.2620; 1.2500; 1.2350 **; 1.2250; 1.2150 **; 1.2000 *** (1.1957); 1.1850; 1.1660; 1.1450 (1.1411). * Periodic level ** Range level *** Psychological level Also check the trading recommendations for the EUR/USD pair here, or brief trading recommendations for the GBP/USD pair here. The material has been provided by InstaForex Company - www.instaforex.com |
| Oil price continues to decline as it fears second wave of COVID-19 Posted: 23 Oct 2020 03:56 AM PDT It was shown in the trading data that oil's price this morning adhered to the dynamics yesterday and continues to decline on growing concerns about the recovery of demand in connection with the second wave of COVID-19. Thus, the price of December futures for Brent crude oil declined by 0.12% and reached $42.41 per barrel, while December futures for WTI oil declined by 0.12% and stopped at $40.59 per barrel. It was expected that investors' negativity is associated with the second wave of pandemic globally. The quarantine restrictions around the world clearly provoke a sharp decline in the demand of oil. And unfortunately, the media around the world only report alarming news: France recently recorded a daily growth in their COVID-19 cases, which was then followed by a few US states. Although the main reason is the coronavirus, it is not the only one. The negative dynamics in the black gold market have been certainly outlined for a long time. For example, the US Department of Energy explained the growing decline of gasoline reserves in the country in their statement, which decline by 1.9 million barrels last week with a forecasted decline of 1.6 million barrels. According to the Ministry of Energy, the demand for gasoline in the United States declined by 290 thousand barrels per day during the past week. Perhaps, the data on such an impressive decline in gasoline consumption for oil prices was more shocking than concerns about the negative impact of the second wave of COVID-19 on consumer behavior. But that's not all. The market is particularly concerned about the news which includes the recovery of oil production in Libya. Recently, Former Prime Minister of Libya, Ahmed Maiteeq, said that the extraction of black gold in the country has already reached 500 thousand barrels per day, and Libya plans to produce 1 million barrels of oil per day by the end of 2020. In addition, the general negative mood of investors is strengthened by the vague hope of agreeing on a stimulus package for the US economy, without which the US economy will not recover in the wave of COVID-19. The material has been provided by InstaForex Company - www.instaforex.com |
| WTI oil: signs of growth and factors of decline Posted: 23 Oct 2020 03:48 AM PDT
The WTI crude oil traded successfully on Thursday after showing rapid growth which closed the price level at $40.61 per barrel. This happened upon the encouragement of the negotiation process for the adoption of new financial incentives in the US. Recall that the main task of this program is to support all organizations and households that have suffered from the crisis that occurred against the background of the coronavirus pandemic. The adoption of incentives has been expected for a long time, this is an extremely acute and fundamental issue for the current US President Donald Trump. Any progress in the negotiation process has a positive impact on the mood of market participants. Thus, the words of House Speaker, Nancy Pelosi, that the warring parties are very close to reaching a consensus, gave due support. However, until now, a number of experts remain firm to their previous assumptions that it will not be possible to conclude a deal before the US presidential election. Nevertheless, they argue that recent events will still contribute to the early ratification of the painful bill. Meanwhile, another important aspect affecting the stock market continues to deteriorate. The epidemiological situation in the US is getting worse. Over the past day, the number of cases in the country has increased by 60,000 cases at once. Now, the total number of cases already amounts to 8.2 million since the pandemic started. Some parts of Asia, on the other hand, shows that they are already on the path of active recovery from the consequences of COVID-19. This somehow positively affected the oil market. Among the countries which are leading on the records are India and China, which reflected an increase in key indicators in their economy. This, in turn, may be the starting point for the recovery of global demand for crude oil and petroleum products in the sector. Another factor for growth is Russia's temporary delay in increasing crude oil production. Recall that earlier it was reported that the country will increase the level of extraction of raw materials immediately after the new year. According to new data, this process has been postponed indefinitely until the market situation stabilizes. Nevertheless, some analysts still believe that in the medium and long term, the growth potential of the cost of crude oil will remain extremely limited. The reason for this will be the rapid drop in demand for gasoline and other petroleum products. Already this week, statistics on the level of gasoline stocks in the US turned out to be very negative. Gasoline inventories rose 1.9 million barrels. Restrictive quarantine measures by no means contribute to the normalization of this indicator, but only exacerbate the situation. All of the above, however, is more likely evidence that the cost of WTI crude oil will remain under pressure, but this will not prevent it from storming the highest weekly mark of $42 per barrel in the near future. The material has been provided by InstaForex Company - www.instaforex.com |
| Posted: 23 Oct 2020 03:34 AM PDT
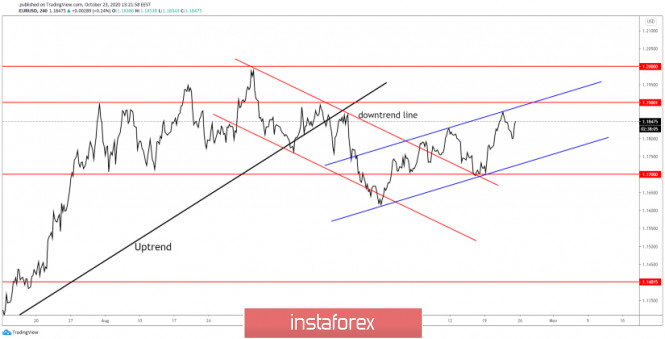
EUR/USD is traded at 1.1846 level and it seems strong enough to reach new highs soon. I've told you in my previous analysis that the pair should climb higher again after retesting the 1.17 psychological level and the former downtrend line. The pair is growing within an up channel, so the bias will remain bullish, EUR/USD could increase further as long as the price is located within this channel. An upside breakout above the channel's upside line and above 1.19 suggest buying again as the pair will continue to increase.
EUR/USD has decreased a little after reaching the channel's upside line, but this could be only a temporary decline before the price will reach another high. So, a further increase followed by a breakout above the 1.19 level and above the upside line brings us a buying opportunity. An upside breakout could signal an aggressive and quick rally, growth in the short term. 1.2 psychological level is seen as the first upward target. Passing above this upside obstacle will really validate a broader upside movement. The material has been provided by InstaForex Company - www.instaforex.com |
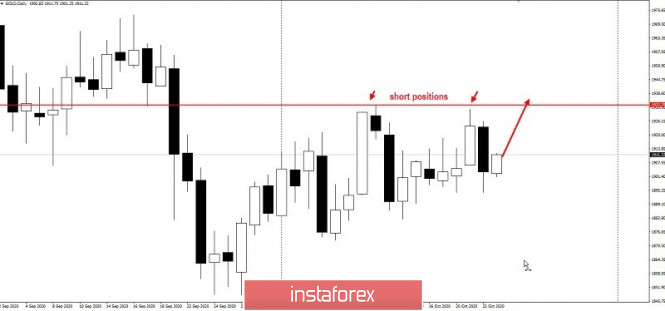
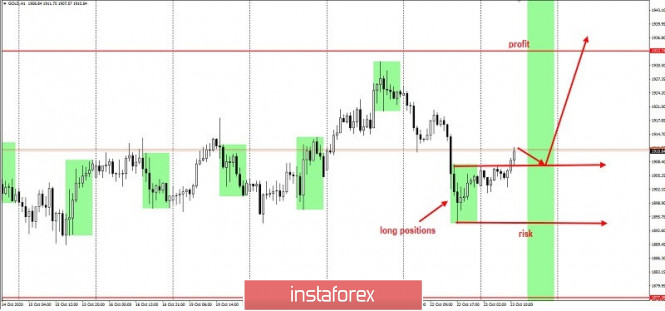
| Posted: 23 Oct 2020 03:13 AM PDT Although yesterday, gold closed a level lower than we expected, our bullish trading idea for the medium-term is not canceled. The target profit remains at the price level of 1933. In that regard, we could still follow the direction of our earlier technique: As we can see on the chart, the quotes have formed an ABC pattern, in which "A" is the impulse recorded yesterday during the US session. Therefore, from the current prices, long positions may still be set up to 1933. However, it would be inadvisable if the quote moves down 1894. The risk/reward ratio of such a transaction is 1.5 to 1. Good luck! The material has been provided by InstaForex Company - www.instaforex.com |
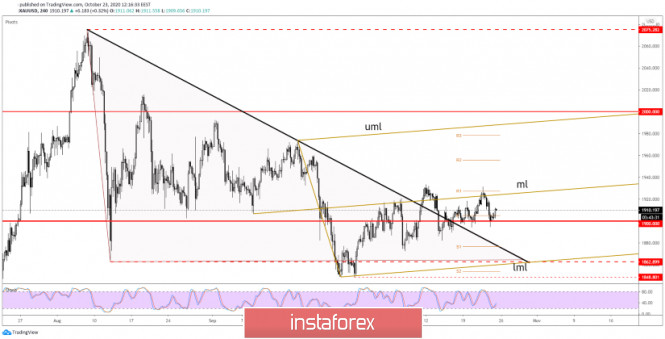
| GOLD Accumulates Bullish Energy Posted: 23 Oct 2020 02:55 AM PDT XAU/USD has declined again in the short term as the USDX has registered a temporary rebound. The price is still located in the buyer's territory, so further growth is favored. More bulls will step into the game if the rate will jump above the $1,931 former high. Today, the manufacturing and services data should bring life to the gold price as well. I believe that the yellow metal will resume its upwards movement if the USDX continues to drop.
Technically, the price of gold is expected to grow after escaping from an ascending triangle. The rate has tested and retested the $1,900 psychological level confirming it a strong support area. Though, only a valid breakout above the median line (ml) of the ascending pitchfork will validate the swing higher. Unfortunately, the upside is still uncertain, the median line (ml) represents strong dynamic resistance. We may have an upside breakout if the rate continues to stay near the median line (ml).
Today, we'll talk about a long trading opportunity. A bullish closure above the $1,931 former high will suggest buying as the price of gold will resume its upwards movement. The $2,000 could be used as an upside target, only a valid breakout above it will signal further growth. You should be careful because a drop under the $1,894 immediate low indicates a drop towards the $1,862 in the short term. The material has been provided by InstaForex Company - www.instaforex.com |
| You are subscribed to email updates from Forex analysis review. To stop receiving these emails, you may unsubscribe now. | Email delivery powered by Google |
| Google, 1600 Amphitheatre Parkway, Mountain View, CA 94043, United States | |











No comments:
Post a Comment