
Forex analysis review |
- Hot forecast and trading signals for GBP/USD on October 29. COT report. Results of next round of Brexit talks to be announced
- Hot forecast and trading signals for EUR/USD on October 29. COT report. Traders await US Q3 GDP and ECB meeting results
- Oil #CL — bulls can't, bears don't want to
- Overview of the GBP/USD pair. October 29. The pound started a new downward trend amid the futility of negotiations on a free
- Overview of the EUR/USD pair. October 29. Donald Trump has embarked on a plan "B". New "coronavirus" anti-records in the
- Ichimoku cloud indicator Daily analysis of EURUSD
- NZDUSD rejection signs at major resistance
- USDCAD bullish divergence confirmed and price has now bounced higher towards our target
- Gold price rejection at cloud resistance
- GBP/USD. Ups and downs of the pound: Brexit get on traders' nerves
- EUR / USD. Euro falls amid simultaneous lockdowns but there is no need to rush to sales
- October 28, 2020 : EUR/USD daily technical review and trade recommendations.
- October 28, 2020 : EUR/USD Intraday technical analysis and trade recommendations.
- October 28, 2020 : GBP/USD Intraday technical analysis and trade recommendations.
- What to expect from ECB and EUR?
- EUR/USD: markets hit by a wave of pessimism
- Oil prices are doomed: the worst period is just beginning
- Evening review of EURUSD on October 28, 2020
- Greenback may rise in the event of a stock market crash
- Trump vows best stimulus package, while Biden to support Belarusians and Tikhanovskaya
- US stock market fluctuates due to coronavirus and upcoming US elections
- Puma Quarterly Profits Up 13%
- GBP/USD: plan for the American session on October 28 (analysis of morning deals)
- BTC analysis for October 28,.2020 - Upside target at the price of $13.840 has been reached. Potential for the downside rotation
- EUR/USD: plan for the American session on October 28 (analysis of morning deals)
| Posted: 28 Oct 2020 06:07 PM PDT GBP/USD 1H The GBP/USD currency pair also fell for most of the day on Wednesday, October 28, and it managed to gain a foothold below the Senkou Span B line and nearly reached the support level of 1.2897. However, on the way to this level, it went up and began a rather rapid pullback, within which it returned to the Senkou Span B line and the 1.3004-1.3024 area. A price rebound from this area and line can provoke a new round of downward movement and can be regarded as a specific sell signal. Therefore, in spite of the fact that the quotes left the descending channel earlier, the downward trend, as we see, has not been canceled and is still present. In general, we continue to believe that the pair has much more chances to continue the downward movement than vice versa. GBP/USD 15M Both linear regression channels turned to the downside on the 15-minute timeframe, which reflects the previous day's trend. The downward movement could return while the pair stays below the Senkou Span B line. COT report The new Commitments of Traders (COT) report for the pound showed that non-commercial traders were quite active during October 13 to 19. However, at the same time, the last few reports have completely made the situation complicated. The "non-commercial" group of traders opened 4,485 Buy-contracts (longs) and closed 4,072 Sell-contracts (shorts). Thus, the net position of professional traders immediately grew by 8,500 contracts, which is quite a lot for the pound. However, the problem is that non-commercial traders have been building up their net position (strengthening the bullish sentiment) over the past few weeks, and before that they have reduced their net position for several weeks (strengthening the bearish sentiment). Thus, over the past months, professional players have not even been able to decide in which direction to trade. The fundamental background continues to be very difficult and ambiguous for the pound/dollar pair, which is why the trades are so confusing. The pound sterling lost approximately 110 points during the reporting period. And the net positions of commercial and non-commercial traders are now practically zero. In other words, both the most important and largest groups of traders have approximately the same number of Buy and Sell contracts open. Naturally, such data from the COT report does not allow any conclusions, either short-term or long-term. The fundamental background for GBP/USD remained unchanged on Wednesday. Moreover, similar to the euro/dollar pair's case, there was not a single event that could affect the pair's movement and the mood during the day. Nevertheless, the trades were quite active. Traders may receive information from negotiations between London and Brussels regarding the trade deal, since the end of the next round is scheduled for today. Perhaps this topic can really affect the pound/dollar pair. All other topics are now only background in nature. In addition, the US is set to release data on GDP for the third quarter and is expected to grow by 31%. While this is not the same as the 31% loss in the second quarter, if this figure is confirmed, then it will be safe to say that the American economy is recovering very well. And this can even be credited to US President Donald Trump, who did not allow the country to be closed for a second lockdown. But at what cost... In addition, reports on applications for unemployment benefits, as well as an index of personal consumption expenditures, will be published. However, these data are of secondary importance under current conditions. We have two trading ideas for October 29: 1) Buyers for the pound/dollar pair failed to stay above the Senkou Span B line. Thus, the initiative is now not in their hands. You are advised to consider long positions in case the price settles above the Senkou Span B and Kijun-sen lines while aiming for the resistance area of 1.3160-1.3184. Take Profit in this case will be up to 70 points. 2) Sellers continue to pull down the pair and have broken the Senkou Span B line (1.3018) and the support area of 1.3004-1.3024. A correction is currently taking place, but in case the price rebounds from the 1.3004-1.3024 area, we recommend considering options for opening new sell orders while aiming for the support level of 1.2897. Take Profit in this case can be up to 80 points. Hot forecast and trading signals for EUR/USD Explanations for illustrations: Support and Resistance Levels are the levels that serve as targets when buying or selling the pair. You can place Take Profit near these levels. Kijun-sen and Senkou Span B lines are lines of the Ichimoku indicator transferred to the hourly timeframe from the 4-hour one. Support and resistance areas are areas from which the price has repeatedly rebounded off. Yellow lines are trend lines, trend channels and any other technical patterns. Indicator 1 on the COT charts is the size of the net position of each category of traders. Indicator 2 on the COT charts is the size of the net position for the "non-commercial" group. The material has been provided by InstaForex Company - www.instaforex.com |
| Posted: 28 Oct 2020 06:06 PM PDT EUR/USD 1H The euro/dollar pair suddenly moved down on the hourly timeframe on Wednesday, October 28, easily crossing the Kijun-sen and Senkou Span B lines and also went below the descending channel. No macroeconomic report published for the day and not a single important event took place. Nevertheless, market participants found reasons for a new round of buy positions on the dollar. It was within the same horizontal channel of $1.17-1.19. Take note that the pair reached the lower line of this channel almost perfectly, thus, we can now expect an upward reversal and gradual growth to the upper channel line, that is, to the area of the 1.1900 level. The technical picture remained practically unchanged even after the pair lost 160 points. Globally, traders have the same flat at their disposal, but they still have to catch short-term trends on the hourly chart. EUR/USD 15M Both linear regression channels turned to the downside on the 15-minute timeframe, which is eloquent evidence of the current trend on the hourly chart and indicates that there are no signs of completing the downward movement. COT report. The EUR/USD pair fell by around 40 points during the last reporting week (October 13-19). But in general, no significant price changes have been observed for the pair in recent months. Therefore, data from any Commitment of Traders (COT) report can only be used for long-term forecasting. The new COT report showed even fewer changes in the mood of professional traders than the previous one. Non-commercial traders, who, we recall, are the most important group of traders in the foreign exchange market, opened 1,081 Buy-contracts (longs) and 673 Sell-contracts (shorts). Take note that the "non-commercial" group decreased its net position in the last two weeks, which may indicate the end of the upward trend. However, the data provided by the latest COT report does not tell us anything at all. There are no changes, since non-commercial traders have opened almost 300,000 euro contracts. Thus, opening or closing of 1,000-2.000 contracts does not indicate anything. The lines of net positions of the "non-commercial" and "commercial" groups (upper indicator, green and red lines) continue to barely narrow, while the pair itself continues to trade in a horizontal channel. Therefore, we stick to our opinion - the upward trend is completed or is about to be completed, and the high reached near the 1.2000 level may remain the peak of this trend. No macroeconomic report from both the US and the EU on Wednesday, and not a single important event at all. The big picture is systematically approaching Election Day and now it is generally impossible to say what factors market participants would base their trades in. Although, perhaps, we do not need to look for factors, because they do not exist. As we have mentioned many times, the foreign exchange market is not only about speculators who aim to make money. They are also commercial companies, central banks, which have completely different goals. Thus, the current strengthening of the dollar (within the same horizontal channel of 1.17-1.19) may not mean anything fundamentally. By and large, the pair lost only 160 points in a week, and before that it had risen in price by the same amount. Thus, we would not panic and make hasty conclusions since the quotes lost 60 points. The European Central Bank will hold a meeting today. Traders do not expect the ECB to change any parameters of monetary policy, thus, most likely, the meeting will turn out to be of passing. In addition, there will be quite important macroeconomic publications in America, like GDP for the third quarter. Hot forecast and trading signals for GBP/USD We have two trading ideas for October 29: 1) The EUR/USD pair moved down. Therefore, buyers are advised to try to resume trading upward while aiming for the resistance area of 1.1887-1.1912 and the 1.1926 level, but not before the quotes settle above the descending channel. Take Profit in this case can be up to 70 points. The 1.1887-1.1912 and 1.1900-1.1920 areas are extremely strong and bulls will unlikely be able to overcome them in the current environment. 2) Bears were active yesterday and they managed to pull down the pair by a significant distance. Therefore, sellers are advised to reopen short positions with a target on the support area of 1.1692-1.1699, if an eloquent sell signal is generated, for example, if the price rebounds from the Senkou Span B line (1.1784). Take Profit in this case can be up to 70 points. Explanations for illustrations: Support and Resistance Levels are the levels that serve as targets when buying or selling the pair. You can place Take Profit near these levels. Kijun-sen and Senkou Span B lines are lines of the Ichimoku indicator transferred to the hourly timeframe from the 4-hour one. Support and resistance areas are areas from which the price has repeatedly rebounded off. Yellow lines are trend lines, trend channels and any other technical patterns. Indicator 1 on the COT charts is the size of the net position of each category of traders. Indicator 2 on the COT charts is the size of the net position for the "non-commercial" group. The material has been provided by InstaForex Company - www.instaforex.com |
| Oil #CL — bulls can't, bears don't want to Posted: 28 Oct 2020 05:20 PM PDT The second wave of COVID-19 again put oil prices at risk of decline. However, is there a danger that the dramatic events that took place in the oil market in the spring of 2020 will repeat and oil will collapse to the values of $20 and below? What will happen in the oil market if Joe Biden wins the US election? Let's try to figure it out in this article. The second wave of coronavirus infection has covered the world economy, and the incidence rate in the developed world is now even higher than it was in the spring. With the sole exception of China whose restoration is proceeding at a fast pace. However, in other countries, the recovery is not so fast, since many industries, such as tourism or international air transport, have either virtually ceased to exist or the size of the business has significantly decreased during the pandemic era. The epidemic has not yet been brought under control. However, measures to restrict and close the economy, which many governments have taken this spring, have not been applied now. Widespread blocking and compensation for business losses turned out to be too expensive. Accordingly, the impact of these measures on oil prices is now offset by more lenient quarantine conditions. Thanks to the OPEC+ agreement and the recovery of the global economy in the summer of 2020, oil prices have experienced growth, and commercial reserves in the United States have significantly decreased, although they still exceed their average volumes (Figure 1).
Figure 1: Commercial oil reserves in the United States Even though in the past two years, China has started actively trading oil for the yuan, the price of black gold is still determined in US dollars and on US exchanges, and the behavior of traders in WTI futures contracts determines the dynamics of oil prices around the world. If we consider the situation in the context of supply and demand on futures exchanges, Open Interest in futures contracts is currently at the lowest values since the summer of 2016 and amounts to 2.5 million contracts. At the peak of futures demand, in April 2020, the OI was equal to 3.3 million contracts, which together with the OPEC+ deal allowed the price to grow from a level close to zero to the current values. Now the situation is qualitatively different. Paradoxically, speculators are the main driving force of the price. If speculators do not see prospects for growth, they will not put their money on it. At the same time, since the summer of this year, the total long positions of speculators on the WTI oil futures market, which has the #CL designation in Instaforex terminals, amount to about 350 thousand contracts. At the peak of demand in June, their value was 381 thousand, now the positions of speculators are 332 thousand. However, even for a deep decline in the oil price, the conditions on the futures market in the current situation are not enough. Speculators do not try to push oil down and reduce their sales, which means that they do not see any opportunities to reduce the price yet. Everything, of course, can be in our turbulent times, but oil prices look at the moment as if the bulls can't, and the bears don't want to.
Figure 2: medium-term technical picture of Light Sweet Crude Oil #CL The daily time looks at the situation from the perspective of one month to one quarter, and oil traders should take this factor into account when making decisions. As shown in chart 2, starting from June, #CL oil quotes are clamped in the range of $ 35.50 - $ 44.50 with a width of 9 dollars. Since September, the range has narrowed to $ 4, which fully reflects the current uncertainty in the market. In this situation, the only strategy that can be used by traders in the stock signals trading system will be purchasing from bottom to top of the range and sales from the top end of the range to the lower limit. Among other things, the range is a factor in reducing volatility, which can increase sharply when the price breaks out of the range. The middle of the range will continue to function as support or resistance, depending on which direction the momentum is directed. The difficulty is that being in the range, the price often makes false breakouts outside its borders. However, careful observation of false movements can provide a great opportunity for a trader to work in the opposite direction of a false breakout. Detecting and identifying false breakouts and traps requires special training and experience from the trader, so novice traders should refrain from using this trading strategy, which does not prevent them from carefully observing and studying it for further application. With the US election just one week away, there is a perception in the markets that if Joe Biden wins the presidential race, it will be negative for oil. However, not everything is so simple. Biden does advocate limiting the use of hydraulic fracturing on federal lands, but if he wins, this will primarily put pressure on the American oil industry. According to some estimates, Biden's victory will cost 1 million barrels of reduced production in the United States, which is an undoubted positive for the oil market, since in this case, the US share will be received by oil companies from Russia and Saudi Arabia. In conditions of high uncertainty, traders need to be extremely careful not to open positions with increased risks. On the contrary, the risks should be reduced, not increased. Be careful, follow the rules of money management. The material has been provided by InstaForex Company - www.instaforex.com |
| Posted: 28 Oct 2020 05:19 PM PDT 4-hour timeframe
Technical details: Higher linear regression channel: direction - downward. Lower linear regression channel: direction - upward. Moving average (20; smoothed) - downward. CCI: -119.4899 The British pound sterling paired with the US currency on Wednesday also began a fairly strong downward movement, however, it has a completely different meaning than the fall of the euro/dollar pair. The fact is that the euro/dollar pair continues to "sit" tightly in the side channel, which can not be said about the pound/dollar pair. If for the EUR/USD pair the fundamental background is more in favor of the euro, then in the GBP/USD pair the fundamental background is more in favor of the US currency. Therefore, yesterday's fall in the British currency may not just be a drop of a hundred points, but the beginning of a new downward trend. The fact is that in America now the main negative is associated with uncertainty. Uncertainty in the life of the country after November 3 or, better to say, after January 20, 2021. Until it becomes clear who will be the new president, the US currency is unlikely to be in high demand. However, in the case of the UK, the problems are purely macroeconomic. And these problems are serious. We will not list again all the possible problems that the British economy may face in 2021. Let's just say that there can be a lot of these troubles. Therefore, we continue to believe that the pound will continue to fall in the long term. As for the most important topic for the British pound, the topic of Brexit and negotiations on a trade agreement, no new information was received during the third trading day of the week. It was stated that the next round of negotiations will last until at least Thursday, so if we expect any positive information, it will be during today. However, to be honest, despite the "positive rumors" and statements of some top officials of the EU countries, there is still little chance of reaching an agreement between London and Brussels. Yes, the negotiations are ongoing, but they have been going on for more than 6 months. During these six months, has there been a single communication concerning the sections of the document where the Europeans and the British managed to reach a consensus? Everyone talks only about those issues in which it is impossible to come to a common opinion and nothing changes here. Therefore, today we may receive another batch of "optimistic" news that Michel Barnier and David Frost again failed to agree with each other. Also on Wednesday, Charles Michel, President of the European Council, gave an interview to a British tabloid. He said that the negotiations are entering the most important phase, however, he is not at all sure that a deal with Boris Johnson is possible within the next two weeks (remaining until the next deadline of the British Prime Minister). Also, Charles Michel did not tell the markets anything important, limiting himself to general phrases. Thus, the British pound still has no place to wait for support. Even technical factors are currently against it. The pound has risen quite strongly against the dollar in the past six months, as well as in recent weeks. Given the fact that the state of the UK economy is not much better than the US, we do not believe that such a strong growth of the pound is fully justified. But even if it is justified, there must be a downward correction. Also, as part of the upward movement in recent weeks, the price has worked out the Fibonacci level of 61.8% from the fall between September 1 and 23. Thus, the probability of further downward movement is growing, and we expect to see the pair near the level of 1.2700 in the coming weeks. As you can see, both fundamental factors and technical "for" the US dollar. If after November 3, tensions related to the presidential election in America subside, this will be another, additional reason to buy the dollar, which has become cheaper in the last six months. As for the "coronavirus" problems, we previously considered this topic extremely important, but now both the United States and the United Kingdom have entered the phase of the second "wave", so the epidemiological situation is approximately the same in both countries. Therefore, traders are unlikely to react to the new figures for the spread of the COVID-2019 virus. But if the British economy is waiting for a new "lockdown", this may be another reason to get rid of the British currency, as the British economy will again begin to shrink at a high rate. Unlike the American one, which Trump is not going to close for a second "hard" quarantine.
The average volatility of the GBP/USD pair is currently 99 points per day. For the pound/dollar pair, this value is "average". On Thursday, October 29, thus, we expect movement inside the channel, limited by the levels of 1.2888 and 1.3086. A reversal of the Heiken Ashi indicator-up signals a possible resumption of the upward movement. Please note that the last 4 out of 5 trading days ended with volatility lower than 104 points. So, the average volatility may be even lower than 99 points per day. Nearest support levels: S1 – 1.2939 S2 – 1.2878 S3 – 1.2817 Nearest resistance levels: R1 – 1.3000 R2 – 1.3062 R3 – 1.3123 Trading recommendations: The GBP/USD pair has started a new round of downward movement on the 4-hour timeframe. Thus, today it is recommended to stay in short positions with targets of 1.2888 and 1.2817 as long as the Heiken Ashi indicator is directed down. It is recommended to trade the pair for an increase with targets of 1.3086 and 1.3123 if the price is fixed back above the moving average line. The material has been provided by InstaForex Company - www.instaforex.com |
| Posted: 28 Oct 2020 05:19 PM PDT 4-hour timeframe
Technical details: Higher linear regression channel: direction - downward. Lower linear regression channel: direction - upward. Moving average (20; smoothed) - downward. CCI: -165.0362 During the third trading day of the new week, the EUR/USD pair resumed its downward movement. However, despite this, the pair continues to stay inside the side channel 1.1700-1.1900 (or its alternative 1.1640-1.1920). One way or another, it is the flat that remains, and all the up and down movements are just local trends inside the side channel. Thus, we would not draw any conclusions on yesterday's drop in quotes and the strengthening of the US currency. We can't say that the American economy is becoming more attractive because traders are finally paying attention to the dollar or the upcoming presidential election is no longer scaring the markets or that the "coronavirus" in Europe is gaining momentum or that Joe Biden now has an even better chance of winning. Thus, most likely, we are dealing with a purely technical drop in quotes inside the side channel, that's all. Contrary to the opinion of some traders, if the market does not receive important information or the markets are openly waiting for an event, this does not mean that the price at this time just stands still and is trading in a 10-point range. It still moves in different directions and can even cover impressive distances. After all, the currency market is created not only for speculators who enter it to make a profit. The foreign exchange market is a set of entities that can buy and sell currency based on their own needs, and not to make a profit. Meanwhile, the US Election Day is less than a week away. Over the past three months, we have regularly written about the elections, and all this time the pair has been trading in the 200-250 point range, showing no desire to form a trend. Another pile of sociological research showed that Joe Biden continues to lead, 11% ahead of Trump. Well, Trump, in turn, began to implement his plan "B", which can work. We think it's no secret that Trump has already come to terms with the fact that he is unlikely to win the election. Still, Biden's 11% advantage, which has been stable over the past two months, needs to be somehow leveled in the elections themselves. And how to level such a huge number of votes? 11% is about 16 million voters. Of course, given the peculiarities of the American electoral system, these 11% advantages do not mean that Biden will get 11% more electoral votes. Rather, on the contrary, it means that the gap may be much larger in favor of Biden or even Trump will win, as in 2016, when all the polls also predicted his defeat. However, we are still inclined to believe that the best result for Trump may be a minimal gap from Biden. And the current president should not expect more, given the number of mistakes that he made as president of the country with the largest economy in the world. And what will give Trump the minimum loss? At first glance, nothing, however, at the same time it can give everything. That is, winning the election. The fact is that about 10 states in America are "controversial", that is, it is difficult to predict the victory of a particular candidate. There are states with more than 20 electoral votes. For example, there are 55 of them in California. What would it be? For example, if California has 20 million residents and 9,999,999 of them vote for Biden, and 10,000,001 for Trump, then Trump will win in this state and he will be given all 55 "electoral" votes that overlap Biden's victory in 10 states with the number of votes 4-7 at once. Thus. Biden can win 10 states and get fewer "electoral votes" in them than Trump won by a 2-vote margin in California. Now let's assume that the gap between Trump and Biden after counting the votes will be 30-40 votes. Trump immediately accuses the Democrats of fraud and fraud and asks the Supreme Court to review the results of the vote in any state where he lost, with the number of "electoral" votes more than 20. The Supreme Court consists of nine justices and at least five support Republicans or are appointed by Republicans to their posts. Among them is Amy Barrett, who was appointed yesterday to replace the untimely Ruth Ginsburg. The Senate voted in favor of her appointment. 52 Republican votes were enough to overlap 48 democratic votes. And in the case of judicial proceedings, 5 votes of Republican judges will be enough to block 4 votes of democratic judges. So much for Donald Trump's plan. Of course, the fraud of the Democrats in a particular state still needs to be proved. Moreover, Trump cannot claim that there was fraud in several states where he lost. However, there is no doubt that his team is already working hard on "evidence" of election fraud by the Democrats. Thus, Joe Biden and his team need to either win by a large margin so that any claims from Trump do not have any weight and significance or work on their evidence base that it is the Republicans who are trying to rig the election. Well, the euro/dollar currency pair may once again turn around the level of 1.1700 or slightly lower and resume its upward movement. The last thing I would like to say is that the number of cases of "coronavirus" has been growing again in America recently. In recent days, 70-80 thousand cases have been recorded again, however, this also applies to the whole world. In recent days, 500,000 new cases have been registered daily. Thus, the European second "wave" is not an exclusively European trend. The pandemic is gaining momentum around the world. Therefore, the US dollar cannot grow now due to the difficult situation with the epidemic in Europe. Despite all the promises of Donald Trump, there is still not a single fully tested vaccine in the world, and even if it appears in the near future, it is unlikely that its production will be put on stream in the near future. The entire world's population can expect to be fully vaccinated no earlier than next summer.
The volatility of the euro/dollar currency pair as of October 29 is 64 points and is characterized as "average". Thus, we expect the pair to move today between the levels of 1.1689 and 1.1817. A reversal of the Heiken Ashi indicator to the top may signal a round of upward correction. Nearest support levels: S1 – 1.1719 S2 – 1.1658 S3 – 1.1597 Nearest resistance levels: R1 – 1.1780 R2 – 1.1841 R3 – 1.1902 Trading recommendations: The EUR/USD pair continues its downward movement, but may be stuck in the area of 1.1689-1.1719. Thus, today it is recommended to maintain open sell orders with targets of 1.1689 and 1.1658, while the Heiken Ashi indicator is directed down. It is recommended to consider buy orders if the pair is fixed above the moving average line with targets of 1.1841 and 1.1902. The material has been provided by InstaForex Company - www.instaforex.com |
| Ichimoku cloud indicator Daily analysis of EURUSD Posted: 28 Oct 2020 02:53 PM PDT EURUSD is trading inside the Daily Kumo (cloud) turning trend to neutral despite the short-term move above it. Price remains vulnerable to a bigger pull back as price has broken below 1.1780 and is challenging major support area at 1.17.
Price has got rejected at the upper cloud boundary resistance. Having broken below the tenkan-sen (red line indicator), trend is neutral as price holds above the kijun-sen (yellow line indicator) support at 1.1745. Breaking below the kijun-sen will open the way for a move lower towards the lower cloud boundary at 1.1655-1.1690 area. Bulls will need to defend this area. At 1.17-1.1690 we also find horizontal support by the low made on October 15th. Bulls will need to defend this. The material has been provided by InstaForex Company - www.instaforex.com |
| NZDUSD rejection signs at major resistance Posted: 28 Oct 2020 02:45 PM PDT We continue to keep an eye on NZDUSD as we remain convinced that we are currently in the process of forming a right hand shoulder in a bearish Head and Shoulders pattern. So far price remains below the key resistance at 0.67 and is most probably forming a lower high as part of the H&S pattern.
Red area - resistance Black lines - Head and Shoulders pattern Red line - expect size of decline if neckline support fails to hold. NZDUSD is turning lower from the major resistance level of 0.67. As long as price does not break below 0.6510 the Head and Shoulders pattern is not activated. Bears need to break below 0.6510 in order to regain control of the trend. On the other hand bulls need to break above the red rectangle resistance area in order to continue higher. The material has been provided by InstaForex Company - www.instaforex.com |
| USDCAD bullish divergence confirmed and price has now bounced higher towards our target Posted: 28 Oct 2020 02:40 PM PDT In a previous analysis we warned bears of a bullish divergence in the RSI and that price was more probable to make a move higher towards 1.33-1.3350 rather than fall lower. Price was expected to bounce towards resistance trend line.
Red line -major resistance trend line Blue lines - bullish divergence signs USDCAD is trading at 1.3320 area very close to the major downward sloping resistance trend line. Now is a good opportunity for bears to step back in. In case of a rejection, then we should expect price to make a lower low towards 1.3070-1.3050. Resistance remains important at 1.3330-1.3350 and as long as price is below it, we remain bearish. In case price breaks above 1.3350 we should then expect price to challenge the recent highs at 1.3415 and most probably break it. However until then traders need to be patient. Now bears remain in control of the trend. The material has been provided by InstaForex Company - www.instaforex.com |
| Gold price rejection at cloud resistance Posted: 28 Oct 2020 02:35 PM PDT For the last few sessions we have been warning bulls that as long as Gold price is below the Kumo resistance it is vulnerable on a move lower. We specifically noted that key support was at $1,892 and a break below it would be our next bearish signal.
Gold price has broken below the kijun-sen (yellow line indicator) and below the $1,892 low. This is the bearish signal we were expecting. What bears want to see now is the tenkan-sen (red line indicator) cross below the kijun-sen and the Chikou span (black line indicator) to fall below the cloud. Next support for Gold is at $1,850. I expect price to break below it towards $1,800. I'm bearish as long as price is below $1,913. The material has been provided by InstaForex Company - www.instaforex.com |
| GBP/USD. Ups and downs of the pound: Brexit get on traders' nerves Posted: 28 Oct 2020 02:15 PM PDT The pound showed increased volatility on Wednesday. The British currency "walked" by almost 150 points: it settled at a high of around 1.3063, while the lowest level was 1.2916. Despite the fact that the GBP/USD bears reached the bottom of the 29th figure, they failed to gain a foothold in this price area. The pair returned to the borders of the 30th price level during the US session. Sellers have repeatedly tried to settle below the support level of 1.3000, but traders bought the pound each time, returning it back home. This suggests that bearish positions look uncertain, and there is no need to rush to sell the pair. First of all, you need to understand the reasons for this volatility. However, it's not hard to guess: Brexit is usually involved when there is any abnormally high volatility in the GBP/USD pair. London and Brussels still cannot find a compromise on the issue of concluding a trade deal, while time is running out: the transition period ends on January 1, and all points of the future agreement must be agreed upon by mid-November, when the next EU summit dedicated to the prospects for Brexit will take place. Let me briefly recall the background of recent events. The negotiators need to settle the most critical issue of fisheries policy. The process on this issue has been prolonged for way too long, in fact, for several years: at first it was discussed in the framework of negotiations on a general agreement on the withdrawal of Great Britain from the EU, but now it is being discussed in the context of a trade deal. Some EU countries (in particular, France, Belgium, the Netherlands, Denmark) want to maintain the current free access to British waters. On the other hand, London wants to maintain leverage on Brussels, insisting that the issue of access to British territorial waters should be discussed/quoted on a regular basis, that is, annually. Disputes and disagreements around this issue have been spinning for several years. In the current round of talks, the parties were supposed to focus on resolving this problem. According to rumors, Brussels is ready to make certain concessions in this area in exchange for a compromise on the Irish border and compliance with European standards. As a compromise, London offered to accept the Norwegian version of the deal, according to which fishing quotas would be agreed annually in common fishing zones. However, this proposal was categorically rejected by the French. They flatly refused to make concessions, thereby blocking further negotiations. According to the British press, negotiators even turned to the German Chancellor to influence the situation. The stalemate arose as early as Monday, while the next round of talks ends on Thursday. There was information that the situation was supposed to get off the ground, but this did not happen. Moreover, the head of the British delegation, Michael Gove, said that "the UK government will not back down on fisheries policy." At the same time, he criticized all the proposals of the European side in a rather harsh form. Gove stressed that Britain remains an independent coastal state. And the fisheries policy, accordingly, will be determined by London independently. After such a sharp statement, the pound collapsed across the entire market - including in tandem with the dollar. However, literally a few hours later, the pound partially regained the lost ground. The GBP/USD bears were unable to develop the declining trend, while buyers quickly seized the initiative. The fact is that after Gove's sharp statement, information of an unofficial nature was published in the press. It became known that, firstly, the negotiations will continue in Brussels, and secondly, the consultations between Berlin and Paris on the fishing issue are still ongoing. As for the bellicose statements by the head of the British delegation, they must be taken in the context of Boris Johnson's negotiation tactics Thus, the current situation speaks for several things. First, the pound remains hypersensitive to Brexit issues. The pound fell against the greenback and then rose regardless of the US dollar index, which was steadily going up throughout the day. The next takeaway is that GBP/USD bears are vulnerable. Newspaper rumors were able to neutralize the pessimism of the official statement of the British official. This suggests that the market is inclined to believe in the best, while everything that happens is regarded as a kind of play of nerves. From a technical point of view, the bears impulsively broke through, but could not gain a foothold below the support level of 1.3000 - at this price point, the middle line of the Bollinger Bands indicator coincides with the upper and lower borders of the Kumo cloud, which shrank to one lines on the daily chart. In the medium term, we can consider buying the pair while having the main target at around 1.3110 - this is the upper Bollinger Bands line on the same timeframe. The material has been provided by InstaForex Company - www.instaforex.com |
| EUR / USD. Euro falls amid simultaneous lockdowns but there is no need to rush to sales Posted: 28 Oct 2020 08:59 AM PDT On the eve of the October meeting of the European Central Bank, the euro-dollar pair is impulsively declining, updating multi-day price lows. The price is heading towards the main support level of 1.1700, against the background of the simultaneous growth of the dollar index and the weakening of the euro throughout the market. It is noteworthy that the catalyst for the multidirectional movement of currencies is the coronavirus, which again became the main topic in the foreign exchange market. Only COVID-19 "acts" on currencies in different ways – if the dollar becomes more expensive against the background of growing anti-risk sentiment, the euro becomes cheaper against the background of stricter quarantine restrictions in the European Union. Today's coronavirus anti-records again made market participants nervous. And not without reason: European countries continue to tighten the screws, continuing the fight against the COVID-19 pandemic. The downward impulse on Wednesday was triggered by the news flow from France. According to unofficial information, they may announce a second lockdown on Wednesday. French media, citing their own anonymous sources, report that Emmanuel Macron may impose a strict quarantine on the entire mainland for the next four weeks. According to sources, the proposed quarantine will be somewhat milder than the previous one. First, some businesses and most state institutions will operate, and second, the authorities will not close schools and kindergartens. However, non-food stores, bars, and restaurants will be closed around the clock (currently there is only a curfew at night). If the President's initiative is supported, the restrictions will begin to apply as early as midnight on October 29.
According to a number of experts, the rest of Europe will also resort to similar measures soon enough, given the rate of spread of the coronavirus. According to the WHO, over the past week, 40% more patients with coronavirus disease have died in the European Union than a week earlier. Also, over the past 7 days, the number of infections has increased by a third - most of the new cases are in France, Spain, the UK, and the Netherlands. Note that the Spanish authorities declared an emergency situation in the country last Sunday and introduced a night curfew everywhere from 11:00 pm to 6:00 am (except for the Canary Islands). If the situation does not improve in the next week, the Spaniards are ready to tighten restrictions, up to a complete lockdown. In Italy, a record number of patients was recorded (more than 20,000) over the past day. New restrictions in this country include the closure of restaurants, cafes, and pastry shops. Cinemas, theaters, casinos, gyms, swimming pools, and spas are also forced to close. Germany is also going to strengthen quarantine. Bars, clubs, pubs, and similar establishments will be closed throughout November, and overnight stays in hotels will only be allowed for good reason. Cinemas, theaters, and sports facilities will also be closed. By and large, at the moment, the worst scenario of all possible is being realized, when key European countries introduce an almost complete lockdown. And although the autumn measures are still not as strict as that of spring (at least for the moment), traders are seriously concerned about the prospects for the European economy. Even if we proceed from the measures already announced, it can be assumed that the services, tourism, and air traffic will again fall - especially in France, where the most stringent restrictions are being introduced. Naturally, the lockdown ricocheted to the rest of the European economy. Consumer activity will slow down again, inflation will fall again, PMI and ZEW IFO indices will once again drop. As a result, quarantine measures will undermine the already fragile recovery of the European economy. Against the background of such a gloomy fundamental picture, the euro is depreciating throughout the market. Even at the beginning of the week, traders were very lenient about quarantine restrictions. But today, market participants have sounded the alarm, given the intentions of the leaders of key European countries to repeat the spring scenario. The European Commission has also added fuel to the fire, Chair Ursula von der Leyen made a separate appeal on Wednesday in connection with the current situation. According to her, in the next three to four weeks there will be a significant increase in the incidence of coronavirus, and this fact is alarming. Von der Leyen also called on European governments "to more actively come forward with a coordinated response against the second wave of the epidemic." In other words, Brussels actually supported the policy of strengthening quarantine measures.
And yet, despite such a powerful downward impulse and such a gloomy foundation, selling the EUR/USD pair looks quite risky - especially if we consider the medium-term prospects. The market will quickly play back the very fact of introducing restrictive measures in Europe, after which it will again switch to American events. Less than a week is left before the US presidential election, and this circumstance will prevail over the greenback. At the moment, the pair is trading at 1.1730, and over the next 12 hours, it may slide to the 1.1700 support level. But judging by the dynamics of the downward movement, it will be difficult for the bears to overcome this target, and even more so to gain a foothold within the 16th figure. Therefore, in my opinion, in this case, it is worth accepting the possible lost profit in the by 30-40 points. The material has been provided by InstaForex Company - www.instaforex.com |
| October 28, 2020 : EUR/USD daily technical review and trade recommendations. Posted: 28 Oct 2020 08:59 AM PDT
On September 25, The EURUSD pair has failed to maintain enough bearish momentum to enhance further bearish decline. Instead, recent ascending movement has been demonstrates within the depicted movement channel leading to bullish advancement towards 1.1750-1.1780 which failed to offer sufficient bearish pressure in the first attempt. Two weeks ago, temporary breakout above 1.1750 was demonstrated as an indicator for a possible bullish continuation towards 1.1880. However, temporary downside pressure pushed the EUR/USD pair towards 1.1700. This is where the previous bullish spike was initiated. Currently, the price zone around 1.1880-1.1900 constitutes a KEY Price-Zone as it corresponds to the backside of the depicted broken ascending channel. Recent Upside breakout above 1.1780 enabled further advancement towards the price levels around 1.1880-1.1900 where significant bearish pressure and a reversal Head & Shoulders pattern were demonstrated. Recently, Two opportunities for SELL Entries were offered upon the recent upside movement towards 1.1880-1.1900. Both positions are already running in profits. Exit level should be lowered to 1.1820 to secure some profits Trade Recommendations :- Currently, the price zone of 1.1750-1.1780 remains a significant Resistance Zone to be watched during the upcoming upside pullback for a valid SELL Position. Initial bearish target would be located around 1.1720. The material has been provided by InstaForex Company - www.instaforex.com |
| October 28, 2020 : EUR/USD Intraday technical analysis and trade recommendations. Posted: 28 Oct 2020 08:16 AM PDT
In July, the EURUSD pair has failed to maintain bearish momentum strong enough to move below 1.1150 (consolidation range lower zone). Instead, bullish breakout above 1.1380-1.1400 has lead to a quick bullish spike directly towards 1.1750 which failed to offer sufficient bearish pressure as well. Bullish persistence above 1.1700 - 1.1760 favored further bullish advancement towards 1.1975 - 1.2000 ( the upper limit of the technical channel ) which constituted a Solid SUPPLY-Zone offering bearish pressure. Moreover, Intraday traders should have noticed the recent bearish closure below 1.1700. This indicates bearish domination on the short-term. On the other hand, the EURUSD pair has failed to maintain sufficient bearish momentum below 1.1750. Instead, another bullish breakout was being demonstrated towards 1.1870 which corresponds to 76% Fibonacci Level. As mentioned in previous articles, the price zone of 1.1870-1.1900 stands as a solid SUPPLY Zone corresponding to the backside of the broken channel if bullish pullback occurs again soon. Intraday Trend-Traders could have waited for the current bearish H4 candlestick closure below 1.1770 as a valid short-term SELL Signal with a potential bearish target located around 1.1700 and 1.1630 if sufficient bearish momentum is maintained. The material has been provided by InstaForex Company - www.instaforex.com |
| October 28, 2020 : GBP/USD Intraday technical analysis and trade recommendations. Posted: 28 Oct 2020 08:12 AM PDT
Intermediate-term technical outlook for the GBP/USD pair has remained bullish since bullish persistence was achieved above 1.2780 (Depicted Key-Level) on the H4 Charts. However, On September 1, the GBPUSD pair looked overbought after such quick bullish movement while approaching the price level of 1.3475. That's why, short-term bearish reversal was expected especially after bearish persistence was achieved below the newly-established key-level of 1.3300. A quick bearish decline took place towards 1.2780 where considerable bullish rejection brought the pair back towards 1.3000 and 1.3100 during the past few weeks. The price zone of 1.3130-1.3150 (the depicted channel upper limit) remains an Intraday Key-Zone to determine the next destination of the GBPUSD Pair. Bullish Persistence above the mentioned price zone of 1.3100-1.3150 was neede to allow bullish pullback to pursue towards 1.3400 as a final projection target for the suggested bullish pattern. However, the GBPUSD pair failed to do so, Instead, another bearish movement is being expressed towards the price level of 1.2840 where bullish SUPPORT will probably exist. The material has been provided by InstaForex Company - www.instaforex.com |
| What to expect from ECB and EUR? Posted: 28 Oct 2020 07:40 AM PDT Surprisingly, the US dollar did not react to the risk aversion during the previous sessions. In such a case, investors usually flee to safe haven assets, including the US dollar, but this did not happen. Today, the greenback seems to have recouped its losses. However, its growth is unlikely to last long. USD can give up its gains as soon as next session, and there are several reasons for this. The stimulus package for the US economy will be adopted only after the election, so we can downplay this factor. It is unlikely that traders will buy the US dollar before the election that will take place in just a few days. No matter who wins, Donald Trump or Joe Biden, the prospects for the US currency are still uncertain. Notably, during today's growth of the US dollar, investors tried to avoid hasty transactions with the US currency. They did not rush to buy it even despite the collapse of the euro, caused by the news about a possible introduction of tight lockdown measures in such European countries as France and Germany. Although the US dollar has slightly advanced on Wednesday, the market sentiment remains bearish. The upcoming US presidential election is the main reason for that. There is a lot of uncertainty around this political event. Market players are gearing up for increased volatility. The election results are difficult to predict. Besides, there is a risk that they won't be approved at all. Another possible outcome is that no candidate will gain the required majority of votes. The third-quarter US GDP will be released tomorrow. The data is very likely to determine further direction of the US dollar. Thursday will be an important day for the euro as well. The ECB will make a statement on its monetary policy and will announce its decision on interest rates. The regulator has many reasons to rush with the asset purchases, with negative inflation and declining business activity among them. Judging by the situation around coronavirus, consumer and industrial sectors will remain subdued in the near future. It is worth noting that the European STOXX 600 dropped by almost 2% on Wednesday. Previously, the ECB managed to stabilize it when necessary. Obviously, the current volume of asset purchases is not enough. Markets will be disappointed if the European regulator does not announce plans to ramp up the asset purchase program on Thursday. A rate cut and an increase in the inflation target would be great news for the market. But this is unlikely to happen, and investors do not even hope for such a decision. The ECB will most likely wait until next time. By the end of the year, long-term forecasts will be ready, and the indicator of business activity may become critical. At the same time, the ECB officials may hint at an increase in open market operations planned for next month. Such expectations may trigger the sell-off in the EUR/USD pair which now aims at 1.17. Given the current and upcoming events, the pair may test a September low at 1.1610 in early November. Today, investors' focus has shifted to the Canadian dollar thanks to the Bank of Canada policy meeting. The Canadian regulator kept the rate unchanged. However, the consequences of the COVID-19 pandemic continue to weigh on the country's economy and the labor market. Economic indicators suggest further easing of the monetary policy. Traders will study the accompanying statement of the regulator, where the Governor of the Bank of Canada will explain his position and may signal the need for further policy easing. In this case, the Canadian currency will start to depreciate. In any case, the volatility on the USD/CAD pair is expected to increase soon. |
| EUR/USD: markets hit by a wave of pessimism Posted: 28 Oct 2020 06:45 AM PDT
Time is running out before the US presidential elections scheduled for next Tuesday. This will be an important event for both the country and the financial markets. The stakes are high, and the outcome of the election is still unpredictable. This explains the reduced risk appetite of investors and the increased demand for protective assets. On Wednesday, the greenback rose against most major currencies. The US dollar index rose more than 0.6 percent, rising above the level of 93.6 points. Recent opinion polls show that Donald Trump still lags behind his rival Joe Biden in the election race, however, the possibility of a repeat of the events of four years ago does not give investors peace of mind. D. Trump lost almost 3 million votes in 2016, but won, winning in several key states. However, the current bout of anxiety in the markets is not only due to pre-election uncertainty in the United States. Hopes for a new package of measures to support the US economy before the presidential election were dashed after Senate majority leader Mitch McConnell said that the Upper House of Congress will not resume work until November 9. Market participants are forced to reduce previously occupied positions due to concerns about the deterioration of the epidemiological situation in the Old and New World. Although the dynamics of COVID-19 infections are really frightening, however, the mood of investors is not so much affected by the virus itself, but by the restrictive measures associated with it. "The prospects for a slowdown in the global economic recovery due to the introduction of new restrictive measures in Europe, as well as possible shocks associated with the US election, significantly worsened the risk-return ratio of growth assets," Unigestion experts said. They warn that the spread of lockdowns to the US will radically worsen the situation. "In the event of a stock market collapse, the USD exchange rate may grow much stronger than many expect," Unigestion believes. Although the number of COVID-19 cases is growing in both the US and the EU, the reaction of the European and US currencies is different. Demand for the safe-haven dollar has increased, while the euro has come under pressure.
According to the head of the European Commission, Ursula von der Leyen, there will be an increase in the incidence of coronavirus in the EU in the next two to three weeks. It calls on European governments to step up their coordinated response to the pandemic. Against this background, the EUR/USD pair updated its weekly lows around 1.1720. "Concerns that Europe is plunging into a cycle of weak economic growth, negative rates, and deflation will be at the heart of the ECB's discussions this week," the Financial Times reports. The next meeting of the European Central Bank will be held on Thursday. Given recent events, the regulator has no choice but to prepare the ground for further policy easing this year. The deposit rate in the Eurozone is -0.50%. Its further decline will have a minor impact on the region's economy and may harm banks. According to experts, the easier way for the ECB will be to expand the emergency asset purchase program in the context of a pandemic (PEPP). The regulator is expected to increase the volume of the current quantitative easing program by €500 billion to €1.8 trillion. A new spike in coronavirus cases in the EU and retaliatory restrictive measures, including curfews in France, Italy, and Spain, pose the threat of a second recession. All of this will prompt the ECB to either act at the next meeting or hint at the action at the next. ECB chief Christine Lagarde may announce a rate cut, as well as an expansion of the PEPP program. This will lead to a further decline in the EUR/USD pair. The material has been provided by InstaForex Company - www.instaforex.com |
| Oil prices are doomed: the worst period is just beginning Posted: 28 Oct 2020 06:08 AM PDT
Oil supplies have declined sharply in recent months, which allows us to keep world prices for this energy carrier at a more or less acceptable level – $40 per barrel. Still, there is no need to talk about the market's return to pre-crisis times. And as sad as it may sound, oil companies and states will continue to have to limit themselves in production to somehow make ends meet. The United States is currently one of the main suppliers of crude oil to China. The latter, in turn, forms the largest market for American oil. According to the latest September data from the Energy Information Administration, approximately 1.3 million barrels of US oil were exported to China in May. At the same time, it is very important, but not the only market for the United States. American oil also goes to Canada, but deliveries for the first half of this year decreased by 19% compared to the same period last year. Shipments to South Korea also fell by a significant 27%. However, in addition to crude oil sales, demand for diesel and jet fuel is also critical to the global oil market. But demand for these market components, which are dominant in the transport and air transport sectors, is also significantly reduced. Since the beginning of September, gasoline stocks have decreased, and the actual demand for motor fuel is below the seasonal norm. John Kilduff, founder of the New York-based energy hedge fund Again Capital, said that a couple of weeks ago there was quite normal demand for motor fuel, but today there is only a decrease in it. And this is directly related to COVID-19: in places where the spread of the disease is at a high level, there will be a maximum drop in gasoline prices. The same is true for jet fuel: demand is already showing an obvious drawdown. This is understandable because due to the pandemic, air transportation has suffered significant losses. Although demand for jet fuel has always been significantly lower than for gasoline or diesel, it forms a large share of the oil market and showed considerable growth before the pandemic. According to the Wall Street Journal, in December 2019, the world consumed 8.1 million barrels of jet fuel per day. Analysts predict that over the same period this year, global jet fuel consumption will be just 5.4 million barrels per day, meaning demand is expected to decline by a third. Doug King, chief executive of the British hedge fund RCMA Capital, believes that due to the long-running problems of oil demand, energy prices will not be able to recover for the next few months. Here we can only add that as restrictive measures are strengthened in Europe due to the second wave of coronavirus, the demand for this energy carrier will fall even more significantly than we are seeing now. OPEC+ members have set a goal to reduce oil production to prevent a free fall in energy prices. However, given all the above, it is worth noting that the cartel is unlikely to reverse this decision in the near future. The organization of the petroleum exporting countries, which has 13 members and 10 allies under Russian rule, has been trying to keep oil prices above $ 40 a barrel since May, given production cuts. But remember that American oil was trading below $ 39 per barrel on Tuesday. In this regard, the organization is in no hurry to raise the offer on the market. Individual countries that produce black gold would be happy to increase their production and sales to restore their economy, which has been severely damaged by the ill-fated pandemic. Plus, there is a country that can hardly be forced to reduce energy production. We are talking about Libya, which after the civil war has been continuously producing oil for the past few weeks. In this regard, Iran may well not support the OPEC+ desire to reduce production, although it is a member of it. To date, no one in the organization is going to publicly discuss future exports from this country. The situation concerning Iran should be clarified only after the US presidential election, which is due to be held on November 3. And at the moment, the export of Iranian oil is suspended by the sanctions of the current president, Donald Trump. But if Joe Biden wins the election, he will likely lift most of the bans imposed on Iran. In general, we can say that given the massive spread of coronavirus in the world, as well as the unpredictability of the situation with Iran, the worst-case scenario not only for OPEC but also for oil prices will not be long in coming and is being implemented in the foreseeable future. The material has been provided by InstaForex Company - www.instaforex.com |
| Evening review of EURUSD on October 28, 2020 Posted: 28 Oct 2020 05:44 AM PDT
The euro exhibits a significant decline a day before the report on the US GDP for the 3rd quarter and the decision of the ECB. Consequently, the market has already decided on a direction. You may keep selling from 1.1785, the stop can be moved almost to breakeven at 1.1790. The material has been provided by InstaForex Company - www.instaforex.com |
| Greenback may rise in the event of a stock market crash Posted: 28 Oct 2020 05:31 AM PDT
The situation on US stock markets is getting worse. Recent indicators and internal dynamics indicate that professional and retail investors who actively buy shares are running out of free money. Risks of increased volatility and a sharp decline in the market are on the horizon. This will happen in the event of simultaneous bad news. Europe is on the verge of closing due to quarantine measures similar to that of spring. The US is constantly reporting a record increase in coronavirus infections, and the negotiations on the stimulus package in Washington have so far not led to anything. All this spoils the mood of investors who were counting on the imminent appearance of a vaccine and the restoration of global economic growth. The latest round of pressure pushed key US indicators back to their 3-week lows. The market is now not just a correction, but a short-term bearish trend that can grow into something more. Investors may be cautious ahead of the US presidential election, which will exacerbate the downward momentum. With this scenario developing, the S&P 500 could quickly traverse the important 200-day moving average support line, which is 7% below the current indicator. The nervousness of the markets can be seen before the elections and after the announcement of the first results. It is worth noting that a certain panic attack that we are now witnessing is connected not only with pre-election uncertainty. After a record number of cases, a record death rate from coronavirus may go. The authorities will be able to stop this only with the help of economic losses, to which the markets will react with lightning speed. At times like this, investors go into defensive assets like the US dollar. The USD index is recovering as demand surged sharply. In the event of a stock market crash, the greenback will rise, and much more than the markets expect. For example, Unigestion strategists now hold a long dynamic position in the USD. At the same time, Goldman Sachs, BlackRock, and UBS Asset Management continue to sell ahead of the US elections.
Bloomberg writes that now the net speculative short position on the US dollar exceeds $23 billion. The indicator approached the extreme values of 2011. Meanwhile, the growth of the Japanese yen against the US dollar is alarming. The decline in the USD/JPY pair indicates increased craving for a safe haven. We observed the weakness of this pair a week ago. Then it managed to maintain its position above the psychologically important mark 104. However, in recent sessions, the yen rate is approaching the level of 104.10.
Note that the growth of the yen, observed a week earlier, was rather on its own, but now it is supported by the movement of stock indicators. USD / JPY and S&P 500 are declining at the same time. The European market also plays up to them. The DAX losses from the peak values of October amounted to 10%. The pressure on the indicator is likely due to the discussed new coronavirus restrictions in Germany. All of this is troubling. If the USD / JPY pair and the US and German stock markets do not reverse, then volatility in a wide range of financial assets, including raw materials and currencies of the EM sector, will sharply increase. The material has been provided by InstaForex Company - www.instaforex.com |
| Trump vows best stimulus package, while Biden to support Belarusians and Tikhanovskaya Posted: 28 Oct 2020 05:18 AM PDT Current US President Donald Trump told reporters, on Tuesday, that the Republicans will take a package of measures to provide state support to the American economy after the November 3 elections. "After the election, we'll get the best stimulus package you've ever seen," Trump said as he left the White House for a campaign meeting in Lansing. He also assured reporters that following the results of future congressional elections, Republicans will not only retain the majority in the Senate but also regain the House of Representatives. Trump's predictions are based on the latest voter polls released in the early days of this week. According to them, the current President confidently leads in the states of Wisconsin, Iowa, and Ohio.
On top of that, the politician did not forget to "prick" one of his main opponents - the Speaker of the House of Representatives Nancy Pelosi, who is negotiating on behalf of the Democrats. Trump accused Pelosi of being interested in helping only unreliable and crime-ridden cities and states ruled by Democrats, not the entire American people. Recall that the next package of measures to support the US economy amid the COVID-19 pandemic has been a bargaining chip between Republicans in the Trump administration and Democrats in Congress for several months. The parties cannot come to a consensus on the amount of fund and their purpose. Americans look forward to the November elections, which will play a critical role in this difficult dilemma. Although in fairness it should be noted that this issue could have been resolved a long time ago and the opponents had enough time. However, last week, Senate Majority Leader Mitch McConnell opposed an additional $2 trillion injection into the American economy. It was about this amount that House Speaker Pelosi and Treasury Secretary Mnuchin were previously able to agree, despite the fact that the conclusion of the agreement was stalled due to reservations about the items of expenditure. Meanwhile, Donald Trump's main rival is also actively working to increase his rating among voters. On Tuesday, Biden visited Georgia, which has traditionally been the mainstay of the Republicans. The state has not voted for Democrats in the presidential election since 1992. Despite this, Biden said in his interview that he has every chance of winning in Georgia. On the same day, in Orlando, former US President Barack Obama held a rally in support of Biden. During his speech, he criticized Trump for the failure of his administration to fight the pandemic and urged Americans not to repeat the mistake of 2016. The former president has asked Florida residents to come to the polls en masse so that Trump won't win in the faltering states this time, as he did four years ago. According to public opinion polls in Florida, Biden is ahead of Trump by several percent. That is, 46% of the surveyed are going to vote for the incumbent president, and 50% for the democrat. A previous poll in Florida promised Trump 47% and his opponent 49% of the vote. In the meantime, supporters and associates of the US Democratic Party are worried about popular support for Biden at home, the presidential candidate makes loud statements regarding the political situation in the world. So, on Tuesday, the politician called for the introduction of sanctions against the entourage of the President of Belarus Alexander Lukashenko. "The international community should significantly expand sanctions against Lukashenko's henchmen and freeze offshore accounts where they keep their stolen wealth," the Democrat said in his written appeal. Biden promised that if elected to the presidency, he, together with European partners, will work on a plan of economic support for a truly sovereign, democratic Belarus. The presidential candidate stated that he strongly condemns the human rights violations committed by the Lukashenko regime. He also added that even before the elections, he intends to continue, together with the Belarusian people and Svetlana Tikhanovskaya, to call for a peaceful transfer of power, the release of all political prisoners, and free and fair elections. Biden is confident that the inhabitants of Belarus will ultimately be able to exercise their democratic rights, in the name of which they made so many sacrifices. Note that protests by opponents of the Lukashenko regime continue in Belarus. The opposition and the people believe that Svetlana Tikhanovskaya won the last elections. The EU countries and the UK have imposed sanctions against a number of high-ranking Belarusian officials and security forces. The material has been provided by InstaForex Company - www.instaforex.com |
| US stock market fluctuates due to coronavirus and upcoming US elections Posted: 28 Oct 2020 05:11 AM PDT US stock markets were subject to fluctuations on Tuesday, closing with mixed performances after a synchronous decline the day before. The Dow Jones index dropped 0.8% (222.19 points) and closed around 27463.19 points (note that since the beginning of this year, DJIA has decreased by 3.8%), while the NASDAQ index, on the contrary, increased by 0.64% (72.41 points ) and closed at 11,431.35 points. Meanwhile, the S&P 500 index fell by 0.30% (10.29 points) and reached 3390.68 points.
The simultaneous drop in the indices the day before was largely due to the record increase of coronavirus cases around the world, which continues to worry the markets, because the re-introduction of restrictive measures will seriously slow down economic development. However, at the same time, the upcoming US presidential elections have brought excitement to the stock exchanges. Thus, there is strong volatility in the markets, and vague prospects regarding the US stimulus package only boosts it. Nevertheless, the main driver of the markets is still the situation with the coronavirus, which continues to deteriorate, as cases have reached a new peak and incidence in the United States broke a weekly record. Italy, Spain and many other states have already tightened restrictive measures in the hopes of curbing the spread of the virus. Despite this negative outlook, many experts believe that the market will confidently recover next year, and in some places will show an unprecedented rise. They say that volatility and returns will even go back to historical norms. Following this, some investors hope that the governments will not resort to severe quarantine, and with it, avoid a catastrophic decline in economic activity. The current improvement of economic indicators, say for example, US durable goods, are giving optimism to the stock market, especially since the index continues to increase for the fifth month in a row (compared to August, a 2% growth was recorded for September). Tech stocks were also relatively positive on Tuesday, particularly in response to news from Advanced Micro Devices. The corporation said it plans to buy rival chipmaker, Xilinx, for $ 35 billion, so as a result, Xilinx rose 8.6% and AMD declined 4.1%. Shares of individual companies also dramatically changed due to the publication of financial statements. For example, Eli Lilly shares declined 6.9% after lowering the profit forecast for 2020. Meanwhile, the pan-European Stoxx Europe 600 lost 0.9%, while Caterpillar shares fell 3.2%. As for Microsoft, growth associated with the pandemic was reported. The company noted an increase in demand for cloud computing services amid the shift of office workers to remote work. In this regard, the company's securities rose in value by 0.3%. Many major tech companies, including Apple and Amazon.com, have pledged to submit their financials by the end of this week. In Asia, key indices, for the most part, declined by Tuesday evening. The Hong Kong Hang Seng fell 0.5%, the Japanese Nikkei 225 remained unchanged, and the Shanghai Composite rose 0.1%. The material has been provided by InstaForex Company - www.instaforex.com |
| Posted: 28 Oct 2020 05:04 AM PDT
It should be noted that for the same period a year earlier the company declared a profit of 100.5 million euros. Earnings per share also rose 13% to 0.76 euros. Earnings per share last year were 0.67 euros. Profit before tax and interest (EBIT) for the reporting period increased by about 17% to € 189.5 million. Last year, this figure was 162.2 million euros. Puma's revenue rose 7.2% (13.3% excluding currency fluctuations) to € 1.583 billion from € 1.478 billion a year earlier, beating the consensus forecast of € 1.55 billion. Despite the growth in financial indicators, Puma was unable to provide a forecast for the current year. The company said 2020 was and remains a very challenging year for the sporting goods industry due to the COVID-19 pandemic. It is also worth noting that a company representative expressed concern about the unpredictability of events in the world. This made it impossible to provide a forecast for the current year. Puma shares are declining during Wednesday's trading. The company's capitalization has grown by 12.7% since the beginning of the year, to 11.9 billion euros. The material has been provided by InstaForex Company - www.instaforex.com |
| GBP/USD: plan for the American session on October 28 (analysis of morning deals) Posted: 28 Oct 2020 05:03 AM PDT To open long positions on GBPUSD, you need: Even in my morning forecast, I paid attention to sales from the level of 1.3072, but we did not reach it in the first half of the day, so there was no signal to open short positions there. A break below the level of 1.2997 also failed to form a more distinct entry point, which led to me missing this trade as well.
At the moment, the technical picture is far from in favor of the pound buyers. The lack of news on Brexit seems to be weighing on buyers, as the longer the situation remains unknown, the more likely it is that there will be no compromise between the parties. All that the bulls can now count on is a return of the resistance of 1.2997 since only a consolidation above this level will lead to the formation of a buy signal that can return GBP/USD to the resistance area of 1.3072, where I recommend fixing profits. If the pressure on the pound persists against the background of the lack of news and important fundamental statistics, I recommend opening long positions only from a large local minimum of 1.2919, where purchases can be made immediately for a rebound based on a correction of 20-30 points within the day. To open short positions on GBPUSD, you need to: Bears are now aimed at reducing the GBP/USD to the support area of 1.2919, and while trading is conducted in the middle of the channel, there will be no reference points for entering short positions. Only an upward correction and the formation of a false breakout in the resistance area of 1.2997 will be a signal to sell the pound in the continuation of the current trend. Negative news on Brexit may increase pressure on the pair, which will lead to a breakout and consolidation below the support of 1.2919. In this case, the weekly target will be at least 1.2865. In the scenario of growth of GBP/USD above the resistance of 1.2997 in the second half of the day, I recommend postponing sales until the test of the maximum of 1.3072 in the expectation of a correction of 20-30 points.
Let me remind you that in the COT reports (Commitment of Traders) for October 20, there was a reduction in short and a sharp increase in long positions. Long non-commercial positions increased from the level of 36,195 to the level of 39,836. At the same time, non-commercial short positions dropped from the level of 45,997 to the level of 41,836. As a result, the negative value of the non-commercial net position slightly increased to -2,000 against -9,802 a week earlier, which indicates that sellers of the British pound remain in control and have a minimal advantage in the current situation. Signals of indicators: Moving averages Trading is below 30 and 50 daily averages, which indicates a resumption of the bear market. Note: The period and prices of moving averages are considered by the author on the hourly chart H1 and differ from the general definition of the classic daily moving averages on the daily chart D1. Bollinger Bands In the case of an upward correction, the average border of the indicator around 1.3030 will act as a resistance, from which you can sell the pound immediately for a rebound. Description of indicators
|
| Posted: 28 Oct 2020 04:55 AM PDT Further Development
Analyzing the current trading chart of BTC, I found that our upside target at the price of $13,840 has been reached and that there is bigger reaction from sellers. Key Levels: Resistance: $13,840 Support levels: $13,200 and $12,7203 The material has been provided by InstaForex Company - www.instaforex.com |
| EUR/USD: plan for the American session on October 28 (analysis of morning deals) Posted: 28 Oct 2020 04:52 AM PDT To open long positions on EURUSD, you need: In my morning forecast, I paid attention to the sale of the European currency after the breakout and consolidation below the level of 1.1761, which happened. Let's analyze the entry points and see where you can earn money. The 5-minute chart clearly shows how after breaking the level of 1.1761, the bulls tried to return the market to their side. However, the test of this area from the bottom up formed a new signal to open short positions in the continuation of the current downward trend, which led to a decrease in the pair to the support area of 1.1732. From this level, I recommended opening long positions immediately for a rebound in the expectation of a correction of 15-20 points, which happened.
In the second half of the day, buyers will focus on protecting the support of 1.1732, as only the formation of a false breakout will be a signal to open long positions against the trend. If you re-test the area of 1.1732 and there is no activity on the part of buyers, I recommend that you postpone long positions in EUR/USD until you meet the minimum of 1.1704 and buy euros there immediately for a rebound based on the same correction of 15-20 points within the day. The absence of important fundamental statistics and tomorrow's meeting of the European Central Bank will be the main criteria for selling the euro. To return the market under their control, the bulls should make much more effort and climb above the resistance of 1.1761. Only a test of this level from top to bottom forms a good entry point into purchases to restore EUR/USD to the resistance area of 1.1796, where I recommend fixing the profits. There are also moving averages that play on the side of euro sellers. To open short positions on EURUSD, you need to: Sellers coped with the morning task and broke below the support of 1.1761, then easily reached the low of 1.1732. Now there is small profit-taking, however, the second test of this range may lead to a new wave of falling euros. I recommend opening short positions at weekly lows only after fixing EUR/USD below the support of 1.1732 and testing this level from the bottom up. Only in this case, we can expect a continuation of the downward trend to the area of the minimum of 1.1704, where I recommend fixing the profits. In the scenario of an upward correction of the pair in the second half of the day, it is best not to rush with sales, but to wait for the formation of a false breakout at the level of 1.1761. I recommend opening short positions in EUR/USD immediately for a rebound from the maximum of 1.1796, based on a correction of 15-20 points within the day.
Let me remind you that the COT report (Commitment of Traders) for October 20 recorded both the growth of long positions and the growth of short ones. However, the latter turned out to be more, which led to an even greater decrease in the positive delta. But despite this, buyers of risky assets believe in the continuation of the bull market, but prefer to proceed cautiously, as there is no good news on the Eurozone yet. Thus, long non-profit positions rose from the level of 228,295 to the level of 229,878, while short non-profit positions rose from the level of 59,658 to the level of 63,935. The total non-commercial net position fell to 165,943, down from 168,637 a week earlier. However, bullish sentiment for the euro remains quite high in the medium term. The stronger the euro declines against the US dollar at the end of this year, the more attractive it will be for new investors. Signals of indicators: Moving averages Trading is below 30 and 50 daily moving averages, which indicates a further decline in the euro. Note: The period and prices of moving averages are considered by the author on the hourly chart H1 and differ from the general definition of the classic daily moving averages on the daily chart D1. Bollinger Bands In the case of an upward correction, the average border of the indicator around 1.1780 will act as a resistance where you can sell the euro. Description of indicators
|
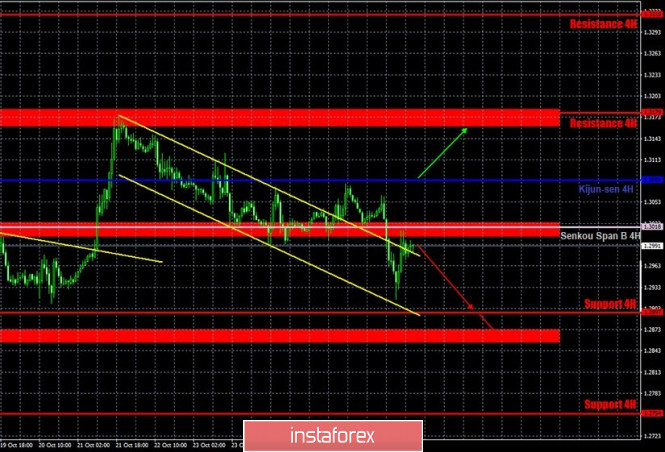
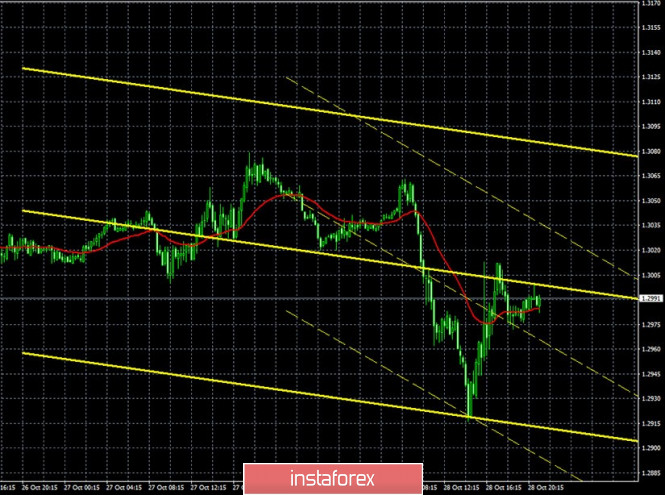
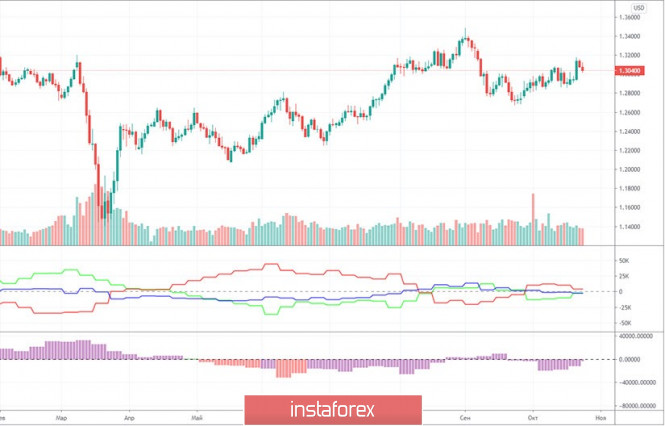
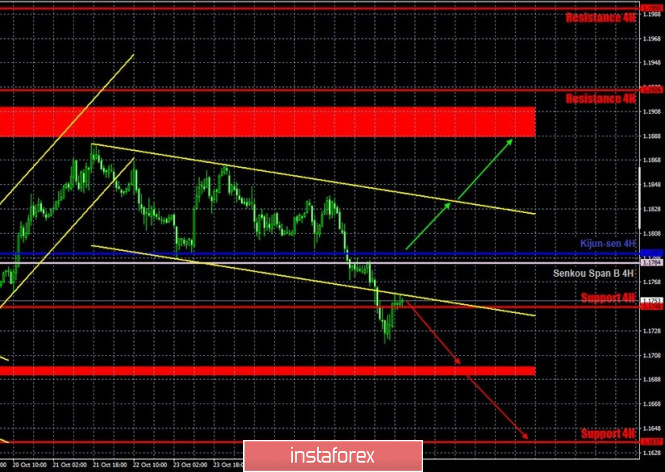
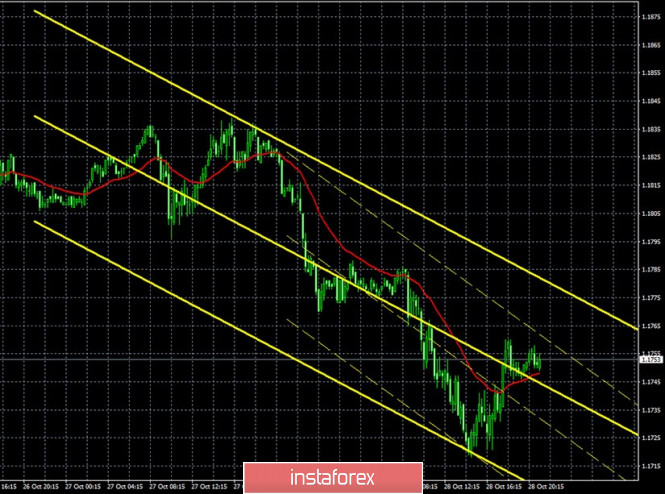
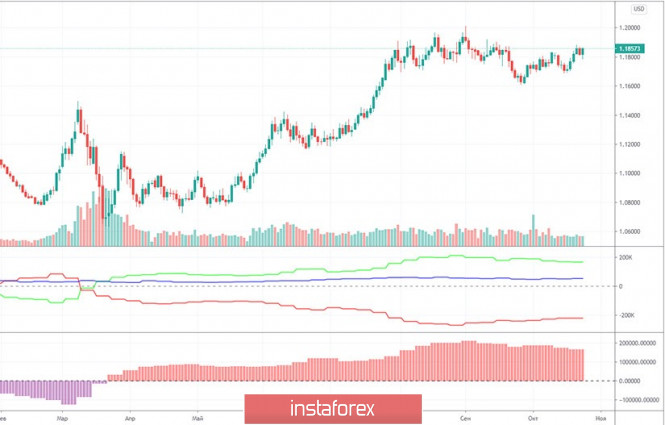
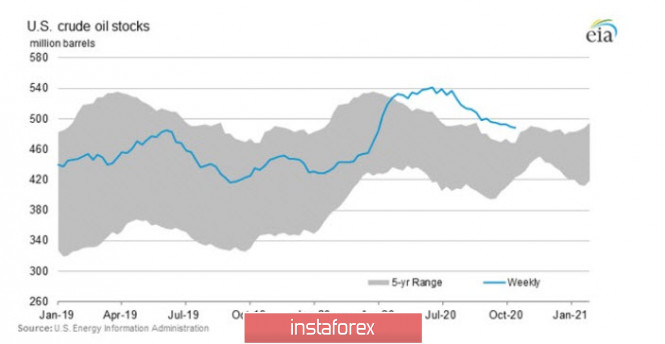
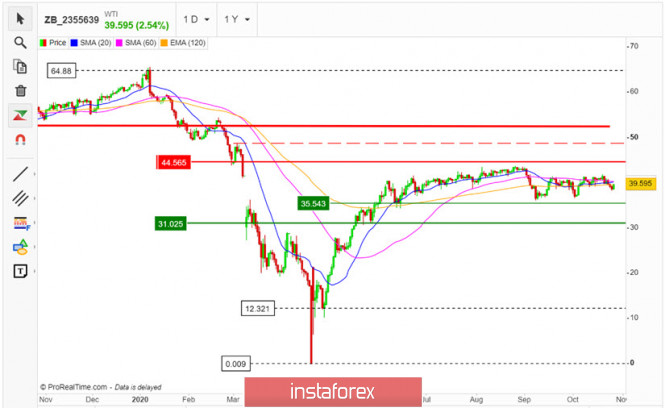
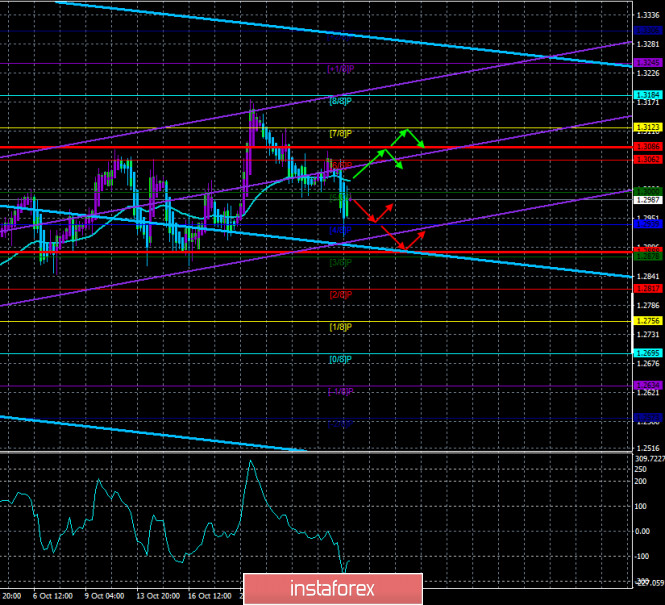
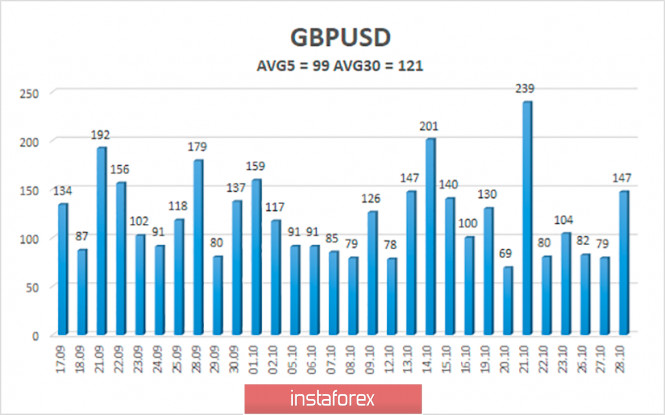
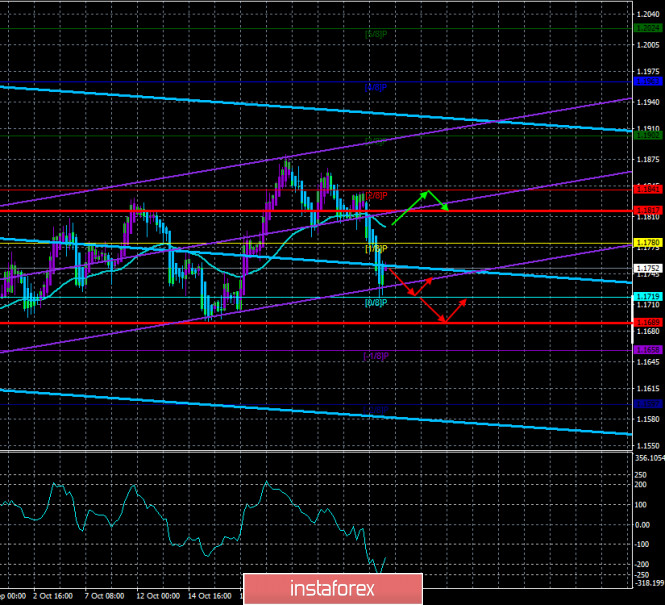
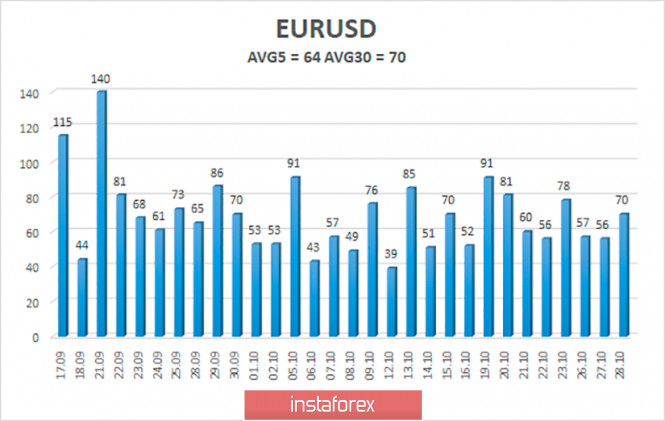
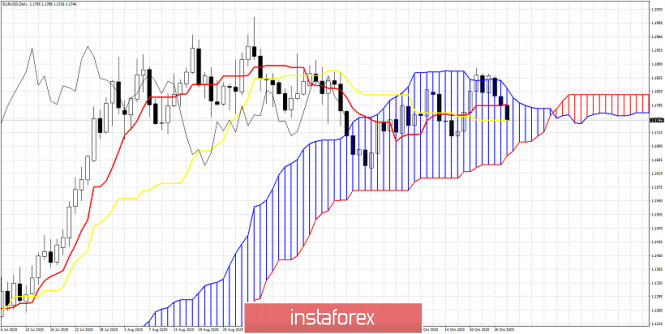
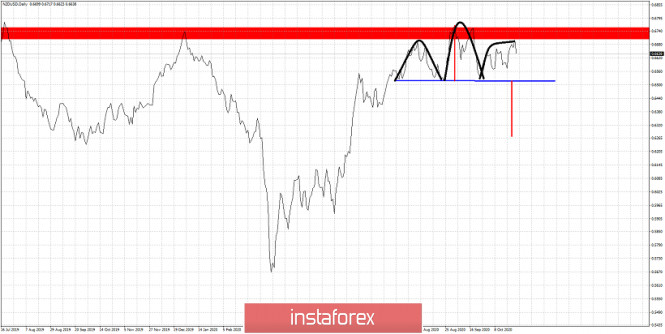
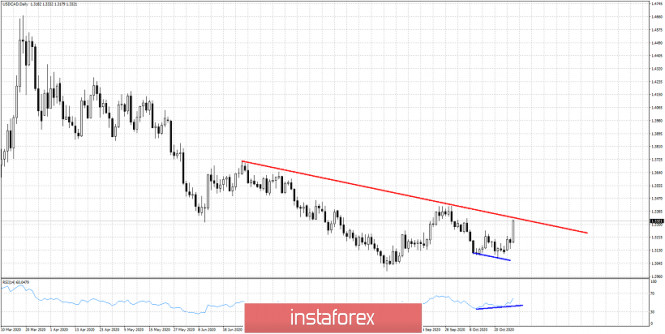
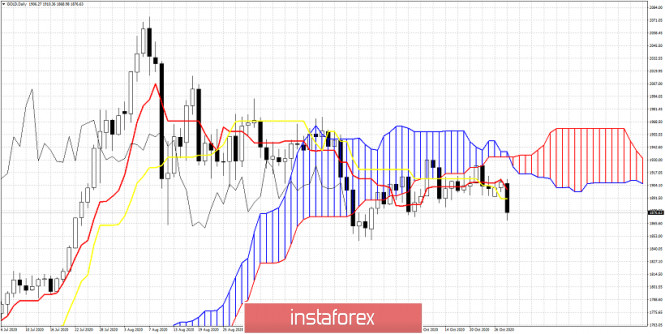


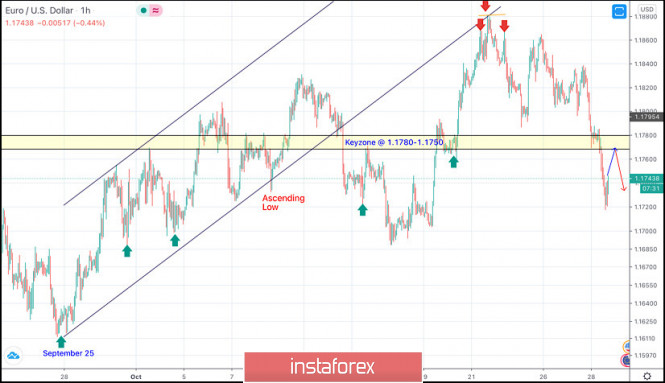
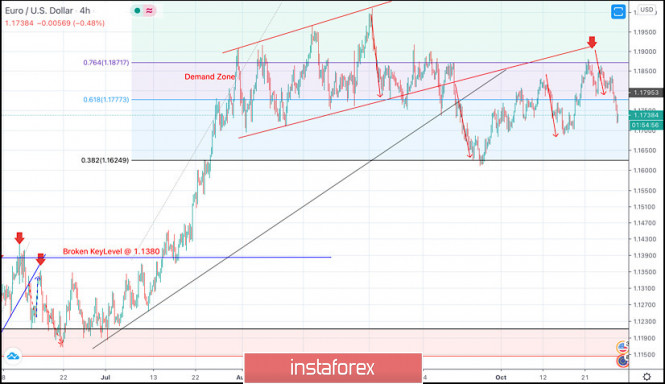
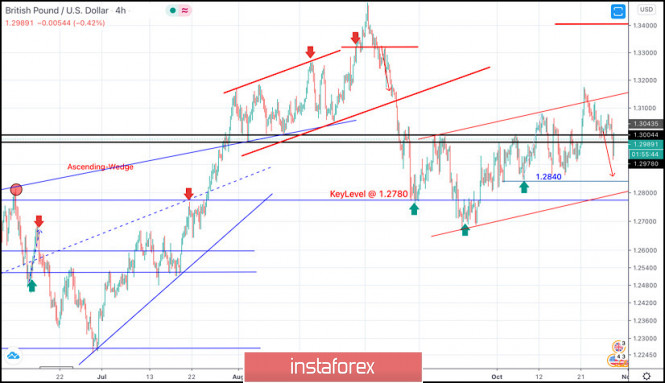
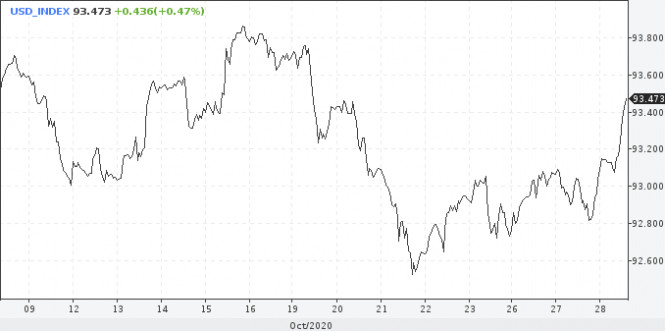
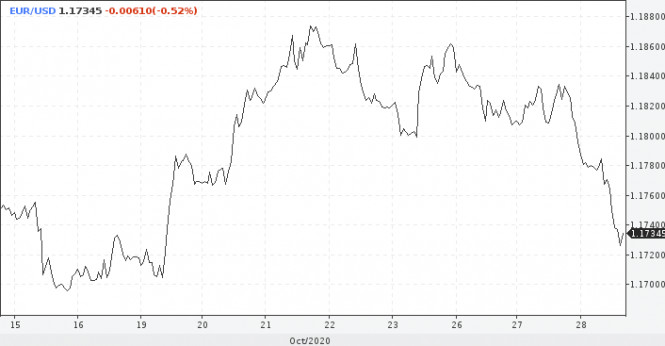
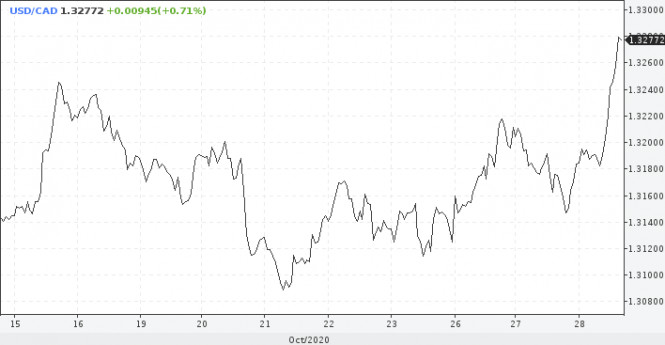
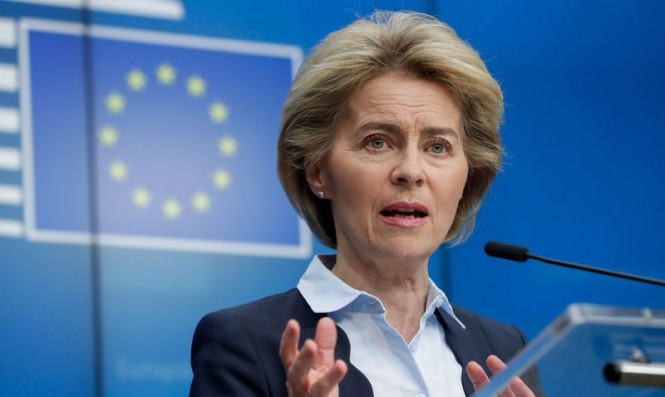

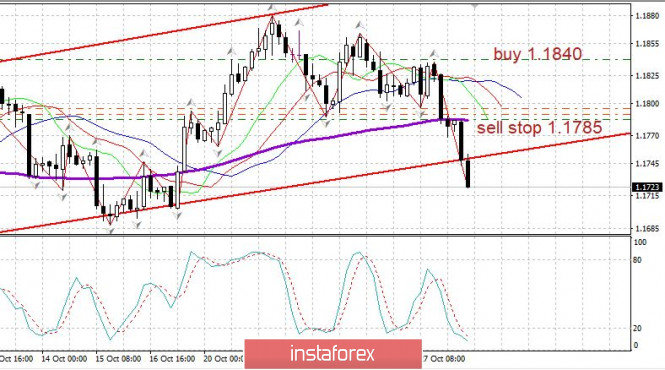

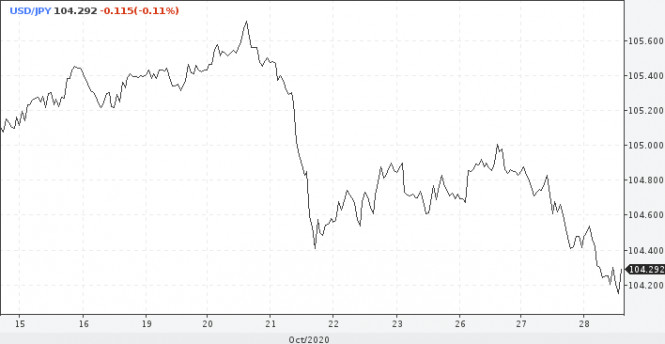

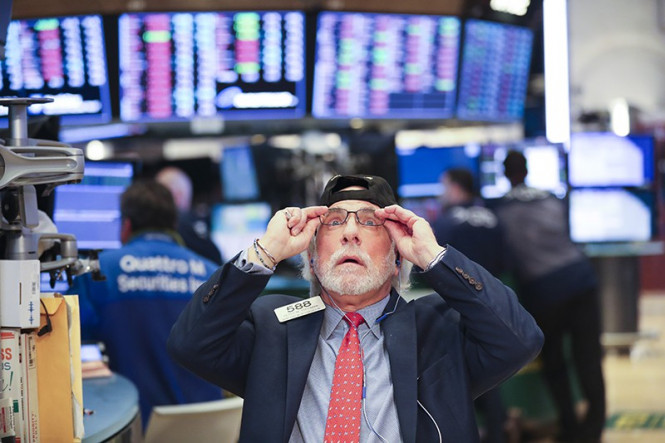

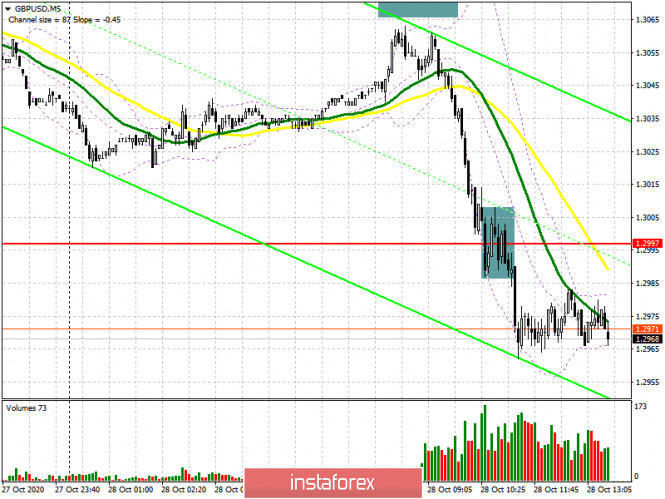
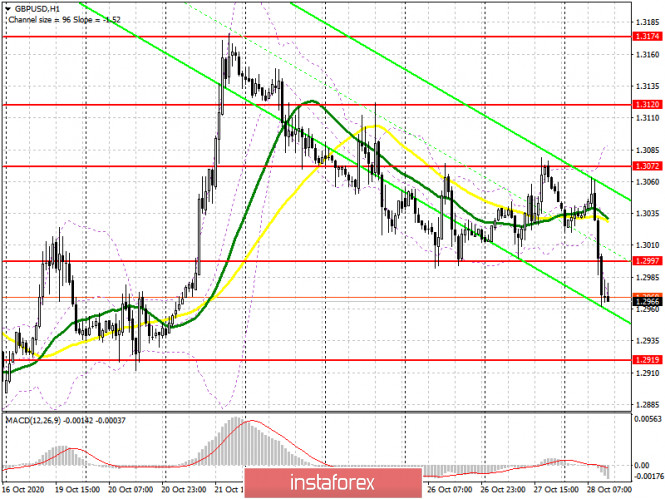
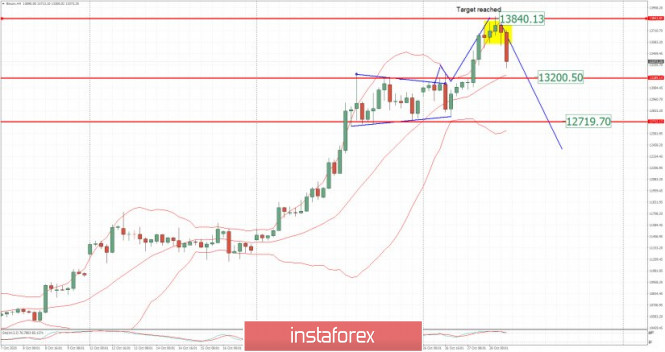
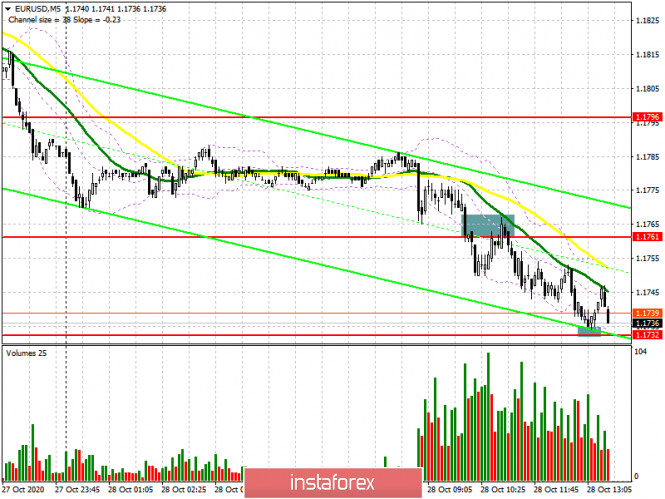

| You are subscribed to email updates from Forex analysis review. To stop receiving these emails, you may unsubscribe now. | Email delivery powered by Google |
| Google, 1600 Amphitheatre Parkway, Mountain View, CA 94043, United States | |
No comments:
Post a Comment