
Forex analysis review |
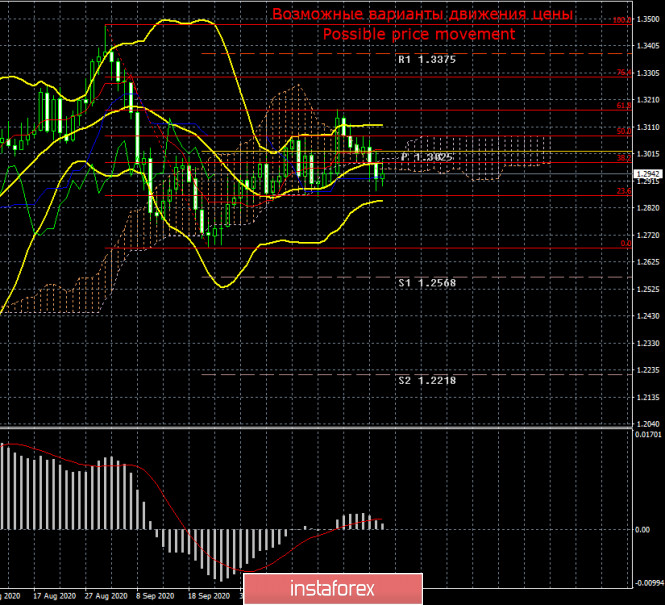
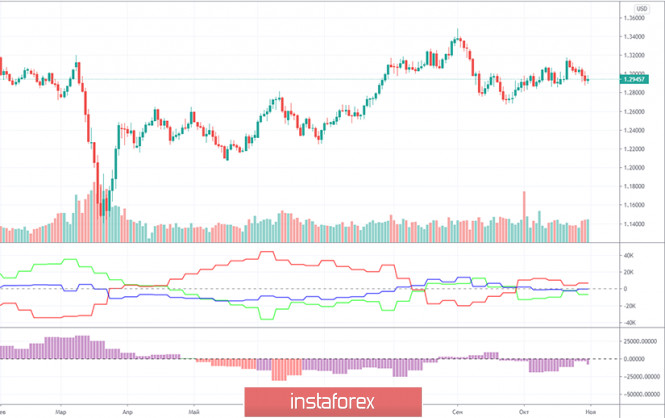
| Posted: 31 Oct 2020 03:50 AM PDT GBP/USD 24H For the whole week, GBP/USD was trading lower like EUR/USD. Nevertheless, for GBP/USD the crucial move was a 61.8% fibo bounce. After this had happened, the odds for a further downtrend increased sharply. At the end of the week, GBP/USD slipped to the Kijun-sen line. If broken, the pair is likely to continue a further bearish trajectory. Thus, the US currency is winning favor with investors for the nearest weeks especially against the pound sterling. This scenario could be disrupted by the presidential election in the US and unexpected news on the talks between London and Brussels. From the technical viewpoint, the buyers could enter the market again if the price fails to fix below the critical level. COT report Over the week of October 20-26, GBP/USD surged nearly 70 pips. However, the pair reversed downwards in the following 4 days and plunged 90 pips. In essence, such losses are not so heavy, especially for the pound sterling. According to the latest COT report, non-commercial traders closed almost 8,300 buy-contracts and 3,400 sell-contracts. Thus, the market sentiment of the non-commercial group is turning more bearish because the net position decreased by nearly 5,000 contracts. During 3 previous weeks, traders were puzzled, trying to figure out whether it makes sense to sell EUR. The second indicator shows that sentiment of non-commercial traders was turning more bullish for three weeks in a row. However, on the reporting week traders resumed selling GBP. Please be aware that minus 5,000 of the net position is too much for the pound sterling. The overall number contracts opened by the non-commercial group equals 90,000. In this context, I expect a deeper fall of the pound sterling. The fundamental background for GBP/USD can be described briefly: Brexit, the talks on the trade deal, and the presidential election in the US. This trading week, there has been no news on each of the issues. Last weekend, Brexit negotiators Michel Barnier and David Frost started a new round of the talks which should have been finished early this week. So, the talks were extended until Thursday. As a result, the parties have not unveiled any news. So, traders are at a loss about the ongoing developments and any progress. This is wrong to make any conclusions on the grounds of rumors. So, it would be better to wait for any official information from the negotiators or the UK and EU authorities. Meanwhile, they are keeping silence. What information is available is the prospects of a new lockdown in the UK. British Premier Boris Johnson warned about it this week. Restrictive measures could come into force starting from November 4 for one month. According to surveys by Johns Hopkins University, the UK is dealing with rampant coronavirus rates. The UK reported almost 25,000 new daily cases over the last three days. So, the UK could be the third country like France and Germany to tighten restrictions. Earlier, Boris Johnson said that a new lockdown was out of the question because it would trigger a severe economic downturn. As we see, the Prime Minister promptly revised his viewpoint not for the first time. Well, a new lockdown will raise the likelihood of another nosedive in the British currency because this would entail another contraction of the national output. The UK GDP could have expanded 15.1% in Q3 2020, but the economy incurred heavier losses in Q2 2020. Experts say that the UK could enter the new 2021 year on the pessimistic note, extending losses in the wake of Brexit which would be officially over on December 31. Trading plan for week of November 2-6 1)The buyers could lose any chance for the price to move upwards in the short term if the pair drops below the critical level. In case the price rebounds from the KIjun-sen line, the pair might resume the upward bias with a target at 1.3375. Meanwhile, there is a slim chance for a bounce. Moreover, don't forget about an important 61.8% fibo bounce. 2)The sellers still have more chances for developing the downtrend. They need to push the price down below the Kijun-sen line (1.2929) on the 24-hour time frame. In this case, there will be more chances for the price to go down with the first target at 1.2568. From the fundamental viewpoint, the sterling is set to extend weakness. Notes for the pictures The resistance/support levels are the target levels when opening long/short positions. You can place take profit levels next to them. Indicators Ishimoku, Bollinger bands, MACD Areas of support and resistance are the ones from where the price has rebounded or has been rejected a few times. Indicator 1 in the COT charts is a size of net positions for each category of traders. Indicator 2 in the COT charts is a size of net positions for the non-commercial group. The material has been provided by InstaForex Company - www.instaforex.com |
| Posted: 31 Oct 2020 03:31 AM PDT EUR/USD 24H
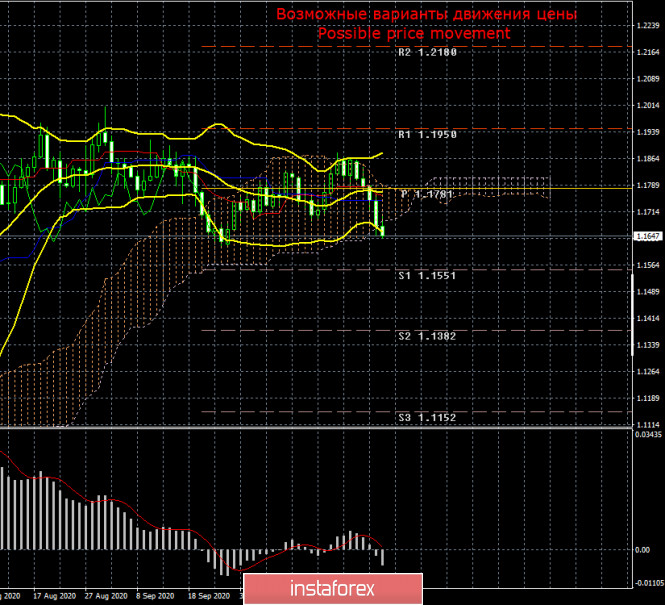
According to the 24-hour timeframe, EUR/USD eventually made some efforts to quit a sideways trading. The currency pair was closing in the red for 5 days in a row. It looks a bit strange because the presidential election will take place on Tuesday. Nevertheless, market participants decided to buy USD selling EUR. Earlier last week, EUR had just few reasons for weakness. In the middle of the week, EUR came under strong selling pressure. Meanwhile, we can draw a conclusion that the currency pair left the Ishimoku cloud that increases the odds for the development of a new downtrend. If the election in the US does not spring any surprises, the US currency will have a solid excuse for a further reinforcement. The euro has advanced 13% over the recent six months. Interestingly, the euro has not gone through a standard correction afterwards. COT report
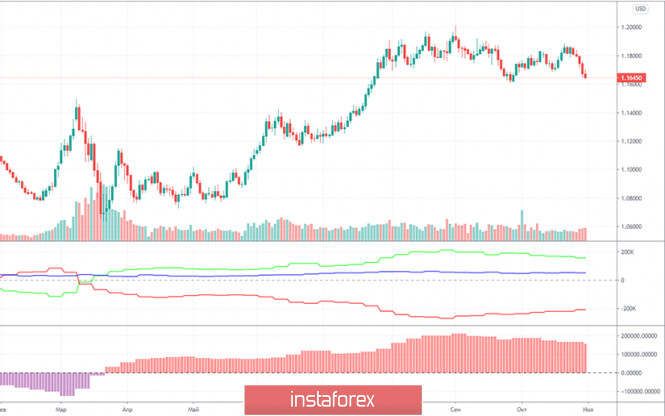
For the week of October 20-26, EUR/USD climbed almost 40 pips. After its rise, the pair sharply reversed downwards and dropped 160 pips in the following 4 days. A new COT report revealed that professional traders rushed to close buy contracts on the reported week. The number of buy-contracts with the non-commercial group decreased by nearly 12,000. At the same time, non-commercial traders closed 1,000 sell-contracts. So, the net position for this group fell instantly by 11,000. Thus, the decrease of the net positions means that market sentiment for the group of large market players is turning bearish. In fact, I told you about this sentiment change analyzing previous COT reports. Besides, I told you that the level of 1.2000 is likely to remain the high for EUR/USD. After this level had been reached, non-commercial traders decided to close buy-contracts. This is clearly seen with the first indicator in the picture (the green line). Actually, this is what is happening for two months. The green and red lines which are the net positions of both commercial and non-commercial traders are getting narrower. So, I still believe that the uptrend is over. For this reason, professional traders pushed EUR down last week. EUR is set to extend its weakness in the long term. What about the fundamental background this trading week? First, traders got to know GDP data for the US and the EU. The US national output rebounded 33.1% sequentially in Q3 2020 following a 31.4% slump. Thus, the US economy incurred total losses of nearly 10% in Q2 and Q3. When it comes to the EU, the European economy tumbled 11.8% in Q2 and recovered 12.7% in Q3 2020. Hence, the eurozone's economy losses are measured at 1-2%. Nevertheless, traders were not impressed with the European resilience, so the US dollar carried on with its advance. Perhaps, EUR was hurt by the dovish rhetoric of Christine Lagarde. She said this week that new lockdowns in Europe could again deal a blow to the EU economy. The ECB President pointed out that a recovery in the summer was fragile, incomplete, and uneven. Now economic conditions could worsen again amid the second coronavirus wave. Business activity in the service sector which is especially vulnerable has been already in a tailspin. Meanwhile, the most advanced EU economies such as Germany and France have already imposed restrictions. In other words, the pandemic factor could have knocked down EUR. Indeed, the US is not considering a second lockdown and its economy is still gaining momentum. The US dollar is highly sensitive to developments in the presidential race. So, beware of extreme volatility and price gyrations next week. Let me remind you that the primaries in the US began a few weeks ago. As of now, almost 70 million Americans have voted for their candidates. Trading plan for week of November 2-6 1)EUR/USD seems to have escapes from a trading range. However, the currency pair will greatly depend on the outcome of the major event next week. No one dares to predict what will happen in the wake of the election. Currently, the technical picture for EUR/USD suggests a further downtrend. So, a good trading idea would be to sell the pair with the target coinciding with support of 1.1551. Nevertheless, we should be ready for any twist next week. 2)If you want to buy EUR/USD, you should wait at least for the price to fix above the Kijun-sen and Senkou span B lines. Meanwhile, neither the technical charts nor the COT report nor the fundamental background indicate the prospects of an uptrend. In this context, we consider a further bearish trend as the most plausible scenario. Notes for the pictures The resistance/support levels are the target levels when opening long/short positions. You can place take profit levels next to them. Indicators Ishimoku, Bollinger bands, MACD Areas of support and resistance are the ones from where the price has rebounded or has been rejected a few times. Indicator 1 in the COT charts is a size of net positions for each category of traders. Indicator 2 in the COT charts is a size of net positions for the non-commercial group. The material has been provided by InstaForex Company - www.instaforex.com |
| You are subscribed to email updates from Forex analysis review. To stop receiving these emails, you may unsubscribe now. | Email delivery powered by Google |
| Google, 1600 Amphitheatre Parkway, Mountain View, CA 94043, United States | |
No comments:
Post a Comment