Forex analysis review |
- Gold price continues bounce after strong sell off.
- EURUSD revisits 1.1830 resistance level
- Short-term plan for NZDUSD
- Stock market: APX record losses while Europe observe gains
- Biden vs Trump: battle continues
- Bitcoin soars on news from PayPal
- November 13, 2020 : EUR/USD daily technical review and trade recommendations.
- November 13, 2020 : EUR/USD Intraday technical analysis and trade recommendations.
- November 13, 2020 : GBP/USD Intraday technical analysis and trade recommendations.
- Gold resumes rally amid uncontrolled growth in COVID-19 infection
- Good employment report did not help the US market rally on Thursday
- BTC analysis for November 13,.2020 - Bearish divergence on the daily time-frame
- Analysis of Gold for November 13,.2020 - Trading range on the Gold and potentia for the breakout. Watch for the breakout
- GBP / USD. Unsinkable: pound regains lost positions after facing consecutive blows
- EUR/USD analysis for November 13 2020 - Strong rejection of the key pivot resistance at 1.1830 and potential for downside
- Euro reacts positively amid news of COVID-19 vaccine
- GBP/USD: plan for the American session on November 13 (analysis of morning deals)
- EUR/USD: plan for the American session on November 13 (analysis of morning deals)
- Analysis of GBP/USD on November 13. Boris Johnson's quarantine is down. Great Britain needs a complete lockdown
- Analysis of EUR/USD on November 13. COVID vaccine will not change anything in the next six months to a year
- COVID-19 establishes its own rules in US stock market
- Fractal analysis for major pairs on November 13
- Technical analysis of EUR/USD for November 13, 2020
- USD/JPY descending wedge needs confirmation
- Technical analysis of GBP/USD for November 13, 2020
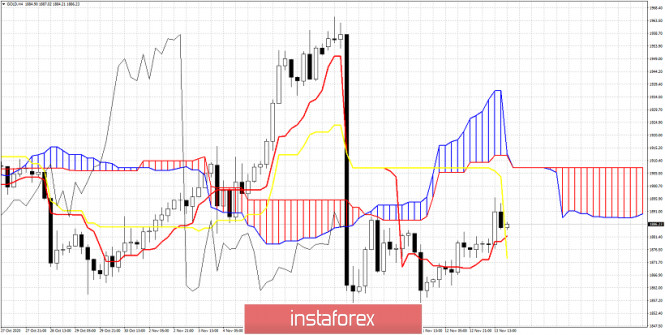
| Gold price continues bounce after strong sell off. Posted: 13 Nov 2020 01:05 PM PST Gold price continues to slide higher towards $1,900 after the sharp sell off decline from $1,960 to $1,850. Gold price is expected to continue higher towards $1,900 level as a back test as long as price is above $1,866.
Gold price is slowly sliding higher towards the Kumo resistance at $1,900. Price is in an aftershock phase. After the sharp $100 decline, Gold price is trying to find direction. The Ichimoku cloud indicator so far points to a bigger decline. The first clue that another sell off is coming is when and if price breaks below $1,866. On the other hand bulls want to recapture $1,900 and doing this would be their first step towards a bigger upward bounce. If price gets close to the Kumo and gets rejected I will prefer to open partial short positions and add below $1,866. The material has been provided by InstaForex Company - www.instaforex.com |
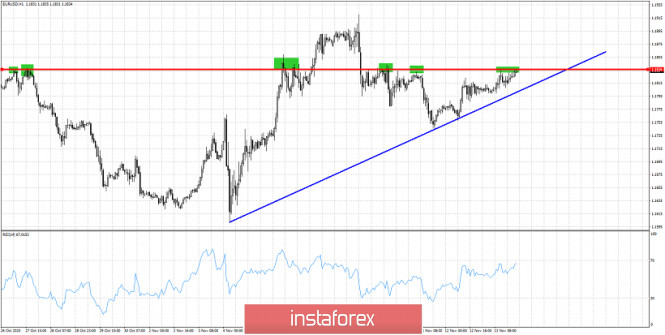
| EURUSD revisits 1.1830 resistance level Posted: 13 Nov 2020 12:52 PM PST EURUSD is challenging horizontal resistance at 1.1830. As can be seen in the chart below this price level has been important resistance before and price always found it difficult to overcome it. Will bulls manage to break above it this time or will we see a rejection?
Blue line - upward sloping support trend line Red line - horizontal resistance Green rectangles- resistance tests EURUSD continues to trade above the blue trend line support. This support is now at 1.1805. Breaking below it will increase the chances of a move towards 1.17. Until then bulls remain in control and face the 1.1830 resistance for one more time. In many occasions in the past price got rejected at this level and bulls now need to be cautious. If price continues to make higher highs and higher lows above 1.1830 we should next expect EURUSD to reach 1.20-1.21. The material has been provided by InstaForex Company - www.instaforex.com |
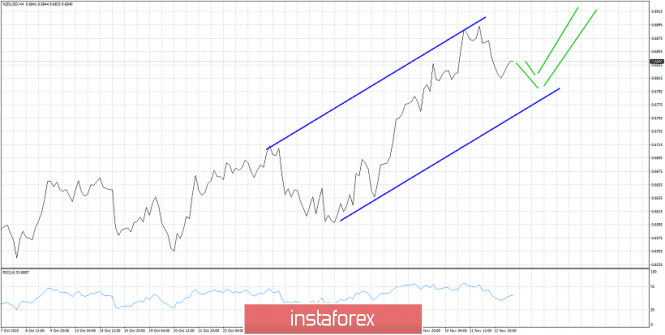
| Posted: 13 Nov 2020 12:46 PM PST NZDUSD is pulling back from the recent top at 0.69. Price however remains inside a bullish channel and this makes us believe that the current pull back is only temporary and a pause to the bigger up trend towards 0.6920-0.6950.
Green lines - expected path NZDUSD is forming higher highs and higher lows since late September when it was trading around 0.65. Price has made a clear upward extension from 0.66 to 0.69 and now we are in a pull back phase around 0.6820. We expect price to eventually continue its upward trend towards 0.6930. A move closer to the lower channel boundary can not be ruled out currently. A pull back towards that level will be a buying opportunity. Support is found at 0.68 and next at 0.6730. The material has been provided by InstaForex Company - www.instaforex.com |
| Stock market: APX record losses while Europe observe gains Posted: 13 Nov 2020 06:35 AM PST
Asia-Pacific Stock Exchanges (APX) were mostly down Friday morning. The major stock indexes show negative dynamics due to growing concerns about the uncontrolled increase in the growth of coronavirus infection in the world and in certain countries where the situation is particularly difficult. Investors are afraid of the possible introduction of a strict quarantine, which can seriously affect the economic development of regions in general and individual sectors of the economy in particular. In any case, restrictions have already put significant pressure on the economic development of countries, slowing down all the main processes of growth and recovery from the crisis that occurred after the first wave of the COVID-19 pandemic. New anti-records has rattled markets and quickly sobered them after not too justified hopes for the release of the vaccine in the near future. This is due to a number of reasons, the appearance of a drug even in the current year for general use is almost impossible. In this regard, the hype on the news of its successful clinical trials was absolutely unjustified, and the growth that occurred against this background sooner or later had to come to naught. Japan's Nikkei 225 Index sank 0.65%. However, it is worth noting that over the past week it has made great progress, even being able to reach its maximum indicators for the last more than twenty-nine years. China's Shanghai Composite index parted immediately by 1.4%. The Hong Kong Hang Seng index supported the negative trend and became lower by 0.6%. Significant pressure on the Chinese markets was exerted by the decree of the current US President Donald Trump, banning purchases from American individuals and legal entities of securities of Chinese companies operating in the military sphere. However, the most important thing has not yet been done: a specific list of such companies is not available to the general public. The Australian S&P/ASX 200 index fell 0.2% on Friday morning. At the same time, it should be noted that during the whole week it demonstrated good positive dynamics, which allowed it to increase a total of 3.5%. Therefore, Friday's fall can be considered an inevitable correction. South Korea's KOSPI Index rose 0.6% and became the only regional indicator that went against the negative trend. Meanwhile, growth has been noted on European stock exchanges on Friday, which does not stop, even despite grave concerns on the rapid increase in the number of COVID-19 cases in the region. The incidence rate of COVID-19 is only increasing, and daily infection and mortality rates continue to break records almost every day. The governments of the countries are beginning to discuss the possibility of strengthening the already tough quarantine measures introduced on the territory of individual states. In particular, the Italian authorities are discussing the issue of introducing a nationwide self-isolation regime. If the situation in Italy does not show signs of any improvement, the government will be forced to take this last resort. In the meantime, self-isolation operates in some particularly affected areas of the country. The authorities in France have already decided to extend the travel restrictions by at least two weeks. The stabilization that has been achieved recently may come to naught if the country lifts the lockdown at present. Germany and the UK also registered new anti-records. The daily new cases in Germany already increased to 23,500, while the UK records almost 33,500 new cases per day. All these promises absolutely nothing good. Nevertheless, the epidemiological situation is not yet reflected in the movement of the major stock indexes, which over the current week were able to reach their maximum values over the past eight months. The general index of large enterprises in the European region STOXX Europe 600 gained 0.17% and began to consolidate at around 385.82 points. The German DAX Index added 0.3%. France's CAC 40 Index jumped 0.48%. Italy's FTSE MIB Index added 0.45%. Spain's IBEX 35 Index was up 0.9% which took the lead in the growth. The UK FTSE 100 Index sank 0.04%, which was the only negative on Friday. The material has been provided by InstaForex Company - www.instaforex.com |
| Biden vs Trump: battle continues Posted: 13 Nov 2020 05:37 AM PST
On November 7, after Joe Biden had announced his win, the authorities of more than 50 countries began to congratulate him on his victory. The prime minister of Fiji was the first to express his congratulations. He was followed by the heads of Ireland, Canada, Greece, Belgium, Great Britain, Germany, Finland, Austria, Spain, France, Argentina, Italy, Iceland, Poland, Ukraine, Sweden, Denmark and other countries. The NATO Secretary General, the President of the European Union, and the Director General of the World Health Organization also sent their best wishes. Today, it became known that China also congratulated President-elect Joe Biden. According to Reuters, Biden has 279 electoral votes out of 538. In order to win the election, 270 votes are needed. Trump has only 217. Today, the news broke that Biden also won in the state of Arizona, where it took a long time to determine the winner - both candidates were on par in terms of the number of votes. Same thing happened in Nevada and Pennsylvania, where Biden eventually took the lead. The final results are still unknown in North Carolina and Georgia. Moreover, in the state of Georgia ballots are going to be counted manually in each county due to Donald Trump's allegations of fraud. Consequently, the final results will be known by November 20. According to CNN, in Georgia, Joe Biden initially got 49.5% of the vote, and Donald Trump received 49.2%. However, many experts believe that the recount is unlikely to change anything, since one state will not be enough. The final election results will be officially announced on December 8. Until that day, all disputes regarding the counting of votes must be settled. Donald Trump is still refusing to recognize Biden's victory and intends to challenge the election results through the courts. Trump assures the public and judges that his observers were not allowed to the polling stations in Michigan, and that illegal ballots were counted in Pennsylvania. However, direct evidence of violations was never presented. So, there is hardly any hope for Trump to win the election and prove anything in court. One way or another, Biden is currently leading by a margin of several tens of thousands of votes in several states at once. Therefore, an organized recount of votes will hardly change the situation. If Joe Biden wins the election, Donald Trump will remain President of the United States until January 20, 2021. Before that, he may well appoint key ministers and issue executive orders. A new president usually appoints about 4 thousand civil servants, of whom 1.6 thousand candidates will be subject to thorough scrutiny by the Senate before taking office, without whose approval their appointment is impossible. Today, the majority in the Senate belongs to the Republicans. The Biden administration, if he ultimately wins, will have to prepare an agenda for the near future, that is, to voice specific reforms that it intends to implement in the first place. This will be followed by the approval of new candidates for the main positions in the Senate. The team of the president-elect has a right to receive financial assistance from the state. Biden's transition team, by the way, includes about 500 people. The allocation of money is supervised by the General Services Administration, or GSA. The government has reserved about $6 million to organize the transit of power. GSA is in no hurry to provide these funds to Joe Biden, since his victory is still only rumored and not officially approved by the states and the Congress. However, Biden said that he was not going to rely on financial assistance from the state, planning to come to power without the support of the current administration. The material has been provided by InstaForex Company - www.instaforex.com |
| Bitcoin soars on news from PayPal Posted: 13 Nov 2020 05:37 AM PST On Friday, the most popular virtual currency has advanced by 3% and is moving towards $17,000. According to the CoinMarketCap website, bitcoin rose by 3.23% to $16,279. 253 on Friday morning. The cryptocurrency accounts for approximately 65.3% of the market.
Experts suggest that yesterday's PayPal statement has been the reason for such significant growth in the digital currency. On Thursday, the company announced that from November 12, the owners of its accounts in the United States will be able to buy, store, and sell cryptocurrencies directly through the payment service. The list of digital coins include bitcoin, bitcoin cash, ethereum, and litecoin. Transactions involving cryptocurrencies will be automatically converted to fiat, which means that merchants will not have to go beyond the classical system they are used to. PayPal partnered with Paxos and received a limited license from the NYS Department of Financial Services to implement the new feature. The weekly limit on the purchase of cryptocurrencies, which PayPal had previously planned to limit to $10,000 per week, has been raised to $ 20,000. However, analysts argue that such an increase in the value of bitcoin will be long-term. However, in the foreseeable future, before a reversal or correction, we will possibly be able to observe a 10% rise in price. Most likely, in the near future, market participants in the traditional and cryptocurrency markets will be holding on to their assets. Nevertheless, the trend remains bullish today. If bitcoin closes above $16,000 or even approaches $17,000 at the end of the trading week, the rally will probably start to $20,000. Interestingly, since the beginning of 2020, bitcoin has increased by 127%. By the end of this year, it may cost more than $20,000, or less than $ 5,000. The material has been provided by InstaForex Company - www.instaforex.com |
| November 13, 2020 : EUR/USD daily technical review and trade recommendations. Posted: 13 Nov 2020 04:54 AM PST
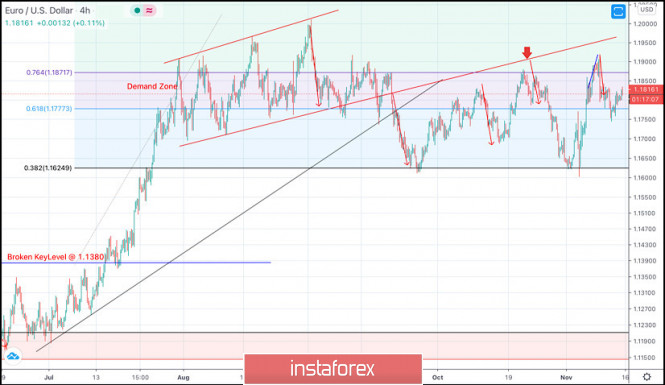
Until October 13, temporary breakout above 1.1750 was demonstrated within the depicted ascending channel. This indicated high probability of bullish continuation towards 1.1880. However, downside pressure pushed the EUR/USD pair towards 1.1700 where significant BUYING Pressure Existed. This was followed by another quick upside movement towards 1.1880-1.1900. The price zone around 1.1880-1.1900 constituted a KEY Price-Zone as it corresponded to the backside of the depicted broken ascending channel where significant bearish pressure and a reversal Head & Shoulders pattern were demonstrated. Recently, Two opportunities for SELL Entries were offered upon the recent upside movement towards 1.1880-1.1900. All target levels were achieved. EXIT LEVEL was reached around 1.1720. Early signs of bullish reversal were demonstrated around the recent price levels of 1.1600. Shortly after, the EUR/USD pair has demonstrated a significant BUYING Pattern after the recent upside breakout above the depicted price zone (1.1750-1.1780) was achieved. As mentioned in the previous article, the pair has targeted the price levels around 1.1920 which exerted considerable bearish pressure bringing the pair back towards 1.1800 which constitutes a prominent KEY-Zone for the EURUSD pair. Trade Recommendations :- Currently, the price zone around 1.1780-1.1800 stands as a significant SUPPORT-Zone to be watched for bullish rejection and a valid BUY Position. Exit level should be placed below 1.1750. The material has been provided by InstaForex Company - www.instaforex.com |
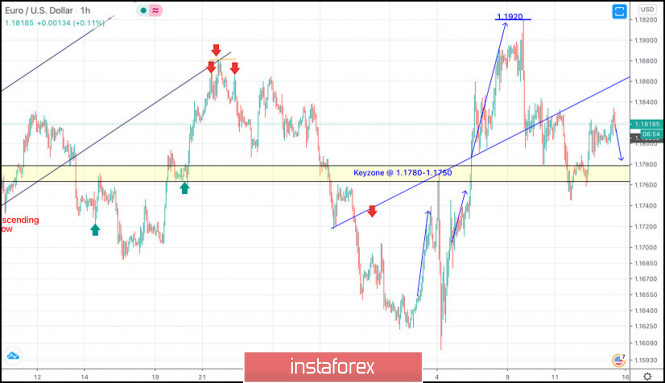
| November 13, 2020 : EUR/USD Intraday technical analysis and trade recommendations. Posted: 13 Nov 2020 04:50 AM PST
Intraday traders should have noticed the recent bearish closure below 1.1700. This indicated bearish domination for the market on the short-term. However, the EURUSD pair has failed to maintain sufficient bearish momentum below 1.1625 (38% Fibonacci Level). Instead, another bullish breakout was being demonstrated towards 1.1870 which corresponds to 76% Fibonacci Level. As mentioned in previous articles, the price zone of 1.1870-1.1900 stood as a solid SUPPLY Zone corresponding to the backside of the broken channel. Moreover, the recent bearish H4 candlestick closure below 1.1770 was mentioned in previous articles to indicate a valid short-term SELL Signal. All bearish targets were already reached at 1.1700 and 1.1630 where the current bullish recovery was initiated. The recent bullish pullback towards the price zone of 1.1870-1.1900 was supposed to be considered for signs of bearish rejection and another valid SELL Entry. S/L should be placed just above 1.1950. Bearish closure and persistence below 1.1777 (61.8% Fibonacci Level) is needed to enhance further bearish decline at least towards 1.1630. Otherwise, another bullish pullback towards 1.1870-1.1900 shouldn't be excluded. The material has been provided by InstaForex Company - www.instaforex.com |
| November 13, 2020 : GBP/USD Intraday technical analysis and trade recommendations. Posted: 13 Nov 2020 04:48 AM PST
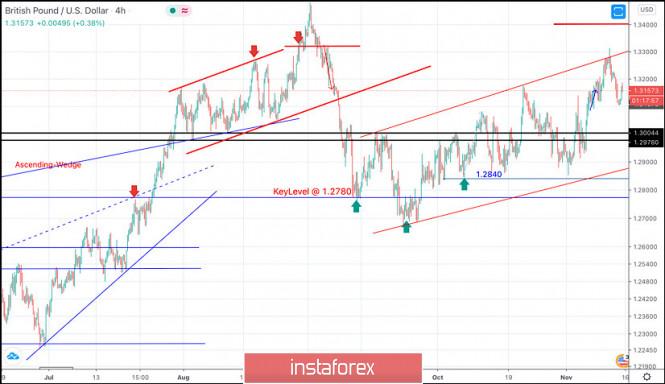
The price zone around the previous channel's upper limit around 1.3100-1.3150 constituted an Intraday Key-Zone to offer temporary bearish pressure on the GBPUSD Pair. However, Bullish Persistence above the mentioned price zone was supposed to allow bullish pullback to pursue towards 1.3400 as a final projection target for the suggested bullish pattern. However, the GBP/USD pair failed to do so, Instead, another bearish movement was targeting the price level of 1.2840 where bullish SUPPORT existed allowing another bullish movement initially towards 1.3000 which failed to maintain sufficient bearish momentum. That's why, the recent bullish breakout above 1.3000 has enabled further bullish advancement towards 1.3250-1.3270 where the upper limit of the current movement channel comes to meet the pair. Upon any upcoming bullish pullback, rice action should be watched around the price levels of (1.3250-1.3270) for signs of bearish pressure as a valid SELL Entry can be offered. Initial bearish target is located at 1.3000. While S/L should be placed above 1.3300. The material has been provided by InstaForex Company - www.instaforex.com |
| Gold resumes rally amid uncontrolled growth in COVID-19 infection Posted: 13 Nov 2020 04:40 AM PST Gold prices began to rise amid statements from some countries about a record number of coronavirus infections. Thus, the price of December gold futures on the Comex New York Stock Exchange increased by 0.13% ($ 2.45), to $ 1875.75 per troy ounce. Meanwhile, December silver futures fell 0.02% to $ 24.3 an ounce.
Gold prices started to rise slightly after a sharp drop earlier in the week on information about successful trials of the COVID-19 vaccine. On Friday, a kind of support for the precious metal, which is historically considered a more reliable asset, is provided by the deterioration of the general epidemiological situation in the world. On Thursday, a record increase in cases of coronavirus was recorded in Japan as daily new cases rise to 1,660. The US, on the other hand, already soared to 150,000 new cases per day. Since the spring of this year, the UK confirms 33,500 new daily cases. The epidemiological situation remains difficult in a number of European countries, where strict restrictive measures were introduced to combat the increase in the incidence. In this regard, there have been serious changes in the behavior of market participants. Investors began to understand that the mass introduction of the vaccine will take a long time, and there is a huge need for it today. Experts share the concerns of market participants, but they are in a hurry to make positive forecasts for the long term. Analysts believe that the price of gold will fluctuate in a range in the coming months, while real rates will fall even lower next year, which will strengthen the "reflationary history" and increase demand for the most popular precious metal. As a rule, investors buy gold to hedge the risks of a depreciation of the dollar, so the value of the precious metal will show a high sensitivity to the dynamics of real short-term rates. Experts emphasize that the currency market behaves in about the same way. In addition, analysts note the trend in demand for gold in large developing countries and assume that this trend in the precious metals market will continue into the next year. The material has been provided by InstaForex Company - www.instaforex.com |
| Good employment report did not help the US market rally on Thursday Posted: 13 Nov 2020 04:40 AM PST
It is also worth noting that the Democrats of the House of Representatives, before the election, sought a package of much larger size, namely $ 2.4 trillion. However, lengthy negotiations between Democratic Party representative Nancy Pelosi and Republican Party representative Steven Mnuchin have stalled. The report of the US Department of Labor on employment, which turned out to be better than expected, also did not affect the market positively. For the first time in a week (up to November 7 inclusive), 709 thousand applications for unemployment benefits were submitted, which is 48 thousand less than 757 thousand filed in the previous week, and also less than Econoday's forecast, which is 737 thousand. Coronavirus news does not add stability. The number of COVID-19 infections worldwide has exceeded 52.6 million, and the death toll has exceeded 1.29 million. In the United States, today the number of confirmed cases of diseases since the beginning of the pandemic is over 10.7 million, and the death toll is approaching 248 thousand. The Nasdaq has performed well for the second day in a row, despite a slight decline of 0.7%, it remains above its 50-day moving average. Leading Chinese e-commerce platform Pinduoduo, which soared 20.6% on strong earnings report, and vaccine developer Moderna. However, the S&P 500 fell 1%. The main outsider was the cruise line Carnival, which went down by almost 8%. All sectors went into the red zone, and the worst was the energy sector, as well as industrial and financial companies. The growth was observed only in the shares of four companies, including UnitedHealth, which added about 0.8%, and Johnson & Johnson, which rose in price by 0.3%. The material has been provided by InstaForex Company - www.instaforex.com |
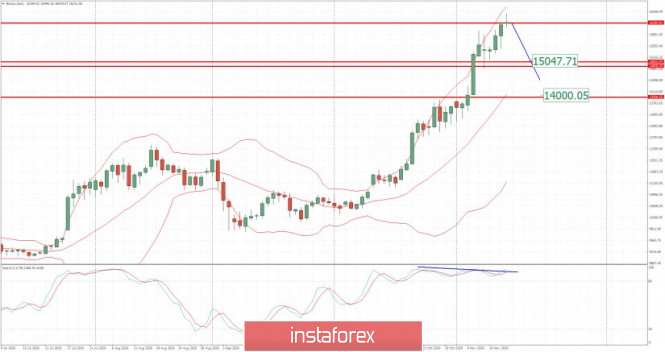
| BTC analysis for November 13,.2020 - Bearish divergence on the daily time-frame Posted: 13 Nov 2020 04:20 AM PST Further Development
Analyzing the current trading chart of BTC, I found that BTC is building bearish divergence on the daily time-frame, which is sign that buyers got exhausted and that there is potential downside rotation, Watch for selling opportunities with the downside targets at $15,050 and at the price of $14,00 Resistance is set at $16,500 The trend is still bullish but we see early signs of the divergence... The material has been provided by InstaForex Company - www.instaforex.com |
| Posted: 13 Nov 2020 04:14 AM PST Eurozone Q3 secondary GDP reading +12.6% vs +12.7% q/q prelim Latest data released by Eurostat - 13 November 2020GDP -4.4% vs -4.3% y/y prelim Little change to the initial releases as this just reaffirms the strong bounce back in Q3, though the market focus is on the outlook towards the year-end and the heightened virus situation across the region currently. For some added context, Eurozone GDP is still 4.4% below pre-pandemic levels after the boost seen in Q3 as per the above.
Further Development
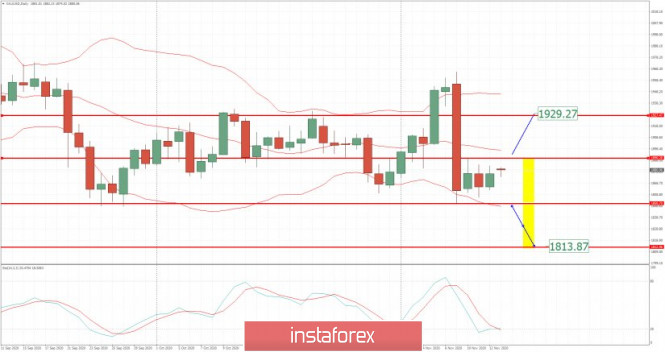
Analyzing the current trading chart of Gold, I found that Gold is in balancing process and that I would wait for the breakout to confirm further direction. 1-Day relative strength performance Finviz
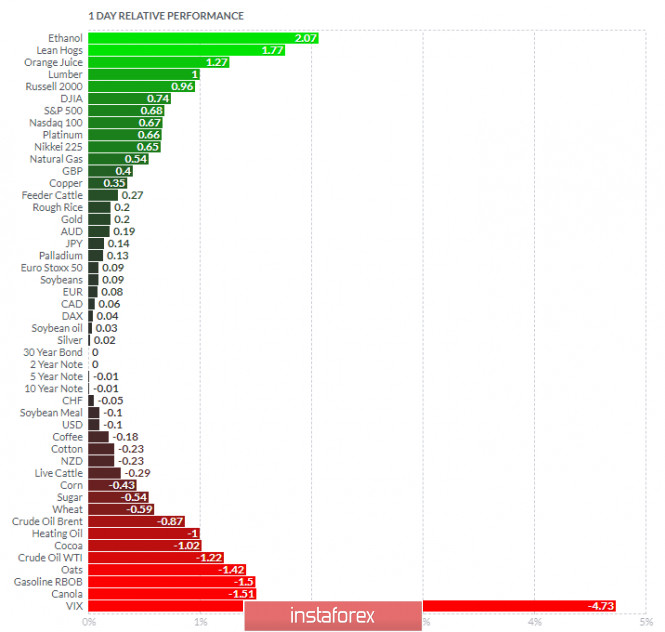
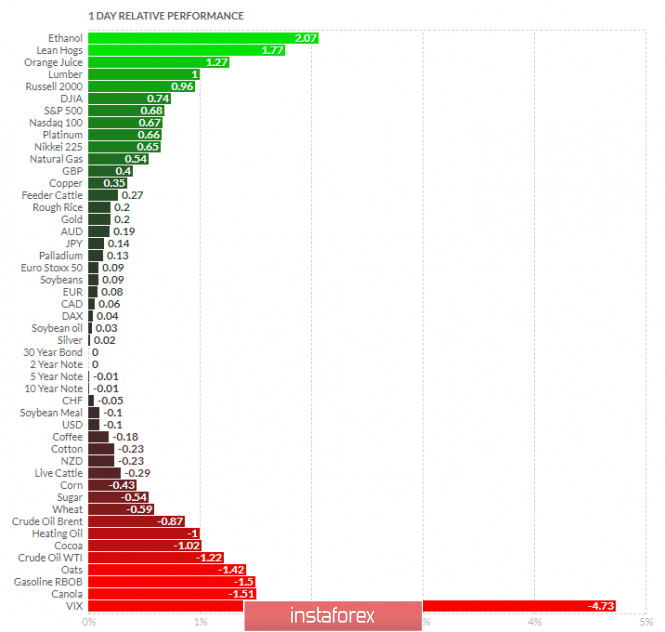
Based on the graph above I found that on the top of the list we got Ethanol and VIX and on the bottom Lean Hogs and Canola. Gold is positive on the list but with no strong momentum. Key Levels: Resistance: $1,890 Support levels: $1,850 The material has been provided by InstaForex Company - www.instaforex.com |
| GBP / USD. Unsinkable: pound regains lost positions after facing consecutive blows Posted: 13 Nov 2020 04:12 AM PST The pound sterling received a triple blow on Thursday against the background of coronavirus anti-records. Disappointing macroeconomic reports were published in Britain, which was in the "red zone", falling short of the forecast values. An unpleasant bonus to all this was Brexit, which again reminded of itself in a negative way. As a result of this pressure, the GBP/USD pair significantly weakened its positions, losing more than 250 points and falling to the base of the 31st figure. However, it is still too early to write off the pound: as practice shows, the pound is recovering quite quickly after such fundamental blows. For example, on Friday, the "bear holiday" has come to an end: buyers have taken the initiative and are gradually regaining their lost positions. Let's start with the UK macroeconomic reports. It is necessary to immediately make a reservation: the fact that the indicators came out worse than forecasted does not at all negate the fact that the British economy showed significant growth relative to the failed second quarter. Thus, in the third quarter, the volume of British GDP increased by 15.5% in quarterly terms against the forecast of growth by 16%. In September, the country's economy grew by only 1.1%, while experts expected to see this figure slightly higher by at least 1.8%.
This result, on the one hand, indicates positive trends: against the background of quarantine restrictions, which were not fully lifted during the third quarter, the British economy managed to show good growth. On the other hand, the recovery process was not as breakthrough as experts expected. For this reason, the pound did not become the beneficiary of Friday's release – the published result disappointed investors with its "red color". The same can be said about the rest of the releases. Industrial production was expected to rise by almost 1.5% in September (on a monthly basis), but de facto rose only by 0.5%. The processing industry should have shown similar dynamics (+ 1.1% m / m), while in reality the indicator barely rose above zero (+ 0.2%). We were only pleased with the construction industry where the indicator grew to almost 3%, while the forecast growth was up to 2.1%. But the service sector has traditionally demonstrated weak growth. This is understandable, given the collapse of the tourism and restaurant business in Britain: in September, the British authorities have already begun to tighten quarantine restrictions. Thus, the release of Thursday's data could not provide support for the pound, despite the actual growth of the main indicators. Experts expected to see stronger numbers, so the market's reaction to the published numbers was negative. In addition, the projected economic downturn in the fourth quarter will offset any gains in the third quarter amid the latest "coronavirus trends". So, over the past day in the UK, the coronavirus was found in 33,470 people. This is a record figure. The previous anti-record was set almost a month ago - on October 21 - with a daily increase of 26,000. Commenting on these numbers, Prime Minister Boris Johnson said that despite hopes for a vaccine, "the British have not yet emerged from the coronavirus forest." Let me remind you that on November 4, the British government introduced a new lockdown in Britain, approximately until the beginning of December. At the moment, restaurants and pubs, gyms, and shops that do not sell essential goods have stopped operating in the country. However, the rate of spread of the incidence is not slowing down - on the contrary, the country sets new records for both the number of cases and the number of deaths from the consequences of COVID-19. This indicates, that quarantine restrictions in Britain will either be extended until January or will be tightened in the near future. A combined option is not excluded. Brexit also exerts some pressure on the pound. At the moment, the parties are continuing negotiations, so traders are quite sensitive to rumors related to this process. There is no official news about any progress (or regression), so the market is forced to draw its own conclusions based on the available fact. For example, investors negatively interpreted the fact that the parties do not have time to agree on the framework terms of the deal before the deadline, which was set at the end of the October EU summit (November 15). It is known that the negotiators took a few more days (according to rumors - until next Thursday), but it is not known at what stage the negotiation process is - which issues have already been agreed and which have remained unresolved. But the very fact of prolonging the negotiations had a negative impact on the pound sterling.
Nevertheless, the GBP/USD bears failed to develop the southern trend. After a two-day fall, the pound recovered and gradually gained its lost points. The fact is that the information vacuum that has formed around the negotiation process plays not only against the pound but also in its favor – no matter how paradoxical it may sound. After all, traders are well aware that final negotiations are underway, and if the parties still find a common denominator, they will enter into a deal. In this case, the pound will shoot up, regardless of the" health " of the dollar or other fundamental factors. Therefore, traders do not risk playing against the sterling as the pendulum may swing in one direction or the other. Thus, in my opinion, the pound has passed another "stress test". Despite the pressure of many fundamental factors, it has not collapsed below the 1.3100 mark paired with the dollar, and on Friday, it is trying to turn the situation in its favor. All this indicates the priority of long positions on the GBP/USD pair, with the main goal of 1.3270 (the upper line of the Bollinger Bands indicator on the daily chart). Stop loss can be placed not at the "round" mark of 1.3100, but slightly lower, at 1.3080 (the upper border of the Kumo cloud coincides with the middle line of the Bollinger Bands indicator on the same timeframe). The material has been provided by InstaForex Company - www.instaforex.com |
| Posted: 13 Nov 2020 04:04 AM PST Eurozone Q3 secondary GDP reading +12.6% vs +12.7% q/q prelim Latest data released by Eurostat - 13 November 2020GDP -4.4% vs -4.3% y/y prelim Little change to the initial releases as this just reaffirms the strong bounce back in Q3, though the market focus is on the outlook towards the year-end and the heightened virus situation across the region currently. For some added context, Eurozone GDP is still 4.4% below pre-pandemic levels after the boost seen in Q3 as per the above. Further Development
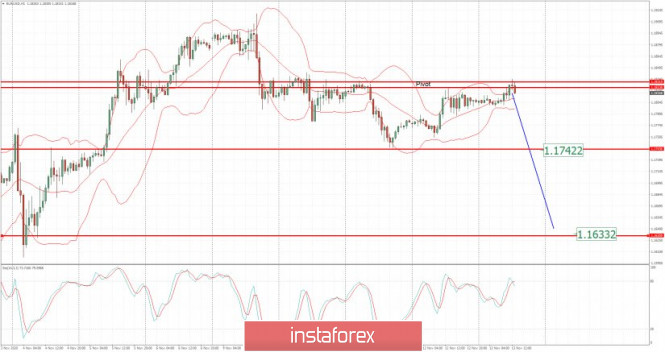
Analyzing the current trading chart of EUR , I found that there was the strong rejection of the pivot resistance at 1,1830, which is strong sign of the selling power. Watch for selling opportunities with the targets at 1,1740 and 1,1630 1-Day relative strength performance Finviz
Based on the graph above I found that on the top of the list we got Ethanol and VIX and on the bottom Lean Hogs and Canola. Key Levels: Resistance: 1,1830 Support levels: 1,1740 and 1,1630 The material has been provided by InstaForex Company - www.instaforex.com |
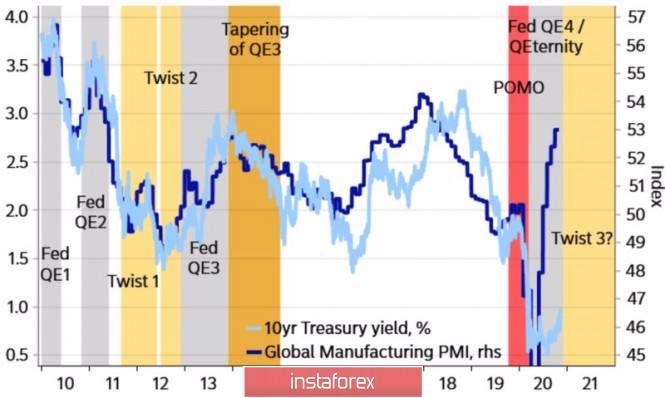
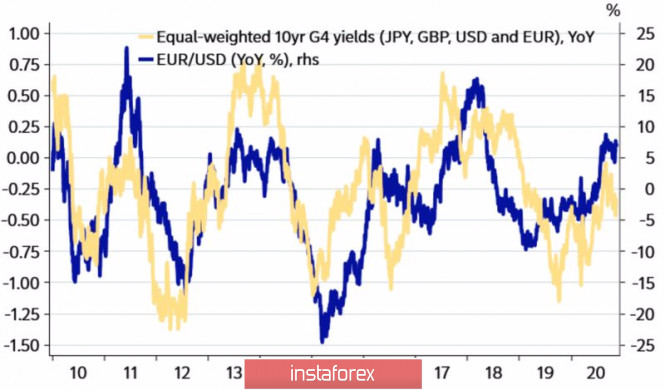
| Euro reacts positively amid news of COVID-19 vaccine Posted: 13 Nov 2020 04:02 AM PST The main news of the second week of November was not Joe Biden's victory in the elections, but the message of positive test results for the COVID-19 vaccine. The market responded with a boom in stock indexes and US Treasury yields, clearly demonstrating how it would behave if dreams of a former life became a reality. Yes, a little later it was understood that more than one month would pass from testing to vaccine introduction, but the markets are growing on expectations, which allows us to speak about the limited potential of EURUSD correction. The euro has the prerequisites for strengthening despite the second wave of the pandemic in Europe, the restrictions imposed there, and the optimistic forecasts of the Wall Street Journal experts about the US economy. In their opinion, the US GDP will decline in 2020 not by 3.6%, as predicted in October, but by 2.7%. Most likely, the United States will be able to avoid a double recession, the risks of which hang like a sword of Damocles over the eurozone. If we add to this the ECB's intention to expand the monetary stimulus in December by at least € 500 billion, a natural question arises, why is the euro growing? The answer must be sought in the hope of defeating COVID-19. Despite the pessimistic statements of the Fed officials, warning that the next few months will be very difficult for the US, business activity on expectations of vaccinations is able to continue the rally. If so, then bond yields will rise after it. Growth in global debt market rates is good news for EURUSD bulls. Dynamics of global business activity and yields on US Treasury bonds:
Dynamics of EURUSD and bond yields:
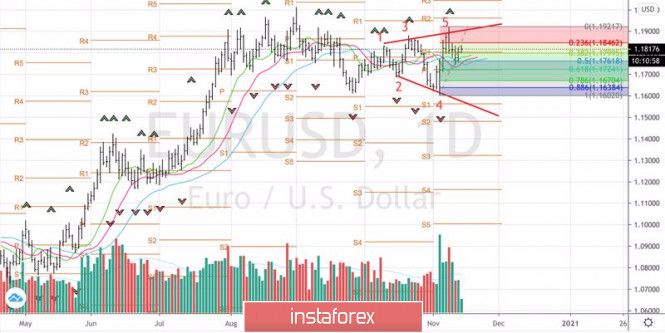
Thus, the market believes that the glass is half full. Ignoring the facts that a lot of time will pass before universal vaccination and dreams of seeing a world without COVID-19. This is expressed in the desire to dump safe-haven assets, which leads to higher yields and a strengthening of the euro despite the difficult epidemiological situation in the rest of Europe, the risks of a double recession in the eurozone, and the ECB's intentions to be present not only in the first but also in the second wave of the pandemic. This alignment of forces suggests a tendency for EURUSD to consolidate in the range of 1.16-1.2. So far, the European Central Bank has the strength to keep the bulls from advancing above the psychologically important level of 1.2. Both verbal interventions and hints of expanding quantitative easing programs will continue to be used. I do not exclude that Christine Lagarde and her colleagues will allow themselves to talk about cutting rates. Alas, they are unable to break the bullish trend in the main currency pair. Moreover, if Joe Biden begins to cancel the tariffs imposed by Donald Trump on imports from China, the euro will rush to $ 1.25. Technically, a Broadening Wedge pattern was formed on the daily EURUSD chart. A rebound from the 50% Fibonacci level from wave 4-5 with a subsequent return above 38.2% could serve as a signal to buy. Now longs can be formed from the level of 23.6% or 1.1845. In doing so, you need to be extremely careful and keep in mind the potential reaction of the ECB to the approach of the pair to the level of 1.2. EURUSD daily chart:
|
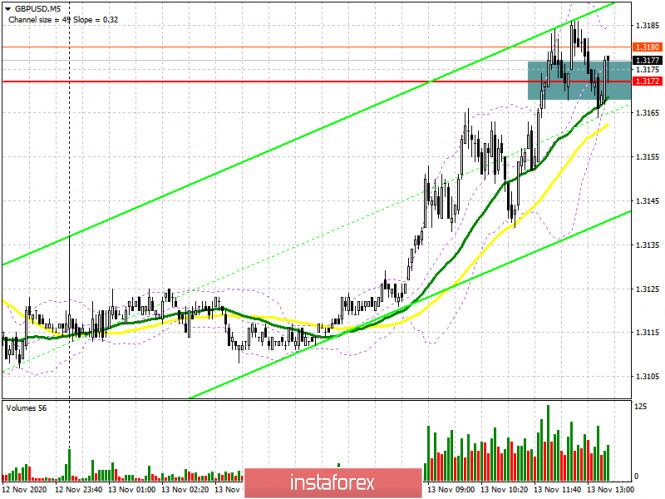
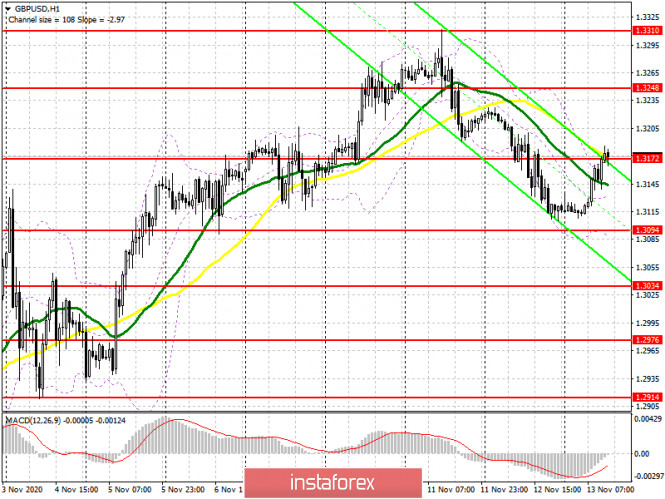
| GBP/USD: plan for the American session on November 13 (analysis of morning deals) Posted: 13 Nov 2020 03:56 AM PST To open long positions on GBP/USD, you need to: The growth of the pound in the first half of the day was not surprising. It was expected that buyers will try to recover from yesterday's fall, but as you can see on the 5-minute chart, problems with growth above 1.3172 remain. It was not possible to wait for the formation of an adequate entry point from this level, which indicates an active struggle.
All that is required for buyers of the pound in the afternoon is weak data on consumer confidence in the US and inflation expectations of the University of Michigan, which will lead to a real consolidation of GBP/USD above the level of 1.3172. However, I recommend opening long positions from it only after testing this level from top to bottom. In this scenario, we can expect a re-growth of GBP/USD to the resistance area of 1.3248, and a longer-term goal will be a maximum of 1.3310, where I recommend fixing the profits. In a scenario of falling GBP/USD in the second half of the day, it is best not to rush into purchases, but wait for the test of the major support at 1.3094 and buy the pound there on a rebound with the aim of a 30-40 point correction within the day. To open short positions on GBP/USD, you need to: Bears are still struggling to maintain control over the level of 1.3172, and good fundamental data on the US economy should help them in this. However, I recommend opening short positions in the area of 1.3172 only after the GBP/USD returns to this level and consolidates under it. Testing it from the bottom up will be a good sell signal. In this scenario, you can count on a downward trend in the area of 1.3094, with the first test of which you can observe a slight rebound of the euro up. A longer-term goal is the support of 1.3034, where I recommend taking the profit. If the data on US producer prices disappoints, and the pound continues its growth above the resistance of 1.3172, it is best not to rush into sales, but wait for the test of a larger maximum of 1.3248 in the expectation of a correction of 30-40 points within the day.
Let me remind you that in the COT reports (Commitment of Traders) for November 3, there was a reduction in long positions and a slight increase in short ones. Long non-commercial positions fell from 31,799 to 27,701. At the same time, short non-commercial positions rose just slightly to 38,928 from 38,459. As a result, the negative non-commercial net position was -11,227 against -6,660 a week earlier, which indicates that the sellers of the British pound retain control and their minimal advantage in the current situation. Signals of indicators: Moving averages Trading is conducted around 30 and 50 daily averages, which indicates an active struggle between buyers and sellers. Note: The period and prices of moving averages are considered by the author on the hourly chart H1 and differ from the general definition of classic daily moving averages on the daily chart D1. Only a break of the lower border of the indicator in the area of 1.3094 will lead to a new downward wave of the pair. Description of indicators
|
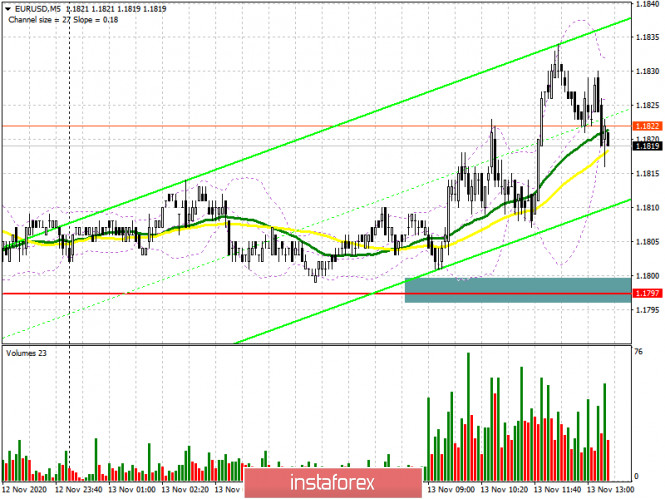
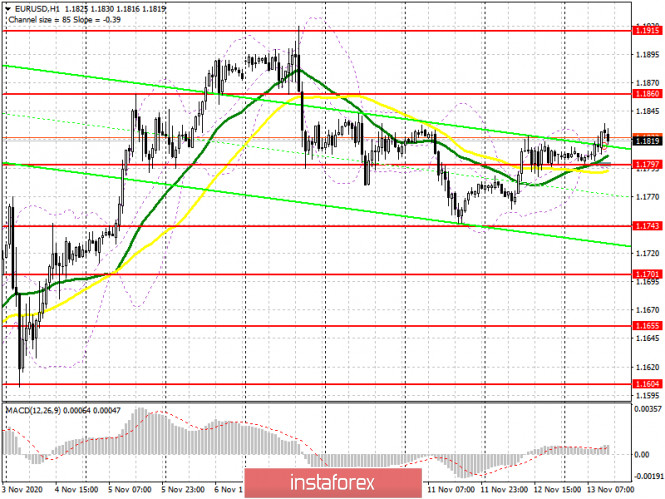
| EUR/USD: plan for the American session on November 13 (analysis of morning deals) Posted: 13 Nov 2020 03:53 AM PST To open long positions on EURUSD, you need: In the first half of the day, there were no signals to enter the market. The 5-minute chart shows that the price did not reach the designated support level of 1.1797, not to mention any false breakout formation. The released data on the GDP growth rate in the Eurozone turned out to be worse than economists' forecasts, which limited the pair's upward potential while maintaining low market volatility and a narrow side channel. It looks like the trading week will end around the level of 1.1797, around which the main struggle for direction was conducted.
From a technical point of view, nothing has changed. The emphasis in the second half of the day will be shifted to the important data on the US economy that can restore pressure on the euro. If buyers of the euro still manage to protect the support of 1.1797, then the next formation of a false breakout there will be a good entry point into long positions to further restore the pair to the resistance area of 1.1860, where I recommend fixing the profits. The longer-term target will be a weekly high of 1.1915. If the bulls do not show much activity, and the data turns out to be much better than economists' forecasts, a return of EUR/USD to the level of 1.1797 is not excluded. In this case, in the second half of the day, buyers will focus on protecting the support of 1.1743. However, it is only possible to open long positions on the first test based on a correction of 15-20 points within the day. A larger reversal in favor of buyers will occur if they manage to form a false breakout at 1.1743. To open short positions on EURUSD, you need: The initial goal of sellers is the return of the level of 1.1797 that they managed to miss yesterday in the morning and failed to return after the release of weak fundamental statistics on inflation in the United States. Only the consolidation below 1.1797 and its test from the reverse side from bottom to top forms a more convenient entry point for the continuation of the downward trend. This will happen only after the release of good indicators on consumer confidence in the United States and inflation expectations of the University of Michigan. In this case, the nearest target of the bears will be at least 1.1743. A test of this level will indicate the actual formation of a new bear market for EUR/USD. However, only a break in this area will increase the pressure on the pair and quickly push it to a minimum of 1.1701, where I recommend fixing the profits. If the bulls are stronger and continue to push the pair up, then it is best not to rush to sell but to wait for the update of the larger resistance of 1.1860. I recommend selling EUR/USD immediately for a rebound from the maximum of 1.1915, based on a correction of 15-20 points within the day.
Let me remind you that the COT report (Commitment of Traders) for November 3 recorded a reduction in long positions and an increase in short positions. But despite this, buyers of risky assets believe in the continuation of the bull market, although they prefer to act cautiously. Thus, long non-commercial positions fell from 217,443 to 208,237, while short non-commercial positions rose to 67,888 from 61,888. The total non-commercial net position fell to 140,349 from 155,555 a week earlier. It should be noted that the bullish sentiment on the euro in the medium term remains rather high, especially after the victory of Joe Biden, who intends to endow the American economy with the next largest monetary aid package for more than $ 2 trillion. Signals of indicators: Moving averages Trading is above 30 and 50 daily moving averages, indicating that the bulls are trying to regain control of the market. Note: The period and prices of moving averages are considered by the author on the hourly chart H1 and differ from the general definition of classic daily moving averages on the daily chart D1. Bollinger Bands If the pair declines, the lower limit of the indicator around 1.1755 will act as support, from which you can buy euros. Description of indicators
|
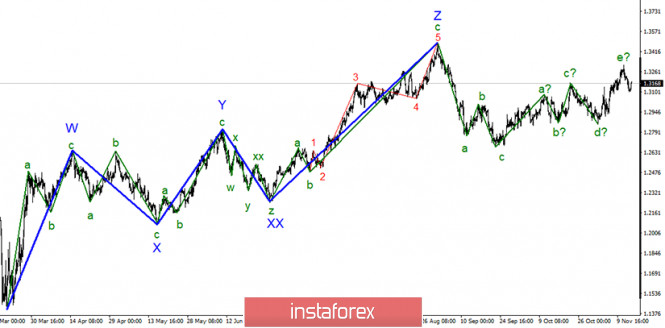
| Posted: 13 Nov 2020 03:43 AM PST
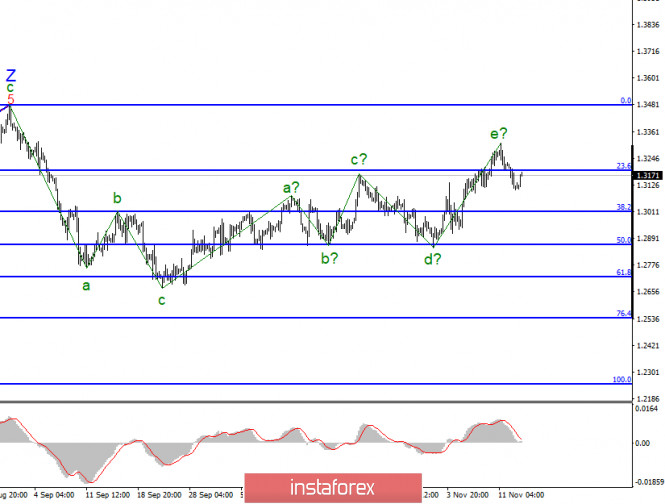
In the most global terms, the construction of the upward trend section continues, however, the entire wave marking takes a complex form. The section of the trend that begins on September 23 has taken a five-wave form, however, it is not impulsive and may already be completed. Thus, the construction of a new three-wave section of the trend, and perhaps a more complex descending wave structure, could already begin. So far, it looks like this.
The lower chart clearly shows the a-b-c-d-e waves of the upward trend section. This means that this section may already be completed. If this is true, then the decline in quotes will continue from the current levels with targets located near the 29th figure and below. At the same time, the section that begins on September 23 may take on an even longer form. But for now, I'm leaning towards the option of building a new descending set of waves, and the option with complication remains a spare. Markets continue to closely monitor the progress of negotiations between the UK and the European Union. But there is no new information about this. On the contrary, the parties declare that if the negotiations will end, then it will be next week (and it is still unclear whether they will end with a deal or failure). Meanwhile, in the UK, a new daily anti-record for COVID diseases was recorded - 33.4 thousand. In total, almost 1.3 million cases have been reported since the beginning of the pandemic. The nationwide quarantine, which was introduced by the Boris Johnson government until December 2, simply does not work. People continue to get infected, and the pandemic continues to spiral out of control. Thus, the UK, along with America, France, Spain, Italy, and some other countries, may completely lose control of COVID. This, in turn, will harm the economy, which Boris Johnson cares so much about. The latest data showed that GDP is growing at a slower pace than both the government and the markets expected. In the third quarter, the growth was revised downwards, from 15.8% to 15.5%. Industrial production in the UK grew in September by just 0.5%. Earlier, it was reported that unemployment was rising. And inflation has long been at an all-time low. Thus, the key indicators of the state of the economy are either already "at the bottom", or they are aiming at this very "bottom". After a disastrous second quarter, of course, there was some recovery, but in the case of the UK, it was weak. The Bank of England has already expanded its asset purchase program and is actively preparing to use negative interest rates. And besides, Britain still faces a real threat of relations with the European Union from 2021 without any agreements. General conclusions and recommendations: The pound/dollar instrument resumed building an upward trend, however, its last wave could have already ended. Thus, now I recommend looking closely at the sales of the instrument for each signal of the MACD indicator "down". A successful attempt to break through the 23.6% Fibonacci level indirectly warns that the instrument is ready to go down with targets located near the calculated levels of 1.3010 and 1.2864, which corresponds to 38.2% and 50.0% Fibonacci. The material has been provided by InstaForex Company - www.instaforex.com |
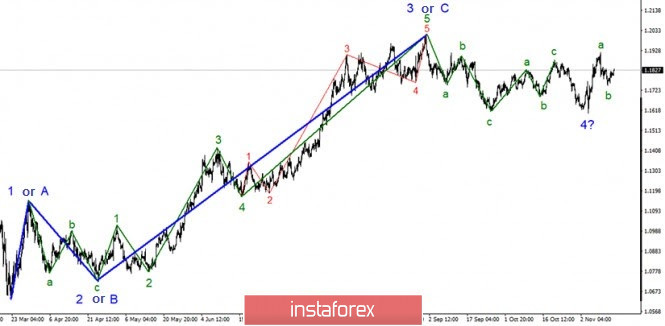
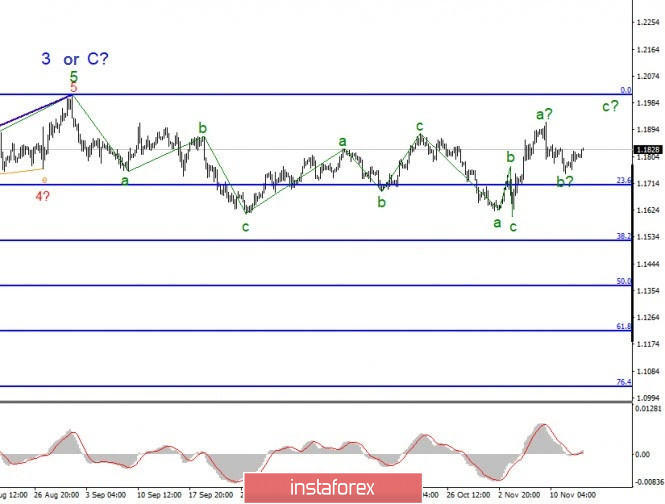
| Posted: 13 Nov 2020 03:40 AM PST The wave marking of the EUR/USD instrument continues to look quite confusing. So far, I'm leaning toward the option with the completion of the building of the anticipated global wave 4 and construction of a rising wave 5. However, it is also a possible scenario in which the tool will continue to move in three-wave structures. Therefore, now a wave will be built from the next upward trend section. In any case, according to the current counting, the instrument quotes are expected to rise in the next week. A smaller-scale wave marking also indicates the possible end of the downward section of the trend that begins on October 21. With the final decrease, the instrument could form a wave from the next three, so after its completion, a new three can be built up or the upward trend section within the global wave 5 will resume altogether, as I mentioned when analyzing the 24-hour timeframe. If so, then this is wave 3 or C, after which it may resume in the market if the assumption about the formation of wave 5 is wrong. Over the past week, markets have been talking about a new coronavirus vaccine from the American Pfizer. This topic is certainly important for the whole world and even shifted the topic of the presidential election in America, which has not yet ended, from the front pages. However, the more everyone is interested in studying the new vaccine, the more it becomes clear that this is not an ideal medical product. A new vaccine is difficult to transport, difficult to store, you need several vaccinations for each patient to have an effect. Moreover, whatever the vaccine is, it will take a huge amount of time to produce hundreds of millions of doses, as well as to vaccinate a large part of the world's population. Thus, in the coming months, no improvements can be expected either in terms of the pandemic or in terms of the economy. Meanwhile, reports on industrial production and GDP were released in the European Union yesterday and today. Both were worse than the markets expected. For the euro currency, this did not become something critical. The demand for the euro is still quite high in the foreign exchange market. However, inflation, GDP, and industrial production in the European Union either remain low or show a tendency to worsen. This is a negative trend. Since September 1, the instrument has been moving mainly using three-wave structures. Thus, it is impossible to conclude that the demand is now higher for a particular currency. However, the prospects for an increase in the euro look dimmer by the day. The situation with the coronavirus in the EU and the EU economy remains quite alarming. However, the situation in America is no better. It's just that America decided to turn a blind eye to the epidemic, that's all. Meanwhile, the US has passed 10.5 million cases and 242,000 deaths from COVID. General conclusions and recommendations: The euro/dollar pair presumably completed the construction of a three-wave downward trend section. Thus, at this time, I recommend buying a tool with targets located near the 1.2010 mark, which corresponds to 0.0% Fibonacci, for each MACD signal "up", based on the construction of wave C. The assumed wave b has presumably completed its construction. The material has been provided by InstaForex Company - www.instaforex.com |
| COVID-19 establishes its own rules in US stock market Posted: 13 Nov 2020 03:23 AM PST
It looks like COVID-19 seeks to bring chaos everywhere, including stock markets. Amid an increase in coronavirus incidences and hospitalizations, as well as a possible resumption of quarantines and restrictive measures, the US leading stock indices collapsed on Thursday. Investors started buying less risky assets again, such as gold and US government bonds. In other words, the market participants are nervous again. On Wednesday, the number of hospitalizations of people infected with the coronavirus hit a record daily level since the beginning of the pandemic. More than 100,000 new cases of COVID-19 are reported every day. Health experts are confident that the vaccine could defeat the virus, but how soon it will appear remains under question. Today, the government has only one way to stop the spread of the virus - to reintroduce quarantine. However, traders fear that such actions may negatively affect the already weak economy. They are reviewing their portfolios, assessing whether companies are able to cope with new restrictive measures. Despite these alarming conditions, the S&P 500 has grown by more than 8% since late October. The S&P 500 on Thursday fell by 1% to 3,537.01. The Dow Jones Industrial Average lost 1.1% to trade at 2,9080.17. The Nasdaq Composite decreased by 0.7% to 11,709.59. The biggest losses in shares' prices have companies in the tourism sector and banks. Thus, shares of United Airlines Holdings Inc. declined by 4.3%, while shares of Carnival Corp decreased by 7.9%. Shares of JPMorgan Chase & Co., Citigroup Inc. and Wells Fargo & Co. lost more than 1% in price. At the same time, shares of Southwest Airlines Co. lost 3% as well. The shares' price of the American battery manufacturer Energizer Holdings Inc. fell by 14.8%. Meanwhile, the securities of the American Jaws Acquisition Corp. jumped in price by 15.8%. The reason for this growth was the merger of the company with the network of medical centers for the elderly Cano Health Llc. The deal value is $4.4 billion. There is one more positive piece of news. The number of initial jobless claims in the United States hit its lowest level since March, but still is rather high. It looks like Americans are finding jobs despite the continuing rise in the incidence of Covid-19. As long as the situation in the foreign exchange and stock markets is volatile, gold prices will not change their trend. Gold futures rose by 0.6% to trade at $1,872.60 per troy ounce. The pan-European Stoxx Europe 600 lost 0.9%. Most Asian indices pulled back slightly on Thursday. China's Shanghai Composite slid by 0.1%, while Hong Kong's Hang Seng dropped by 0.3%. The material has been provided by InstaForex Company - www.instaforex.com |
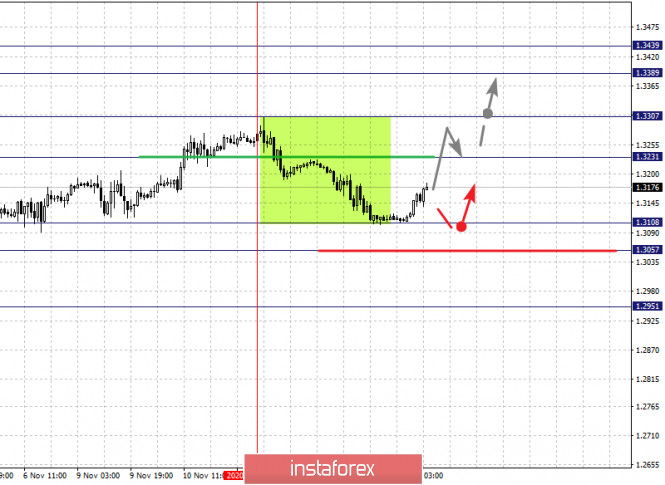
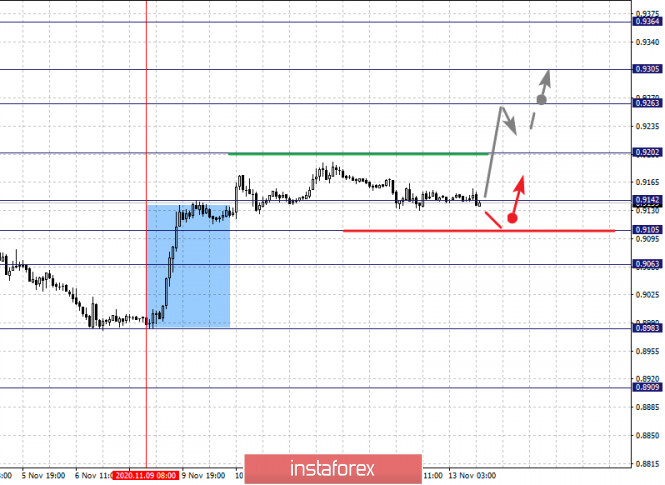
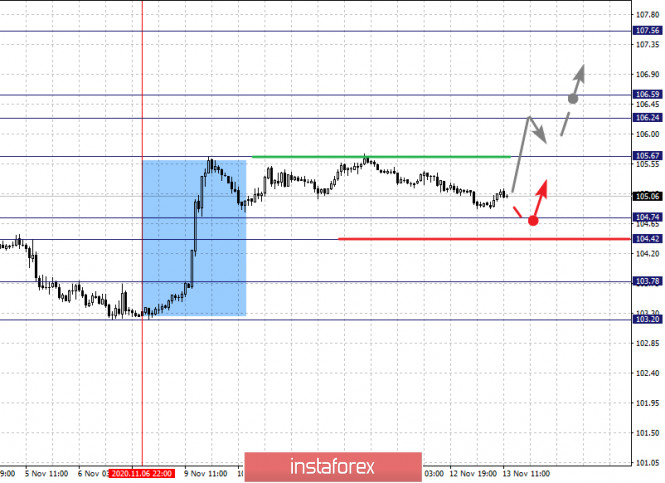
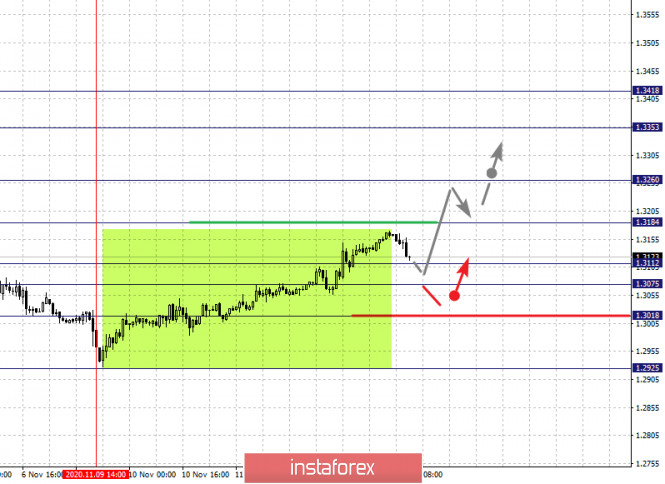
| Fractal analysis for major pairs on November 13 Posted: 13 Nov 2020 02:42 AM PST Outlook on November 13: Analytical overview of major pairs on the H1 TF:
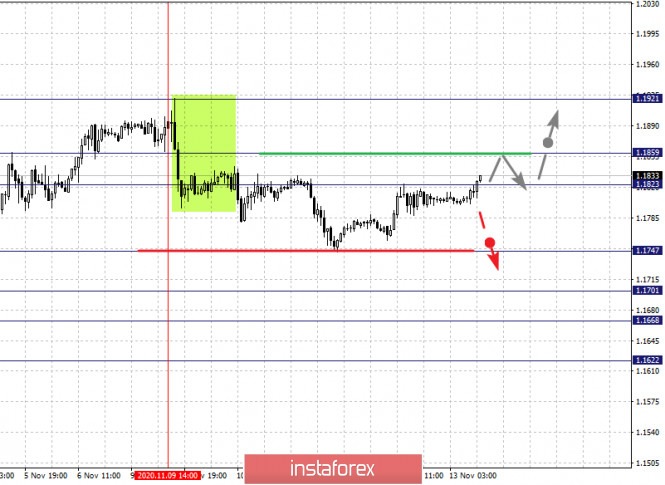
The key levels for the euro/dollar pair are 1.1921, 1.1859, 1.1823, 1.1747, 1.1701, 1.1668 and 1.1622. The price is in the correction zone from the upward pattern of November 4. Now, a short-term growth is expected in the range of 1.1823 - 1.1859. If the last value breaks down, it is possible that the local initial conditions for the top will form. In this case, the potential goal is 1.1921. A decline, in turn, is expected to continue after the level of 1.1747 breaks down. In this case, the goal is 1.1701. On the other hand, there is a short-term decline and consolidation in the range of 1.1701 - 1.1668. For the potential value for the bottom, we consider the level of 1.1622. Upon reaching which, an upward pullback can be expected. The main trend is the upward structure from November 4, deep correction stage Trading recommendations: Buy: 1.1824 Take profit: 1.1857 Buy: 1.1861 Take profit: 1.1920 Sell: 1.1745 Take profit: 1.1701 Sell: 1.1698 Take profit: 1.1668
The key levels for the pound/dollar pair are 1.3439, 1.3389, 1.3307, 1.3231, 1.3108, 1.3057 and 1.2951. Here, the price is in a deep correction from the upward trend of November 2. The pair is expected to rise after breaking through the level of 1.3231. In this case, the goal is 1.3307 and there is consolidation near this level. If this goal breaks down, it will lead to a strong growth. The next goal is 1.3389. For the potential value for the top, we consider the level of 1.3439. Upon reaching which, consolidation and downward pullback is expected. Meanwhile, a short-term decline is expected in the range of 1.3108 - 1.3057. Breaking through the last level should be accompanied by a strong decline. The potential goal here is 1.2951. The main trend is the upward cycle from November 2, deep correction stage Trading recommendations: Buy: 1.3231 Take profit: 1.3305 Buy: 1.3309 Take profit: 1.3387 Sell: 1.3106 Take profit: 1.3058 Sell: 1.3055 Take profit: 1.2953
The key levels for the dollar/franc pair are 0.9364, 0.9305, 0.9263, 0.9202, 0.9142, 0.9105 and 0.9063. The development of the rising structure from November 9 is being followed here. Moreover, we expect growth to continue after breaking through the level of 0.9202. In this case, the goal is 0.9263. On the other hand, there is a short-term growth as well as consolidation in the range of 0.9263 - 0.9305. For the potential value for the top, the level of 0.9364 can be considered, which will be followed by a downward pullback. A short-term decline, in turn, is possible in the range of 0.9142 - 0.9105. If the last value breaks down, it will lead to a deep correction. The goal here is 0.9063, which is the key support for the upward pattern. The main trend is the upward structure from November 9 Trading recommendations: Buy : 0.9202 Take profit: 0.9261 Buy : 0.9265 Take profit: 0.9303 Sell: 0.9141 Take profit: 0.9107 Sell: 0.9103 Take profit: 0.9064
The key levels for the dollar/yen are 107.56, 106.59, 106.24, 105.67, 104.74, 104.42 and 103.78. The price forms a strong potential for the upward cycle from November 6. Now, growth is expected to resume after breaking through the level of 105.67. In this case, the goal is 106.24. Meanwhile, there is a short-term growth and consolidation in the range of 106.24 - 106.59. If the level of 106.60 breaks down, it will lead to a potential goal of 107.56. Upon reaching this level, downward pullback is expected. A short-term decline is possible in the range of 104.74 - 104.42. If the last value breaks down, it will lead to a deep correction. The goal is 103.78, which is a key support for the upward structure. The key trend is the capacity for the upward formation of November 6 Trading recommendations: Buy: 105.68 Take profit: 106.22 Buy : 106.25 Take profit: 106.58 Sell: 104.74 Take profit: 104.43 Sell: 104.40 Take profit: 103.80
The key levels for the USD/CAD pair are 1.3418, 1.3353, 1.3260, 1.3184, 1.3112, 1.3075, 1.3018 and 1.2925. Here, we are following the formation of the upward structure from November 9. The pair is expected to rise after the level of 1.3184 breaks down. In this case, the goal is 1.3260. Price consolidation is near this level. If this target breaks down, it will lead to the development of a strong growth. The next goal is 1.335. As a potential value for the top, we consider the level of 1.3418. Upon reaching which, consolidation and downward pullback is expected. Meanwhile, decline is possible in the range of 1.3112 - 1.3075. In case of breakdown of the last value, a deep correction will occur. The potential goal is 1.3018, which is a key support for the top. The main trend is the upward structure from November 9 Trading recommendations: Buy: 1.3186 Take profit: 1.3260 Buy : 1.3262 Take profit: 1.3351 Sell: 1.3111 Take profit: 1.3075 Sell: 1.3073 Take profit: 1.3018
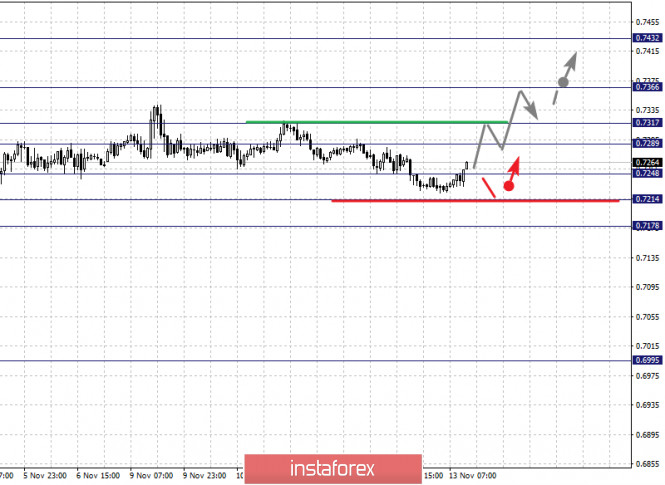
The key levels for the AUD/USD pair are 0.7432, 0.7366, 0.7317, 0.7289, 0.7248, 0.7214 and 0.7178. We continue to monitor the formation of the rising pattern from November 2. Now, a consolidated movement is expected in the range of 0.7289 - 0.7317. If the last value breaks down, it will lead to a strong rise. Here, the goal is 0.7366 and price consolidation is near this level. For the potential value for the top, we consider the level 0.7432. A downward pullback is likely upon reaching this level. In turn, a short-term decline is expected in the range of 0.7248 - 0.7214. If the last value breaks down, a deep correction will occur. Here, the target is 0.7178, which is the key support for the top. The main trend is the upward cycle from November 2 Trading recommendations: Buy: 0.7319 Take profit: 0.7365 Buy: 0.7368 Take profit: 0.7431 Sell : 0.7246 Take profit : 0.7216 Sell: 0.7212 Take profit: 0.7180
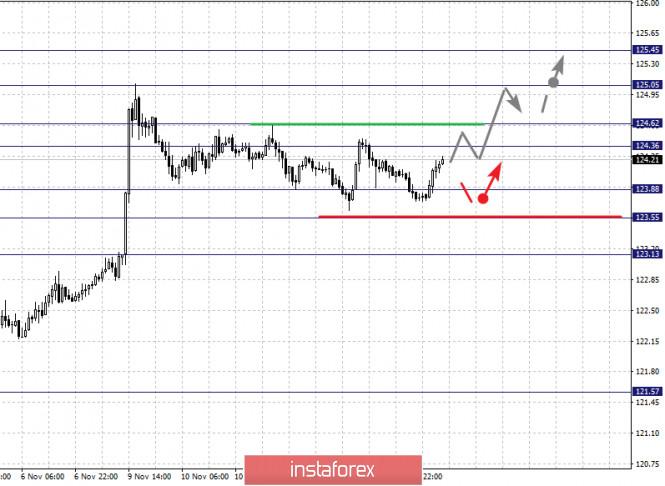
The key levels for the euro/yen pair are 125.45, 125.05, 124.62, 124.36, 123.88, 123.55 and 123.13. The rising pattern from October 30 is being followed here. At the moment, the price is in correction. On the other hand, a short-term increase is expected in the range of 124.36 - 134.62. If the last value breaks down, it will lead to the level of 125.05. For the potential value for the top, we consider the level of 125.45. Price consolidation is expected near this level. A short-term decline is possible in the range of 123.88 - 123.55 and breaking through the last value will lead to a deep correction. The goal here is 123.13, which is the key support level for the top. The main trend is the upward structure from October 30, the correction stage Trading recommendations: Buy: 124.64 Take profit: 125.03 Buy: 125.07 Take profit: 125.45 Sell: 123.88 Take profit: 123.57 Sell: 123.53 Take profit: 123.15
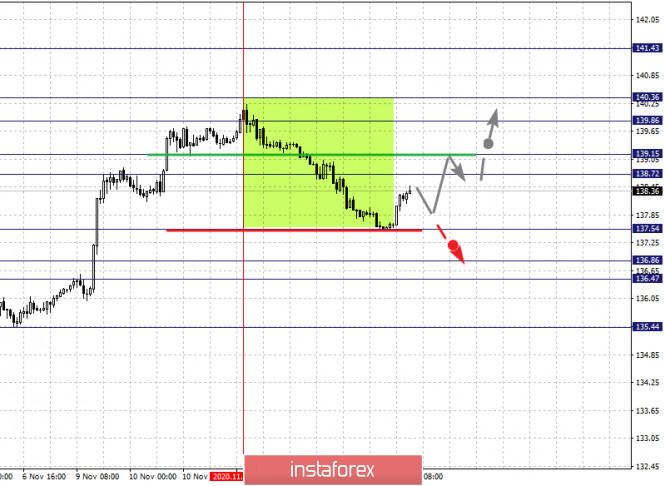
The key levels for the pound/yen pair are 141.43, 140.36, 139.86, 139.15, 138.72, 137.54, 136.86, 136.47 and 135.44. Here, we are following the upward pattern of October 30. The price is currently in correction. Now, growth is expected to continue after the price passes the noise range 138.72 - 139.15. In this case, the goal is 139.86. On the other hand, there is a short-term rise and consolidation in the range of 139.86 - 140.36. For the potential value for the top, we consider the level 141.43. The movement to which is expected after the breakdown of 140.36. The development of the downward pattern from November 11 is possible after the level of 137.54 breaks down. In this case, the goal is 136.86. In turn, price consolidation is in the range of 136.86 - 136.47. For the potential value for the bottom, we consider the level of 135.44. An upward pullback is expected upon reaching this level. The main trend is the upward structure from October 30, deep correction stage Trading recommendations: Buy: 139.15 Take profit: 139.85 Buy: 139.88 Take profit: 140.34 Sell: 137.54 Take profit: 136.86 Sell: 136.44 Take profit: 135.50 The material has been provided by InstaForex Company - www.instaforex.com |
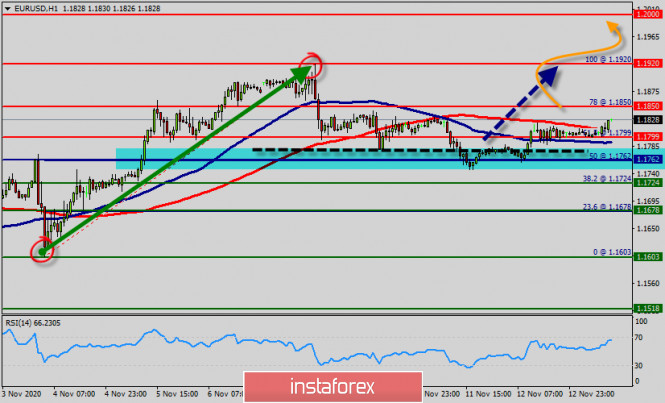
| Technical analysis of EUR/USD for November 13, 2020 Posted: 13 Nov 2020 02:18 AM PST The EUR/USD pair's consolidation within the main bullish channel, facing strong positive pressures now might activate the correctional bullish track before reaching any new negative target. The EUR/USD pair broke resistance which turned to strong support at the level of 1.1762 since last week. The level of 1.1762 coincides with a golden ratio (50% of Fibonacci), which is expected to act as major support today. The Relative Strength Index (RSI) is considered overbought because it is above 60. The RSI is still signaling that the trend is upward as it is still strong above the moving average (100). This suggests the pair will probably go up in coming hours. Accordingly, the market is likely to show signs of a bullish trend. In other words, buy orders are recommended above 1.1762 with the first target at the level of 1.1800. This suggests the pair will probably go up in coming hours. As settling above the moving average 100 at 1.1800 will increase the chances of moving towards 1.1850, while surpassing it might extend trades towards the main resistance at 1.1920. From this point, the pair is likely to begin an ascending movement to the point of 1.1850 and further to the level of 1.1920. The level of 1.1920 will act as strong resistance and the double top is already set at the point of 1.1920. Thus, the market is indicating a bullish opportunity above the above-mentioned support levels, for that the bullish outlook remains the same as long as the 100 EMA is headed to the upside. On the other hand, if a breakout happens at the support level of 1.1678, then this scenario may become invalidated. The material has been provided by InstaForex Company - www.instaforex.com |
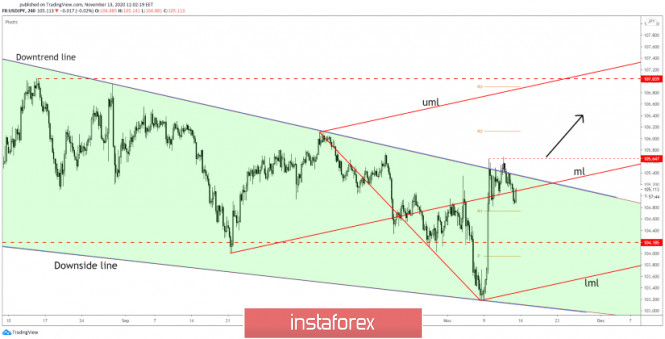
| USD/JPY descending wedge needs confirmation Posted: 13 Nov 2020 02:16 AM PST USD/JPY is trading in the green at the 105.11 level and it flirts with resistance again after the most recent drop. The yen could lose ground again versus the greenback if the JP225 and the USDX jumps higher. USD remains strong despite poor US inflation data. The CPI and the Core CPI increased only by 0.0%, less than expected. It remains unclear how the US dollar will react to the data on PPI, Core PPI, and the Prelim UoM Consumer Sentiment released today. USD/JPY Needs A Valid Breakout
USD/JPY has decreased a little after another false breakout above the downtrend line, Falling Wedge's resistance. It has slipped under the median line (ml) of the ascending pitchfork, but now it is trying to come back above it. The decline could be only a temporary one if the rate continues to stay near the immediate upside obstacles. Still, USD/JPY could decrease in the short term if the price registers only false breakouts above the median line (ml) and through the major downtrend line.
Well have a great long opportunity if USD/JPY makes a valid breakout above the downtrend line and after making a new higher high, to close above 105.67. This scenario will signal a broader leg higher. The first upside target is seen around the 107.00 psychological level. The material has been provided by InstaForex Company - www.instaforex.com |
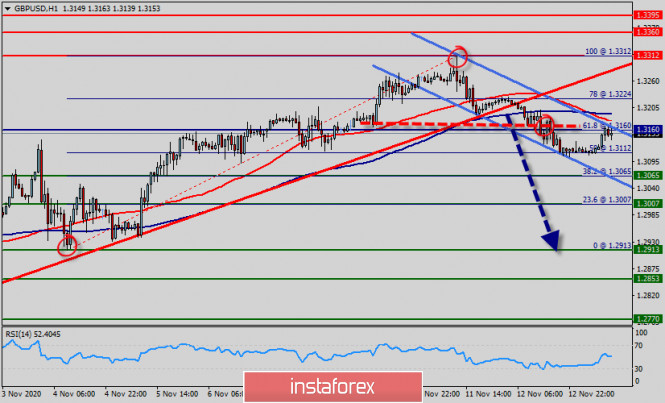
| Technical analysis of GBP/USD for November 13, 2020 Posted: 13 Nov 2020 02:02 AM PST The GBP/USD pair broke 1.3224 level strongly and settled below it, which turns the intraday track to the downside, on its way to reach 1.2913 before resuming the bullish trend again. So, the expected trend for today - Bearish Market. The GBP/USD pair shows some bearish bias to approach testing the key support 1.3065. The expected trading range for today is between 1.3224 support and 1.2913 resistance. However, on the downside, firm break of 1.3160 minor support support will turn bias back to the downside for 1.3065 support instead. Therefore, the bearish bias will be expected for today, noting that breaching 1.3224 and holding below it will stop the negative scenario and push the price to regain the main bearish trend that its next main target located at 1.3065. Equally important, the RSI and the moving average (100) are still calling for a downtrend. Hence, the market indicates a bullish opportunity at the level of 1.3065 in the H1 chart. Also, if the trend is buoyant, then the currency pair strength will be defined as following: GBP is in an uptrend and USD is in a downtrend. Sell below the minor support of 1.3160 with the first target at 1.3065 (this price is coinciding with the ratio of 38.2% Fibonacci), and continue towards 1.3007. The price will fall into the bearish market in order to go further towards the strong support at 1.2913 to test it again. Furthermore, the level of 1.2913 will form a double bottom. On the other hand, if the price closes above the major resistance, the best location for the stop loss order is seen above 1.3312. The material has been provided by InstaForex Company - www.instaforex.com |
| You are subscribed to email updates from Forex analysis review. To stop receiving these emails, you may unsubscribe now. | Email delivery powered by Google |
| Google, 1600 Amphitheatre Parkway, Mountain View, CA 94043, United States | |








No comments:
Post a Comment