
Forex analysis review |
- Forecast for EUR/USD on November 17, 2020
- Forecast for GBP/USD on November 17, 2020
- Forecast for AUD/USD on November 17, 2020
- Forecast for USD/JPY on November 17, 2020
- Hot forecast and trading signals for GBP/USD on November 17. COT report. Analysis and recommendations
- Hot forecast and trading signals for EUR/USD on November 17. COT report. Analysis and recommendations
- Overview of the GBP/USD pair. November 17. Boris Johnson is back in self-isolation. The results of the talks between London
- Overview of the EUR/USD pair. November 17. "Coronavirus problems" in the United States. Donald Trump is going to finally
- The vaccine is killing the dollar
- Britain is buying a vaccine and preparing for a deal. How will the pound react?
- EURUSD-Great America is like a circus
- Analytics and trading signals for beginners. How to trade EUR/USD on November 17? Getting ready for Tuesday session
- November 16, 2020 : GBP/USD Intraday technical analysis and trade recommendations.
- November 16, 2020 : EUR/USD Intraday technical analysis and trade recommendations.
- November 16, 2020 : EUR/USD daily technical review and trade recommendations.
- EUR / USD outlook may be limited as greenback may rise back as safety asset
- Brexit still influences GBP/USD
- Analysis of EUR/USD for November 16. Will US face healthcare collapse?
- Evening review of EURUSD on November 16, 2020
- USDCAD back tests broken support
- Ichimoku cloud indicator Daily analysis of Gold
- EURUSD challenges short-term support
- Analysis of GBP/USD for November 16. GBP to face challenge soon. This week, London and Brussels due to report on trade deal
- GBP/USD: plan for the American session on November 16 (analysis of morning deals)
- EUR/USD: plan for the American session on November 16 (analysis of morning deals)
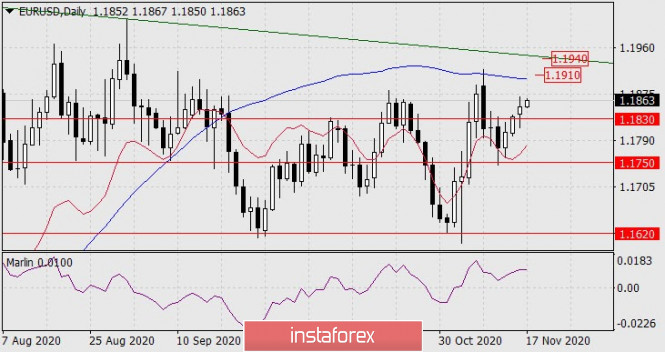
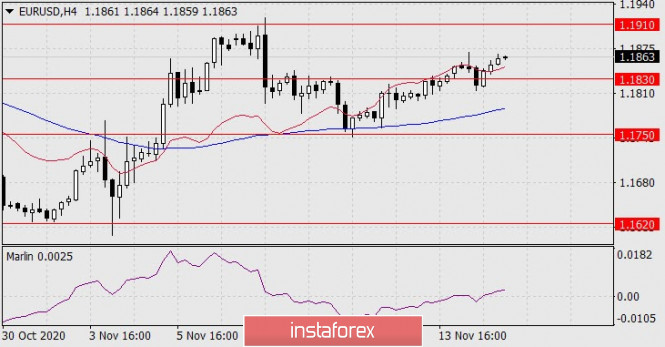
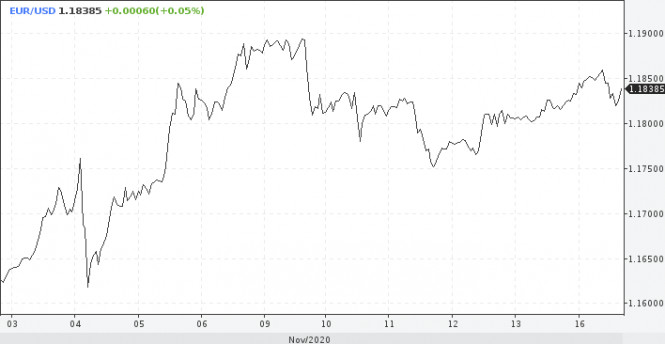
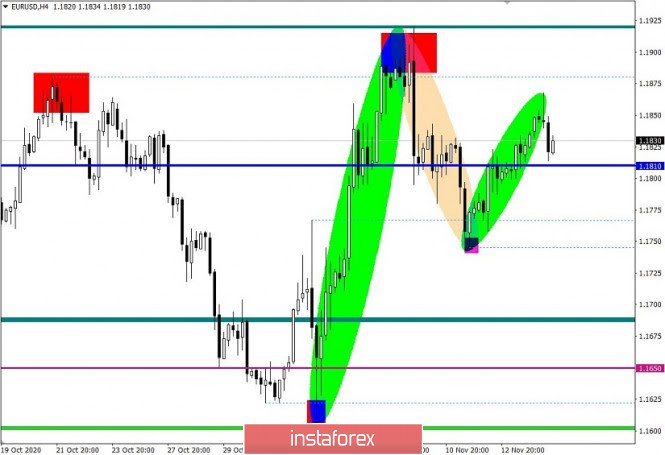
| Forecast for EUR/USD on November 17, 2020 Posted: 16 Nov 2020 06:53 PM PST EUR/USD Markets continue to actively play out the popular topic of coronavirus vaccines. Yesterday, American company Moderna announced successful tests of the second phase. The US stock index S&P 500 rose by 1.16%, the euro by 17 points. Obviously, until new investment topics are available, investors continue to be optimistic about the development of new vaccines and the vaccination process itself. But this topic will soon become boring, because yesterday's growth was not as pronounced as it was after the news from Pfizer. The daily chart shows that nothing is holding back the price from moving to the nearest targets of 1.1910 along the MACD line and 1.1940 along the line of the descending price channel. The Marlin oscillator is growing. The four-hour chart shows that the price settled above the balance indicator line, which strengthened the mood for buy positions on the euro, the Marlin oscillator also settled in the positive trend zone. Yesterday's trading volume exceeded Friday's. We are waiting for the EUR/USD to rise towards the designated targets. The material has been provided by InstaForex Company - www.instaforex.com |
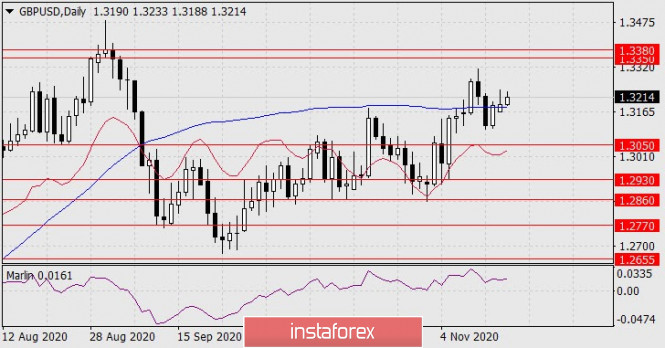
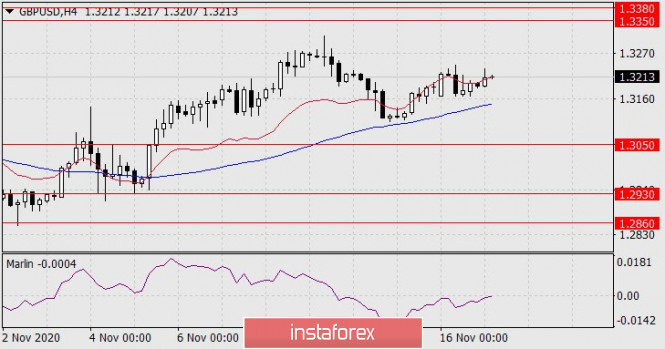
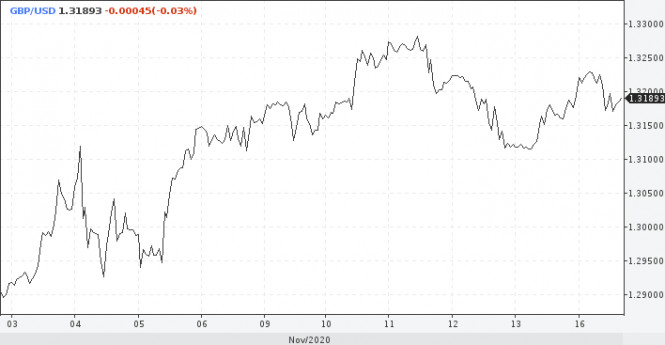
| Forecast for GBP/USD on November 17, 2020 Posted: 16 Nov 2020 06:52 PM PST GBP/USD Yesterday, the pound closed at the level where it closed last Friday, and today it opened above the daily MACD line. The signal line of the Marlin oscillator moves horizontally. These are signs of further growth. The target remains the same - the 1.3350/80 range. The price overcomes the resistance of the balance indicator line on the four-hour chart. Settling beyond this area can accelerate growth. Marlin attacks the border of the growth territory. There are no signs of a reversal, we are waiting for succeeding growth. |
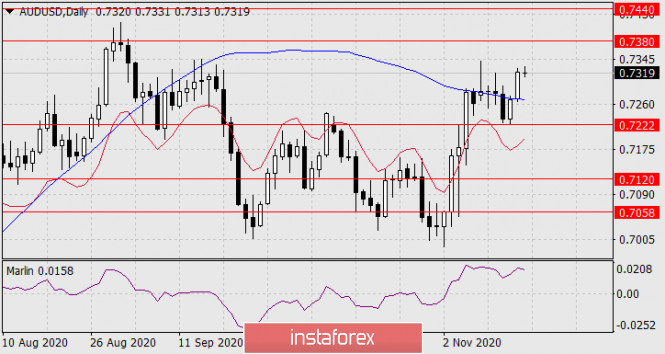
| Forecast for AUD/USD on November 17, 2020 Posted: 16 Nov 2020 06:52 PM PST AUD / USD The Australian dollar rose by 52 points yesterday. Technically, the growth of the market was due to a rebound from the support of the MACD indicator line from the trading's opening. As the Marlin Oscillator continues to grow, the price at the first target level of 0.7380 is anticipated. If the price overcomes it, then we anticipate the price at the second target level of 0.7440 (the minimum of September 2016 and the maximum of August 2015).
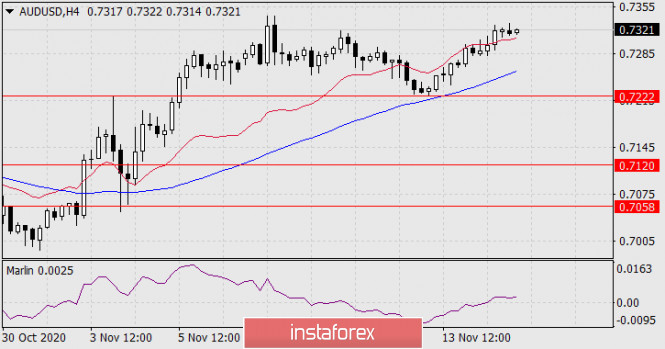
Based on the four-hour chart, the price consolidated above the balance indicator line with the growing Marlin oscillator. This is a sign that the current movement remains on the horizon for several days. The Australian dollar at the specified target levels is to look forward to.
|
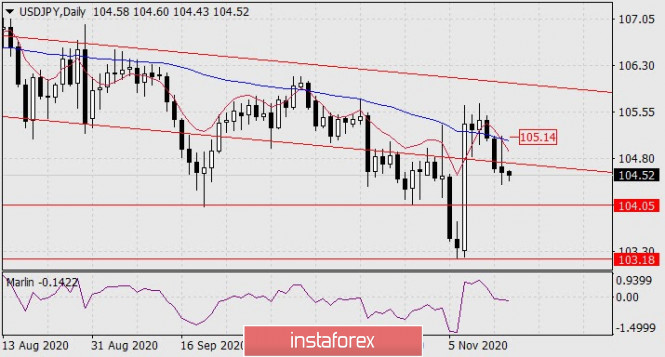
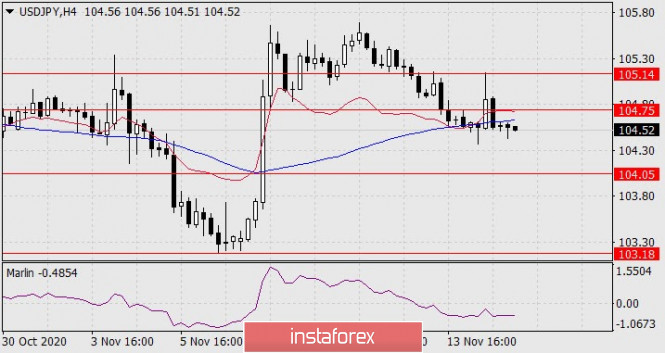
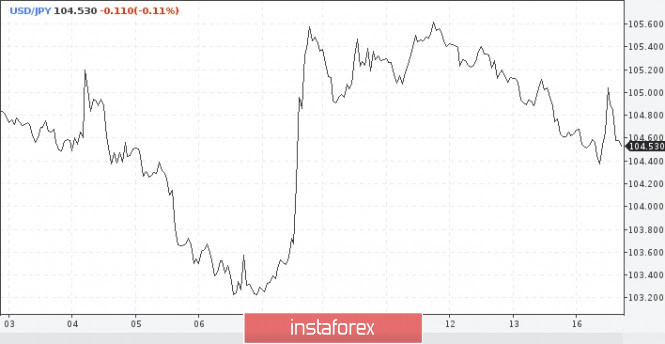
| Forecast for USD/JPY on November 17, 2020 Posted: 16 Nov 2020 06:52 PM PST USD/JPY Yesterday, the Japanese currency quickly worked out our scenario and tested the MACD line (105.14) and returned to the area under the trend line of the price channel (104.75) on the daily chart. The price has settled under the trend line, now we are waiting for it to move to the nearest target of 104.05. Overcoming it opens the second target at 103.18 - the November 6 low. The Marlin oscillator is in the negative zone - in the trend of a prospective (the indicator is leading) decline. The four-hour chart shows that the price has settled below the MACD indicator line, the Marlin oscillator is in a downward trend on the 13th. We are waiting for the price at the first target at 104.05, then at the second target at 103.18. |
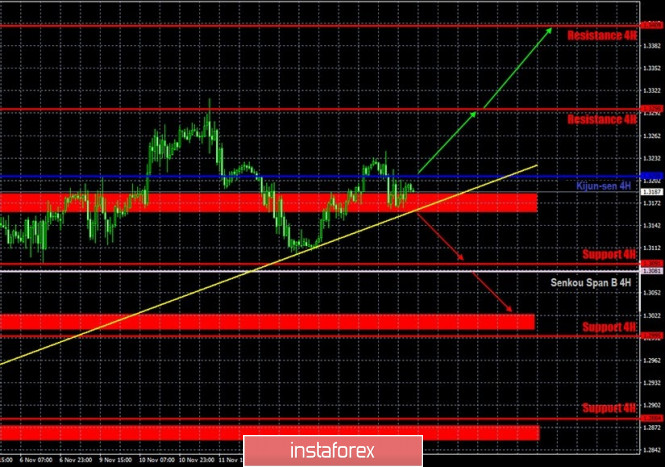
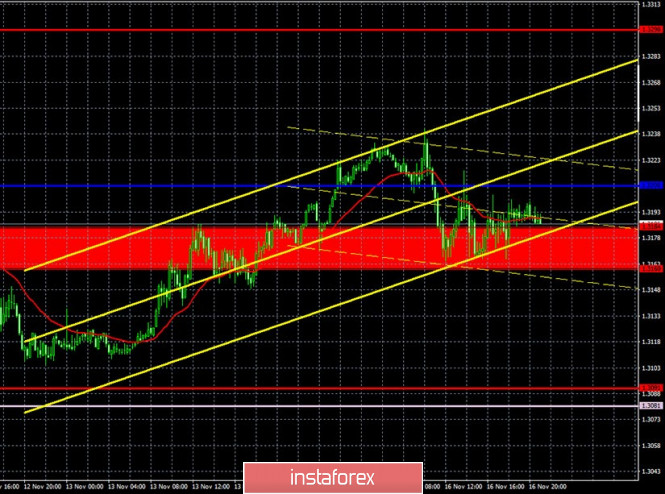
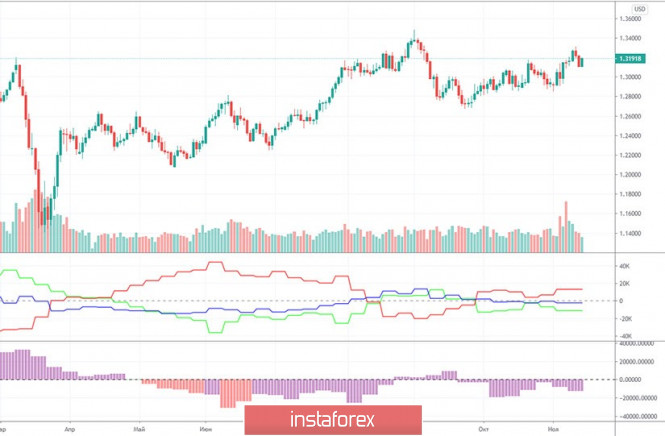
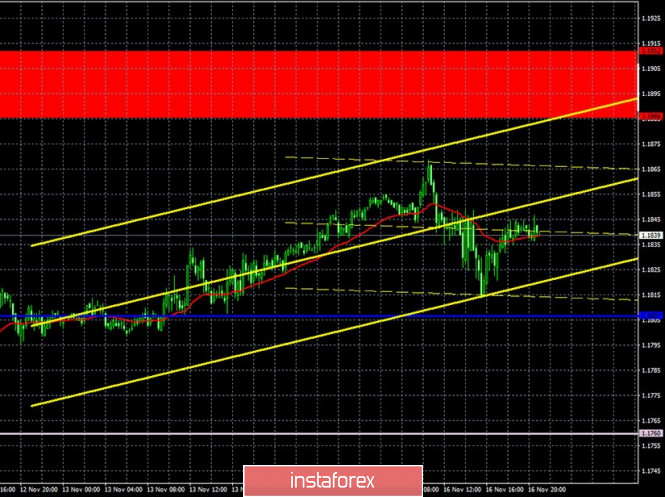
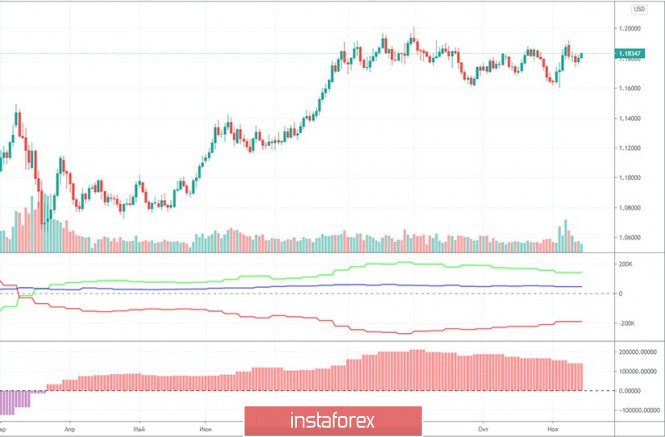
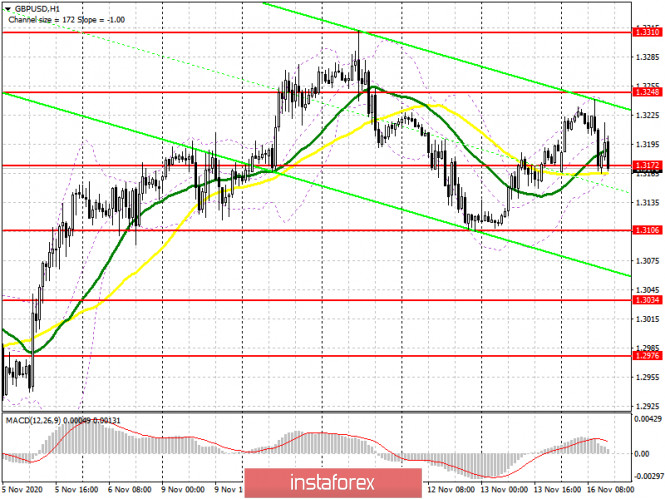
| Posted: 16 Nov 2020 05:59 PM PST GBP/USD 1H The GBP/USD pair tried to resume the upward movement yesterday and even crossed the critical Kijun-sen line, but could not do so and thus, a new round of the downward correction began very quickly. At the same time, the pound/dollar pair remains above the upward trend line, that is, the upward trend continues. Thus, formally, buyers stay in the game and still have good chances of moving up, at least to the area of the previous local high - the 1.3298 level . At the same time, we have repeatedly said that we are leaning towards the option of starting a new long downward trend. This requires at least breaking the trend line. After that, the initiative in the market will be intercepted by the bears, and you can expect the pound to fall by at least a few hundred points. The fundamental background still signals a very high probability of a fall in the British currency. COT reports are now quite uninformative, but they do not deny this possibility. GBP/USD 15M The higher linear regression channels are directed to the upside on the 15-minute timeframe, however, the lower channel turned sideways. Traders were unable to continue the upward movement on Monday, and are increasingly inclined to start forming a new downward trend. The trend line on the hourly chart is now very important for determining the succeeding trend. COT report The GBP/USD pair increased by 250 points in the last reporting week (November 3-9). It is not surprising that the pound strengthened, since the US presidential election was held during this period, and the dollar was declining against its main competitors. However, the pound began to grow after this period. In general, the pound has been growing recently. But the Commitment of Traders (COT) reports does not really provide any useful information. Non-commercial traders closed 3,300 Buy-contracts (longs) and opened 1,100 Sell-contracts (shorts). Therefore, they became more bearish, and the net position decreased by 4,400, which is not so small for the pound. Recall that the "non-commercial" group opened a total number of 87,000 contracts. Thus, 4,400 is 5%. As for the general trend among professional traders, the indicators in the chart clearly show that there is no trend at this time. The green line (net position of non-commercial traders) on the first indicator constantly changes its direction. The second indicator also shows the absence of a trend, as professional traders increase the net position, then reduce it. Thus, no long-term conclusions or forecasts can still be made based on the COT report. We recommend paying more attention to technique and foundation. The fundamental background for the British pound did not change on Monday. Also, as in the case of the euro/dollar pair, there were literally a few and were not really important messages from the UK and America, nothing significant that could cause a market reaction. Not a single important macroeconomic report. Thus, the pound sterling continues to balance on the edge of the abyss. Buyers' hopes remain solely with the prosperous conclusion of negotiations on a trade deal between London and Brussels. If there is no deal (and this may become known as early as this week), then the pound may collapse. We have long come to the conclusion that the pound is overbought. And since there is still no positive news from Great Britain, the pound, in principle, has no reason to continue (!!!) growth. Bank of England Governor Andrew Bailey is set to deliver a speech on Tuesday. However, as with European Central Bank President Christine Lagarde and Federal Reserve Chairman Jerome Powell, Bailey's recent speeches were too uninformative and uninteresting. Therefore, Bailey may not mention anything important today. However, traders have long been waiting for the UK central bank to resort to negative rates. And it seems that even the BoE representatives do not deny that sooner or later they will have to resort to this instrument of monetary policy. Thus, any information about the timing of the introduction of negative rates can affect the mood of traders. And the pound. Negatively. We have two trading ideas for November 17: 1) Buyers for the pound/dollar pair have a hard time keeping the initiative in their hands. Thus, we recommend buying the pair while aiming for resistance levels 1.3298 and 1.3409, if the bulls manage to keep the pair above the trend line and overcome the critical Kijun-sen line (1.3208). Take Profit in this case will be from 60 to 170 points. 2) Sellers could not pull down the pair below the trend line. If the price settles below the trend line, the trend will change to a downward one and you can sell the pound/dollar pair while aiming for the Senkou Span B line (1.3081) and the support area of 1.3004-1.3024. Take Profit in this case can range from 60 to 100 points. Hot forecast and trading signals for EUR/USD Explanations for illustrations: Support and Resistance Levels are the levels that serve as targets when buying or selling the pair. You can place Take Profit near these levels. Kijun-sen and Senkou Span B lines are lines of the Ichimoku indicator transferred to the hourly timeframe from the 4-hour one. Support and resistance areas are areas from which the price has repeatedly rebounded off. Yellow lines are trend lines, trend channels and any other technical patterns. Indicator 1 on the COT charts is the size of the net position of each category of traders. Indicator 2 on the COT charts is the size of the net position for the "non-commercial" group. The material has been provided by InstaForex Company - www.instaforex.com |
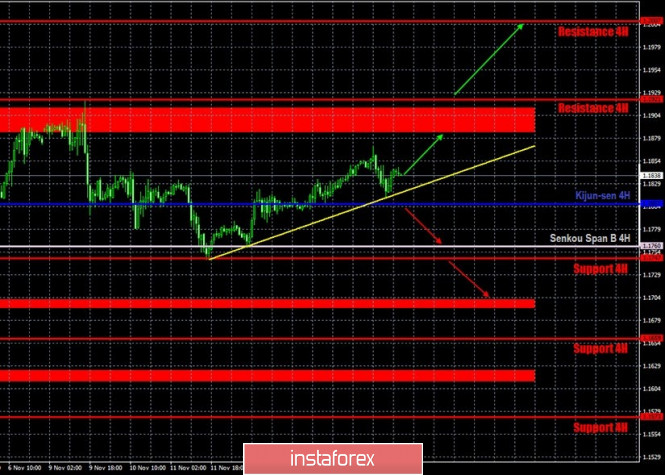
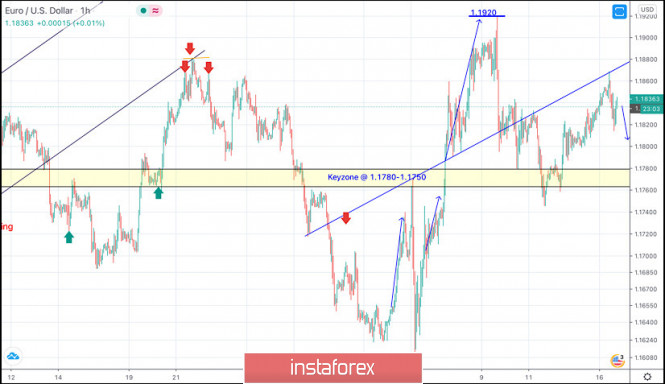
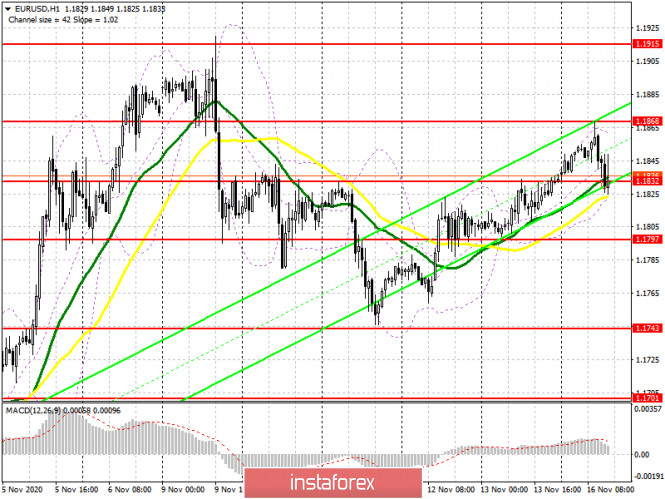
| Posted: 16 Nov 2020 05:57 PM PST EUR/USD 1H The euro/dollar pair moved up on the hourly timeframe on Monday, November 16, but a new round of the downward movement began in the afternoon. The nature of the current movement is still extremely suitable for a flat, which stays in the long term. Recall that the pair's quotes have been trading between the levels of 1.1700 and 1.1900 for three months now. Thus, 80% of trades are within the specified range. Naturally, trends are not always formed within this range. It would be too ideal for quotes to reach one of the channel's boundaries, rebound off it and start moving towards the opposite boundary. Therefore, in reality, the lateral movement stays, but it is less of a good view. The Kijun-sen line went down yesterday, so the price remained above it, despite the downward correction. Therefore, rebounding from this line may help traders with long deals while they aim for the resistance area of 1.1886-1.1912. For something more, buyers need to go beyond the specified area, but even then, the breakout can be false. EUR/USD 15M Both linear regression channels are directed to the upside on the 15-minute timeframe. Therefore, not breaking the Kijun-sen line still allows traders to form an upward trend in the short term. The upward movement to the 1.1886-1.1912 area can only continue if the Kijun-sen line is not overcome. COT report The EUR/USD pair increased by 170 points in the last reporting week (November 3-9). The US presidential elections provoked a rather strong drop in the US currency, however, it lasted no more than a few days. Nevertheless, the euro rose in price, and market participants can expect that professional traders are leaning towards being bullish. However, the latest Commitment of Traders (COT) report showed that the mood of large traders has become more bearish. The net position of the "non-commercial" group of traders decreased again, this time by 17,000 contracts, which is quite a lot. Recall that non-commercial traders have been reducing their net position for several consecutive weeks, which is eloquently signaled by the lower indicator in the chart. A decrease in the net position, in fact, means that Buy-contracts (longs) are closed and Sell-contracts (shorts) are opened. The first professional traders closed 9,200 during the reporting week, and the second - opened 7,800. However, despite the fact that the net position of non-commercial traders has been falling since the beginning of September, the downward trend has still not started for the EUR/USD pair. The green and red lines on the first indicator continue to move towards each other, which means that the trend has already begun long ago. However, there is actually no downward movement in the long term. Therefore, based on the latest COT report, we can say the following: our forecasts remain the same, since the report data allows only such conclusions to be drawn. We still believe that the upward trend has ended at around 1.2000. No important macroeconomic reports for the European Union and the United States on Monday. There were only a few messages that, purely theoretically, could have an impact on the pair's movement. We have Donald Trump's new insinuations, information about possible new sanctions by Washington against Beijing as a "slamming door", and the speech of European Central Bank President Christine Lagarde, who did not say anything important nor anything related to monetary policy or the economy. Recently, Lagarde has paid increased attention to the pandemic, the vaccine against the coronavirus, as well as the digital euro, which may be launched within a few years. However, all this information was interesting only in general. Lagarde is set to deliver another speech on Tuesday, November 17. And, most likely, the head of the ECB will also avoid discussing the economy and monetary policy. Meanwhile, the US will release its retail sales report for the month of October. According to forecasts, it might increase 0.5% m/m, which is very small compared to September's results, which grew 1.9% m/m. However, in the current environment, this report is unlikely to cause a strong market reaction. In general, we do not yet see what fundamental news can bring the pair out of the $1.17-1.19 channel. We have two trading ideas for November 17: 1) Buyers kept the pair above the Senkou Span B line (1.1807), as well as above the new upward trend line. Therefore, you are advised to trade upward while aiming for the resistance area of 1.1886-1.1912 and the resistance level of 1.2007. Take Profit in this case will be about 50 to 150 points. 2) At first, the bears failed to overcome the Senkou Span B line (1.1760), and then the trend line. Thus, in order to be able to resume trading downward while aiming for the Senkou Span B line (1.1760) and the support area of 1.1692-1.1699, the price should settle below the trend line and break the Kijun-sen line (1.1807). Take Profit in this case can range from 30 to 80 points. Hot forecast and trading signals for GBP/USD Explanations for illustrations: Support and Resistance Levels are the levels that serve as targets when buying or selling the pair. You can place Take Profit near these levels. Kijun-sen and Senkou Span B lines are lines of the Ichimoku indicator transferred to the hourly timeframe from the 4-hour one. Support and resistance areas are areas from which the price has repeatedly rebounded off. Yellow lines are trend lines, trend channels and any other technical patterns. Indicator 1 on the COT charts is the size of the net position of each category of traders. Indicator 2 on the COT charts is the size of the net position for the "non-commercial" group. The material has been provided by InstaForex Company - www.instaforex.com |
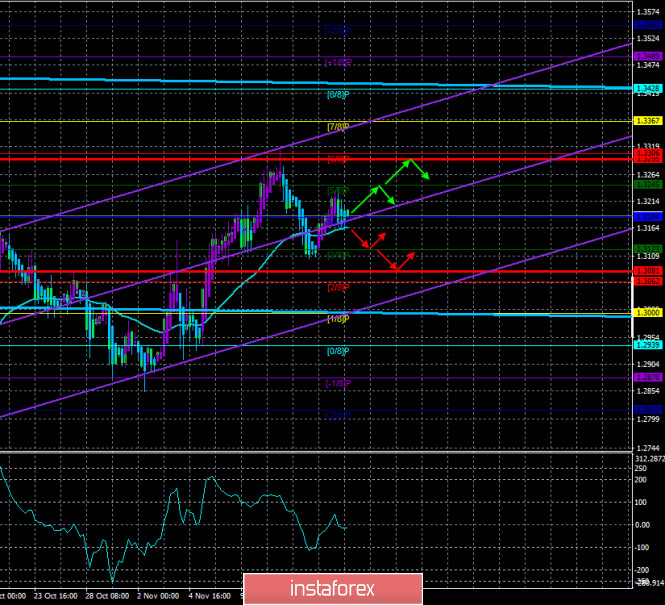
| Posted: 16 Nov 2020 04:30 PM PST 4-hour timeframe
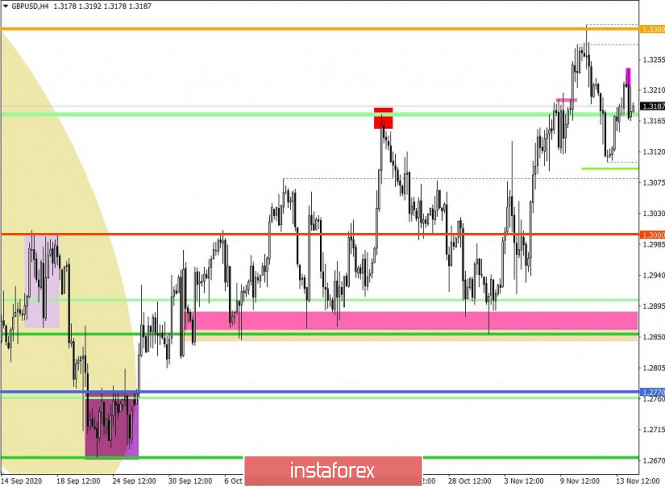
Technical details: Higher linear regression channel: direction - sideways. Lower linear regression channel: direction - upward. Moving average (20; smoothed) - sideways. CCI: -12.0718 The British pound sterling paired with the US dollar continues quite contradictory movements. The pair's quotes are currently located above the moving average line, which seems to maintain an upward trend. However, just on Friday, the price was already falling below the moving average, but could not continue to move down. Now it may be the opposite, the pair may start a new round of downward movement despite fixing above the moving average. If you look at the movement of the pound/dollar pair in the last few months, you can see that the price very often overcomes the moving average, however, it does not lead to a change in the trend to the opposite. And we have already talked about the fundamental background a million times and nothing has changed for the British pound in recent days. The future of the British economy is so hazy that even all American problems look trivial against this background. Therefore, we continue to expect the British pound to fall despite the epidemiological problems in the United States, as well as all the political confusion that has persisted there in recent months. Meanwhile, negotiations on a trade agreement between the European Union and the UK, which will take effect (in theory) after the end of the "transition period", that is, on January 1, 2021, are continuing. The next round of talks began on Sunday in Brussels, as stated by the chief negotiator from the British side, David Frost. Frost also said that since October 22, the parties have been negotiating every day, and during this time there have been some positive developments. David Frost expressed hope that the parties will eventually come to an agreement but also warned that negotiations may fail. According to Frost, there is a common draft agreement between London and Brussels, however, there are still serious differences on several important issues. Meanwhile, "Boris Johnson's deadline" was this Sunday. Recall that on October 15, Boris Johnson graciously allowed the negotiating groups to extend the terms of discussion of the deal for 1 month. Naturally, the parties did not have time until November 15, since it was clear from the very beginning of the negotiations that such deals are not concluded in a few months. However, the point is not even in "Johnson's deadlines". The bottom line is that the end of the "transition period", which the same British Prime Minister refused to extend, is inexorably approaching. Given that it will take more time for both Parliaments to ratify and accept the deal, the negotiations need to be completed in the next few days to make it to December 31. However, several British media call the date of November 19, when everything can end. On this day, the parties will either announce an agreement or another failure. The EU summit is scheduled for this day and it is at this summit that the final decision should be made. If a deal cannot be agreed before then, then from January 1, Britain and the EU will trade with each other according to WTO rules. Of course, no one forbids them to resume negotiations in the new year. But in any case, this means that for a while the Alliance and the Kingdom will trade with each other on not the most favorable terms. As we can see, there is still no positive news from the UK. The problems remain the same and only their solution can lead to some weakening of the negative situation for the pound. What is interesting is that with such a failed fundamental background, the pound continues to show growth. Thus, it seems that the current exchange rate of the pair already includes a deal with the European Union. If so, then if an agreement is announced, there may not be any special reaction from traders. And if there is no announcement, the pound may rush down with renewed vigor. However, Brexit is not alone. The Foggy Albion is full of other problems. For example, epidemiological. We said that the situation with the "coronavirus" is very difficult in the United States, however, the situation in the UK is no better. The country remains in first place among the EU countries in the number of deaths from the "Chinese virus", as well as the third in the number of cases since the beginning of the pandemic. The number of daily recorded cases of COVID-2019 is growing day by day, as in the States. And the UK government does not want to introduce quarantine ("lockdown"), putting the priority of the economy over health care. In principle, the situation now looks like this: the British are allowed to go to work and school, as well as to places of basic necessity and to walk in the fresh air, but all other activities are prohibited. Boris Johnson himself went into self-isolation, as he came into contact with an infected "coronavirus". The Prime Minister said that he has no signs of illness, but, according to quarantine rules, he is forced to stay out of contact with anyone for some time. Johnson is going to work remotely. Based on all the above, we expect a resumption of the downward movement in the near future. In America, the situation is difficult, but in the UK it is even more difficult. In America, the power will change in 10 weeks, in the UK - in a few years. The United States can expect an improvement in the economic, epidemiological, geopolitical, and political picture, while the British can only expect things to get even worse. Thus, we are waiting for a new price consolidation below the moving average line. It should also be noted that there are almost no "ordinary" statistics and "ordinary" reports now. Bank of England Governor Andrew Bailey has been making a lot of speeches lately, but he doesn't tell the markets anything extravagant. His speeches are more focused on the topic of the pandemic and the vaccine.
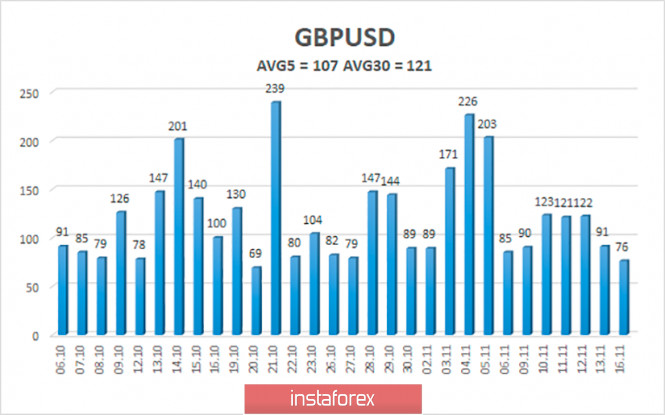
The average volatility of the GBP/USD pair is currently 110 points per day. For the pound/dollar pair, this value is "high". On Tuesday, November 17, thus, we expect movement inside the channel, limited by the levels of 1.3081 and 1.3295. A reversal of the Heiken Ashi indicator to the top signals a possible resumption of the upward movement. Nearest support levels: S1 – 1.3184 S2 – 1.3123 S3 – 1.3062 Nearest resistance levels: R1 – 1.3245 R2 – 1.3306 R3 – 1.3367 Trading recommendations: The GBP/USD pair is trying to continue moving up on the 4-hour timeframe. Thus, today it is recommended to open new longs with targets of 1.3245 and 1.3295 if the Heiken Ashi indicator turns up. It is recommended to trade the pair down with the targets of 1.3123 and 1.3081 if the price is again fixed below the moving average line. The material has been provided by InstaForex Company - www.instaforex.com |
| Posted: 16 Nov 2020 04:30 PM PST 4-hour timeframe
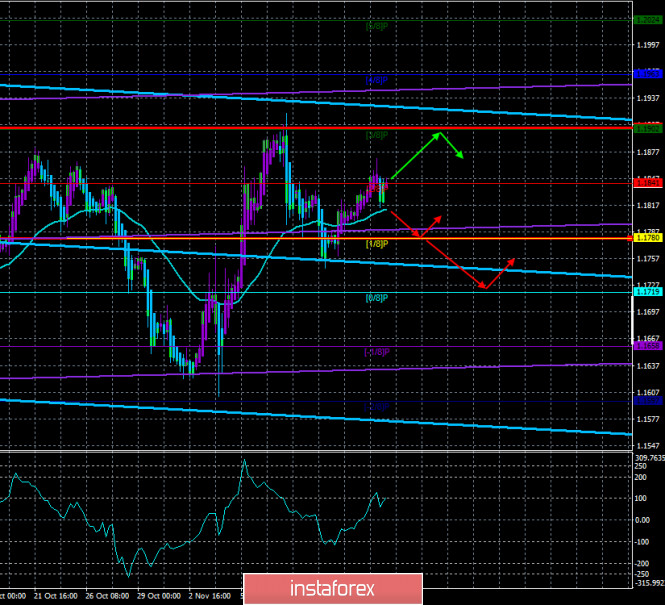
Technical details: Higher linear regression channel: direction - downward. Lower linear regression channel: direction - sideways. Moving average (20; smoothed) - sideways. CCI: 105.2632 The first trading day of the week for the EUR/USD pair was very quiet. Volatility during the day did not exceed 50-60 points, which is the average value for this pair. This is exactly what we said in previous reviews: on Monday, trading is unlikely to be overly active. Especially if you take into account the lack of macroeconomic publications and important news. And there was no news that day. No, of course, certain messages were received during the day, however, there was nothing that could stir up the markets. Thus, neither the fundamental background nor the technical picture changed at all during Monday, November 16. The pair is still trading inside the side channel of 1.1700-1.1900, so there is no long-term trend. Short-term trends appear from time to time, however, they are not always there. Therefore, market participants should still take into account the fact that a strong movement in one direction should not be expected now. Naturally, the main newsmaker in America remains the current President, Donald Trump. He continues to load Twitter daily with angry posts about election fraud, as well as threats of legal proceedings against anyone who violated the fair election procedure. However, now it seems that no one is listening to Trump anymore. That is, he is still the President of the United States, but everyone already treats him as the loser of the election. Consequently, the President is already called Joe Biden. However, we remind traders that Trump will remain President for another 10 weeks, until January 20, 2021. And there are no restrictions on its powers. That is, formally, it can tighten sanctions against China tomorrow or start a new trade war with any country or make some other "strong" decision. Yesterday, such news was made available to market participants. It became known that Trump is going to tighten sanctions measures against China. For what? According to some American publications, to "leave a memory" and make the task of reconciliation between China and the United States as difficult as possible, which Joe Biden may pursue. It is also reported that the White House is going to impose many sanctions against Chinese officials, as well as limit and complicate the process of trade between the two countries as much as possible. American media also report that Trump also pursues the goal of maintaining the country's chosen course of development for as long as possible. And in this course, there is a clear hostility against China. Maybe Trump intended to run for President in 4 years? This will not even be surprising. Age, as this election has shown, is not a hindrance at all. Joe Biden is 78 years old. In four years, he will be 82 and Trump will be 78. Thus, the current President has a chance of winning the elections in 2024. Especially if everything he's said in recent months about Joe Biden and his intentions as President turns out to be true. Let's imagine a hypothetical situation that in four years Biden's results will be unsatisfactory, and the situation in America will worsen. Then it turns out that Trump was right and this judgment alone may be enough for Americans to vote for him in 2024. In general, President Trump may still be in power for a long time and will wait for a new chance to climb to the very top of politics in the United States. Meanwhile, the situation in the US may start to heat up again. And this warming up is unlikely to bring anything positive to the US currency. In recent weeks, we have actively written about the fact that the US dollar may start to rise in price after the election, as the tension should subside from the markets, and uncertainty should be leveled. However, as the first two weeks after the election showed, nothing much has changed in the mood of traders. They still keep the pair inside the channel of $1.17-$1.19 and can't get the price out of it. Thus, there were no special reasons for buying the European currency, however, the US dollar does not give any reasons for buying it. It turns out that the struggle between the two currencies will again slide into the area of "which country is more negative". In the European Union, the main problem now is the "coronavirus", its second wave. However, many countries have introduced repeated "lockdowns", so the situation should stabilize in the near future. In the States, there is no "lockdown", and the number of cases is growing day by day. Last time (a few weeks ago), we reported about 50-60 thousand cases daily. Then there were elections, and the topic of "coronavirus" faded into the background. And now every day in the United States, 150-200 thousand cases of the disease are recorded. Even in a developed country like the United States, the medical system can collapse at these rates. However, Trump does not say anything about this. And in general, for a very long time in his speeches, he spoke about the pandemic. Last time, at one of his campaign rallies, he said that American doctors are very smart and get fabulous profits from the "coronavirus". The fact that American doctors themselves are sick and dying from COVID-2019, Trump chose to remain silent. In general, the US dollar may again come under serious market pressure in the current conditions due to the extremely complex epidemiological situation in the US. And the economy of this country may begin to slow down or shrink again because of this. Thus, the euro may start to grow again against the US currency without correcting after the growth of 1300 points. Well, all possible actions of Donald Trump as President in the next 10 weeks may lead to an even greater fall in the dollar, since Trump has not yet announced anything worthwhile for his final period in power. From a technical point of view, the euro/dollar pair continues to remain above the moving average, so the upward trend continues. Therefore, a rebound from the moving average may trigger a new round of upward movement to the Murray level "3/8"-1.1902, which is also the upper line of the side channel.
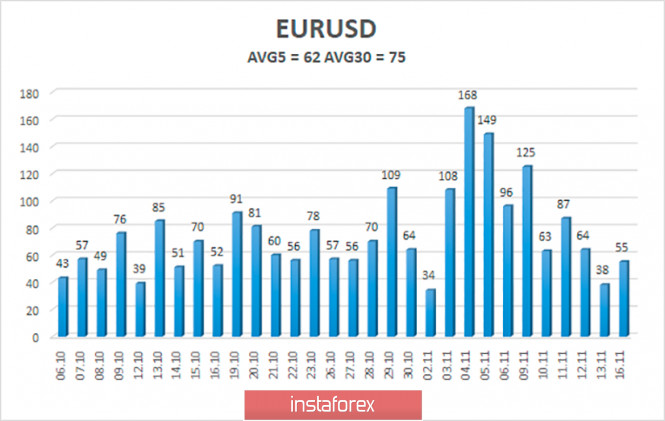
The volatility of the euro/dollar currency pair as of November 17 is 62 points and is characterized as "average". Thus, we expect the pair to move today between the levels of 1.1779 and 1.1903. A reversal of the Heiken Ashi indicator to the top may signal a new round of upward movement. Nearest support levels: S1 – 1.1780 S2 – 1.1719 S3 – 1.1658 Nearest resistance levels: R1 – 1.1841 R2 – 1.1902 R3 – 1.1963 Trading recommendations: The EUR/USD pair has started a new round of correction but remains above the moving average. Thus, today it is recommended to open new long positions with a target of 1.1902, when the Heiken Ashi indicator turns up or the price rebounds from the moving average. It is recommended to consider sell orders if the pair is fixed below the moving average with the first targets of 1.1780 and 1.1719. The material has been provided by InstaForex Company - www.instaforex.com |
| The vaccine is killing the dollar Posted: 16 Nov 2020 03:53 PM PST The dollar exchange rate against the basket of competitors was kept in the red zone on Monday. Investors started the new week with relative optimism after the economic data from Asia and hopes for a successful COVID-19 vaccine. Thus, they bet on the positive in the somewhat distant future, but refuse to notice what is happening now. In the US session, the dollar's decline increased. The latest news about the vaccine contributed to this dynamic. Another company announced the creation of a medicine for coronavirus and informed them about the successful tests reported by Pfizer and BioNTech. The biotech company Moderna said that at the end of the third phase of testing, the drug showed an effectiveness of 94.5%. Markets are pinning high hopes on a vaccine that should save the global economy and are abandoning the dollar in favor of riskier currencies. As for the optimism around the economic recovery, investors are playing down Japan's third-quarter GDP data. According to the first estimate, the growth was 5%. In annual terms, the economy expanded by 21.4%. The indicator increased for the first time in four quarters. It seems that the Japanese economy is more successful in dealing with the consequences of the pandemic than the US, which increases the attractiveness of investing in the yen. In addition to the fundamental weakness of the dollar, strong support for the Japanese currency on Monday was provided by published macroeconomic data. The USD/JPY pair declined during the trading session, continuing to develop the corrective momentum of the previous week. Pressure on the dollar increased, in particular, due to the fact that in the United States for the first time 150 thousand new cases of coronavirus infection were detected. The number reached new records in more than a dozen States. Weak statistics also contributed to the decline. The preliminary consumer sentiment index in November was 77.0 compared to October's 81.8. Markets expected the indicator to be 81.5. Market players are becoming more confident in their expectations regarding the latest monetary stimulus measures for the US economy. A decision can be made as soon as possible. The US dollar now is not just weakening but is at the very beginning of the decline path, credit Agricole notes. After Joe Biden officially takes office as President of the United States, his first priority will be to fight the pandemic. The very fact of Donald Trump's departure will be a positive factor for world trade and the further recovery of the global economy. This will make the dollar the main loser of the currency market. The major exporters - Europe and China - should benefit the most from the yuan and Euro and the repatriation of foreign exchange earnings will increase demand for their currencies. The Euro is undervalued against the US currency according to Bank strategists. They are also optimistic about the pound. As for the Swiss franc, its fall is due to the General withdrawal of investors from protective assets after the US presidential election and good news about vaccines. Meanwhile, the EUR/USD pair is surrounded by short-term uncertainty. The Euro went up to 1.1855. A new test and a confident consolidation above the 1.19 mark on the dollar's weakness could be the start of a big rally. The nearest target is 1.20. In General, there is a potential for strengthening to 1.23. In the event of a new trend reversal that confirms the weakness of the euro bucks, the 1.16 mark will return to the spotlight. The material has been provided by InstaForex Company - www.instaforex.com |
| Britain is buying a vaccine and preparing for a deal. How will the pound react? Posted: 16 Nov 2020 03:53 PM PST
On Monday, the British pound fell slightly, despite risk appetite being boosted by strong Chinese economic data and news of progress on the COVID-19 vaccine. In general, a positive attitude to risky assets should play in favor of the sterling, unless the political crisis worsens with the country's exit from the EU. As one of Boris Johnson's most influential aides quit, Brexit problems mount. Dominic Cummings, who drew up the plan for negotiations with the EU, announced his departure at the end of last week. The negotiations are not yet complete, and it is not clear where Boris Johnson might end up. The British Prime Minister is under pressure from influential members of the Conservative Party. They want to force him to change his position in the negotiation process and take control of the situation with the pandemic. The transition period for leaving the EU, meanwhile, ends on December 31, and one of the European senior officials made it clear on Monday that it is too late to conclude a trade deal with Britain. There may be problems if the situation doesn't get off the ground in the next week or 10 days. Johnson replied that his country would thrive with or without a deal—another verbal salvo from both sides. Meanwhile, investors continue to believe that a deal will be reached. According to currency strategists, "It seems that the market is preparing for a deal at some stage." In addition, they admit that the departure of Dominic Cummings may play a positive role here: Britain will be more willing to compromise. Perhaps the parties are preparing to conclude a deal this week. After Moderna reported positive coronavirus vaccine trial results, the UK began negotiations with the company regarding access to the drug. Moderna is now expanding its European supply chain. This means that the drug will be available to the British in the early spring of 2021. The government gives preference to deals with the developers of vaccines that are not only advanced, but also would have guaranteed early shipment to the UK. This was announced by a spokesman for Prime Minister Boris Johnson.
The dollar index remains in a bearish trend, short positions will still be relevant. Morgan Stanley forecasts that the US currency index will fall by 4% next year. Faith in vaccines holds out hope for a faster recovery in the American economy. On Monday, Moderna declared 94% effectiveness of its experimental coronavirus vaccine. This result far exceeded expectations and was even better than Pfizer's. The US Treasury Department is currently holding a $ 61 billion bond offering. Purchases of securities by the Federal Reserve amount to $ 6 billion. There are much more purchases from the Ministry of Finance, which may cause short-term demand for the US currency. Furthermore, the operations of the financial Department and the Fed will increase the amount of dollars in the system, which will put pressure on the greenback. On Monday, the EUR/USD pair is undergoing a slight correction, after which the upward trend will resume.
Societe Generale analysts are bullish on the euro. In their opinion, the growth will be facilitated by the continued reduction of spreads between the yields of the main and peripheral Euroblock government securities. Thus, the November high of EUR/USD at 1.1920 will be the last obstacle to the long-awaited breakout of the 1.20 level. In the fourth quarter, lockdowns will undoubtedly slow down economic activity in the region. However, the most important thing now is confidence in the prospects for the next year. A potential vaccine against coronavirus needs to support the economic recovery. The material has been provided by InstaForex Company - www.instaforex.com |
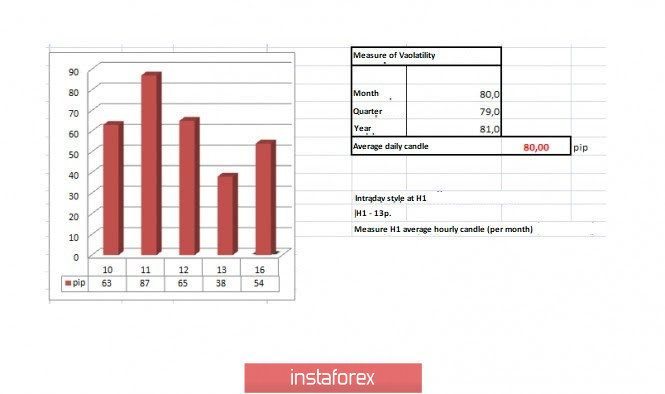
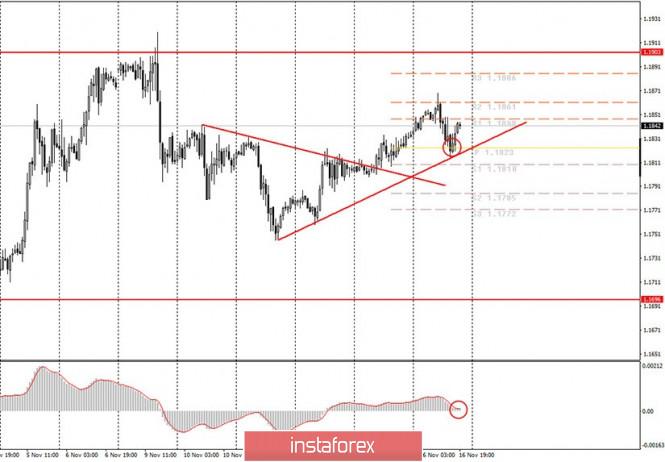
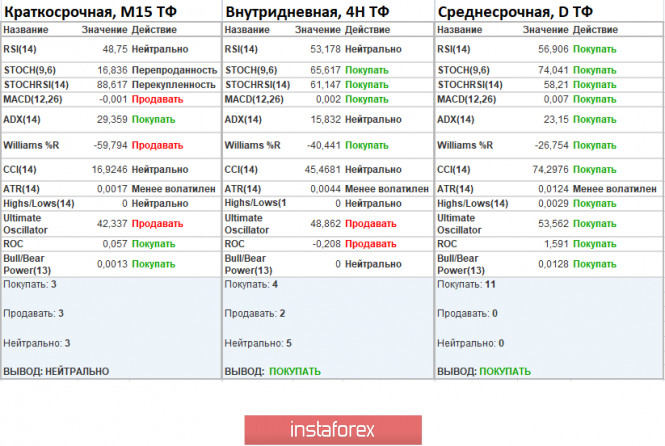
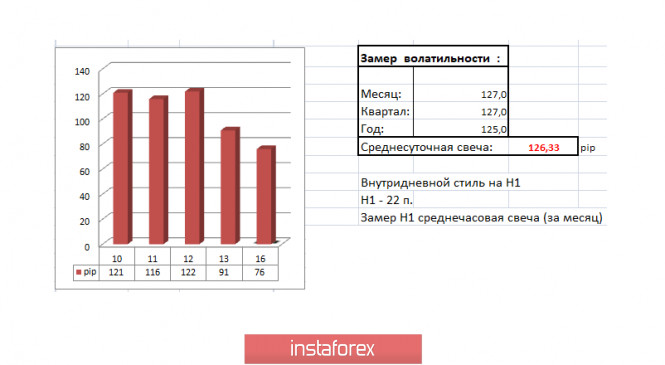
| EURUSD-Great America is like a circus Posted: 16 Nov 2020 03:53 PM PST How long will the election of the President of the United States last? Even the Americans themselves cannot answer the question. It seems that though the elections have passed, it seems that they are still going on. Someone is already appointing new Ministers while someone is still hoping for victory. We are talking about two main characters, Trump and Biden, who decided to make the 2020 election memorable for a long time. Everything would be fine but the coronavirus pandemic is raging in the world and its trend is growing. Experimental vaccines for the virus have been developed. The economy is going through the worst of times. Investors are scared. Put yourself in the shoes of strategic investors. They see the media shouting victory for Biden, who without official results calls for a transfer of cases and appoints new ministers. At the same time, the incumbent President is firing off sparks and tweets, calling for a recount and accusing Biden of rigging the election. "He won because the election was rigged. There were no observers to monitor the voting and counting of votes. The vote is being conducted by a private company of the radical left, Dominion, with a bad reputation and mindless equipment that could not even pass certification in Texas, Fake & Silent Media, & More!" Trump said in a tweet @realDonaldTrump Joe Biden's staff responded to such harsh accusations of fraud, saying that Trump's outburst only confirms Biden's victory in the election. "I see this as another confirmation of the reality that Joe Biden won the election," said Ron Kline, a Biden staff member In turn, Trump tweeted that "I won the election!", while Twitter put a note under his post that the information contradicts official sources about the election results. Now you have no questions about why investors are outraged. In terms of technical analysis, you can see that the variable pivot point is 1.1745 coordinates. Relative to it there was a reverse price movement in the area of 1.1860. So the recovery relative to the decline in the period of November 9-11 has an impressive scale but here the main role is played by speculation, which will continue to manifest itself in the market until the circus with the elections ends. Thus, though there is a technical and fundamental justification for the decline, the market may behave differently, depending on the incoming information. As for the market dynamics for November 13, this is an anomaly. Daily activity was only 38 points, which is 52.5% below the average level. Practice shows that a sharp decline in volatility leads to the accumulation of trading forces and this leads to an acceleration in the market. The last time such a large-scale decline in activity was observed on the day before the election, November 2, after which there was an acceleration. Whether there will be a repeat of the scenario, with a high probability but perhaps on a smaller scale. Looking at the trading chart in general terms (daily period), you can see that the price fluctuation over the past month has had high dynamics but the medium-term remains on the market. Today, in terms of the economic calendar, we do not have statistics for Europe and the United States. Speculators will continue to track the information flow on burning topics: Trump & Biden, COVID, Brexit. Analyzing the current trading chart, you can see that the variable resistance was at 1.1870, relative to which the upward cycle from the support level of 1.1745 slowed down and as a result, there was a pullback to the mirror coordinate of 1.1810. As long as the quote is above the 1.1810 coordinate, the risk of a subsequent upward movement towards the local maximum of November 9 - 1.1920 remains. The picture may change if the price is fixed below 1.1810 in the four-hour period, which may lead to the resumption of the downward tact of the beginning of the past week. An additional risk for traders is the ambiguous information noise about the verbal showdown between Trump and Biden, which puts pressure on investors and provokes speculators to chaotic jumps depending on the incoming information. Indicator analysis Analyzing a different sector of timeframes, it is clear that the indicators of technical instruments signal a purchase, where the minute and hour intervals are focused on the fact that the price is fixed higher than 1.1810 but the daily ones work on the inertia of the beginning of the month. The volatility for the week / Measurement of volatility: Month, Quarter, and Year The measurement of volatility reflects the average daily fluctuation calculated for the Month, Quarter, and Year (November 16 was based on the time of publication of the article) The dynamics of the current time is only 54 points, which is 32% below the average level, but can still change due to the high coefficient of speculative operations. Key level Resistance zones: 1,1910; 1,2000***; 1,2100*; 1,2450**; 1,2550; 1,2825. Support areas: 1,1810*; 1,1700; 1,1612*;1,1500; 1,1350; 1,1250*;1,1180**; 1,1080; 1,1000***. *Periodic level **Range level ***Psychological level The material has been provided by InstaForex Company - www.instaforex.com |
| Posted: 16 Nov 2020 01:11 PM PST Hourly chart of the EUR/USD pair The EUR/USD currency pair sharply corrected on Monday, but it was thanks to this correction that a new upward trend line appeared, and this particular trend is visible to novice traders and will also signal the moment when it will be broken. In general, it is much more convenient to trade any pair and instrument when there is a trend line or channel. After the price settled above the downward trend line, traders were already advised to consider options for buy positions. In principle, today's upward movement lasted only until about lunch. Then the price began to fall, which the MACD indicator quickly responded to by turning down. However, a couple of hours ago, the MACD indicator turned up again, which together with a new trend line and a rebound from it gives a good buy signal. As before, we expect an upward movement no further than the upper limit of the 1.17-1.19 horizontal channel, in which the euro/dollar pair has been trading for three months. Novice traders had nothing to pay attention to on Monday. This happens from time to time. However, we already expected that there will hardly be active trading and strong movements in the pair. Not a single report nor an important event during the day. Even the speech of the head of the European Central Bank Christine Lagarde in no way influenced the movement of the pair. Thus, traders will have to wait for new information, which may come at any time and is unplanned. Fortunately, a trend line has now appeared, which greatly facilitates the process of analysis and forecasting. Lagarde is set to speak again on Tuesday. However, most likely, it will also not be interesting, so there will be no reaction to it, just like it was to today's speech or Friday's speech. The US is set to release its data for October retail sales, but the actual change for this month must be very different from the forecast in order for the markets to react to it. In recent months, traders have often ignored macroeconomic statistics, paying attention only to the most important reports like inflation or GDP. And even then not always. Thus, it is highly likely that tomorrow's fundamental background will not affect the course of trading in any way. Perhaps some new information will come from Donald Trump, really important information, but now there is very little chance of that. Possible scenarios for November 17: 1) Long positions are now relevant since traders managed to take the pair above the downward trend line, and then an upward trend line appeared. The growth potential of the euro, as always, is limited by the 1.1903 level, however, you can manage to get a profit even before this level. The MACD indicator has already produced a new buy signal, therefore you are advised to trade up while aiming for 1.1861 and 1.1886. 2) Trading for a fall at this time is irrelevant, since there is a pronounced upward trend. Thus, novice traders are advised to wait for the eloquent completion of the upward trend in order to have a reason to open short positions. Namely, the price should settle below the trend line. In this case, open short positions while aiming for 1.1810 and 1.1785. On the chart: Support and Resistance Levels are the Levels that serve as targets when buying or selling the pair. You can place Take Profit near these levels. Red lines are the channels or trend lines that display the current trend and show in which direction it is better to trade now. Up/down arrows show where you should sell or buy after reaching or breaking through particular levels. The MACD indicator (14,22,3) consists of a histogram and a signal line. When they cross, this is a signal to enter the market. It is recommended to use this indicator in combination with trend lines (channels and trend lines). Important announcements and economic reports that you can always find in the news calendar can seriously influence the trajectory of a currency pair. Therefore, at the time of their release, we recommended trading as carefully as possible or exit the market in order to avoid a sharp price reversal. Beginners on Forex should remember that not every single trade has to be profitable. The development of a clear strategy and money management are the key to success in trading over a long period of time. The material has been provided by InstaForex Company - www.instaforex.com |
| November 16, 2020 : GBP/USD Intraday technical analysis and trade recommendations. Posted: 16 Nov 2020 09:00 AM PST
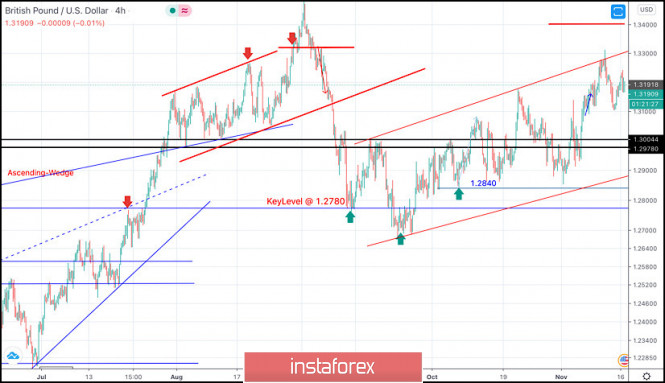
The price zone around the previous channel's upper limit around 1.3100-1.3150 constituted an Intraday Key-Zone to offer temporary bearish pressure on the GBPUSD Pair. However, Bullish Persistence above the mentioned price zone was supposed to allow bullish pullback to pursue towards 1.3400 as a final projection target for the suggested bullish pattern. However, the GBP/USD pair failed to do so, Instead, another bearish movement was targeting the price level of 1.2840 where bullish SUPPORT existed allowing another bullish movement initially towards 1.3000 which failed to maintain sufficient bearish momentum. That's why, the recent bullish breakout above 1.3000 has enabled further bullish advancement towards 1.3250-1.3270 where the upper limit of the current movement channel came to meet the GBP/USDpair. Upon any upcoming bullish pullback, price action should be watched around the price levels of (1.3250-1.3270) for signs of bearish pressure as a valid SELL Entry can be offered. Initial bearish target is located at 1.3000. While S/L should be placed above 1.3300. The material has been provided by InstaForex Company - www.instaforex.com |
| November 16, 2020 : EUR/USD Intraday technical analysis and trade recommendations. Posted: 16 Nov 2020 08:54 AM PST
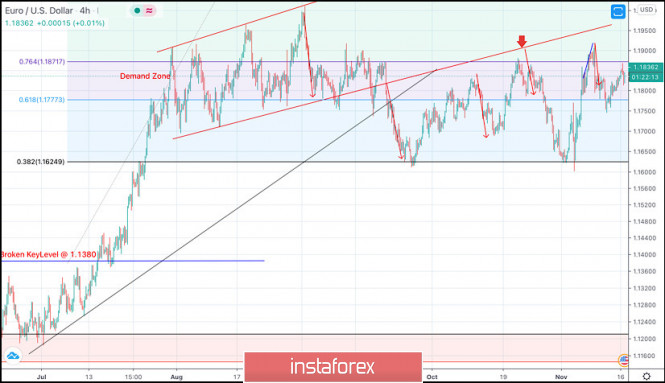
Intraday traders should have noticed the recent bearish closure below 1.1700. This indicated bearish domination for the market on the short-term. However, the EURUSD pair has failed to maintain sufficient bearish momentum below 1.1625 (38% Fibonacci Level). Instead, another bullish breakout was being demonstrated towards 1.1870 which corresponds to 76% Fibonacci Level. As mentioned in previous articles, the price zone of 1.1870-1.1900 stood as a solid SUPPLY Zone corresponding to the backside of the broken channel. Moreover, the recent bearish H4 candlestick closure below 1.1770 was mentioned in previous articles to indicate a valid short-term SELL Signal. All bearish targets were already reached at 1.1700 and 1.1630 where the current bullish recovery was initiated. The recent bullish pullback towards the price zone of 1.1870-1.1900 was supposed to be considered for signs of bearish rejection and another valid SELL Entry. S/L should be placed just above 1.1950. Bearish closure and persistence below 1.1777 (61.8% Fibonacci Level) is needed to enhance further bearish decline at least towards 1.1630. Otherwise, another bullish pullback towards 1.1870-1.1900 shouldn't be excluded. The material has been provided by InstaForex Company - www.instaforex.com |
| November 16, 2020 : EUR/USD daily technical review and trade recommendations. Posted: 16 Nov 2020 08:51 AM PST
The price zone around 1.1880-1.1900 constituted a KEY Price-Zone as it corresponded to the backside of the depicted broken ascending channel where significant bearish pressure and a reversal Head & Shoulders pattern were demonstrated. Two opportunities for SELL Entries were offered upon the recent upside movement towards 1.1880-1.1900. All target levels were achieved. EXIT LEVEL was reached around 1.1720. Early signs of bullish reversal were demonstrated around the recent price levels of 1.1600. Shortly after, the EUR/USD pair has expressed a significant BUYING Pattern after the recent upside breakout above the depicted price zone (1.1750-1.1780) was achieved. As mentioned in the previous article, the pair has targeted the price levels around 1.1920 which exerted considerable bearish pressure bringing the pair back towards 1.1800 which constitutes a prominent KEY-Zone for the EURUSD pair. Trade Recommendations :- Currently, the price zone around 1.1780-1.1800 stands as a significant SUPPORT-Zone to be watched for bullish rejection and a valid BUY Position. Exit level should be placed below 1.1750. The material has been provided by InstaForex Company - www.instaforex.com |
| EUR / USD outlook may be limited as greenback may rise back as safety asset Posted: 16 Nov 2020 07:49 AM PST
Global stock indexes started the week on a positive note. Market participants were encouraged by the strong statistics on Japan and China. According to preliminary estimates, Japans's GDP increased by 5% for the third quarter, and by 21.4% on an annualized basis. Meanwhile, China's industrial production expanded by 6.9% in October, which was estimated to grow by 6.5%. At the same time, the growth of retail sales in the country in the previous month accelerated to 4.3% year-on-year from 3.3% recorded in September. Risk appetite increased on Monday after Moderna reported that its COVID-19 vaccine is more than 94% effective. Against this background, the greenback sank to weekly lows around 92.47 points. The EUR / USD pair continued to rise above 1.1800, which started last week but attracted sellers near 1.1870. "The news around the coronavirus vaccine gives markets a glimpse of hope at the end of the tunnel. This increases the risk appetite, which supports the euro," said strategists at Commerzbank. However, the pandemic continues to rage in Europe and in the US. The number of people infected with COVID-19 has exceeded the 11 million mark in the US. The European Central Bank has already made its intentions clear. However, whether his American counterpart will continue to ease monetary policy is still an open question. It is only known that the regulator does not plan to raise interest rates over the next few years. New restrictive measures in America are local in nature and vary from state to state, so the Federal Reserve does not seem to have an urgent need to ease monetary policy.
Standard Chartered believes that the aggressive increase in the incidence of COVID-19 in the US, as well as the next package of measures to support the national economy that has stalled in Congress, may force the fed to go for additional monetary policy easing before the December meeting. "The US Central Bank may increase the volume of monthly purchases of Treasuries by about 50%, to $120 billion, or take measures to improve lending conditions for businesses. Such off-schedule actions will surprise the market and demonstrate a high degree of concern about the state of the American and global economies. This may collapse the yield of Treasuries, as well as cause a drawdown of USD against the currencies of the Big Ten" the bank's experts noted. Although the euro is still targeting the $1.1900 mark, the positions of the single currency look vulnerable. First, there is still uncertainty about the results of the US presidential election. The current head of the White House, Donald Trump, said that he is ready to continue to challenge the election results in the courts. This may delay the transfer of power to the new President, which will add to the nervousness of the markets. Secondly, according to some reports, Trump wants to introduce tough measures against China until the end of his tenure as head of state. According to experts, such steps by the current President are due to attempts to make it politically unprofitable for his opponent – the likely US President Joe Biden - to change course towards Beijing. Thus, there is reason to believe that investors can quickly lose their appetite for risk, and the protective greenback will again be in the spotlight. In this regard, the opportunities for EUR/USD growth look limited. The material has been provided by InstaForex Company - www.instaforex.com |
| Brexit still influences GBP/USD Posted: 16 Nov 2020 07:29 AM PST The last trading week ended with a rapid strengthening of the British currency. However, most traders are skeptical about this jump due to the very ambiguous situation on the trade negotiations between England and Brussels. Thus, judging by the official data, the British government reported that the sudden departure of two Brexit coordinators from Downing street will not force them to back down, because negotiations with the European side will start from Monday, November 16. Negotiators from the EU and Britain said on Sunday that the coming days would be crucial as each side was trying to overcome key barriers to reach a trade deal. "We've just finished two weeks of intensive talks with the EU. Progress made, but I agree with (EU negotiator) @MichelBarnier that wide divergences remain on some core issues," Britain's chief negotiator David Frost said. "We continue to work to find solutions that fully respect UK sovereignty." In other words, there is progress in the negotiations, but there is no result. Neither of the parties agrees to compromise. There are some issues that have become the main stumbling stone: fishing, equal competition, and cooperation in the field of justice. Due to the fact that there is little chance of progress in the negotiations, there are rumors that the deadline week may be extended, and the negotiations will continue in December. Brexit timetable (Source: Bloomberg) * October 15-16: EU leaders met in Brussels. Initially, it was planned that the agreement would have been signed by that time. • End of October- mid-November: a three-week window to intensify negotiations on the deal. * Additional week, from November 16: negotiations continue * November 19: EU leaders to hold a video conference * November 23-26: the European Parliament meeting will take place. During the meeting, any deal agreed with EU leaders will have to be ratified * December 10-11: next EU summit. If the deal is not signed, preparations will begin for a hard exit from the single market, and this will be the main issue * December 14-17: the European Parliament meets for the last time this year * December 31: end of the Brexit transition period. If both sides do not sign a trade agreement, the United Kingdom will have to trade without a deal Notably, in the above-mentioned schedule, the negotiations could be extended for another period, that is, for 2021, taking into account the previous experience. In terms of technical analysis, we can see that due to the upward movement on November 13, the quote managed to return to the area of 1.3230, where there was a slowdown. Recovery after a decline logged on November 11 and 12 is obvious. However, traders should remain cautious as there are a lot of reasons for the pound's depreciation. I remind you that traders are considering a multi-stage system of decline, which may lead to a change in the medium-term trend. The system was described in the previous analytical review. On November 13, we could see a slight slowdown. The indicator of market dynamic fell below 100 points to 91 points. It is worth noting that the coefficient of speculative operations is still at a high level, which is confirmed by the dynamic over shorter time periods. Let's take a look at the daily trading chart. We can see a medium-term uptrend that is just under 200 pips from the fresh local low. Now everything will depend on speculators and the flow of news on Brexit. Today, neither the UK nor the United States will publish any important macroeconomic data that are worth paying attention to. That is why we have to follow new information about such burning issues as Brexit and the coronavirus pandemic. Analyzing the current trading chart, you can see that the variable resistance is at 1.3240. The upward movement was replaced by a downward one. As a result, the quote was again below the level of 1.3200. This means that sellers still have a chance. In fact, the price fluctuation has a particular amplitude, which in technical analysis is interpreted as a local manifestation. In other words, the upward movement that took place last Friday is not a new round of the upward trend as it is a local manifestation in the market. Often, such manifestations occur in the distribution of speculative hype, which could be confirmed by a sharp drop in the activity near such levels as 1.3105/1.3123 during the period between 20:00 (12.11.20) and 06:00 (13.11.20). We can assume that if the quote continues to hover lower than 1.3200, we will soon return to the area of the support point of 1.3100. As you understand, in order to increase the volume of short positions, the quote must be fixed below 1.3100. Only after this, we will talk about the next stage of the downward movement (price fixation must occur at least on a four-hour period). Alternative scenario Here we will talk about speculative interest. The Brexit negotiations are in full swing, and if we assume that there are rumors that British Prime Minister Boris Johnson may intervene in them, this increases the risk of extraordinary price hikes, depending on his intention. In other words, if Johnson comes out and says that he is ready to reach compromises with the EU, we will have a signal for the strengthening of the pound sterling. If the Prime Minister does not say anything sensible except ultimatums and deadlines, the pound sterling may lose in value. Indicator analysis Analyzing different sectors of time frames (TF), we can see that the indicators of technical instruments have a buy signal due to the fact that the quote is at the stage of an upward cycle. The volatility for the week / Measurement of volatility: Month; Quarter; Year The measurement of volatility reflects the average daily fluctuation, calculated for the month / quarter / year. At the moment, dynamic is 76 points, which is 39% below the average level. Daily activity is low, but the coefficient of speculative operations is high, thus there is a chance of acceleration. Key levels Resistance zones: 1.3300**; 1.3600; 1.3850; 1.4000***; 1.4350**. Support areas: 1.3175(1.3200); 1.3000***; 1.2840/1.2860/1.2885; 1.2770**; 1.2620; 1.2500; 1.2350**; 1.2250; 1.2150**; 1.2000*** (1.1957);1.1850; 1.1660; 1.1450 (1.1411). * Periodic level * * Range level ***Psychological level The material has been provided by InstaForex Company - www.instaforex.com |
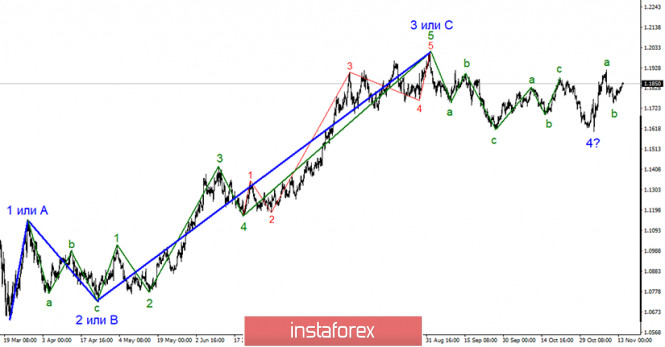
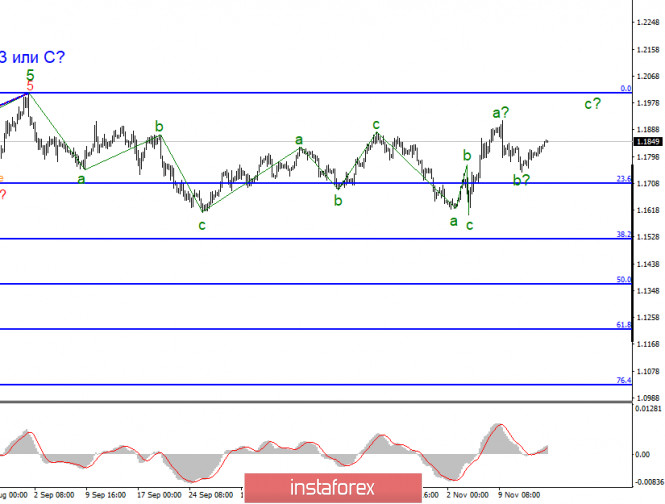
| Analysis of EUR/USD for November 16. Will US face healthcare collapse? Posted: 16 Nov 2020 07:09 AM PST The wave layout for EUR/USD continues to look rather confusing. I am inclined to believe that the construction of the assumed wave 4 and the ascending wave 5 will be completed soon. However, it is also possible that the pair will continue to move within the three-wave structure. Therefore, a new wave may be built from the next uptrend section. In any case, according to the current wave pattern, the pair is expected to advance in the course of the week. A wave layout on a smaller scale also indicates a possible completion of the downtrend that started on October 21. With the recent downward movement, the pair could have formed a C wave within the three-wave structure. As I mentioned in my previous analysis of the 24-hour time frame, the pair can form a new ascending three-wave pattern or resume the uptrend within the global wave 5. In any case, the current wave should signal a rise in the quotes above the peak of the previous A wave, that is, above the 19 mark. The American currency finished last week trying to resume the formation of an ascending wave. This signals the increased demand for the European currency and low demand for the US dollar. Over the past few months, the topic of the US presidential election has been high on the agenda since a lot will depend on the election outcome. Now it is clear that Joe Biden has won the election. Donald Trump, on the other hand, continues to accuse Democrats of fraud and vote count falsification. However, most of the courts refused to consider his claims. It seems that this political issue is finally resolved, and the US dollar can now breathe freely. Yet, this is far from reality. Thus, more than 150,000 new daily coronavirus are recorded in the US. The total number of deaths has already reached 250,000. This is hardly surprising as the country's president has previously refused to introduce a lockdown. Besides, numerous rallies and candidates' speeches have been held in recent weeks before the election. This means that many Americans could have neglected social distancing rules as well as personal protective measures. In short, the US is now truly the hotbed of COVID-2019. Therefore, the US currency cannot be in demand in such a difficult epidemiological situation. The Eurozone is also facing a challenging time. So, the EU authorities have approved the introduction of a second lockdown. Thus, the virus should gradually recede and there are hopes that the second coronavirus wave will end in the short term. In the US, however, everything is just the opposite. The authorities of different states are tightening quarantine measures, but this is clearly not enough to stop the exponential growth of the infection. Conclusion and trading tips EUR/USD has supposedly completed the formation of the three-wave downtrend section. At present, I would recommend buying the pair with the targets located near 1.2010, which corresponds to 0.0% Fibonacci, whenever the MACD indicator generates buy signal. Keep in mind the formation of the C wave. The assumed B wave seems to have completed its formation. The material has been provided by InstaForex Company - www.instaforex.com |
| Evening review of EURUSD on November 16, 2020 Posted: 16 Nov 2020 06:56 AM PST
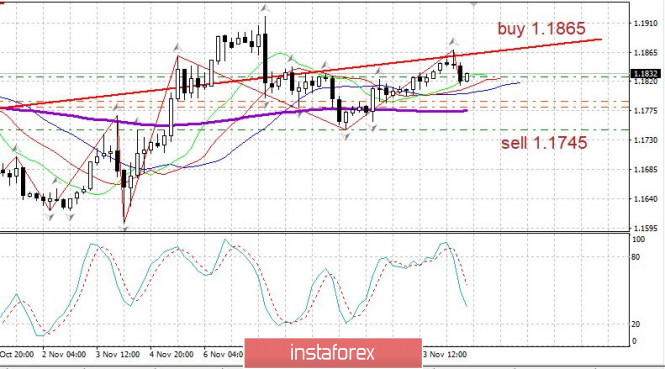
EURUSD: the euro is under pressure from sellers Optimism for the dollar rose after Moderna's excellent vaccine report, with a covid vaccine expected to be at least 94.5% effective. At the same time, the Moderna vaccine does not require such difficult storage conditions as the Pfizer vaccine - the Moderna vaccine can be stored for 30 days at the temperature of an ordinary refrigerator and for a longer period in the freezer. You may keep buying from 1.1825. Sale from 1.1745. Buy from 1.1865. The material has been provided by InstaForex Company - www.instaforex.com |
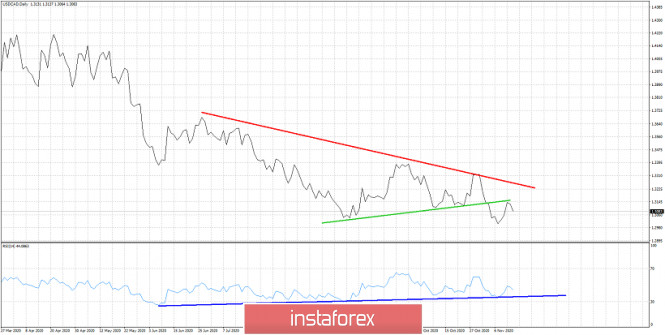
| USDCAD back tests broken support Posted: 16 Nov 2020 06:24 AM PST USDCAD has bounced off 1.29-1.30 towards 1.3150. In previous analysis we noted that price had resistance the broken trend line (previous support) at 1.3150. Price back tested this level from below and we now see rejection signs. This is a bearish sign.
Green line - resistance (previous support) Blue line - RSI support USDCAD is showing rejection signs at 1.3150. As long as price is below 1.3150 we expect price to continue lower towards 1.30 and most probably to 1.29 and break below it. This scenario will be confirmed if the decline in price is followed by the RSI price breaking below the blue trend line support. Another bullish divergence would not be a good sign for sellers. The material has been provided by InstaForex Company - www.instaforex.com |
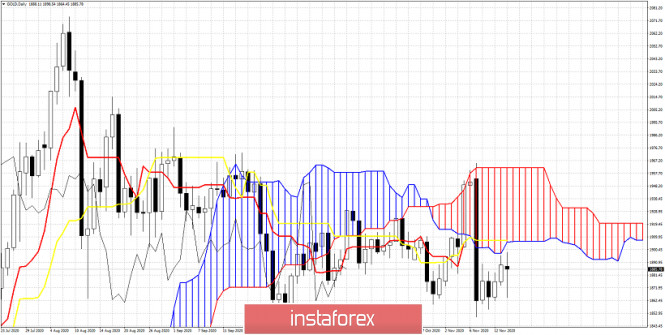
| Ichimoku cloud indicator Daily analysis of Gold Posted: 16 Nov 2020 06:20 AM PST Gold price reached very close to our bounce target of $1,900 as it made a new higher high today at $1,898. Price got rejected and fell all the way back to $1,863 but support held and Gold price is back again near its highs.
|
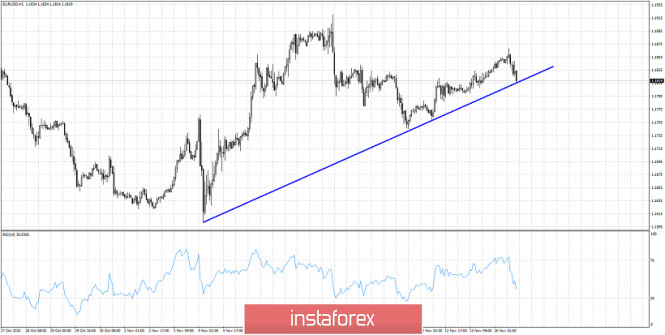
| EURUSD challenges short-term support Posted: 16 Nov 2020 06:09 AM PST EURUSD is pulling back down towards trend line support at 1.1820 after making a top at 1.1868. Trend remains bullish as long as price respects the 1.1745 low. Price continues to make higher higher and higher lows. If price breaks below 1.1820-1.18 area then we will have the first important weakness sign.
EURUSD as shown above has short-term support at 1.1820 (blue trend line). Bulls do not want to see this level broken downwards. Resistance is at 1.1890-1.1920 area. In order to achieve 1.20-1.21 bulls need to break above the resistance. Major support is at 1.1745. Breaking below this level will increase chances for a move towards 1.15. At this point traders better choose the bullish side as the risk is low, as sell stop levels are very close. The reward relative to the risk favors the bullish trade. The material has been provided by InstaForex Company - www.instaforex.com |
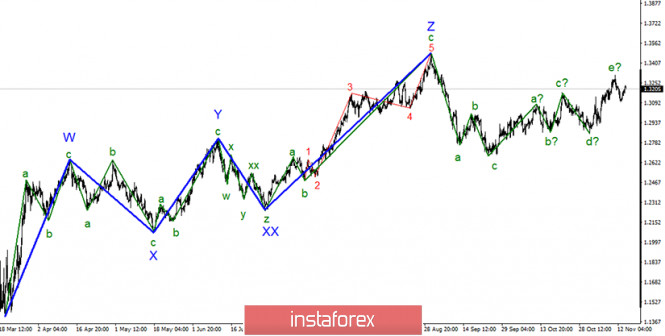
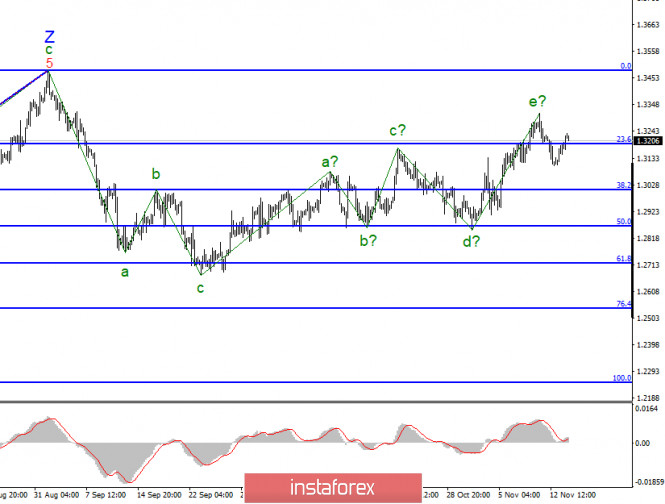
| Posted: 16 Nov 2020 06:03 AM PST From the global viewpoint, GBP/USD is still developing the upward trend. However, the wave layout is getting more complicated. The trend section, which began on September 23, now consists of five waves. Importantly, this uptrend section does not show obvious momentum and could have been over. Thus, the price could have started a formation of a new three-wave section of the downtrend which could build a more complicated structure. Anyway, the technical picture looks like that. In the chart of a shorter timeframe, we can clearly see a-b-c-d waves of the uptrend. Hence, this section could have been already completed. If so, GBP/USD could continue its decline from the current levels with targets at near 1.29 and below. At the same time, the section, which began on September 23, could take a more extended shape. Meanwhile, I'm more poised for the scenario of building a series of downward waves. The scenario with complicated structure remains a possibility. A lot will depend on Brexit news. The market is ready for a formation of the downtrend section. Please be aware that the outlook for the sterling is more complicated than the one for the euro. Indeed, more factors are making impact on the pound sterling than on the euro. So, on the one hand, I still expect a formation of a new downtrend section. On the other hand, traders should take into account a great deal of factors. That's why a wave structure could change and get more intricate. For example, the US is currently dealing with record high coronavirus cases that could deliver a blow to the national economy and the value of the US dollar. So, USD is expected to weaken against EUR. However, the UK is also reporting soaring numbers of COVID-19 cases. Besides, the UK has to solve its own national issues. Brexit is certainly the thorny question. Global investors are closely monitoring the talks with the EU authorities. Another question of major importance is post-Brexit prospects of the UK economy. Last but not least, traders are speculating on further monetary policy of the Bank of England. To sum up, any news on these four vital questions could cause weakness of the sterling. Remarkably, amid the lack of any news, the pound sterling is still enjoying the same demand. In other words, the best thing to do is to wait for any news to find clues. For example, the deadline of the talks on the trade deal passed yesterday. The next step for London and Brussels is either to extend or terminate the talks. This week, the EU and British negotiators are going to announce their decision. Moreover, they are likely to shed light on the status of the trade deal. This information could either support or subdue notably demand for the sterling. Without any new information, I reckon that GBP/USD is more likely to decline because five upward waves have been already complete. Conclusions and trading tips GBP/USD has resumed a formation of the uptrend section. Nevertheless, its last wave could have been already over. At present, I would recommend considering short deals on GBP/USD whenever the MACD indicator generates downward signals. A successful attempt of breaking the level of 23.6% fibo warns that the trading instrument is ready for downward targets located at near 1.3010 and 1.2864 that correspond to 38.2% and 50.0% of the fibo correction. The material has been provided by InstaForex Company - www.instaforex.com |
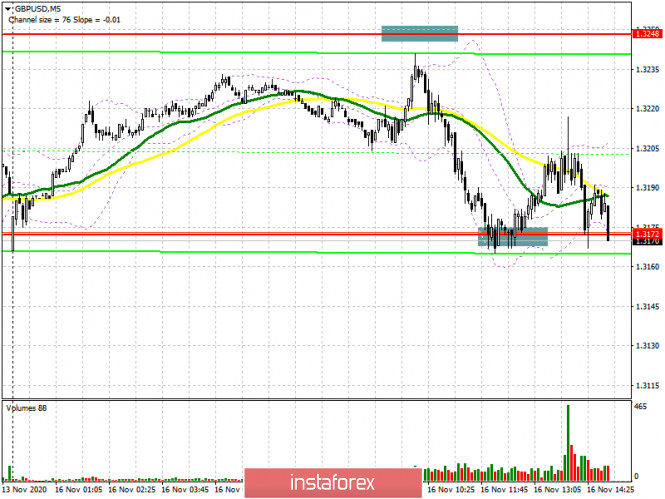
| GBP/USD: plan for the American session on November 16 (analysis of morning deals) Posted: 16 Nov 2020 05:30 AM PST To open long positions on GBPUSD, you need: In the first half of the day, I paid attention to two levels from which I recommended making trading decisions. If you look at the 5-minute chart, you will see how the test of the 1.3248 level, from which I recommended selling the pound, did not take place. As a result, all attention turned to the support of 1.3172, where the situation was more interesting. The formation of a false breakout there with the return of GBP/USD to this range led to the formation of a buy signal and an upward trend of the pair. However, it did not reach a major increase, although the upward movement was about 30 points.
At the moment, nothing has changed from a technical point of view. The initial task for the second half of the day remains to protect the support of 1.3172, which was tested today during the European session. Only the next formation of a false breakout there after an unsuccessful attempt by the bears to take the market under their control will give confidence to buyers and return GBP/USD to the resistance area of 1.3248, where I recommend fixing the profits, since it is unlikely to count on a larger surge in volatility today. Fixing the bulls above the resistance of 1.3248 forms a new entry point for long positions in the expectation of continued growth of GBP/USD and reaching the maximum of 1.3310, where I recommend fixing the profits. The longer-term target will be the resistance of 1.3378, however, it will require a good reason to update it. In the scenario of no bull activity in the area of 1.3172, it is best to take your time and postpone long positions until the test of a new low of 1.3106, where you can buy the pound immediately on the rebound in the expectation of a correction of 20-30 points within the day. To open short positions on GBPUSD, you need: Bears are still fighting to regain control of the level of 1.3172, however, it will be quite difficult to do this without fundamental data on the US economy. I recommend opening short positions in the area of 1.3172 only after the GBP/USD returns to this level and consolidates under it. Testing it from the bottom up will be a good sell signal. In this scenario, you can count on a downward trend in the area of 1.3106, with the first test of which you can observe a slight rebound of the euro up. A longer-term goal is the support of 1.3034, where I recommend taking the profit. If all the bears' attempts are unsuccessful, and the pair again falls back to the middle of today's side channel, it is best to postpone selling the pound until a false breakout is formed in the resistance area of 1.3248 or sell GBP/USD for a rebound from the monthly maximum in the area of 1.3310, based on a correction of 30-40 points within the day.
Signals of indicators: Moving averages Trading is conducted around 30 and 50 daily averages, which indicates an active struggle between buyers and sellers. Note: The period and prices of moving averages are considered by the author on the hourly chart H1 and differ from the general definition of the classic daily moving averages on the daily chart D1. Only a break of the lower border of the indicator in the area of 1.3170 will lead to a new downward wave of the pair. Description of indicators
|
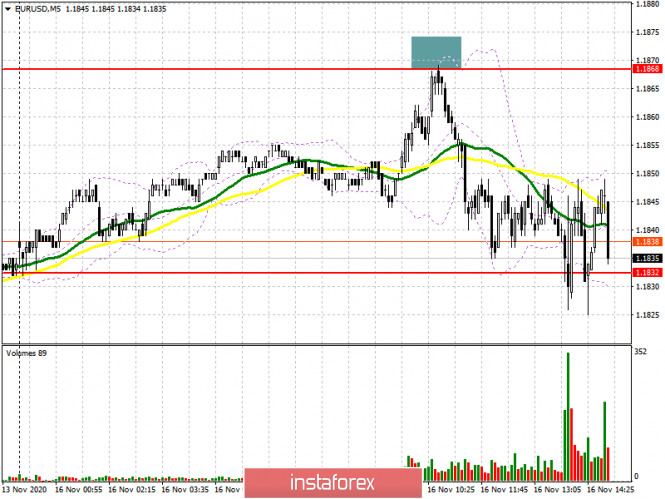
| EUR/USD: plan for the American session on November 16 (analysis of morning deals) Posted: 16 Nov 2020 05:18 AM PST To open long positions on EURUSD, you need: In my morning forecast, I paid attention to the sale of the European currency in the resistance area of 1.1868, provided that a false breakout was formed there, which happened. Let's look at a 5-minute chart of when it was possible and necessary to sell euros. An unsuccessful attempt to consolidate above 1.1868 and a lack of buyer activity - all this led to the return of the EUR/USD pair to this level and to the formation of a good entry point into short positions, which quickly pushed the pair into the area of morning support at 1.1832. It is at this level that all attention will continue to be focused.
By and large, nothing has changed from a technical point of view. Only the formation of a false breakout in the support area of 1.1832, which euro buyers are trying to do now, forms the entry point to long positions. In this case, the goal of restoring the pair will be a repeated test of the resistance of 1.1868, above which it was not possible to get out today. The longer-term goal will be the monthly maximum of 1.1915, where I recommend fixing the profits. Especially important fundamental statistics are not planned for today, so if the bulls do not show activity in the area of 1.1832, and while the bears are clearly aimed at breaking this range, we can observe a further downward correction of EUR/USD. In this case, in the second half of the day, buyers will focus on protecting the support of 1.1797. However, it is only possible to open long positions on the first test based on a correction of 15-20 points within the day. A larger reversal in favor of buyers will occur if they manage to form a false breakout at 1.1743. To open short positions on EURUSD, you need to: Sellers coped with one of the tasks and did not let the euro above the resistance of 1.1868, achieving a false breakout there. In the second half of the day, the focus is shifted to the support level of 1.1832, where the further direction of the pair will be determined. Only a consolidation below 1.1832 and its test from the reverse side from the bottom up form a more convenient entry point for short positions in the expectation of a resumption of the downward trend. In this case, the bears' nearest target will be at least 1.1797, but its test will only be an indication that the pair is stuck in a side channel. Only a breakdown and consolidation below this range will lead EUR/USD to the lower border of the side channel 1.1743, where I recommend taking the profit. It will be possible to talk about a real resumption of the bearish trend only after the test of the minimum of 1.1701. If the bulls are stronger in the second half of the day and again return the pair to the resistance of 1.1868, then you should not rush to sell. Only the formation of a false breakout there, similar to the morning sale, will be a signal to open short positions. Otherwise, I recommend considering selling EUR/USD immediately for a rebound only from the monthly maximum of 1.1915, based on a correction of 15-20 points within the day.
Signals of indicators: Moving averages Trading is conducted around 30 and 50 daily moving averages, which indicates the sideways nature of the market. Note: The period and prices of moving averages are considered by the author on the hourly chart H1 and differ from the general definition of the classic daily moving averages on the daily chart D1. Bollinger Bands If the pair declines, the lower limit of the indicator will act as support in the area of 1.1830, the breakout of which will increase the pressure on the pair. Description of indicators
|


| You are subscribed to email updates from Forex analysis review. To stop receiving these emails, you may unsubscribe now. | Email delivery powered by Google |
| Google, 1600 Amphitheatre Parkway, Mountain View, CA 94043, United States | |
No comments:
Post a Comment