
Forex analysis review |
- Ichimoku cloud indicator Daily analysis of EURUSD
- NZDUSD provides bearish divergence warning
- Gold continues to respect key support at $1,850
- Weekly summary of EUR/USD and GBP/USD
- EUR/USD fluctuates over the news of coronavirus and the developed vaccines
- Trading Signal for GBP/USD for November 20-23, 2020
- GBPUSD: What will be the catalyst for the collapse of the British pound? The UK public sector has slowed down with the growth
- Analysis of GBP/USD on November 20, 2020
- Analysis for EUR/USD on November 20. US election: the battle for Pennsylvania. What's the point of Donald Trump?
- November 20, 2020 : GBP/USD Intraday technical analysis and trade recommendations.
- November 20, 2020 : EUR/USD Intraday technical analysis and trade recommendations.
- GBP/USD: plan for the American session on November 20 (analysis of morning deals)
- November 20, 2020 : EUR/USD daily technical review and trade recommendations.
- EUR/USD: plan for the American session on November 20 (analysis of morning deals)
- Investors dump gold and invest in stocks amid vaccine euphoria
- BTC analysis for November 20.2020 - Upside target reached but potential for the downside rotation towards $17.500
- Trading Signal for EUR/USD for November 20-23, 2020
- Analysis of Gold for November 20,.2020 - Breakout of the rising trendline and potetnial for the downside rotation
- EUR/USD analysis for November 20 2020 - Potential for the dowsnide rotation towards the 1.1850
- Evening review of EURUSD on November 20, 2020
- NZD/USD Growth Confirmed!
- Dollar's decline halted and now the outlook is promising.
- Gold gradually recovers growth after falling for three consecutive trading sessions
- GBP/USD and EUR/USD: Brexit negotiations were paused due to one participant contracting COVID-19. Meanwhile, the US Treasury
- NZD/USD. New Zealand dollar keeps on breaking records
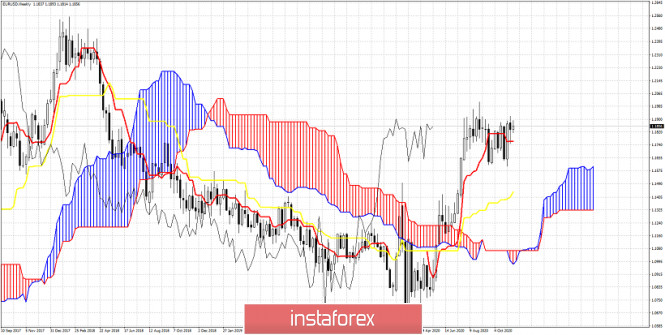
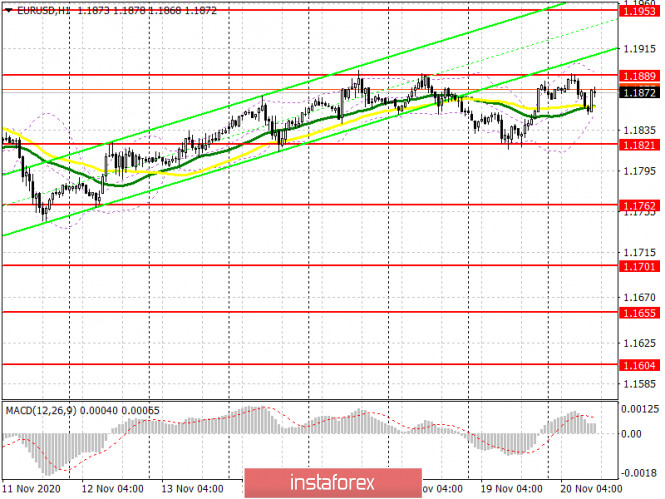
| Ichimoku cloud indicator Daily analysis of EURUSD Posted: 20 Nov 2020 08:23 AM PST EURUSD revisited the 1.1890 high that was tested twice this week and is now pulling back down. We need to remember that from 1.19 area last week price made a sharp reversal lower towards 1.1750 and another reversal in October towards 1.16. So the 1.19 level is very important resistance confirmed several times.
Short-term support as we explained in previous posts is at 1.18. A break below 1.18 would be a sign of weakness. Until then, bulls remain in control of the trend. The material has been provided by InstaForex Company - www.instaforex.com |
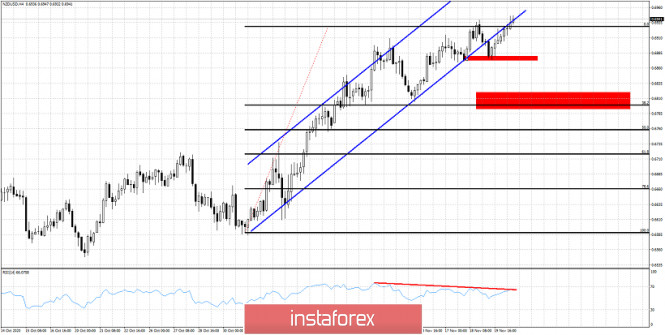
| NZDUSD provides bearish divergence warning Posted: 20 Nov 2020 08:17 AM PST NZDUSD is making a new higher high today at 0.6947 but the RSI does not follow. The RSI is still lower than the previous high and this provides us for the second bearish divergence. Price has broken below the bullish channel and is now back testing the channel from below.
Red rectangles - support levels Red line - bearish divergence NZDUSD tested the first red rectangle support area at 0.6875 and bounced off of it. Support was respected. As we explained in our last post, breaking below this support level will be the first sell signal. We expect one to come as the bearish divergence suggests. Until then bears need to be cautious as price continues to make higher highs. We do not prefer to be bullish in the short-term. We prefer to be bearish and look to sell specially if support fails to hold. First target is the 0.68 level. The material has been provided by InstaForex Company - www.instaforex.com |
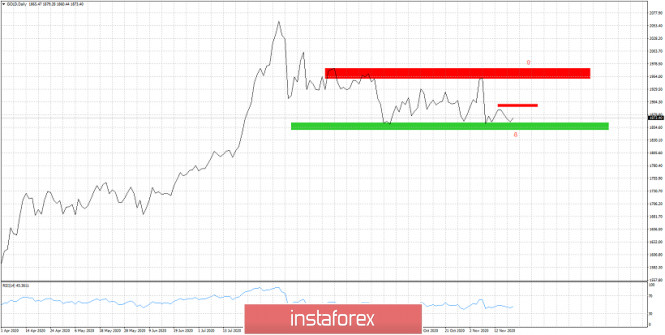
| Gold continues to respect key support at $1,850 Posted: 20 Nov 2020 08:13 AM PST Gold price is bouncing again off the key support of $1,850. Price made a low this week at $1,852 and is now trading at $1,872. Support has held once again. No sell signal given. Bulls need to break above $1,900-$1,906 resistance in order to challenge $1,950.
Red rectangles- resistance levels Green rectangle- key support Gold price continues to trade sideways.For a bearish signal price must break below the green rectangle and stay below it. First obstacle for bulls is at $1,906. Breaking above it will push price towards the next major resistance at $1,950. We prefer to be neutral at current levels or open small long positions near support levels and small short positions near resistance levels. The material has been provided by InstaForex Company - www.instaforex.com |
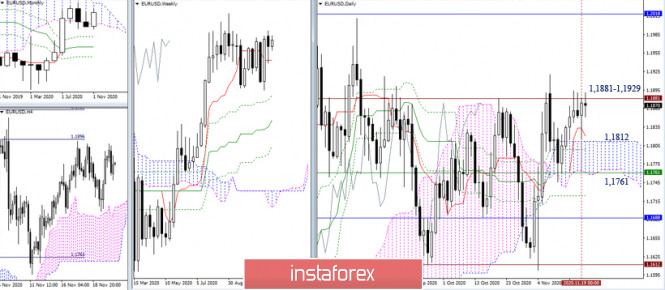
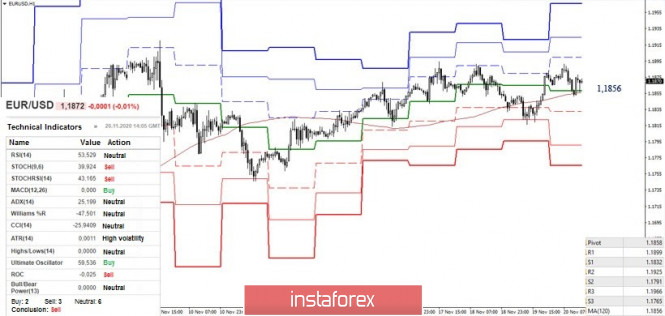
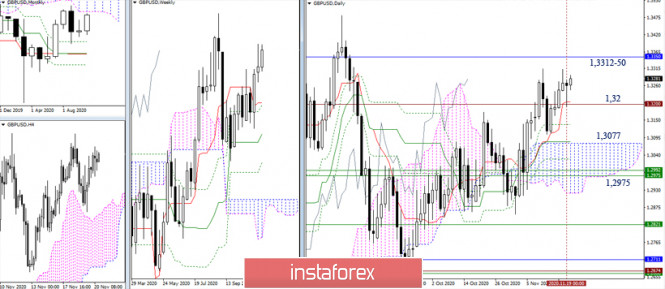
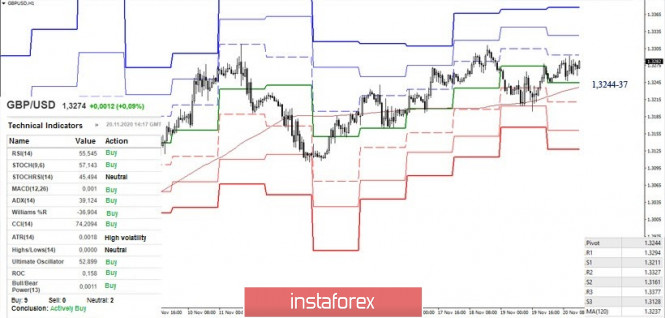
| Weekly summary of EUR/USD and GBP/USD Posted: 20 Nov 2020 07:30 AM PST EUR / USD The end of the next working week is approaching. There were a lot of thinking and expectations for the euro. The range of motion is small, the result is still lacking for both the players and the opponent. The main resistance zone retains its location and value at 1.1881 - 1.1929 (historical level + 100% target development for the breakout of the H4 cloud). Consolidation above will allow traders to hope for an increase in the recovery of the weekly and monthly upward trend (1.2011) and testing the upper border of the monthly Ichimoku cloud (1.2018). Failure of the bulls will bring the pair back to the daily cloud, reinforced by the weekly short-term trend (1.1761). And if the bears can gain a foothold below, then it will be their turn to consider new perspectives and make plans. During the week, the bearish traders tried several times to seize the key support of the lower halves - the weekly long-term trend. And now the euro is testing this line. The weekly long-term trend has joined forces with the central pivot level of the day and is at 1.1856. Consolidation below and reversal of moving averages will give preference to the lower halves to the bearish players, but as long as the weekly long-term trend retains support for bullish interests, they will continue to fight for the resistance zone of the higher halves 1.1881-1.1929. On H1, there are classic Pivot levels 1.1899 (R1) and 1.1925 (R2). GBP / USD During the current workweek, the pound was busy consolidating above the important historic milestone of 1.32. The bulls manage to keep the situation above 1.32 the other day, so they will most likely close the week higher. The weakening factor now is the fact that the bulls failed to update the maximum of the previous one this week (1.3312). At the same time, the resistance of the lower border of the monthly cloud (1.3350) will also complicate the task for the bulls in this area. If the upward traders now retain their positions, then next week they will have to solve the issues of overcoming 1.3312-50. In case of loss of 1.32, the pair will face a daily cloud, reinforced by weekly levels (1.3077 - 1.2975). At the moment, the promoters retain their advantage in the lower halves. The resistances of the classic Pivot levels are now located at 1.3294 - 1.3327 - 1.3377. The situation will be changed by the loss of key supports of the lower halves, which united in the area of 1.3244-37 (central pivot level + weekly long-term trend). In order for the bears to achieve a reliable superiority of forces, they need to take possession of the MA and reverse it. Ichimoku Kinko Hyo (9.26.52), Pivot Points (Classic), Moving Average (120) The material has been provided by InstaForex Company - www.instaforex.com |
| EUR/USD fluctuates over the news of coronavirus and the developed vaccines Posted: 20 Nov 2020 07:13 AM PST
The main currency pair is still trading in a narrow range (1.1820-1.1900), fluctuating between growth and decline. Apparently, market participants are trying to reflect on two very different news events in quotes. On the one hand, reports of progress in developing a coronavirus vaccine are unequivocally positive; on the other, the distribution of the vaccine is a matter of months or quarters. Therefore, in the short term, concerns about the growing number of COVID-19 cases in the world and the deterioration of the global economic outlook are dominating, and investors are in no hurry to abandon the dollar. "The immediate risks associated with an increase in the number of coronavirus infections in the eurozone have become too great to ignore," said strategists at DBS Bank. Over the past day, more than 187,000 new cases of COVID-19 have been reported in the United States, the highest daily increase since the start of the pandemic. At the same time, thanks to the adopted restrictive measures in the EU, the virus is spreading more slowly. If the European authorities manage to reverse the situation before Christmas and resume business activity, albeit in a limited time, the growth of the euro will be justified, which, in fact, is what fans of the single currency are counting on. "Pfizer, BioNtech, and Moderna may receive conditional approval to sell their COVID-19 vaccines in the EU in the second half of next month," Bloomberg reported, citing comments from European Commission President Ursula von der Leyen. This is positive news for the euro. After a number of pharmaceutical companies reported that the coronavirus vaccine they are developing has shown high efficiency in clinical trials, the protective asset greenback went under pressure and sank to 92 points, it went briefly below this level at the end of August. According to Deutsche Bank, the coronavirus vaccines are equivalent to a global financial stimulus.
The US dollar lost about 11% from its March peak as risky assets benefited from stimulating monetary and fiscal policies by central banks and governments around the world to contain the economic impact of COVID-19. "The scenario of USD decline remains quite probable. Many expect the political stalemate in Washington to be most likely offset by the Fed's ultra-soft policy, which provides sufficient liquidity to keep the dollar under pressure. Hence, the FOMC meeting on December 16 is of decisive importance," said experts at Saxo Bank. "However, it is not yet clear whether the Fed is ready to move to a more "dovish" policy, because the regulator's calls for fiscal measures can be considered a statement about the ineffectiveness of expanding the quantitative easing program. The financing conditions are already extremely soft, so from this side, there is also no convincing argument in favor of QE. Therefore, it is possible that the market hopes in vain for the "dovish" measures of the Fed after the December meeting," they added. Meanwhile, clouds are gathering over the euro in the form of possible threats to the EU's existence, which again arise due to problems with the alliance's budget. Earlier, Poland and Hungary vetoed the seven-year EU budget and the accompanying recovery package. The video conference of the EU leaders held the day before did not resolve this issue. If the market senses a problem with the EU budget and the risk of conflict with Poland and Hungary, then the decline will be the path of least resistance for the euro. "The EUR / USD pair held above the support of 1.1808. Next, it should test the resistance at 1.1903. However, only a rise above 1.1920 will confirm that the consolidation that has taken place since the beginning of September ended and the pair resumed its growth with the target at 1.1962-1.1966 and further at 1.2011 and 1.2145-1.2155. Immediate support was moved to 1.1864, the next one is at 1.1832-1.1842. A breakdown of the level of 1.1808 will aim the pair at 1.1788 and 1.1725-1.1745," said Credit Suisse. The material has been provided by InstaForex Company - www.instaforex.com |
| Trading Signal for GBP/USD for November 20-23, 2020 Posted: 20 Nov 2020 07:02 AM PST
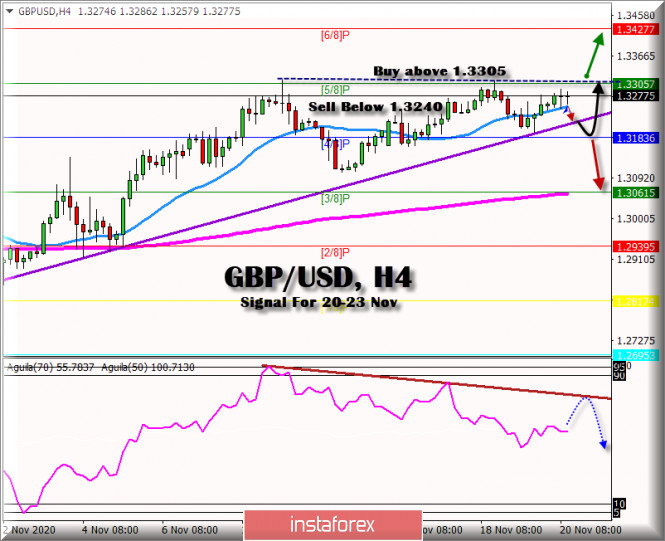
In the early North American session, GBP/USD is trading above the 21-day EMA in 4-hour chart. This is a congestion zone since if it remains above this level, so the pair could continue its uptrend. The Brexit talks remain unresolved on three main issues. It's about fisheries, governance and a level playing field, this keeps the pair on the lookout and is likely to continue to consolidate. However, it will be prudent to wait for a very strong move above the 1.3305 region of 5/8 murray zone (green line) before positioning for any further bullish movement in the short term. A convincing breakout of this level will be seen as a new trigger to buy and will set the stage for a bullish move towards the daily highs of 1.3427 6/8 Murray resistance level (Red line). On the other hand, if the pair retraces below the EMA of 21, the immediate support is near the region of 1.3181, zone of 4/8 of Murray, this level is important to maintain the uptrend of the British pound, If it loses this level, the pound can accelerate the fall to the 200-day EMA at 1.3061. The eagle indicator below a downtrend line means that the market is likely to try to break, but the underlying force is still bearish. Market sentiment has varied, there are 60% of investors with short positions. We see that more buyers enter the market that is in line with the eagle indicator. The currency pair is likely to fall to the 1.30 zone in the coming days. Our recommendation is to sell below 1.3240, with long-term targets up to 1.3060, and buy only if it exceeds 1.3305 with targets at 1.3427. Trading tip for GBP/USD for November 20 - 23: Sell below 1.3245 (break out bellow EMA21) with take profit at 1.3185 and stop loss above 1.3280 Sell if the pair breaks below 1.3183 with take profit at 1.3061 (3/8 murray) and stop loss above 1.3245. Buy if the pair rebounds to 1.3180 (4/8 murray) with take profit at 1.3240 and stop loss 1.3150 Buy with a convincing break above 1.3302 with take profit at 1.3427 and stop loss below 1.3270. The material has been provided by InstaForex Company - www.instaforex.com |
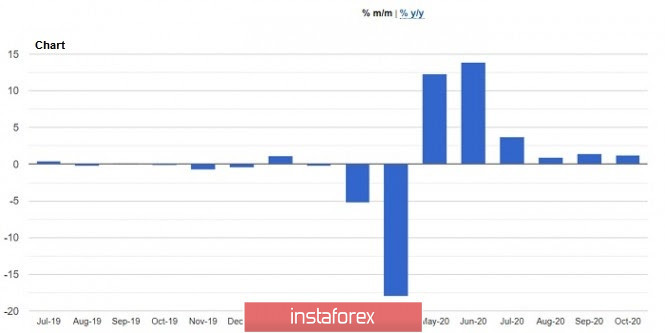
| Posted: 20 Nov 2020 05:53 AM PST The British pound hovered in a narrow side channel, as versatile fundamental statistics did not provide clear guidance for the market. Neither the risk of a Brexit deal breakdown after the trade agreement negotiations stopped, nor bad statistics on consumer sentiment led to a decline in the GBPUSD pair. Does this mean that traders believe in a more rosy Brexit scenario, or will the accumulated effect of negative news eventually win out and the pound will collapse against the US dollar? We will find out about this in the near future. Perhaps the catalyst for a new fall in the pound will be the expected changes in the monetary policy of the Bank of England, which the Governor of the Bank of England, Andrew Bailey, tried to keep silent this week during his speeches. The British regulator has somehow stopped loudly proclaiming the need to introduce negative interest rates recently. We will also decide to wait until the specifics of the trade agreement are determined since this is what the Central Bank will continue to build on. No deal is 99% likely to force the Bank of England to resort to negative interest rates early next year. Let me remind you that the final week of negotiations on a trade agreement between the UK and the EU was the news that someone among the participants of the meeting was infected with the coronavirus. It is clear that in the end, the further meeting was stopped and the decision on the agreement again remained in limbo. Meanwhile, fundamental statistics on the UK economy speak for themselves. Today, a report from GfK on the UK consumer confidence index was released, which declined in November compared to October. The main reason for the decline in the index was another partial lockdown of the economy, which affected consumer sentiment and confidence. The deterioration in the British assessment of their finances was one of the main reasons for the decline in this indicator. According to a report by research company GfK, in November 2020, the index fell to -33 points against -31 points a month earlier. The decline is observed for the second month in a row. The data completely coincided with the forecasts of economists. Data on retail sales in the UK also did not revive the market, although there was a slight increase in October. However, this did not matter at all, as traders are now more concerned about the question of how much they will be reduced again in November this year, after the introduction of the next lockdown. Most of the growth in UK retail sales in October was driven by stronger-than-expected pent-up demand. Although there is still hope that this report will support the economy's growth rate in the 4th quarter of this year, sales growth was recorded only until the lockdown was introduced, and they will almost certainly decline again in November. According to the National Bureau of Statistics, sales increased by 1.2% in October 2020 compared to September, while economists had expected sales to decline by 0.4%. Compared to October last year, sales increased by 5.8%, with forecast growth of 4.1%. The deterioration of the state finances of the UK was not surprising. Today's report that public sector borrowing in the UK in October was less than expected. According to the data, public sector borrowing in October 2020 amounted to 22.3 billion pounds compared to 36.1 billion pounds in September. Economists had expected them to reach 35.5 billion pounds in October. From a technical point of view, nothing has changed. Buyers of the pound are targeting a breakout of the resistance of 1.3310. Only a breakdown of this range will open a direct road to the highs of 1.3380 and 1.3470. It will be possible to talk about the return of pressure on the trading instrument only after a decline to the level of 1.3235, which buyers are now trying to save with all their might. In case of a breakout, more active actions of the bears will quickly push the pound to the support area of 1.3165, and the base of the 31st figure will act as a longer-term goal. The material has been provided by InstaForex Company - www.instaforex.com |
| Analysis of GBP/USD on November 20, 2020 Posted: 20 Nov 2020 05:25 AM PST
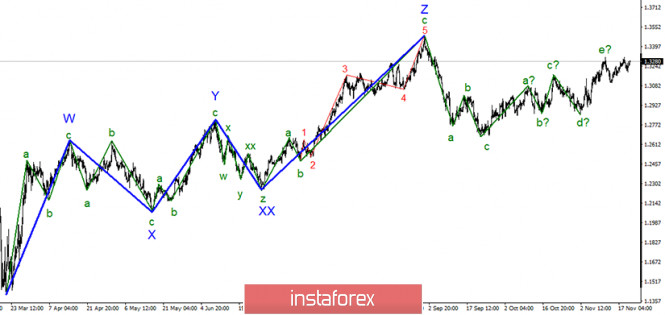
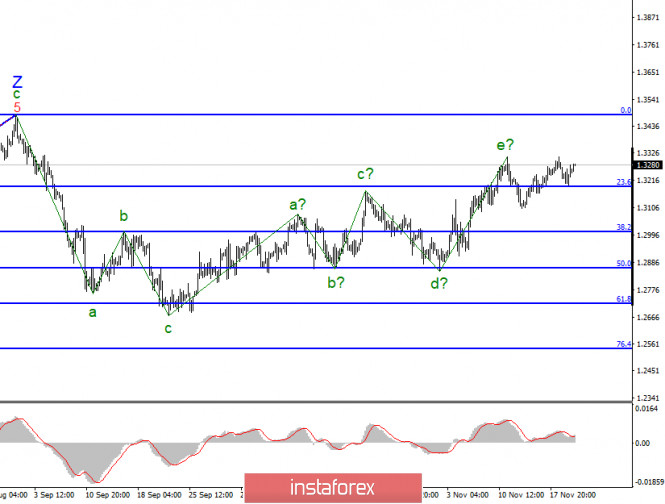
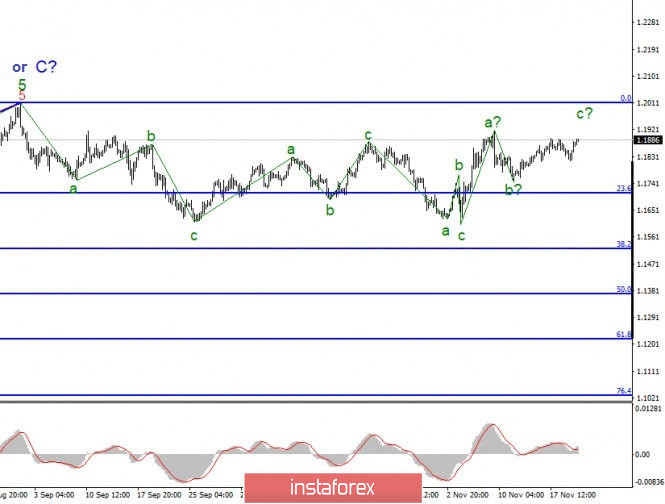
In the most global terms, the construction of the upward trend section continues, but the wave marking takes a complex form and may become more complicated several times. The section of the trend that begins on September 23 has taken a five-wave form, but it is not pulsed and may already be completed. Thus, the construction of a new three-wave section of the trend, or perhaps a more complex descending wave structure, could already begin. A successful attempt to break through the maximum of wave "e" may lead to a complication of this very wave or complication of the entire upward section of the trend.
The lower chart clearly shows the a-b-c-d-e waves of the upward trend section. Thus, this section may already be completed. If this is true, then the decline in quotes will continue from the current levels with targets located near the 29th figure and below. At the same time, the section that begins on September 23 may take on an even longer form. The wave "e" can become more complex and take a pronounced five-wave form. The pound sterling made an unsuccessful attempt to break through the 23.6% Fibonacci level and retains the opportunity to complicate the upward section of the trend, which already looks quite complete. Markets are still waiting for information from Brussels on the progress of the negotiations. However, the negotiation was paused after one of the participants tested positive for COVID-19 and it is not yet clear when they will resume again. Meanwhile, Donald Trump sends batches of lawsuits to the courts of those states where he lost the election. And the second important state after Pennsylvania where the Trump team wants to get the vote reversed is Michigan. In this state, a federal court declined to review the results, but Trump now wants to influence the electors themselves through senior Republican lawmakers. Donald Trump has already invited Michigan Republican Speaker Lee Chatfield and Michigan Senate Majority Leader Michael Shirkey to the White House. Trump is expected to try to influence results in the state with the help of senior Republicans and seek to reverse the results. However, even if all the electoral votes in Pennsylvania and Michigan were taken from Biden and given to Trump, all the same, this will not be enough for the latter to win. But maybe Trump is going to act in the same way in one or more states? We continue to monitor the development of the situation. The US dollar continues to enjoy low demand in the foreign exchange market. General conclusions and recommendations: The Pound-Dollar instrument resumed building an upward trend, but its last wave could have already ended. Thus, now I recommend looking closely at the sales of the instrument for each "downward" signal of the MACD indicator. A new successful attempt to break through the 23.6% Fibonacci level will indirectly indicate that the instrument is ready for a decline with targets located near the calculated levels of 1.3010 and 1.2864, which corresponds to 38.2% and 50.0% for Fibonacci. I recommend waiting for it before opening sales of the pair. A successful attempt to break through the peak of the wave "e" will lead to more complex wave markings. The material has been provided by InstaForex Company - www.instaforex.com |
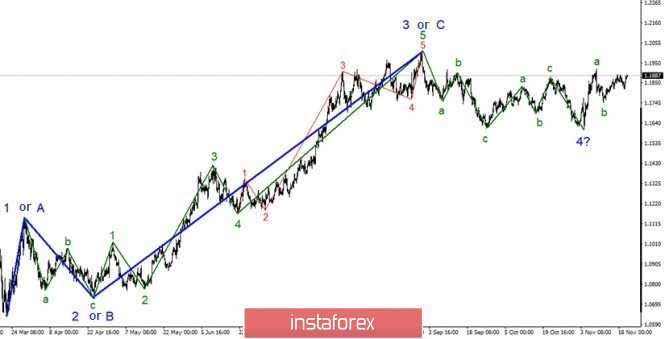
| Posted: 20 Nov 2020 05:24 AM PST The wave marking of the EUR/USD instrument continues to look quite confusing. The current wave structure still allows the completion of the construction alleged global wave 4 and construction of a rising wave 5. However, it is also a possible scenario in which the tool will continue to move three-wave structures, therefore, the construction of the assumed wave from the next three-wave upward trend section continues. In any case, according to the current counting, the instrument quotes are expected to rise in the next week. A smaller-scale wave marking also indicates the end of the downward section of the trend that begins on October 21. Now a new three is being built up, or the upward trend section within the global wave 5 has resumed altogether, as I mentioned when analyzing the 24-hour timeframe. In any case, the current wave should lead to an increase in quotes above the peak of the previous wave a, that is, above the 19th figure. A successful attempt to break through the minimum of wave b will require making adjustments and additions to the wave markup. Demand for the European currency is recovering following the current wave marking, which implies the construction of an upward wave. All the votes in America have finally been counted and Joe Biden has 306 votes and Donald Trump has 232 votes. So the gap is more than 70 votes. Nevertheless, despite such an impressive margin, the team of Donald Trump does not give up and bombards the courts of almost all states in which Trump lost, believing that recounts of votes are needed or even complete cancellations of the voting results. That is, Trump still does not admit defeat. He understands that if the state cancels the election results, there will be no re-election. The electoral college will determine who to vote for. And it is much easier to negotiate with 20-30 people than with several million Americans. The most violent power struggles are now taking place in Pennsylvania. This state gives 20 electoral votes to the winner. Even though Trump is 80,000 votes behind Biden in this state, the President's lawyer, Rudolph Giuliani, asked the state's federal judge to declare Trump the winner. The state judge himself said that Trump's representatives want to recognize the illegal vote in the state and completely cancel its results. According to Giuliani, more than 680,000 votes cannot be counted, since GOP observers were denied access when they were counted. However, the court continues to reject the claims of the Trump team, considering that the arguments and evidence provided by the Republicans are not sufficient. In any case, even if you completely take away all 20 electoral votes from Biden and give them to Trump, the score will be 286-252 in favor of Biden again. Thus, nothing will change from the revision of the results of the vote in Pennsylvania. But maybe Trump intends to act in the same way in several states. General conclusions and recommendations: The euro/dollar pair presumably continues to build a three-wave upward trend section. Thus, at this time, I recommend buying a tool with targets located near the 1.2010 mark, which corresponds to 0.0% Fibonacci, for each MACD signal "up", based on the construction of wave C. The assumed wave b has presumably completed its construction. The material has been provided by InstaForex Company - www.instaforex.com |
| November 20, 2020 : GBP/USD Intraday technical analysis and trade recommendations. Posted: 20 Nov 2020 05:17 AM PST
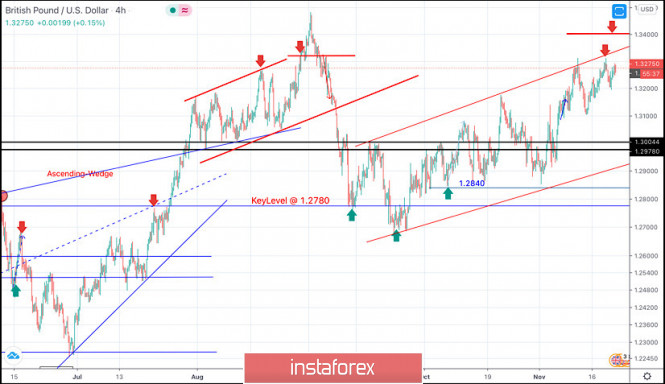
In July, the GBP/USD pair has expressed an Ascending Flag Pattern above the price level of 1.2780. Shortly after, bullish persistence above the price zone of 1.3300 was achieved. This was supposed to allow bullish pullback to pursue towards 1.3400 as a final projection target for the suggested pattern. However, the GBP/USD pair failed to do so. Instead, another bearish movement was targeting the price level of 1.2840 and 1.2780 where bullish SUPPORT existed allowing another bullish movement initially towards 1.3000 which failed to maintain sufficient bearish momentum. That's why, the recent bullish breakout above 1.3000 has enabled further bullish advancement towards 1.3250-1.3270 where the upper limit of the new movement channel came to meet the GBP/USD pair. Upon the current bullish pullback, price action should be watched around the price levels of (1.3270-1.3290) for signs of bearish pressure as a valid SELL Entry can be offered. Initial bearish target would be located at 1.3000. While S/L should be placed above 1.3330. The material has been provided by InstaForex Company - www.instaforex.com |
| November 20, 2020 : EUR/USD Intraday technical analysis and trade recommendations. Posted: 20 Nov 2020 05:16 AM PST
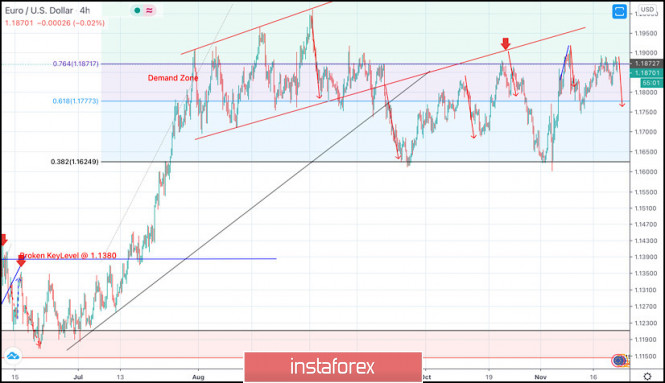
Intraday traders should have noticed the recent bearish closure below 1.1700. This indicated bearish domination for the market on the short-term. However, the EURUSD pair has failed to maintain sufficient bearish momentum below 1.1625 (38% Fibonacci Level). Instead, another bullish breakout was being demonstrated towards 1.1870 which corresponded to 76% Fibonacci Level. As mentioned in previous articles, the price zone of 1.1870-1.1900 stood as a solid SUPPLY Zone corresponding to the backside of the broken channel. Moreover, the recent bearish H4 candlestick closure below 1.1770 was mentioned in previous articles to indicate a valid short-term SELL Signal. All bearish targets were already reached at 1.1700 and 1.1630 where the current bullish recovery was initiated. The curren bullish pullback towards the price zone of 1.1870-1.1900 is supposed to be considered for signs of bearish rejection and another valid SELL Entry. S/L should be placed just above 1.1950. Bearish closure and persistence below 1.1777 (61.8% Fibonacci Level) is needed to enhance further bearish decline at least towards 1.1630. Otherwise, another bullish pullback towards 1.1870-1.1900 should be considered for another valid SELL Entry. The material has been provided by InstaForex Company - www.instaforex.com |
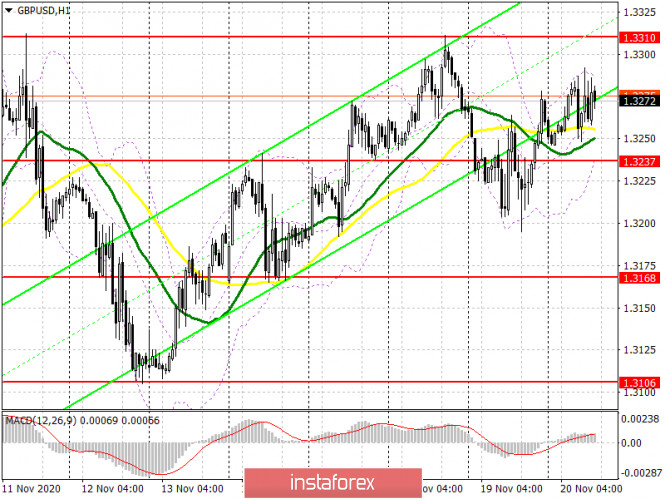
| GBP/USD: plan for the American session on November 20 (analysis of morning deals) Posted: 20 Nov 2020 05:13 AM PST To open long positions on EURUSD, it is required: By analogy with yesterday, a signal was formed to sell the euro in the first half of the day from the level of 1.1864, however, it did not reach a major downward movement from this area, after which the bears retreated. On the 5-minute chart, you can see how the bears break below the support of 1.1864 and test it from the bottom up, which forms a fairly good signal to sell the euro. However, the lack of important fundamental statistics did not allow the bears to implement their plans. As a result, the technical picture has changed slightly. The morning level of 1.1864 has now transformed into the resistance of 1.1889, and it is on this level that euro buyers will focus on today in the second half of the day. On the hourly chart, you can see how this area has already been tested several times over the past two days, which is why its breakdown is so important for euro buyers. A breakout and consolidation above 1.1889 form a good signal to open long positions to continue the upward trend, which will lead to an update of the maximum of 1.1953, where I recommend fixing the profits. A further area will be the resistance of 1.2008. If the pressure on the euro returns in the second half of the day, it is best to postpone purchases immediately for a rebound from the large lower border of the side channel of 1.1821, based on a correction of 15-20 points within the day.
To open short positions on EURUSD, you need to: The bears face a new challenge to defend the resistance of 1.1889. However, only the formation of a false breakout at this level will be a signal to open short positions in the expectation of a decline to the lower border of the side channel 1.1821, where I recommend fixing the profits. Given that important fundamental statistics are not released this afternoon, it is unlikely that the pair's volatility will go beyond these ranges. In the scenario of a breakout and consolidation below 1.1821, we can expect the pair to continue to decline to the support of 1.1762, which will form a new downward trend for the pair. If there is no bear activity at 1.1889 in the second half of the day, I recommend that you stop selling before updating the maximum of 1.1953, where you can open short positions immediately for a rebound based on a downward correction of 15-20 points within the day. The COT report (Commitment of Traders) for November 10 recorded a reduction in long and short positions. Euro bulls are holding a wait-and-see attitude and are in no hurry to return to the market even after the presidential election in the United States. But despite this, buyers of risky assets believe in the continuation of the bull market, although they prefer to act cautiously. Thus, long non-commercial positions decreased from the level of 208,237 to the level of 202,374, while short non-commercial positions remained almost unchanged, falling from the level of 67,888 to 67,087. The total non-profit net position fell to 135,287, down from 140,349 a week earlier. It is worth noting that the delta has been declining for 7 consecutive weeks, which confirms the lack of desire of euro buyers to go to the market in the current conditions. Growth will begin only after Joe Biden's victory and his intentions to give the American economy the next largest monetary aid package for more than $ 2 trillion begin to be realized. Signals of indicators: Moving averages Trade in the area of moving averages, which indicates the sideways nature of the market. Note: The period and prices of moving averages are considered by the author on the hourly chart H1 and differ from the general definition of classic daily moving averages on the daily chart D1. Bollinger Bands A break in the upper limit of the indicator around 1.1889 will lead to a new wave of euro growth. A break of the lower limit of the indicator in the area of 1.1855 will increase the pressure on the pair. Description of indicators
|
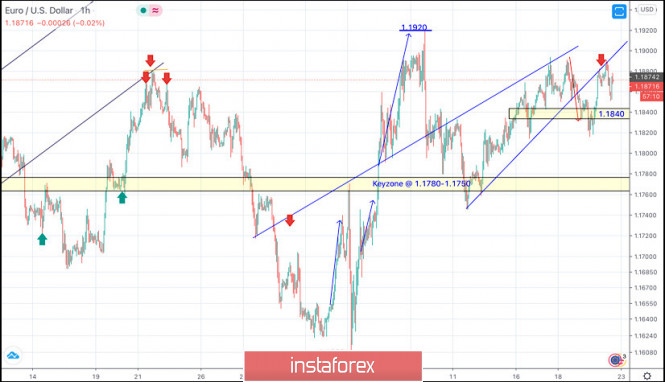
| November 20, 2020 : EUR/USD daily technical review and trade recommendations. Posted: 20 Nov 2020 05:13 AM PST
Recently, Two opportunities for SELL Entries were offered upon the recent upside movement towards 1.1880-1.1900. All target levels were achieved. Evident signs of bullish reversal were demonstrated around the recent price levels of 1.1600. Shortly after, the EUR/USD pair has demonstrated a significant BUYING Pattern after the recent upside breakout above the depicted price zone (1.1750-1.1780) was achieved. As mentioned in the previous article, the pair has targeted the price levels around 1.1920 which exerted considerable bearish pressure bringing the pair back towards 1.1800 which constituted a prominent KEY-Zone for the EUR/USD pair. Recently, the price zone around 1.1840 was mentioned as a prominent KeyZone to be watched for Price Action. Since, then, the pair has been failing to breakthrough below it. Bearish closure below the price zone of 1.1840 is needed to enhance a quick bearish decline towards 1.1750. Trade Recommendations :- Currently, the price zone around 1.1880 ( backside of the broken trendline ) stand as significant Resistance-Zone to offer a valid SELL Entry. Exit level should be placed above 1.1920 The material has been provided by InstaForex Company - www.instaforex.com |
| EUR/USD: plan for the American session on November 20 (analysis of morning deals) Posted: 20 Nov 2020 05:12 AM PST To open long positions on EURUSD, it is required: By analogy with yesterday, a signal was formed to sell the euro in the first half of the day from the level of 1.1864, however, it did not reach a major downward movement from this area, after which the bears retreated. On the 5-minute chart, you can see how the bears break below the support of 1.1864 and test it from the bottom up, which forms a fairly good signal to sell the euro. However, the lack of important fundamental statistics did not allow the bears to implement their plans. As a result, the technical picture has changed slightly.
The morning level of 1.1864 has now transformed into the resistance of 1.1889, and it is on this level that euro buyers will focus on today in the second half of the day. On the hourly chart, you can see how this area has already been tested several times over the past two days, which is why its breakdown is so important for euro buyers. A breakout and consolidation above 1.1889 form a good signal to open long positions in order to continue the upward trend, which will lead to an update of the maximum of 1.1953, where I recommend fixing the profits. A further area will be the resistance of 1.2008. If the pressure on the euro returns in the second half of the day, it is best to postpone purchases immediately for a rebound from the large lower border of the side channel of 1.1821, based on a correction of 15-20 points within the day. To open short positions on EURUSD, you need to: The bears face a new challenge to defend the resistance of 1.1889. However, only the formation of a false breakout at this level will be a signal to open short positions in the expectation of a decline to the lower border of the side channel 1.1821, where I recommend fixing the profits. Given that important fundamental statistics are not released this afternoon, it is unlikely that the pair's volatility will go beyond these ranges. In the scenario of a breakout and consolidation below 1.1821, we can expect the pair to continue to decline to the support of 1.1762, which will form a new downward trend for the pair. If there is no bear activity at 1.1889 in the second half of the day, I recommend that you stop selling before updating the maximum of 1.1953, where you can open short positions immediately for a rebound based on a downward correction of 15-20 points within the day.
The COT report (Commitment of Traders) for November 10 recorded a reduction in long and short positions. Euro bulls are holding a wait-and-see attitude and are in no hurry to return to the market even after the presidential election in the United States. But despite this, buyers of risky assets believe in the continuation of the bull market, although they prefer to act cautiously. Thus, long non-commercial positions decreased from the level of 208,237 to the level of 202,374, while short non-commercial positions remained almost unchanged, falling from the level of 67,888 to 67,087. The total non-profit net position fell to 135,287, down from 140,349 a week earlier. It is worth noting that the delta has been declining for 7 consecutive weeks, which confirms the lack of desire of euro buyers to go to the market in the current conditions. Growth will begin only after Joe Biden's victory and his intentions to give the American economy the next largest monetary aid package in the amount of more than $ 2 trillion begin to be realized. Signals of indicators: Moving averages Trade in the area of moving averages, which indicates the sideways nature of the market. Note: The period and prices of moving averages are considered by the author on the hourly chart H1 and differ from the general definition of classic daily moving averages on the daily chart D1. Bollinger Bands A break in the upper limit of the indicator around 1.1889 will lead to a new wave of euro growth. A break of the lower limit of the indicator in the area of 1.1855 will increase the pressure on the pair. Description of indicators
|
| Investors dump gold and invest in stocks amid vaccine euphoria Posted: 20 Nov 2020 05:10 AM PST
According to analysts, the inflow of funds into global stocks over the past two weeks amounted to a record $ 71.4 billion in history. Mostly investors were invested in US stocks and securities of emerging markets. It is also worth noting that the inflow of funds into the tech sector last week amounted to $ 2.4 billion. Investors are not refusing to invest in actively appreciating shares of technology companies. Analysts also added that next year will be the year of the vaccine, with undervalued stocks appreciating more than emerging stocks, high-yield bonds stronger than investment grade bonds, and emerging market and small business stocks stronger than the S&P 500, and large-cap companies. Last week recorded a record outflow of investments from gold - $ 4 billion. Gold quotes can end the current year with the maximum growth in 10 years. The material has been provided by InstaForex Company - www.instaforex.com |
| Posted: 20 Nov 2020 05:03 AM PST Further Development
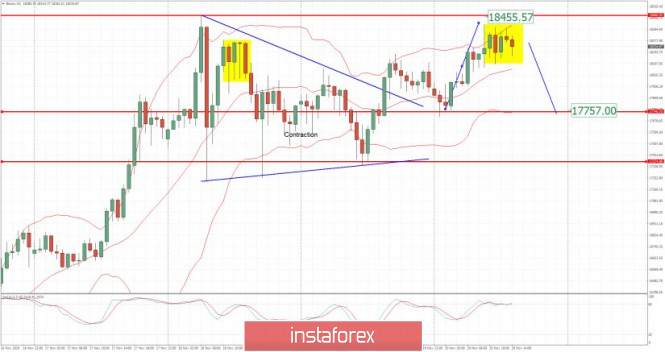
Analyzing the current trading chart of BTC, I found that the BTC reached my upside breakout target at $18,400. Anyway, I see in last few hours that BTC is trading sideways and I woudl watch for potential breakout to confirm further downside movement. Key Levels: Resistance: $18,400 Support level: $17,750 and $17,38 The material has been provided by InstaForex Company - www.instaforex.com |
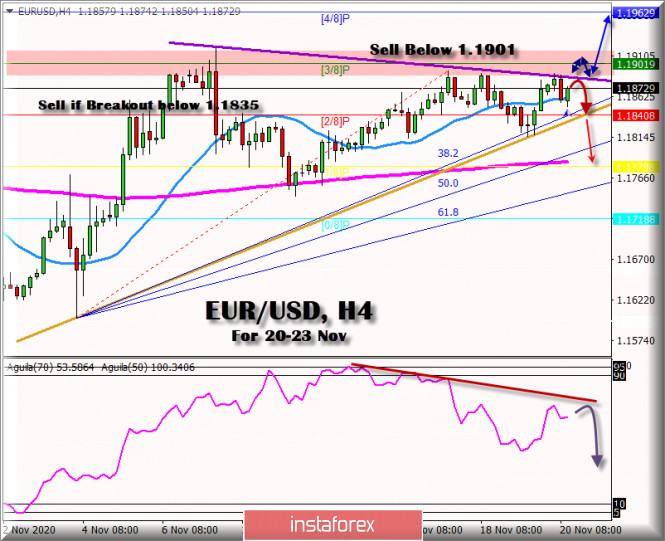
| Trading Signal for EUR/USD for November 20-23, 2020 Posted: 20 Nov 2020 05:01 AM PST
In the early American session, a few hours before the weekly close of the foreign exchange market, we noticed that EUR/USD has been extending consolidation for several days between the 3/8 of murray (green line) and the support of 2/8 of murray (red line). It is important to note that the last 4-hour candle has formed an engulfing candle. So, the odds are that the downward pressure will continue in the next hours. If you look at the 4-hour chart, we have drawn a downtrend channel from the high of November 9 to today, giving a moderate bearish inclination, which implies that this pair is preparing for a possible fall, only if remains below this zone. Besides, the 3/8 murray resistance at 1.1901 is a barrier. The pair is likely to try to break out, but looking at the dollar index we note that it has gained strong support and likely to rebound which would give EUR/USD a drop below 1.1880 or 1.1901. We have also traced a fibonacci fan, which indicates up to the place that this pair could retrace. It has already made its first retracement to 38.2%. We hope that the downward pressure will take it to 50% and 61.8% Fibonacci zone that coincides with the EMA of 200 and 1/8 of Murray. Our recommendation is to sell the euro, only if in the next few hours it trades below 1.1860 and below the EMA 21, with targets at 1.1832 2/8 support and the uptrend channel (yellow line), a break for below 1.1830 and a pullback below this area. The target will be 1.1776. Looking at the eagle indicator, we notice that the bullish momentum is running out of steam. It is very likely that there will be a correction in this pair in the next few days, as we have drawn a channel which indicates that there is downward pressure in the market, waiting for some fundamental data. On the other hand, market sentiment includes 71% of investors who are holding short positions. It is important to note this figure, since it indicates that in the medium term, investors will seek an upward movement to 1.20 and 1.21 if the figure continues to increase. Trading tip for EUR/USD for November 20-23 Sell below 1.1880 (trend line) with take profit at 1.18400 and stop loss above 1.11920 Sell if the pair breaks below 1.1835 with take profit at 1.1779 (1/8 murray) and stop loss above 1.1875. Buy if the pair rebound around EMA 200 at 1.1780 with take profit at 1.1860 and stop loss below 1.1740. The material has been provided by InstaForex Company - www.instaforex.com |
| Posted: 20 Nov 2020 04:58 AM PST This seems to be the safety net in case negotiations next week continue to lead nowhere. The pressing issue now is time as EU officials view that a deal needs to be struck by next Monday in order to facilitate the translation and ratification before the year-end. According to RTE Europe editor, Tony Connelly: Another standout element of today's briefing is that officials are considering Provision Application of the agreement because time is diminishing so fast, ie that an agreement wd provisionally come into effect on Jan 1 but that all the ratification procedures wd happen after. Those would include ratification by the European Parliament some time early in the new year - not clear yet how that will go down with MEPs. Such a move will bring up the debate on whether or not the deal would be "mixed" or "EU only" but that would be a technicality that they should be able to easily work out in the end; not withstanding the three key outstanding issues of course.
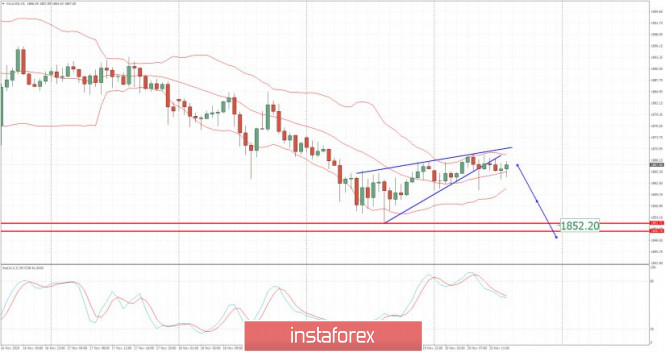
Further Development
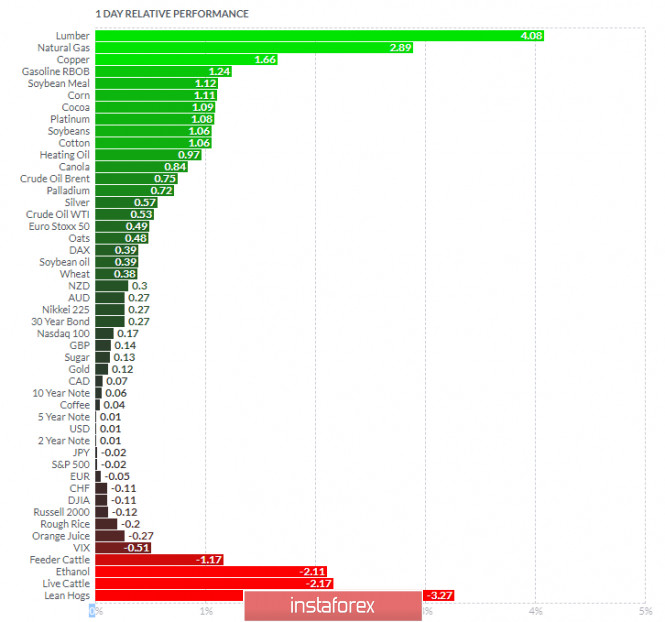
Analyzing the current trading chart of Gold, I found that the buyers got exhausted today and that there is the breakout of the rising trend line in the background, which is sign for potential downside continuation. My advice is to watch for selling opportunities with the target at the price of $1,852. Finviz Relative Strength -
Based on the graph above I found that on the top of the list we got Lumber and Natural Gas today and on the bottom Lean Hogs and Live Cattle. Gold is neutral on the list, which is sign of the sideways regime... Key e: Resistance: $1,870 Support level: $1,850 The material has been provided by InstaForex Company - www.instaforex.com |
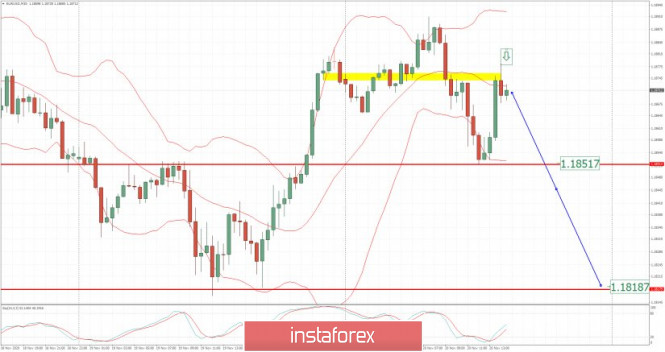
| EUR/USD analysis for November 20 2020 - Potential for the dowsnide rotation towards the 1.1850 Posted: 20 Nov 2020 04:48 AM PST This was very much expected already as Eamonn highlighted earlier in the day here. After the passing of safety data on Wednesday, the latest move here was anticipated. The response to the latest development above is relatively mild but it sees 10-year Treasury yields hold at the highs for the day, up 1.8 bps to 0.847%. European equities are also keeping firmer still and the dollar is losing some ground on the session. I don't expect the knee-jerk reaction here to be a massive one, all things considered. However, just be mindful of the key levels at play for the dollar that are still intact and with S&P 500 futures near flat levels, watch out for the 3,600 level. On the latter especially, get above that and we could see risk swing back heavily in favour of buyers ahead of the weekend. Further Development
Analyzing the current trading chart of EUR/USD, I found that the buyers got exhausted today at the level at 1,1880 and that there is potential for the downside continuation based on the last downside swing. 1-Day relative strength performance Finviz
Based on the graph above I found that on the top of the list we got Lumber and Natural Gas today and on the bottom Lean Hogs and Live Catlle. Key Lvels: Resistance: 1,1880 Support levels: 1,1850 and 1,1820 The material has been provided by InstaForex Company - www.instaforex.com |
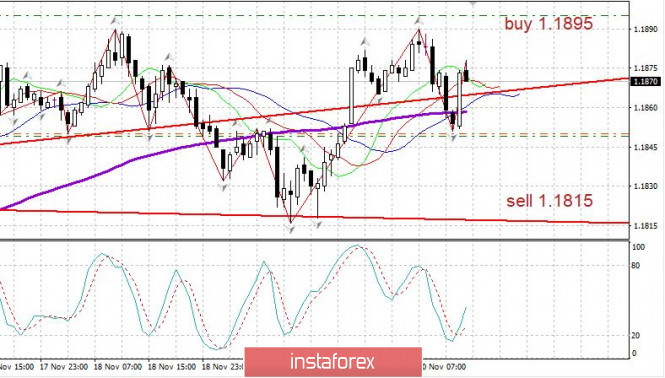
| Evening review of EURUSD on November 20, 2020 Posted: 20 Nov 2020 04:33 AM PST
EURUSD - The euro traded in a downward trend from the level of 1.1890 to 1.1850 - but immediately rebounded sharply. Today, news came out that Pfizer may receive permission to vaccinate US citizens in December. In general, the euro denouement is approaching. You may consider purchases from 1.1895. But you may also consider opening a sell position from 1.1849 and further from 1.1815. The material has been provided by InstaForex Company - www.instaforex.com |
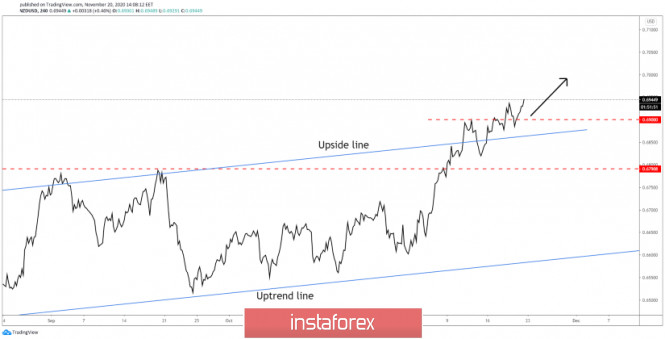
| Posted: 20 Nov 2020 04:26 AM PST
NZD/USD has escaped from the up channel's body and has managed to stabilize above the 0.6900 psychological level validating further growth. I've said in a previous analysis that NZD/USD will continue its upside journey if it makes a valid breakout above the 0.69 level. The rate has jumped above this obstacle, it has come back down to retest it and now has passed above the former high signaling more gains ahead.
Passing above the 0.6940 former high activates a buying opportunity with an immediate target at the 0.7000 psychological level. The 0.7100 level could be used as an upside target as well if the rate stays above 0.69. The material has been provided by InstaForex Company - www.instaforex.com |
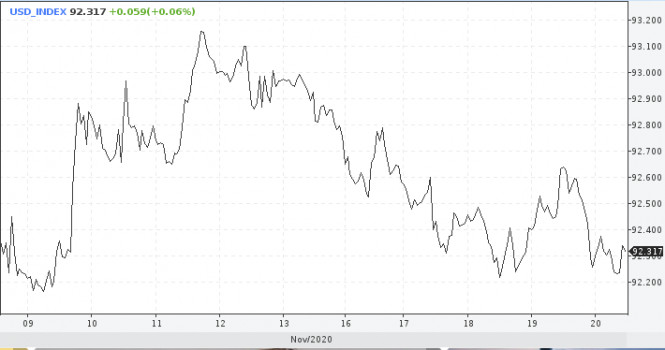
| Dollar's decline halted and now the outlook is promising. Posted: 20 Nov 2020 04:07 AM PST
Yesterday, US Treasury Secretary, Steven Mnuchin, said he is abandoning a number of lending programs by the Fed, which stunned investors who were hoping for help from the central bank. The latter relies on the credit system from the municipal liquidity fund (MLF), and the probability of default of payments in this case was not even considered. It is clear though that even if MLF support disappears, the market will not collapse. However, in the event that a sell-off or other credit risks affect the market, it will need some stability. Undoubtedly, this public conflict is intensifying the rivalry between the Trump administration and the central bank. It reinforces the fact that the US economy will be under a tangible pressure. Against the background of these events, the USD index fell slightly today - by 0.06%. However, at the time of writing, it adjusted its position and returned to the green zone.
Thus, experts continue to believe in the strength of the US dollar, not minding the earlier sharp collapse. There are also rumors that US trading partners will not let the dollar fall, so as to prevent a significant increase in the Chinese yuan. In the modern financial system, currencies depend solely on the state of the economy. And since serious economic problems are not expected in the US in the next seven years, it makes no sense to hope for a significant collapse in the dollar. To add to that, the US is holding well against the coronavirus, unlike other countries who are experiencing a real collapse. It is highly likely that the US, with a broad diversified economy based on post-industrial development, will generally come out of the current crisis as prepared as possible in comparison with other countries. Other world economies will noticeably sag, but the US will now. In light of such sentiments and expectations, there is no reason to predict a noticeable decline in the US currency. The material has been provided by InstaForex Company - www.instaforex.com |
| Gold gradually recovers growth after falling for three consecutive trading sessions Posted: 20 Nov 2020 03:42 AM PST
Gold prices gradually recover growth on Friday morning after a negative correction observed for several previous trading sessions in a row. The negative trend was caused by the enthusiasm of market participants regarding the news on the preparation and release of a vaccine against coronavirus infection, which is being developed simultaneously by several companies in the world. The price of gold futures contracts for December delivery on the trading floor in New York rose 0.36% or $6.7, which sent it to $1,868.2 per troy ounce. At the same time, the support for the precious metal was at $1,850 per troy ounce, and the resistance, respectively, was at $1,898 per troy ounce. The good news about the success of several companies in the development of a coronavirus vaccine at once was the main factor in reducing the cost of the metal. On the one hand, the joint collaboration of the American company Pfizer and the German BioNTech led to the creation of a vaccine with the proven effectiveness of 95%. On the other hand, the biotech company Moderna is literally on the heels of competitors: its vaccine also successfully completed the main stages of testing with an efficiency of 94.5%. This news initially caused a storm of emotions among investors and the hope that the coronavirus pandemic will be dealt with in the near future. However, after a couple of days, it became clear that the process of getting the vaccine into wide use will not be fast at all. It will take at least a few more months to coordinate all the technological and bureaucratic nuances, get permission documents, and start mass production. The production process itself will also take a long time, which allows us to conclude that the provision of the vaccine to developed countries will begin no earlier than six months, and it will reach the rest of the world even later. Of course, all these calculations and analysis of the situation negated the joy of market participants and forced them to soberly assess the situation. It is now such that the growth of COVID-19 infection is rapid and threatens to introduce new, more stringent quarantine measures. In this regard, gold has almost no factors left to restrain, but there are many reasons for growth, on the contrary. The decline in the attractiveness of the precious metal in favor of riskier assets among investors was temporary and has now been almost leveled. Nevertheless, most analysts say that the rapid growth of the precious metal in the near future is also not worth waiting for, since market participants must fully assess the prospects for the development of the global economy and individual countries. In particular, we are talking about the situation of the American economy, which survived the presidential election and faced a serious deterioration in the epidemiological situation. Moreover, in the short term, gold is likely to face a negative correction more than once, which, however, can not be too serious. At the very least, if gold manages to stay above $1,800 per troy ounce, it may not fall further. The next solid stage for the rapid growth of the metal will most likely start at the beginning of next year, and in the meantime, investors will not be too active in the market. Silver futures contracts for December delivery rose 0.71% Friday morning which sent it to $24.218 per troy ounce. Copper futures contracts for December delivery gained 0.16 which sent it to $3.2190 per pound. The material has been provided by InstaForex Company - www.instaforex.com |
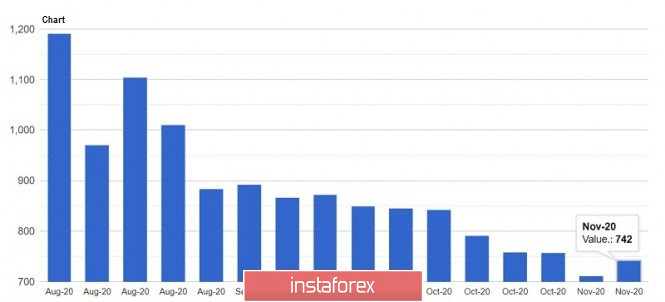
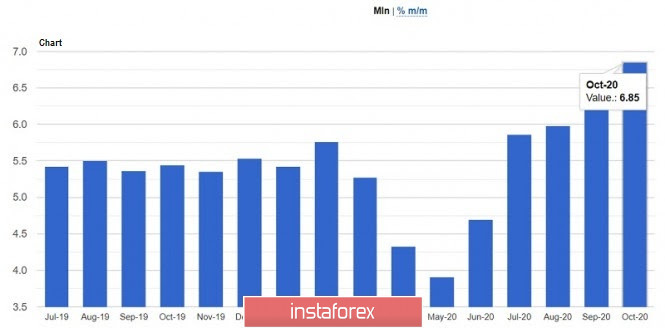
| Posted: 20 Nov 2020 03:40 AM PST The dollar lost a number of positions yesterday amid growing jobless claims in the United States. To add to that, the US Treasury Secretary said he is abandoning a number of lending programs, which put more pressure to the US currency. Meanwhile, Brexit negotiations are paused due to one participant contracting COVID-19. Such news did not exert any pressure on the British pound though, which raises many questions, since there is practically no time left to find a compromise. Yesterday, Secretary of the Treasury, Steven Mnuchin said he is abandoning a number of lending programs that were applied during the first wave of the pandemic. These are several credit lines of the Fed, scheduled to expire later this year. Mnuchin said these programs no longer need to be extended, as in his opinion, the markets for corporate loans and municipal borrowing can already function independently. Banks already have reserves and opportunities to provide their own loans to corporate, municipal and non-profit clients. In his letter to the Federal Reserve, Mnuchin said the above programs have already fulfilled their tasks, which led to sharp criticism from Jerome Powell. The head of the Fed made it clear that he is disappointed with this decision, as he would prefer to keep the entire set of emergency lines open during the coronavirus pandemic in the future. Powell claims the rejection of a number of programs could put additional pressure on the already struggling economy. These different views did not put serious pressure on the US dollar though, but led to a partial decline against the euro and pound. Thus, for the EUR/USD pair, everything will depend on whether the bulls manage to break above the monthly high of 1.1915. Only a break above this range will increase demand for risky assets, which will make it easier for the quotes to reach 1.1970 and 1.2020. Meanwhile, if the euro consolidates below 1.1820, the EUR/USD pair will collapse to 1.1760, and then to the base of the 17th figure. With regards to the COVID-19 situation in the United States, Vice President Mike Pence announced yesterday that the government is ready to immediately distribute the vaccine as soon as it is ready. Pence noted that the US has never been so ready to fight the virus, and the administration is against economic lockdowns and school closings. Over the past day, as reported by Johns Hopkins University, over 170,000 Americans have been infected with coronavirus. This figure is almost equal to the peak recorded last Friday. Various states are already independently taking measures to contain the pandemic. For example, New York Mayor, Bill de Blasio, said that from today, all schools in the city will be closed at least until the end of November. Various social distancing measures have also been announced in Kentucky, Wisconsin and Illinois, from expanding the list of mandatory wearing masks to closing bars and restaurants. Many states have restrictions on personal communication. As for economic data, the US Department of Labor published a report yesterday, which revealed that jobless claims in the US have increased. This indicates that the situation is turning in a negative direction due to the second outbreak of coronavirus. The data said initial applications for the week of November 8-14 rose to 742,000, from 711,000 a week earlier. Economists had expected the number to be 710,000. The composite index of leading indicators, which tracks economic cycles in the United States, also continued to rise in October, reaching a value of 108.2 points. It increased by 0.7% compared to September, and fully coincided with the forecasts of economists Sales in the US secondary housing market also increased, especially given the level of interest rates and how widely available lending is due to a number of emergency programs. According to the National Association of Realtors, sales in October increased by 4.3% compared to September, and amounted to 6.85 million homes per year. Compared to the same period last year, sales grew by 26.6%. Economists had expected a decline of about 1.2%. As for the median home price in October, the amount jumped 15.5% to $ 313,000. GBP/USD Brexit negotiations were paused as one participant was reported to have contracted COVID-19. Supposedly, the meeting was the finale of the talks, however, it wasn't able to produce any progress, thereby leaving the issue of the trade agreement remained in limbo. Surprisingly, the pound did not react to this news, which indicates positive expectations from market participants. It is unclear yet whether negotiations will resume next week. Until a test is made to all participants in the meeting and reliable results are obtained that no one else has become infected with COVID-19, it will hardly be possible to talk about the continuation of negotiations. The lack of market reaction is further evidence of the fact that everyone is determined to reach a compromise and sign an agreement at the last minute. However, if an agreement was not signed, the British pound could plummet. A recent study said a Brexit without deal would lead to a major collapse in the market, as such would deal a significant blow both to the UK and EU economy. Thus, for the GBP/USD pair, bulls are aiming for a breakout above the resistance level of 1.3310, as only such will lead to movements towards 1.3380 and 1.3470. But if the quotes decline below 1.3235, the GBP/USD pair will go to the support level of 1.3165, and then to the base of the 31st figure. The material has been provided by InstaForex Company - www.instaforex.com |
| NZD/USD. New Zealand dollar keeps on breaking records Posted: 20 Nov 2020 03:36 AM PST The New Zealand dollar against the US currency continues to break records. It managed to consolidate within the 0.69 level, approaching two-year price highs. There are a lot of important factors that contribute to the growth of this pair, especially amid the US dollar, which continues to show vulnerability. On the one hand, the current fundamental background allows us to unconditionally recommend long positions in the NZD/USD pair. But on the other hand, the proximity of the 0.70 level causes concern – negative reaction from the RBNZ may follow, as soon as buyers "swing" at this price target.
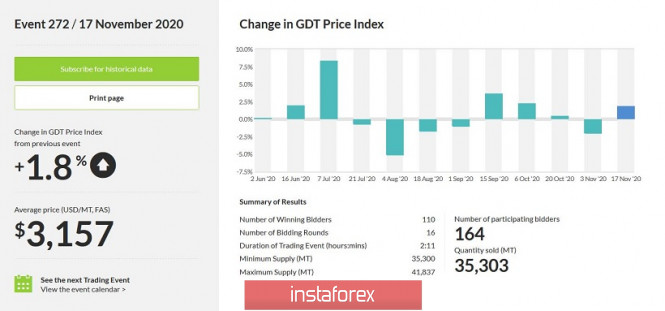
In fact, it is worth noting that RBNZ members, in fact, gave the go signal for the upward trend of the NZD/USD pair. During this year's last meeting, the regulator not only kept a wait-and-see attitude, but also stated their future prospects. In particular, Adrian Orr, Central bank's head, said that the country's economy turned out to be more stable than previously assumed. He also announced that the Central Bank intends to maintain the status quo at the rate at least until March next year. Thus, he made it clear that the bank will not introduce negative rates in the near future, since the current risks have become more balanced than before. The market was clearly surprised by such results of the November meeting, as most experts expected a "dovish" scenario. This week, buyers of NZD/USD pair continued to rally upwards after a deep corrective pullback. This was supported by China's data, which mostly came out in the green zone. It became known that October's industrial production rose by 6.9% in annual terms, which exceeded the expectations of the market, with a forecasted growth by around 6.5% only. In addition, retail sales were also pleasant. The corresponding figure surged by 4.3% in October, after rising by 3.3% in September. The New Zealand dollar received additional support in the form of growth in the price index for dairy products. At the first GDT auction in November, the trades closed in the red zone, although the index showed positive dynamics before that. Nevertheless, the indicator left the negative zone during the last auction this Wednesday and reached 1.8%, leveling the decline at the beginning of the month. At the same time, the recovery of the index was due to the strengthening of prices for most of the tradable categories of dairy products. Let me remind you that the cost of milk and the demand for it is quite important for the New Zealand economy, therefore, the current situation may have a corresponding impact on the mood of the RBNZ members. The island nation exports powdered milk and other dairy products mainly to China and Europe, so recent trends indicate higher demand from them. On another note, COVID-19 which is exerting the strongest pressure on the US currency, has the opposite effect for the New Zealand currency. The fact is that New Zealand actually "defeated" COVID-19 not so long ago, and since then, there were almost no cases. For example, only three COVID-19 cases were detected in the country yesterday. At the same time, all infected were found during quarantine upon arrival in New Zealand. No cases of the spread of infection within the state were recorded. Thus, RBNZ's wait-and-see attitude, China's growing data, the rise in the milk's price and the victory against COVID-19 allows the NZD to update price ranges. The US dollar, in turn, is still under pressure from fundamental issues. New coronavirus anti-records, conflict between the US Treasury and the Fed, slowing inflation and falling retail sales, the inability of congressmen to compromise on a new stimulus package to support economic recovery and the possible easing of the Fed's monetary policy parameters – all these fundamental factors play against the USD.
Therefore, we can consider buying the NZD/USD pair with the main goal of 0.7000 in the medium term. However, it is suggested to take profit after reaching this level. The Reserve Bank of New Zealand is concerned about the inflated exchange rate of the national currency, putting verbal pressure on it. The relevant signals have already been voiced by the country's trade minister. He believes that the current strengthening of the "kiwi" exchange rate is an unfavorable factor for the country's export-oriented economy. From a technical viewpoint, we can also talk about the priority of long positions on the NZD/USD pair. This pair is on the upper line of the Bollinger Bands indicator and above all lines of the Ichimoku indicator on all bigger time frames, with the exception of the monthly TF. The upside goal is the resistance level which corresponds to the level of 0.7005 – the upper line of the Bollinger Bands indicator on the monthly time frame. The material has been provided by InstaForex Company - www.instaforex.com |


| You are subscribed to email updates from Forex analysis review. To stop receiving these emails, you may unsubscribe now. | Email delivery powered by Google |
| Google, 1600 Amphitheatre Parkway, Mountain View, CA 94043, United States | |
No comments:
Post a Comment