
For the EUR / USD pair, the price forms the potential for the top of September 14 which is in correction from the downward structure. For the GBP / USD pair, we continue to monitor the upward structure of September 14 on the M30 scale. For the USD / CHF pair, the continuation of upward movement is expected after the breakdown of 0.9650. The level of 0.9500 is the key support. For the USD / JPY pair, the continuation of the upward movement is expected after the breakdown at 111.30. For the EUR / JPY pair, the subsequent goals for the top were determined from the local structure on 15 September. For the GBP / JPY pair, we follow the development of the upward cycle of September 14.
Forecast for September 18:
Analytical review of currency pairs in the scale of H1:
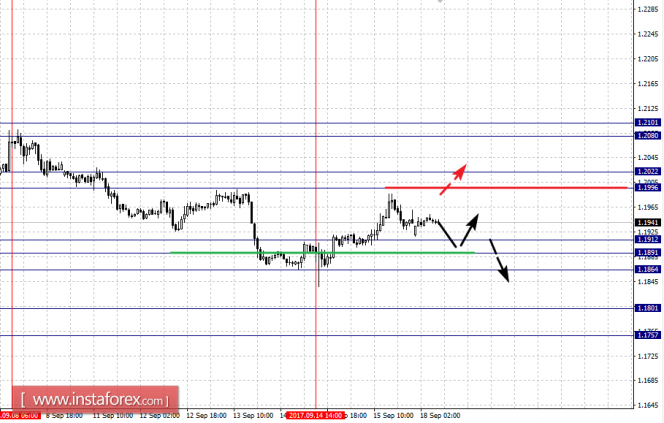
For the EUR / USD pair, the key levels on the scale of H1 are: 1.2101, 1.2080, 1.2022, 1.1996, 1.1912, 1.1891, 1.1864, 1.1801 and 1.1757. Here, the price forms the potential for the top of September 14. However, we expect the cancellation of the downward structure from September 8 only after passing the price of the noise range of 1.1996 - 1.2022. In this case, the potential target is 1.2101. In the area of 1.2101 - 1.2080 is the consolidation of the price.
Short-term downward movement is expected in the area of 1.1912-1.1891. The breakdown of the last value will lead to in-depth correction. Here, the target is 1.1864.
The breakdown of this level will continue the development of the downward structure on the scale of H1. In this case, the first target is 1.1801.
The main trend is the downward structure from September 8 which is the formation of the potential for the top of September 14.
Trading recommendations:
Buy: 1.1996 Take profit: 1.2020
Buy: 1.2024 Take profit: 1.2080
Sell: 1.1890 Take profit: 1.1866
Sell: 1.1862 Take profit: 1.1805
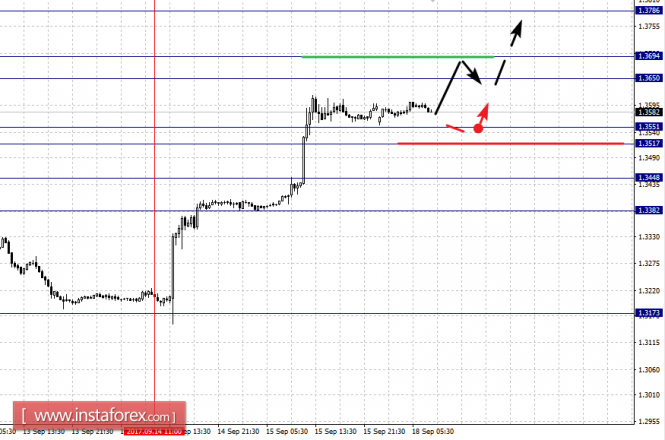
For the GBP / USD pair, the key levels on the scale of H1 are: 1.3786, 1.3694, 1.3650, 1.3551, 1.3517, 1.3448 and 1.3382. Here, we continue to follow the upward cycle from September 14 in the M30 scale. Short-term upward movement is expected in the area of 1.3650 - 1.3694. The breakdown of the last value will lead to a movement towards the potential target of 1.3786, upon reaching which we expect a pullback downwards.
Cable is consolidating under fresh highs at 1.3616/18, posted on Fri / today, following last week’s 3.1% advance, as cable was strongly boosted by talks from BoE about possible rate hike in coming months.
Last week’s rally broke and closed above strong resistance at 1.3473 (weekly cloud top) which generated strong bullish signal.
Bulls eye next target at 1.3837 (Fibo 61.8% of 1.5016/1.1930 (June/October 2016 descend) as strong bullish sentiment continues to drive pound higher, with two long bullish daily candles underpinning.
However, bulls might be interrupted by deeper correction, signaled by overbought daily studies, but no firmer reversal signal being generated yet.
Solid supports 1.3473/40 (broken weekly cloud top / Fibo 38.2% of 1.3148/1.3618 upleg) are expected to ideally contain extended pullback.
Short-term downward movement is possible in the area of 1.3551 - 1.3517. The breakdown of the last value will lead to in-depth correction. Here, the target is 1.3448. This level is the key support for the upward structure. Its breakdown will lead to the formation of the initial conditions for the downward cycle. In this case, the target is 1.3382.
Trading recommendations:
Buy: 1.3650 Take profit: 1.3692
Buy: 1.3696 Take profit: 1.3780
Sell: 1.3515 Take profit: 1.3450
Sell: 1.3445 Take profit: 1.3384
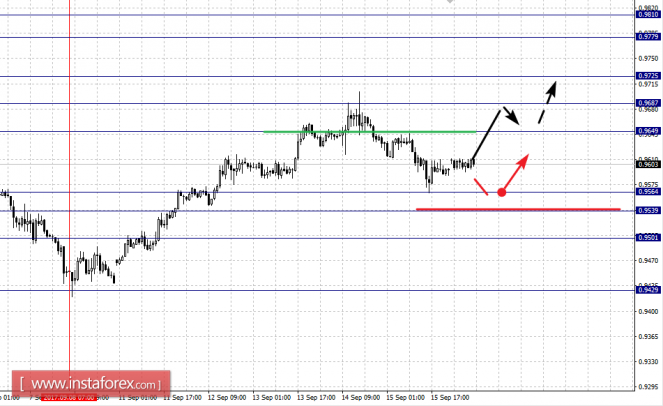
For the USD / CHF pair, the key levels on the scale of H1 are: 0.9810, 0.9779, 0.9725, 0.9687, 0.9649, 0.9564, 0.9539 and 0.9501. Here, we continue to follow the upward structure of September 8. At the moment, the price is in correction. Continued upward movement is expected after the breakdown of 0.9650. Here, the first target is 0.9687. In the area of 0.9687 - 0.9725 is short-term upward movement. The breakdown at the level of 0.9725 should be accompanied by a pronounced upward movement to the level of 0.9779. The potential value for the top is the level of 0.9810, from which we expect a pullback downwards.
Short-term downward movement is expected in the range of 0.9564 - 0.9539. The breakdown of the last value will lead to in-depth correction. Here, the target is 0.9501. This level is the key support for the top in the scale of H1.
The main trend is the upward structure of September 8.
Trading recommendations:
Buy: 0.9650 Take profit: 0.9685
Buy: 0.9688 Take profit: 0.9725
Sell: 0.9564 Take profit: 0.9540
Sell: 0.9535 Take profit: 0.9505
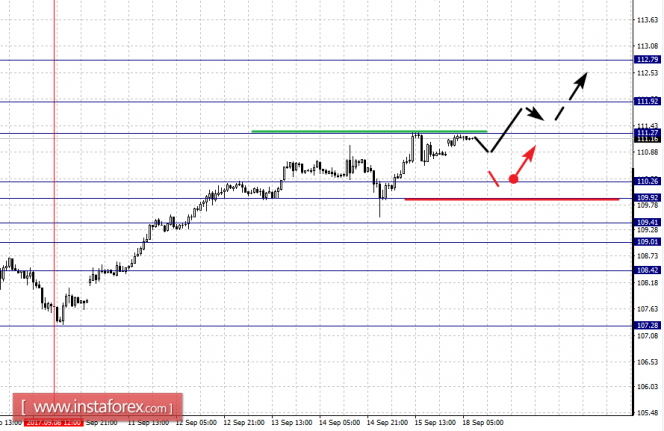
For the USD / JPY pair, the key levels on a scale are: 112.79, 111.92, 111.27, 110.26, 109.92, 109.41, 109.01 and 108.42. Here, we follow the upward structure of September 8. Short-term upward movement is expected in the area of 111.27 - 111.92. The breakdown of the level of 111.92 will allow us to count on a movement towards a potential target of 112.79. From this level we expect a pullback downwards.
Consolidated movement is possible in the range of 110.26 - 109.92. The breakdown of the last value will lead to in-depth correction. Here, the target is 109.41. The range of 109.41 - 109.01 is the key support for the upward structure of September 8.
The main trend is the upward structure of September 8.
Trading recommendations:
Buy: 111.28 Take profit: 111.90
Buy: 111.94 Take profit: 112.75
Sell: 109.90 Take profit: 109.43
Sell: 109.00 Take profit: 108.45
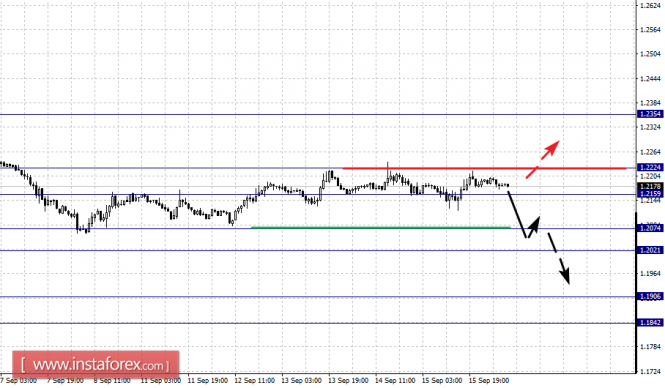
For the CAD / USD pair, the key levels on the H1 scale are: 1.2224, 1.2159, 1.2074, 1.2021, 1.1906 and 1.1842. Here, we continue to follow the development of the downward structure from August 31. At the moment, the price is in correction. Short-term downward movement is possible in the area of 1.2074 - 1.2021. Continued development of the downward cycle is expected after the breakdown of 1.2020. In this case, the target is 1.1906. The potential value for the top is the level of 1.1842, from which we expect the correction to start. In general, we most likely expect a pullback from the level of 1.2021, with the subsequent formation of initial conditions for the upward cycle.
Consolidated traffic is possible in the area of 1.2159 - 1.2224. The breakdown of the last value will lead to the formation of the initial conditions for the upward cycle. Here, the potential target is 1.2354.
The main trend is the downward cycle from August 31, the correction stage.
Trading recommendations:
Buy: 1.2160 Take profit: 1.2222
Buy: 1.2228 Take profit: 1.2350
Sell: 1.2074 Take profit: 1.2024
Sell: 1.2020 Take profit: 1.1910
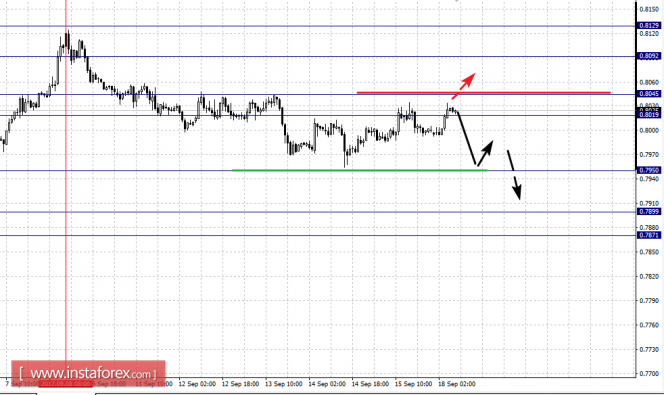
For the AUD / USD pair, the key levels on the scale of H1 are: 0.8092, 0.8045, 0.8019, 0.7950, 0.7899 and 0.7871. Here, we follow the downward structure of September 8. Continued downward movement is expected after the breakdown of 0.7950. In this case, the target is 0.7899. The potential value for the bottom is the level of 0.7871, from which we expect a rollback to the top.
Short-term upward movement is possible in the area of 0.8019 - 0.8045. The breakdown of the last value will lead to the formation of an upward structure. Here, the potential target is 0.8092.
The main trend is the downward structure of September 8.
Trading recommendations:
Buy: 0.8020 Take profit: 0.8044
Buy: 0.8047 Take profit: 0.8090
Sell: 0.7950 Take profit: 0.7900
Sell: 0.7896 Take profit: 0.7874
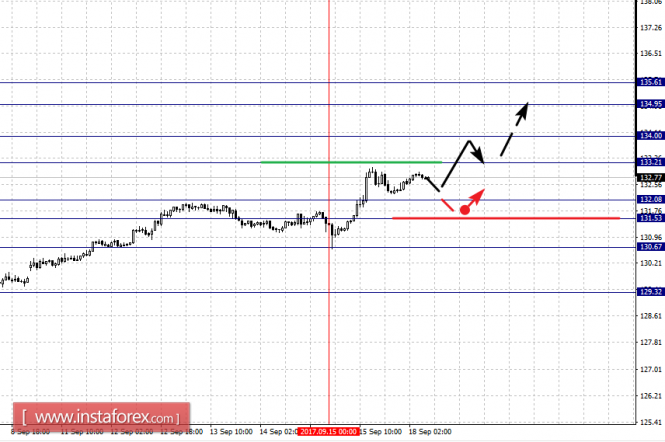
For the of EUR / JPY pair, the key levels on the scale of H1 are: 135.61, 134.95, 134.00, 133.21, 132.08, 131.53, 130.67 and 129.32. Here, we follow the formation of the local structure for the top of September 15. Continued development of the upward trend is expected after the breakdown of 133.21. Here, the target is 134.00. Near this level is consolidation. The break of the of level 134.00 should be accompanied by a pronounced upward movement. In this case, the target is 134.95. The potential value for the top is the level of 135.61, upon reaching which we expect a pullback downwards.
Short-term downward movement is possible in the area of 132.08 - 131.53. The breakdown of the last value will lead to the development of a downward structure. Here, the first target is 130.67.
The main trend is the local structure for the top of September 15.
Trading recommendations:
Buy: 133.24 Take profit: 134.00
Buy: 134.05 Take profit: 134.95
Sell: 132.08 Take profit: 131.55
Sell: 131.48 Take profit: 130.70
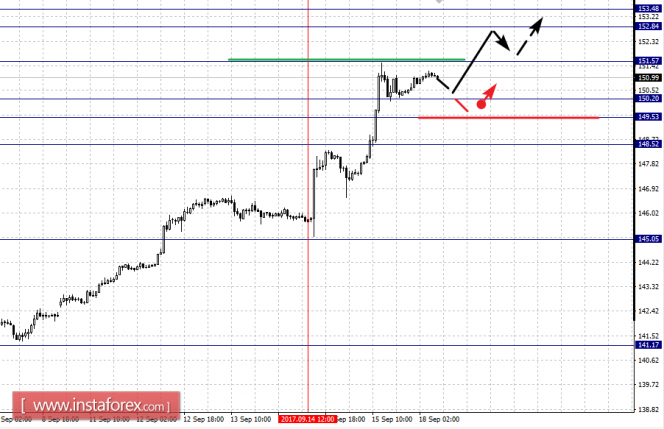
For the GBP / JPY pair, the key H1 scale levels are: 153.48, 152.84, 151.57, 150.20, 149.53 and 148.52. Here, the price formalized the local structure from September 14 and developed an upward impulse. The continuation of the upward movement is possible after the breakdown of 151.57. Here, the target is 152.84. The potential value for the top is the level 153.48, upon reaching which we expect a pullback downwards.
Short-term downward movement is possible in the area of 150.20 - 149.53. The breakdown of the last value will lead to in-depth correction. Here, the target is 148.52. This level is the key support for the top. Its breakdown will lead to the development of the downward structure.
The main trend is the local cycle of September 14.
Trading recommendations:
Buy: 151.60 Take profit: 152.80
Sell: 150.20 Take profit: 149.55
Sell: 149.48 Take profit: 148.60
Get Bonus No Deposite in your Trading Account now and add this currency pair to your forex portfolio, enjoy your trading with us!


No comments:
Post a Comment