Analysis of wave counting:
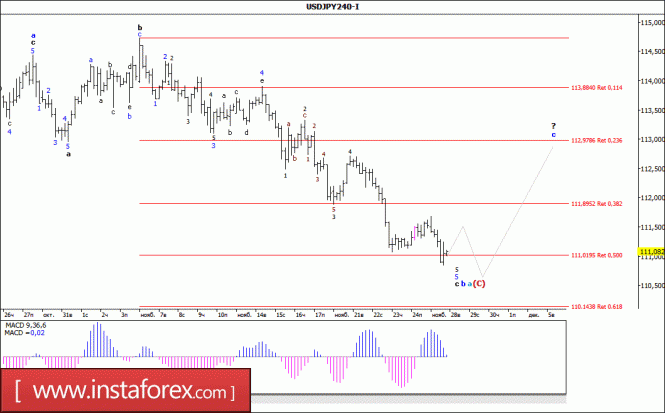
Having failed to develop a more significant upward movement, yesterday's USD/JPY trades began with a decline and, losing almost 70 basis points, broke the level of the 111th figure in the afternoon. Thus, the emerging wave situation makes it possible to assume that the currency pair is still in the stage of formation of the wave c, in b, in a, in (C), which has complicated its wave structure even more. If this is the case, then before the beginning of the future wave c, in a, in (C), the currency pair will remain for some time near the lows already reached.
Targets for a downward wave option: 111.01 - 50.0% by Fibonacci 110.15 - 61.8% by Fibonacci
Targets for an upward wave option: 115.00 - 117.00
General conclusions and trading recommendations:
The trading instrument continues to build the upward section of the trend. Now the wave (C), its internal wave b, is being continued in a, with targets located near the estimated marks of 111.01 and 110.15, which corresponds to 50.0% and 61.8% of Fibonacci. After the completion of this wave is expected to resume the increase in quotations within the wave c, in a, in (C) with targets located above 115 figures. An unsuccessful attempt to break through the level of 111.01 may lead to the withdrawal of quotations from the lows reached.
Wave analysis of the USD/CHF currency pair for November 28, 2017

Analysis of wave counting:
After Friday's decline to the level of 0.9770, the the pair USD/CHF held in the range in the entirety of the previous day, making attempts to gain a foothold above the level of the 98th figure. At the same time, it can be assumed that the lows reached at the end of the last week is the completion of the entire 4th wave, in a, in C. If this is the case, then the currency pair may have good prospects for transition to the stage of formation of the first generating waves in the future 5th wave, in a, in C.
Targets for an upward wave option: 1.0080 - 1.0100
Targets for a downward wave option: 0.9750 - 0.9800
General conclusions and trading recommendations:
The currency pair continues to build an upward set of waves. The assumed wave 4, a, C, has complicated its internal wave structure and is still continuing its construction with targets between the 0.9750 and 98 figure. After the completion of this wave, a prolonged increase is expected within wave 5, in a, in C.
Wave analysis of the GBP/USD currency pair for November 28, 2017

Analysis of wave counting:
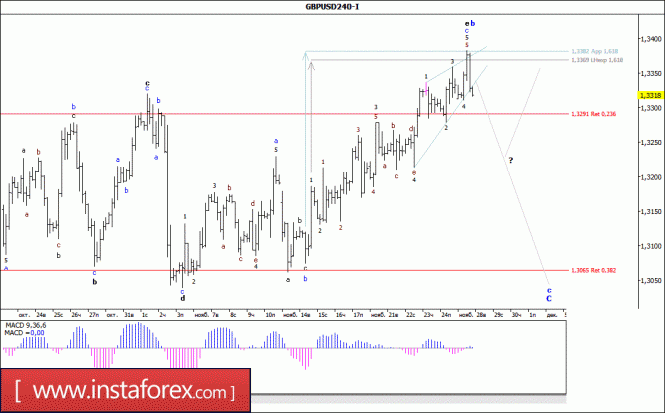
In general, as expected, testing the target in the area of 1.3370 level yesterday provoked the price rebound for the GBP/USD pair by almost 70 pp. from the highs reached in the second half of the day (1.3380). Thus, the achieved ratio between the dimensions of the waves a and c, in e, in b, in the 4th, and also the internal wave dimensionality of the wave c, in this e, in b, in the 4th, makes it possible to assume that the currency pair has already completed the process of forming the entire wave e, in b, in the 4th. If this is the case, then the marked decline in quotes can be considered as the beginning of the future wave e, in b, in the 4th.
Targets for a downward wave option: 1.3065 - 38.2% by Fibonacci 1.2882 - 50.0% by Fibonacci
Targets for an upward wave option: 1.3382 - 161.8% by Fibonacci
General conclusions and trading recommendations:
The construction of the downward wave 4 in the upward trend section continues. Now it is possible to resume the decline in the price of the trading instrument with targets near the estimated level of 1.2882, which corresponds to 50.0% of the Fibonacci, within the wave c, in 4. Wave b, in 4, so far, continues its construction by complicating its internal structure, with targets located near the mark of 1.3382, which is equivalent to 161.8% Fibonacci.
Wave analysis of the EUR/USD currency pair for November 28, 2017

Analysis of wave counting:
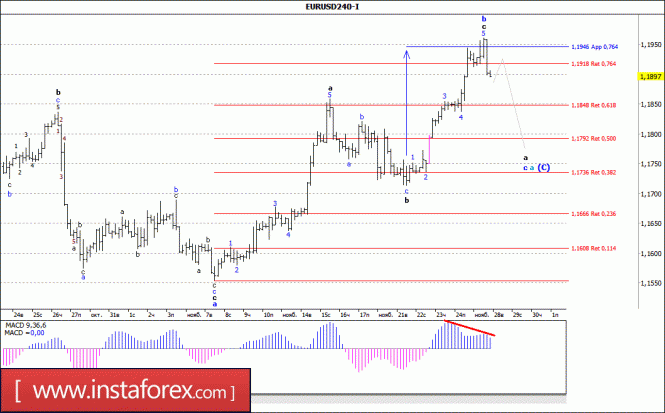
As expected, yesterday's breakdown of the level of 1.1950 led to a halt in the development of the upward movement and a subsequent rebound in the EUR/USD pair price by more than 60 percentage points from the highs reached in the middle of the day. In this case, as a result of this decline, the internal wave structure of the wave c, in b, in a, in (C), as well as the wave b, in a, in (C), took an entirely completed form. If this is so, then marking the decline in quotations can be considered as the beginning of the future wave c, in a, in (C), which is also indicated by the current position of the MACD_aka.
Targets for a downward wave option: 1.1736 - 38.2% by Fibonacci 1.1666 - 23.6% by Fibonacci
Targets for an upward wave option: 1.1918 - 76.4% by Fibonacci 1.1946 - 76.4% by Fibonacci
General conclusions and trading recommendations:
The construction of the downward trend section continues. The assumed wave b, in a, in (C) has completed its construction. If this assumption is correct, then the reduction of quotations will continue with the targets located near the calculated marks of 1.1736 and 1.1666, which corresponds to 38.2% and 23.6% of Fibonacci. The divergence of the MACD_aka also indicates an inclination to reduce the pair.
Still very bullish
29 November 2017, GBP/USD

Targets for a downward wave option: 111.01 - 50.0% by Fibonacci 110.15 - 61.8% by Fibonacci
Targets for an upward wave option: 115.00 - 117.00
General conclusions and trading recommendations:
The trading instrument continues to build the upward section of the trend. Now the wave (C), its internal wave b, is being continued in a, with targets located near the estimated marks of 111.01 and 110.15, which corresponds to 50.0% and 61.8% of Fibonacci. After the completion of this wave is expected to resume the increase in quotations within the wave c, in a, in (C) with targets located above 115 figures. An unsuccessful attempt to break through the level of 111.01 may lead to the withdrawal of quotations from the lows reached.
Wave analysis of the USD/CHF currency pair for November 28, 2017

Analysis of wave counting:
After Friday's decline to the level of 0.9770, the the pair USD/CHF held in the range in the entirety of the previous day, making attempts to gain a foothold above the level of the 98th figure. At the same time, it can be assumed that the lows reached at the end of the last week is the completion of the entire 4th wave, in a, in C. If this is the case, then the currency pair may have good prospects for transition to the stage of formation of the first generating waves in the future 5th wave, in a, in C.
Targets for an upward wave option: 1.0080 - 1.0100
Targets for a downward wave option: 0.9750 - 0.9800
General conclusions and trading recommendations:
The currency pair continues to build an upward set of waves. The assumed wave 4, a, C, has complicated its internal wave structure and is still continuing its construction with targets between the 0.9750 and 98 figure. After the completion of this wave, a prolonged increase is expected within wave 5, in a, in C.
Wave analysis of the GBP/USD currency pair for November 28, 2017

Analysis of wave counting:
In general, as expected, testing the target in the area of 1.3370 level yesterday provoked the price rebound for the GBP/USD pair by almost 70 pp. from the highs reached in the second half of the day (1.3380). Thus, the achieved ratio between the dimensions of the waves a and c, in e, in b, in the 4th, and also the internal wave dimensionality of the wave c, in this e, in b, in the 4th, makes it possible to assume that the currency pair has already completed the process of forming the entire wave e, in b, in the 4th. If this is the case, then the marked decline in quotes can be considered as the beginning of the future wave e, in b, in the 4th.
Targets for a downward wave option: 1.3065 - 38.2% by Fibonacci 1.2882 - 50.0% by Fibonacci
Targets for an upward wave option: 1.3382 - 161.8% by Fibonacci
General conclusions and trading recommendations:
The construction of the downward wave 4 in the upward trend section continues. Now it is possible to resume the decline in the price of the trading instrument with targets near the estimated level of 1.2882, which corresponds to 50.0% of the Fibonacci, within the wave c, in 4. Wave b, in 4, so far, continues its construction by complicating its internal structure, with targets located near the mark of 1.3382, which is equivalent to 161.8% Fibonacci.
Wave analysis of the EUR/USD currency pair for November 28, 2017

Analysis of wave counting:
As expected, yesterday's breakdown of the level of 1.1950 led to a halt in the development of the upward movement and a subsequent rebound in the EUR/USD pair price by more than 60 percentage points from the highs reached in the middle of the day. In this case, as a result of this decline, the internal wave structure of the wave c, in b, in a, in (C), as well as the wave b, in a, in (C), took an entirely completed form. If this is so, then marking the decline in quotations can be considered as the beginning of the future wave c, in a, in (C), which is also indicated by the current position of the MACD_aka.
Targets for a downward wave option: 1.1736 - 38.2% by Fibonacci 1.1666 - 23.6% by Fibonacci
Targets for an upward wave option: 1.1918 - 76.4% by Fibonacci 1.1946 - 76.4% by Fibonacci
General conclusions and trading recommendations:
The construction of the downward trend section continues. The assumed wave b, in a, in (C) has completed its construction. If this assumption is correct, then the reduction of quotations will continue with the targets located near the calculated marks of 1.1736 and 1.1666, which corresponds to 38.2% and 23.6% of Fibonacci. The divergence of the MACD_aka also indicates an inclination to reduce the pair.
Still very bullish
29 November 2017, GBP/USD

Technical Observation:
On the weekly chart above, a bullish pin bar is in a formation. As I said earlier, gbp is in the rise and should continue to gain value with an ultimate take profit at 1.3607. As it is on the higher time frames, Gbp is bullish and only a buy position can be advised. Should the price breaks above the upper resistance trend line, then a rise towards 1.3607 is highly anticipated. I choose to remain long unless the price breaks below 1.3313 with a big red candle, as it is, only a buy position looks ideal.
Technical Levels
Resistance levels
R1: 1.3441
R2: 1.361
R3: 1.3985
Pivot
1.3234
Support Levels
S1: 1.2483
S2: 1.2858
S3: 1.3065
Trade Signal
Remain long towards 1.3607


No comments:
Post a Comment