Technical analysis: Intraday levels for USD/JPY, January 08, 2019
2019-01-08
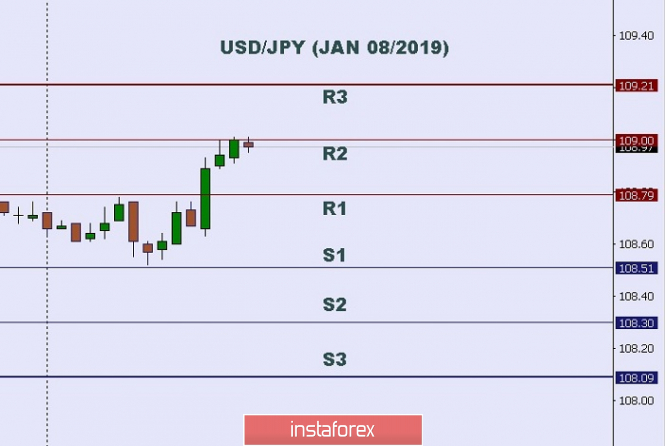
In Asia, Japan will release the Consumer Confidence survey and 10-y Bond Auction. The US will release some Economic Data such as Consumer Credit m/m, JOLTS Job Openings, Trade Balance, and NFIB Small Business Index. So, there is a probability the USD/JPY pair will move with low to medium volatility during this day.
TODAY'S TECHNICAL LEVELS:
Resistance 3: 109.21
Resistance 2: 109.00
Resistance 1: 108.79
Support 1: 108.51
Support 2: 108.30
Support 3: 108.09
Disclaimer: Trading Forex (foreign exchange) on margin carries a high level of risk, and may not be suitable for all Traders or Investors. The high degree of leverage can work against you as well as for you. Before deciding to invest in foreign exchange you should carefully consider your investment objectives, level of experience, and risk appetite. The possibility exists that you could sustain a loss of some or all of your initial investment and therefore you should not invest money that you cannot afford to lose. You should be aware of all the risks associated with foreign exchange trading, and seek advice from an independent financial advisor if you have any doubts. |
Technical analysis: intraday levels for EUR/USD for January 8, 2019
2019-01-08
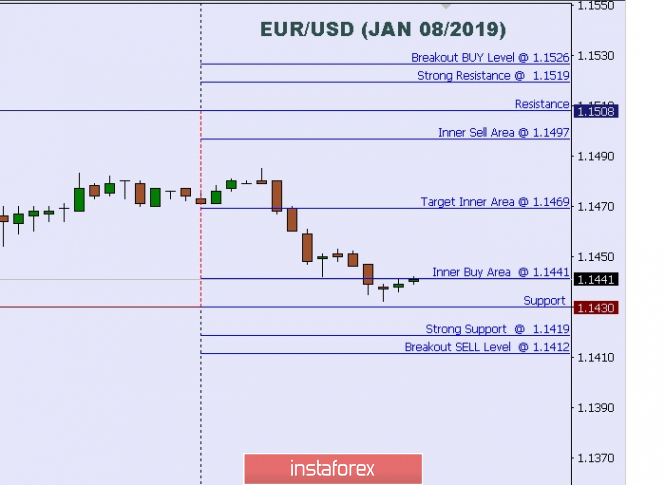
When the European market opens, some economic data will be released such as the French Trade Balance and German Industrial Production m/m. The US will release economic data as well such as the Consumer Credit m/m, JOLTS Job Openings, trade balance, and the NFIB Small Business Index Auction. So, amid the reports EUR/USD will move in a low to medium volatility during this day. TODAY'S TECHNICAL LEVELS: Breakout BUY Level: 1.1526. Strong Resistance:1.1519. Original Resistance: 1.1508. Inner Sell Area: 1.1497. Target Inner Area: 1.1469. Inner Buy Area: 1.1441. Original Support: 1.1430. Strong Support: 1.1419. Breakout SELL Level: 1.1412.
Elliott wave analysis of EUR/JPY for January 8, 2019
2019-01-08
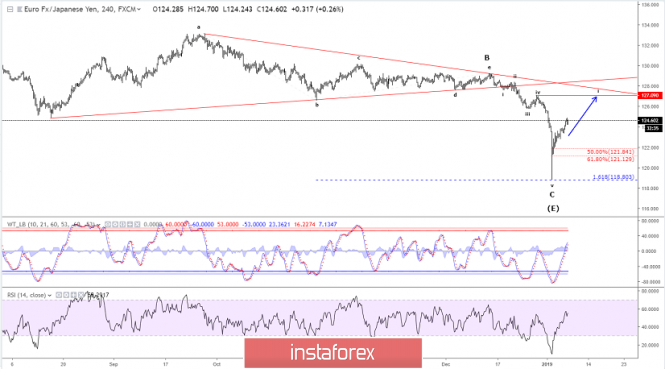
EUR/JPY continues to work its way higher. We expect minor support 124.28 max. 123.39 will be able to protect the downside for a continuation through minor resistance at 124.89 towards 125.55 and ideally closer to 127.01 where strong resistance is seen.
Only a break below support at 123.39 be be cause of concern and could indicate a deep retracement towards the 121.13 - 121.88 area.
R3: 127.09
R2: 126.16
R1: 125.19
Pivot: 124.89
S1: 124.28
S2: 124.00
S3: 123.39
Trading recommendation:
We are long EUR from 122.50 and we will raise our stop to 123.25
Elliott wave analysis of GBP/JPY for January, 2019
2019-01-08
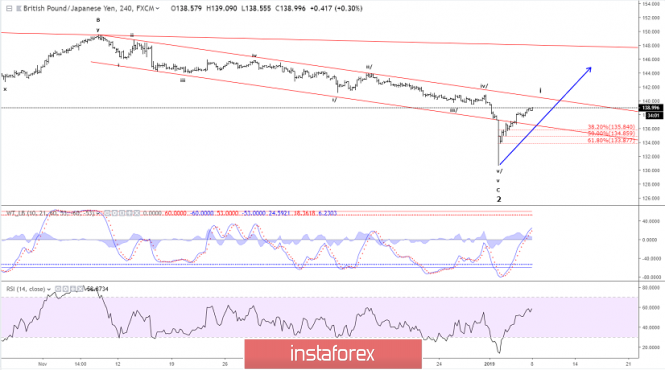
GBP/JPY has rallied well and a so long as minor support 138.51 max. 137.59 is able to protect the downside more upside pressure towards 139.48 and 140.69 remains expected.
We do see signs of the rally from 131.55 getting weaker, but as long as support at 138.51 is able to protect the downside, all we might get is a short period of consolidation before GBP/JPY continues higher towards 139.48 and above.
Only a break below support at 137.59 will indicate a deeper correction towards 133.88.
R3: 140.69
R2: 140.03
R1: 139.17
Pivot: 138.51
S1: 138.04
S2: 137.59
S3: 137.14
Trading recommendation:
We are long GBP from 134.65 and we will raise our stop to 137.50
Technical analysis for EUR/USD for January 8, 2019
2019-01-08
EUR/USD once again reached the upper trading range boundary around 1.1470-1.1480 and got rejected. Price is now pulling back towards 1.1430. Trend remains neutral as we continue to move inside the 1.1475-1.1270 range.
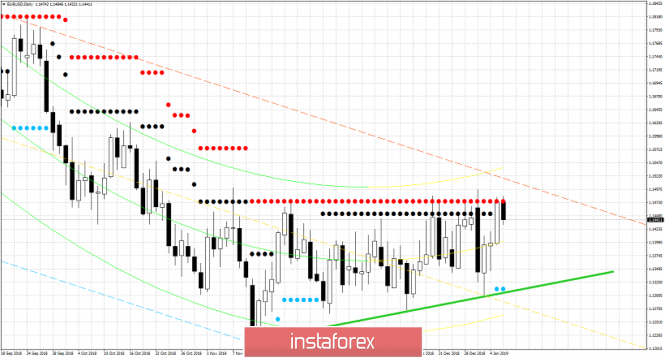
Green line - trend line support
Red dots - maximum strength resistance level
Blue dots- medium strength Support level
Short and medium-term resistance remains at 1.1470-1.1485 area. Support is at 1.14-1.1390. Breaking below this level will open the way for a move towards the green trend line support at 1.1310. Breaking above the resistance of 1.1480 would open the way for a move towards 1.17. If support at 1.13 fails to hold, we should expect price to move below 1.12.
Technical analysis for Gold for January 8, 2019
2019-01-08
Gold price is pulling back downwards towards $1,280. As we explained in our last analysis, there are a lot of chances that the entire pull back is not over and we could soon see another leg lower towards $1,270.
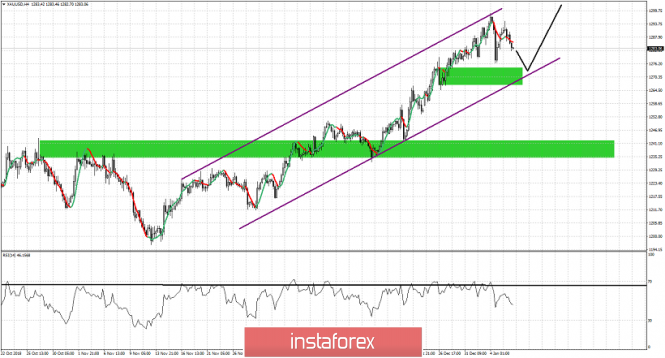
Green rectangles - support areas
Black lines - expected path
Purple lines - bullish channel
Gold price tried to break its recent highs but price got rejected and is pulling back down again. Support is at Friday's low at $1,276.50. If this level is broken, I expect Gold price to move towards $1,270 at least. Price remains inside the bullish channel making higher highs and higher lows. There is no sign of a trend reversal yet or the end of the uptrend.
Author's today's articles:
Arief Makmur
 Born May, 15th/1970 at Jakarta; Graduate from Trisakti University in 1998 at Major Corporate & Bussiness Law. Starting in Finance World in 1998 at Jakarta Stock Exchange & Familliar with Forex Market since December 2003.
Torben Melsted
 Born in November 1962. Graduated from CBS, got Diploma in Finance. Began trading on Forex in 1986 and since that time held various positions such as advising clients, hedging client flows on FX and commodity markets. Also worked for major corporations as Financial Risk Manager. Uses Elliott wave analysis in combination with classic technical analysis, and has been using a Calmar Ratio of 5.0 for over 3 years. Has his own blog, where he uses Elliott wave and technical analysis on all financial markets.
Alexandros Yfantis
 Alexandros was born on September 14, 1978. He graduated from the ICMA Centre, University of Reading with the MSc in International Securities, investment and Banking in 2001. In 2000, Alexandros got the BSc in Economics and Business Finance from Brunel University, UK. In 2004, he began trading on the Greek stock market, where Alexandros got a specialization in international derivatives. Alexandros Yfantis has worked in a top financial company in Greece, responsible for the day-to-day running of the International markets department. He is a certified Portfolio Manager and a certified Derivatives Trader. Alexandros is also a contributor and analyst using Elliott wave and technical analysis of global financial markets. In 2007, he started Forex trading. He loves his profession and believes that entering a trade should always be accompanied by money management rules. His goal is to find profitable opportunities across the markets while minimizing risk and maximizing potential profit. "I'm still learning" Michelangelo
Subscription's options management Theme's:
Fundamental analysis, Fractal analysis, Wave analysis, Technical analysis, Stock Markets
Author's :
Alexandros Yfantis, Arief Makmur, Dean Leo, Michael Becker, Mohamed Samy, Mourad El Keddani, Petar Jacimovic, Rocky Yaman, Sebastian Seliga, Torben Melsted
Sincerely,
Analysts Service
If you have any questions, you can make a phone call using one of the
InstaForex Toll free numbers right now:
|
 |
 InstaForex Group is an international brand providing online trading services to the clients all over the world. InstaForex Group members include regulated companies in Europe, Russia and British Virgin Islands. This letter may contain personal information for access to your InstaForex trading account, so for the purpose of safety it is recommended to delete this data from the history. If you have received this letter by mistake, please contact InstaForex Customer Relations Department. InstaForex Group is an international brand providing online trading services to the clients all over the world. InstaForex Group members include regulated companies in Europe, Russia and British Virgin Islands. This letter may contain personal information for access to your InstaForex trading account, so for the purpose of safety it is recommended to delete this data from the history. If you have received this letter by mistake, please contact InstaForex Customer Relations Department.
|
No comments:
Post a Comment