
Forex analysis review |
- The Fed sat on the side of the road. Where's the dollar going?
- GBP/USD. February 27. Results of the day. Emmanuel Macron: The EU will not revise the terms of the deal with the UK
- EUR/USD. February 27. Results of the day. The US national debt is growing at an accelerated pace, but this is unlikely to
- EUR/USD. A divide in the camp of the Federal Reserve: Jerome Powell remains "above the fray"
- USD/CAD: Canadian inflation weakness and fear of nuclear war
- Technical analysis for USDX for February 27, 2019
- Technical analysis for Bitcoin for February 27, 2019
- Technical analysis for Gold for February 27, 2019
- Technical analysis for EUR/USD for February 27, 2019
- BITCOIN Analysis for February 27, 2019
- EURUSD: European economy continues to show slower growth
- GBP / USD: plan for the American session on February 27. The pound is growing, despite the overbought
- EUR / USD: Euro strengthened mainly due to the weakening dollar
- February 27, 2019 : EUR/USD is still holding some bullish gains around the lower limit of its channel.
- EUR / USD plan for the US session on February 27. Euro has moved to the new side channel
- Escalation of the military conflict between India and Pakistan pushes the yen and the franc higher
- February 27, 2019: Significant Demand-Zone for GBP/USD to be considered
- EUR / USD Technical Analysis Recommendations on February 27
- Bitcoin analysis for February 27, 2019
- AUD/USD analysis for February 27, 2019
- Analysis of Gold for February 27, 2019
- Technical analysis of AUD/USD for February 27, 2019
- Technical analysis of NZD/USD for February 27, 2019
- Difficult choice of Fed
- XAU / USD: bulls retreat, but do not give up
| The Fed sat on the side of the road. Where's the dollar going? Posted: 27 Feb 2019 04:57 PM PST What will the dollar do, as the members of the Federal Reserve decided to sit on the sidelines and not take important decisions on the rate. Despite the fact that the US economy is still strong, at times strong gusts of wind from abroad force the central bank to exercise restraint. According to Jerome Powell, the slowdown in economic growth in China and Europe, the uncertainty around trade wars and Brexit – the processes are beyond the Fed's control. The good news is that over the past three months, the picture regarding the policy of the central bank has become more definite, Powell clearly laid everything out in February. According to the head of the American regulator, the markets are now less stable, and financial conditions do not support economic growth as they used to. The subtle hint is understandable, but it is also necessary to understand that the Fed is also involved in the processes that occurred. Normalization of monetary policy increases borrowing costs, and together with the December puncture of the head of the central bank by the S&P 500's correction leads to tighter financial conditions. Along with the policy of protectionism, which affected the slowdown in global GDP, it becomes clear who is to blame: Donald Trump, Steve Mnuchin and Jerome Powell - who, by the way, had dinner at the White House not so long ago. One of the senators could not resist and asked: "perhaps they agreed not to raise the rate?". Private conversations, of course, no one will comment on. At this time, the theme of changing the central bank's approaches to targeting inflation is becoming more and more discussed. Powell reiterated the idea voiced recently by the head of the Federal Reserve Bank of New York about a possible overrun of the target of 2% at a positive economic time. As a guide, the central bank should take the average business cycle indicator and turn a blind eye to an increase in inflation above the target during the period of active GDP growth. In this situation, a further increase in the Federal funds rate is out of the question. For the dollar, this is bad news, to say the least. In general, however, Powell did not disappoint market participants: volatility has continued to decline. The EURUSD pair could well continue the rally, not to grow the consumer confidence index in the US. On the other side of the Atlantic - at the ECB - it is also not calm. According to the chairman of the Bank of Ireland, the main candidate for the post of ECB chief economist Philip Lane, the eurozone economy is not as fragile as it may seem. The deterioration of the indicators will only lead to sound adjustments to the forecasts of the governing board. That's all. Investors are awaiting revision, which will indicate a slower process of policy normalization, and not its absence. By the way, this is great news for the bulls on the euro. If European fans manage to keep EURUSD above 1.137 in the short term, the risks of continuing the rally will increase. Although many traders prefer not to be active until the release of US GDP. The material has been provided by InstaForex Company - www.instaforex.com |
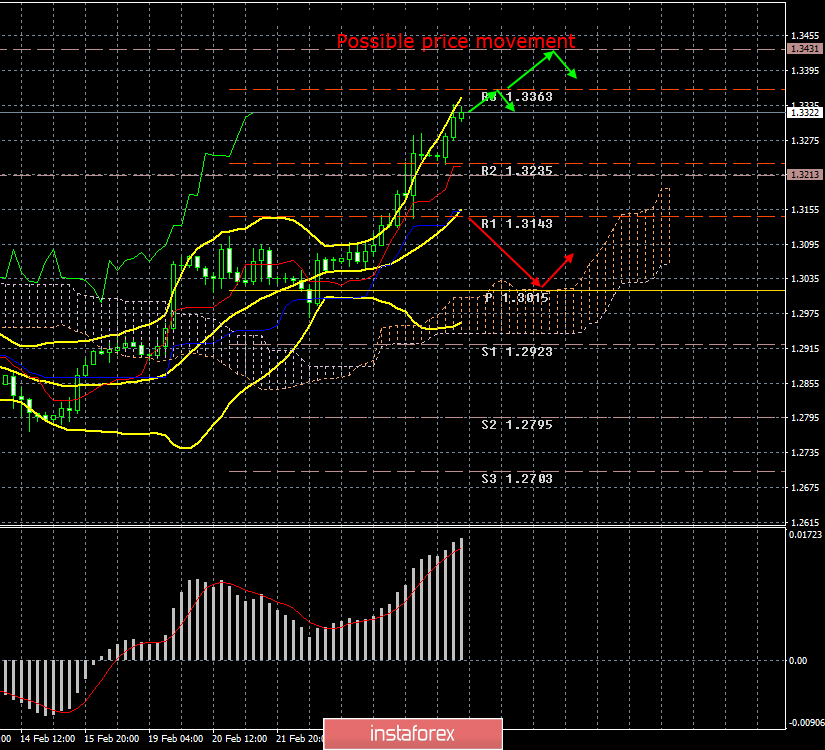
| Posted: 27 Feb 2019 04:44 PM PST 4-hour timeframe The amplitude of the last 5 days (high-low): 97p - 69p - 111p - 63p - 195p. Average amplitude for the last 5 days: 107p (103p). On Wednesday, February 27, the British pound sterling continues to grow, as if the UK has already signed an agreement with the EU on Brexit. In practice, there are still rumors that Brexit will be postponed for at least two months. The European Union does not seem to be against such an option, but today French President Emmanuel Macron said that the EU would not reconsider the agreements reached earlier with London, and also said that the EU is ready to support the decision of the British to postpone Brexit, but only if it has specific and precise goals. Therefore, everything is in the hands of Theresa May and the Parliament. The position of the majority of members of Parliament is clear, so the divorce will likely be postponed. But what's next? It is clear to everyone that in this situation either the Parliament or the EU should yield. Without concessions from anyone's side there will be no agreement and there will be no Brexit. However, all this is not even too important now, as the pound continues to surprise everyone by confidently moving up. Perhaps this is the case for the pound against the US dollar, but the US currency is not falling versus the euro. Thus, we continue to assert that the current strengthening of the British pound is very doubtful in terms of the grounds for such growth. Especially considering the fact that there were no optimistic statements. For example, from Mark Carney, on the contrary. No strong macroeconomic reports have been published recently. From a technical point of view, it is recommended to continue trading "according to the trend." Since there are no prerequisites for the formation of a downward trend, therefore, purchases remain relevant. Trading recommendations: The GBP/USD currency pair continues its upward movement despite yesterday's "pin" and the lack of fundamental grounds for such growth. Thus, long positions remain relevant with objectives of 1,3363 and 1,3431, and a reversal downwards from the MACD will indicate a round of correction. Short positions will become relevant in small lots if the pair is consolidated below the critical line. This will be the first step on the way to a downward trend change, and the first goal will be the Senkou span B line. In addition to the technical picture should also take into account the fundamental data and the time of their release. Explanation of illustration: Ichimoku Indicator: Tenkan-sen-red line. Kijun-sen – blue line. Senkou span a – light brown dotted line. Senkou span B – light purple dotted line. Chikou span – green line. Bollinger Bands Indicator: 3 yellow lines. MACD: A red line and a histogram with white bars in the indicator window. The material has been provided by InstaForex Company - www.instaforex.com |
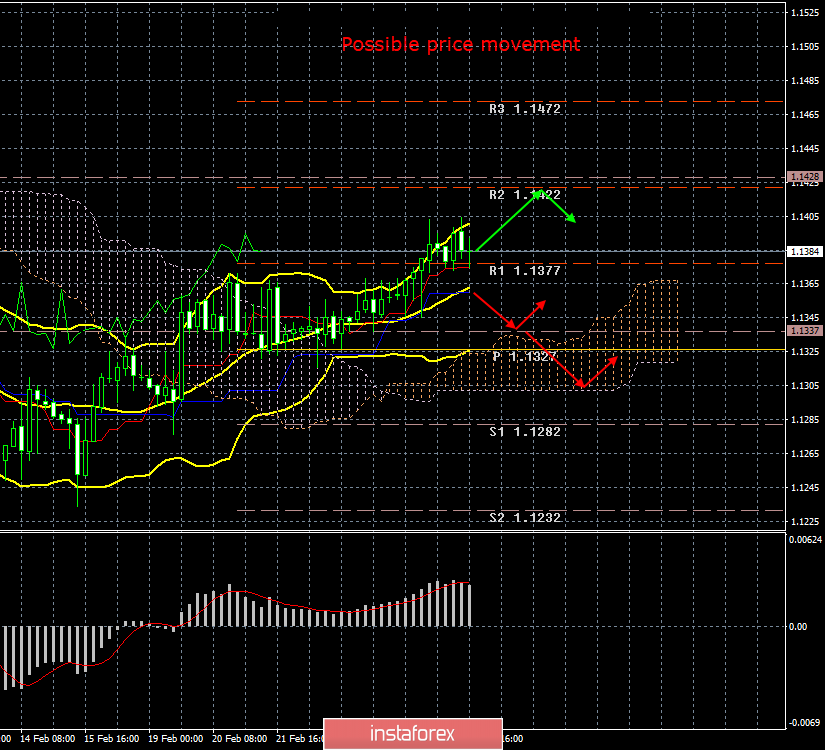
| Posted: 27 Feb 2019 04:22 PM PST 4-hour timeframe The amplitude of the last 5 days (high-low): 46p - 46p - 40p - 41p - 58p. Average amplitude for the last 5 days: 46p (51p). On Wednesday, February 27, the EUR/USD currency pair again stands in one place, and overall volatility does not exceed 40 points for the whole day. Well, there are no new data and traders went on vacation again. Yesterday, the pair still showed signs of life due to the speech of Jerome Powell in Congress, which, it cannot be said, gave the markets too much fundamentally new information, but it was still quite an important event. Today, the pair stopped moving up and slipped back into flat. What to do in this situation? Just wait. Wait for new macroeconomic information, wait for new events in the European Union or the United States, new speeches by the leaders of these countries. The main question now is - will there be grounds for continued growth of the European currency? Many experts are now again paying attention to the growth of public debt in the United States. Congress drew attention to this concern and Jerome Powell. It is possible that the Ministry of Finance will run out of funds in early spring, which may lead to a technical default, or the Fed will have to turn on the printing press again. However, from our point of view, this will absolutely not be a problem for the US dollar. In the United States, a country that is used to living in debt, the likelihood of technical default occurs twice a year, and this does not affect the country's economy or the political atmosphere, especially with a president like Donald Trump, who manages to clash with everyone and believes that he is the only one who has a correct opinion. Trading recommendations: The EUR/USD pair stopped moving up, and the MACD indicator turned down, so now a correction is possible, at least a side one. It is recommended to open new long positions when the MACD indicator turns up with the target of 1.1422. It is recommended to consider sell orders not earlier than consolidating below the Kijun-sen line, but even in this case, given the low volatility, the downward movement can be extremely weak. Therefore, it is recommended to work now in small lots or to expect increased volatility. In addition to the technical picture should also take into account the fundamental data and the time of their release. Explanation of illustration: Ichimoku Indicator: Tenkan-sen-red line. Kijun-sen – blue line. Senkou span a – light brown dotted line. Senkou span B – light purple dotted line. Chikou span – green line. Bollinger Bands Indicator: 3 yellow lines. MACD: A red line and a histogram with white bars in the indicator window. The material has been provided by InstaForex Company - www.instaforex.com |
| EUR/USD. A divide in the camp of the Federal Reserve: Jerome Powell remains "above the fray" Posted: 27 Feb 2019 03:15 PM PST Yesterday, the dollar index fell sharply to the level of 95.86, reflecting the devaluation of the US currency throughout the market. Jerome Powell slightly disappointed dollar bulls, despite the fact that the market was ready for his "dovish" rhetoric. Speaking in Congress, the head of the Federal Reserve confirmed his intention to show "patience" in the matter of raising interest rates, and also quite unexpectedly focused on the excessive growth of the country's debt. According to him, debt as a percentage of GDP began to grow too fast and this situation, by definition, is unsustainable. He complained that the United States spends too much money on health care (about 18%), while in other countries this figure is almost twice as low. At the same time, according to Powell, the effectiveness of these expenses is "very mediocre," which speaks of the imperfection of the system of medical care. It is worth noting that recently the Fed chief is increasingly talking about the problem of public debt, thereby reminding traders of the imminent arrival of a key date in this context (March 1), when the period of suspension of the US debt expires. According to experts, the Ministry of Finance can exhaust the limit of funds in early spring, after which there will be another crisis of the "debt ceiling". The dollar will come under pressure once again - due to the hypothetical probability of a technical default of the United States or excess liquidity, which will be issued by the Treasury. Against this background, a political crisis is not ruled out if the White House (trump) and Congress (Democrats) cannot find a compromise. In other words, the issue will soon be on the agenda, and Jerome Powell has only increased his concern about it. In particular, he said that if the state demonstrates the inability to increase the limit of public debt, it will increase the level of uncertainty, which in turn will adversely affect the business climate in the country. As for the prospects of monetary policy, the Fed chairman did not mention anything new. By and large, he repeated the main points of the January meeting of the regulator. He reiterated the fact that the inflationary pressure in the country has decreased, and this fact forces us to take a patient and wait-and-see position. In general, Powell balanced his speech quite harmoniously – he saved a "plus" for every "minus" and vice versa. For example, he said that the prospects of the US economy look "strong and positive", but external risks (Brexit and China) are a threat to the growth of key indicators. The labor market shows a positive trend - but weak wage growth constrains the growth of inflationary indicators. In other words, throughout his speech, Powell contrasted positive with negative, thereby justifying the Fed's wait-and-see policy. Contrary to the fears of some experts, the head of the Federal Reserve did not scare the market by lowering the interest rate. He voiced only one phrase that can be interpreted in such a way:"...the regulator is ready to use all the tools at its disposal to support economic expansion." However, this wording is too general and non-specific, so traders ignored this statement. In general, the situation remains in limbo. It is obvious that the Fed will take an observant position in the coming months, but the future prospects of monetary policy look very vague. According to the American press, there is a serious split in the Fed camp. Representatives of the conditionally "hawkish" wing of the regulator believe that if the US economy continues to strengthen (albeit at a slow pace) against the background of a decrease in unemployment, then the interest rate should be gradually raised. Their opponents do not agree with this statement of the question: in their opinion, it is necessary to tighten monetary policy only if inflation surpasses the two-percent target level, and not only exceeds, but also will be fixed above this value. Experts believe that the future of the interest rate will depend on the outcome of this confrontation. If "hawks" take the upper hand, then in September or December we can expect a further rate hike. Otherwise, the next round of monetary tightening will take place only in the first half of 2020. Judging by Powell's rhetoric, he is still "above the fray", especially against the background of the ongoing trade talks between Beijing and Washington. Despite the temporary weakening of the US currency, the euro-dollar pair failed to leave the area of the 13th figure. Powell's balanced speech could not provide the necessary support for the EUR/USD bulls, while other fundamental factors helped the dollar to stay afloat. Thus, the indicator of consumer confidence in the United States showed strong growth, recovering from a two-month fall. The figure for January was revised upwards (from 120 to 121.7), and the index jumped to 131 points in February. The external fundamental background also had indirect support for the dollar: the outbreak of the conflict between India and Pakistan (both states have a nuclear arsenal) strengthened anti-risk sentiment in the market, so the impulsive growth of the EUR/USD stopped. However, today, bulls of the pair are again storming the boundaries of the 14th figure against the background of positive rumors regarding the possible postponement of Brexit. Thus, the euro-dollar pair still has the potential for further growth, but for this it is necessary to overcome and consolidate above the 1.1405 mark (the lower boundary of the Kumo cloud on D1). In this case, buyers will open their way to the next resistance level - 1.1440 (the upper limit of this cloud). Otherwise, the pair will roll back to the middle line of the Bollinger Bands (1.1350) and further towards the Tenkan-sen line (1.1315). The material has been provided by InstaForex Company - www.instaforex.com |
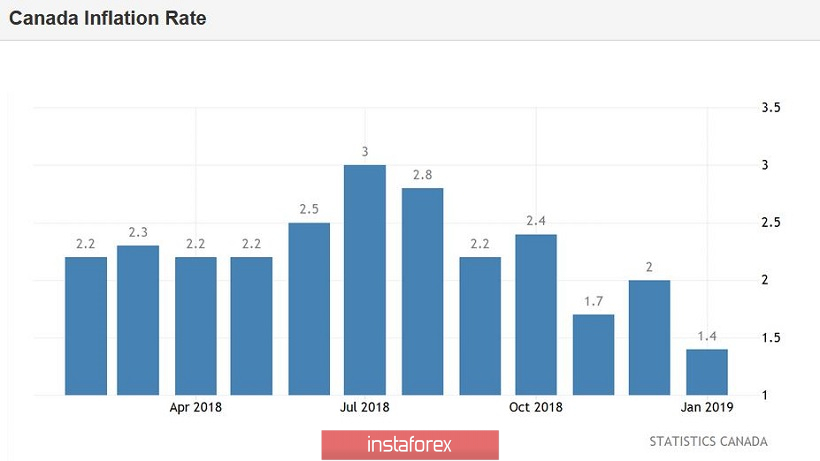
| USD/CAD: Canadian inflation weakness and fear of nuclear war Posted: 27 Feb 2019 03:07 PM PST The USD/CAD pair is between a rock and a hard place: on the one hand, the pair is under pressure from weak macroeconomic reports from Canada, on the other hand, the turbulent geopolitical situation provides indirect support to the US currency. In the end, the pair shows an impulsive movement in response to conflicting fundamental factors. And yet, in the medium term, the priority is still down: today's data on the growth of Canadian inflation only strengthened the overall position of the USD/CAD bears. The data really disappointed: the January consumer price index rose only to 0.1% on a monthly basis (with a weak growth forecast to 0.2%) and dropped to 1.4% in annual terms (this is the weakest growth rate since October 2017) . Core inflation also showed a negative trend, falling from 1.7% to 1.5% (y/y). Most significantly in January, electricity prices fell by 6.9% compared to the previous year. According to analysts, this is due to the fall in gasoline prices, which sharply dropped by almost 15%. Such weak numbers are consistent with the rest of the recent macroeconomic reports. For example, the core retail sales index in January again remained in the negative area (for the third month in a row), while the increase in the full-time employment rate slowed down significantly, as part-time employment was gaining momentum. This is reflected in the dynamics of wage growth in the country, as full-time positions suggest higher salaries. In other words, despite the good figures on the labor market in Canada, structural indicators are alarming, especially in the context of low inflation. In addition, in recent months, key indicators of the industrial sector have been declining, complementing the already unattractive fundamental picture. The reaction of the Canadian central bank was not long in coming: last week, the head of the regulator reported that now there is no need to resume the cycle of tightening monetary policy. In his opinion, the degree of uncertainty has currently increased in many ways, therefore, it is necessary to act with "special caution". It is worth recalling here that in December last year the market was set to further tighten the monetary policy of the Bank of Canada. The majority of the central bank's members were quite tough and expressed willingness to increase the interest rate at least to the lower limit of the neutral level (that is, to 2.5% from the current 1.7%). Most experts were confident that in 2019 there will be two or even three rounds of rate increases, and the first one will be in March. Now, the probability of the March increase is close to zero. Moreover, there are more and more rumors on the market that members of the Canadian regulator will follow their American counterparts and will wait until the end of the year. At least the rhetoric of members of the Central Bank of Canada softened noticeably, and the incoming data only confirms the validity of the long-term pause. Despite such a gloomy fundamental background, the USD/CAD pair is in no hurry to show a pronounced downward trend. Geopolitics is the main reason for this. The conflict between the two nuclear powers - India and Pakistan - has again escalated following the terrorist attack on February 14, which killed 45 people. Indian authorities have accused a separatist group based in Pakistan - a controlled part of Kashmir. The Indian Air Force launched an airstrike on the camp of this group, but the Pakistanis responded to the invasion of their territory: according to preliminary data, they shot down two Indian fighters, and the pilot of one of them was captured. In addition, the Pakistani aircraft bombed positions near the Indian Army. Despite calls for diplomatic negotiations, the situation is still on the brink of a full-scale conflict. According to one of the American news agencies, India and Pakistan have already put their nuclear forces on alert. According to journalists, a similar situation was last seen 17 years ago, when the parties were also on the verge of war (after the terrorist attack in the Indian parliament). Then the nuclear conflict was prevented thanks to the mediation of the United States and the Russian Federation. According to many political scientists, in the current conditions, it will be much more difficult to "extinguish the fire", given the current relations of the superpowers. A new focus of geopolitical tensions is reflected in the foreign exchange market. The dollar is again trying to enjoy the status of being a "safe-haven", although these attempts are largely offset by the "dovish" rhetoric of Jerome Powell, who continues to communicate with congressmen today. Summarizing all of the above, we can conclude that the Canadian dollar does not have its own arguments for growth. The wavy growth of the USD/CAD pair is only due to the dynamics of the dollar index. If international mediators can resolve the conflict between the nuclear powers, then the greenback will lose its appeal again, especially against the background of the latest comments by the Fed chairman. In this case, the USD/CAD pair will resume the downward movement to the first support level of 1.3070 (the bottom line of the Bollinger Bands indicator on the daily chart). The material has been provided by InstaForex Company - www.instaforex.com |
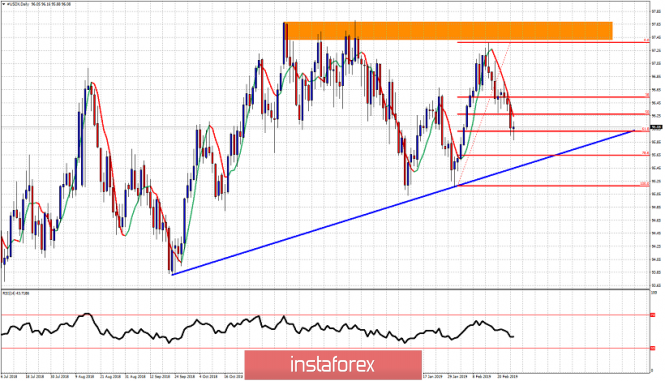
| Technical analysis for USDX for February 27, 2019 Posted: 27 Feb 2019 07:18 AM PST The Dollar index has stopped its decline at important short-term Fibonacci retracement level. If we see a new upward move with higher highs and higher lows from the current levels, we should then expect another run higher towards 97 for the big test.
Blue line - short-term trend line support The Dollar index is making higher highs and higher lows holding above the blue trend line support. Price has stopped the decline at the 61.8% Fibonacci level and there are high chances of making a bounce from current levels. Major resistance remains at the orange rectangle area. To reach that level we first need to see a break above the short-term resistance of 96.75. Breaking above the orange rectangle will open the way for a move to 100. Support at 95.50 is critical for bulls as a break below it will open the way for a deeper decline towards 94-93. The material has been provided by InstaForex Company - www.instaforex.com |
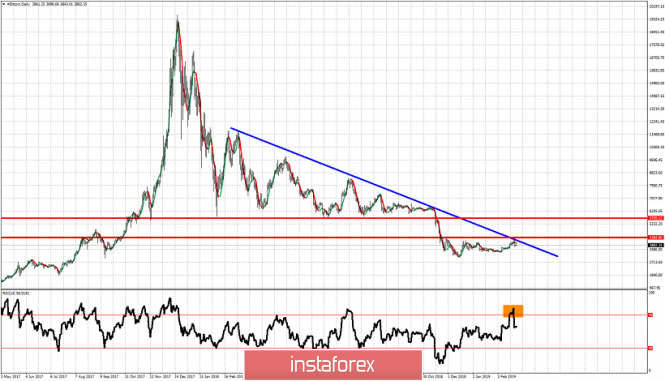
| Technical analysis for Bitcoin for February 27, 2019 Posted: 27 Feb 2019 07:12 AM PST Bitcoin has made a two and half month move higher from $3,000$ to $4,250 where it tested important weekly resistance levels and got rejected. Medium- and long-term trend remain bearish.
Blue line - major trend line resistance Red lines - horizontal resistance levels Orange rectangle - overbought RSI With the RSI at overbought levels and turning lower, price getting rejected at both the blue downward sloping trend line and at the red horizontal resistance level, things do not look bullish for Bitcoin. Price remains below key resistance level of $4,400. A weekly close above this level will confirm medium-term trend change to bullish. Until then trend remains bearish. Short-term support is found at $3,650 and as long as price is above this level, bulls continue to hope for another challenge of the blue trend line resistance. Breaking above $4,400 will open the way for a move towards the next horizontal major resistance at $5,750. Until this happens, longer-term trend remains bearish and Bitcoin is vulnerable to a move below $3,000. The material has been provided by InstaForex Company - www.instaforex.com |
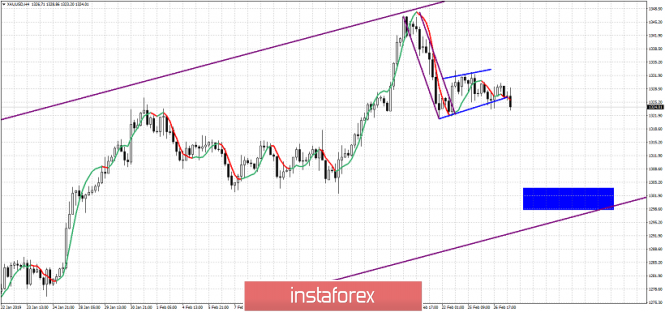
| Technical analysis for Gold for February 27, 2019 Posted: 27 Feb 2019 06:50 AM PST Gold price remains weak and vulnerable to a move towards $1,300. Despite Dollar weakness, Gold price remains below $1,330 trading around the break out area of $1,326-30.
Blue lines - bear flag Blue rectangle- target area Gold price remains inside the medium-term bullish channel. Short-term price action looks like a bear flag is being formed. Support is at $1,321 and a break below this level will confirm the break down. Our short-term target is at $1,300. Resistance is found at $1,332. A break above this level could bring more bulls back in and push price to recent highs. Until then prices are vulnerable to the downside. The material has been provided by InstaForex Company - www.instaforex.com |
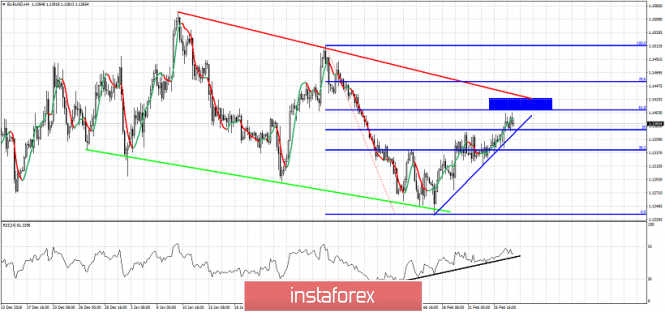
| Technical analysis for EUR/USD for February 27, 2019 Posted: 27 Feb 2019 06:47 AM PST EUR/USD has broken above short-term resistance at 1.1370 and has reached our second bounce target area as shown in previous posts. Short-term trend remains bullish as price continues to make higher highs and higher lows.
Black line - RSI support trend line Blue rectangle - second target area Green line - support Red line - major resistance trend line EUR/USD is approaching the 61.8% Fibonacci retracement and the red downward sloping trend line resistance. This was our target area from low 1.13s. Traders should keep a close eye on the RSI support trend line. As long as the RSI is moving above it, the uptrend remains intact. Price is now approaching major resistance. A break above 1.1410-1.1425 will open the way for a test of the 1.1515 highs made at the end of January. The material has been provided by InstaForex Company - www.instaforex.com |
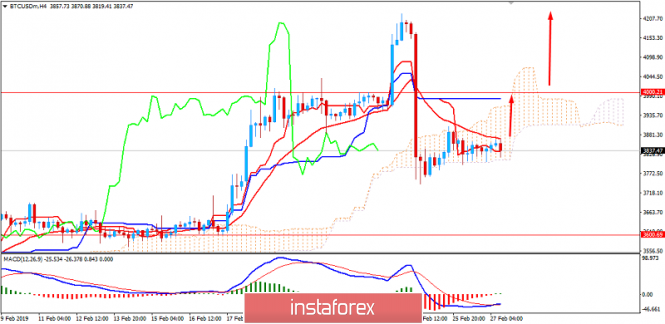
| BITCOIN Analysis for February 27, 2019 Posted: 27 Feb 2019 06:35 AM PST After a sharp drop below $4,000, Bitcoin is currently consolidating above $3,800 while being contained inside the dynamic support area of Kumo cloud. MACD is currently forming a bullish cross over while the price is making the upward correction. After the impulsive bearish pressure recently, the price formed Bullish Extreme Divergence which is expected to lead the price at least towards $4,000 in the coming days. A daily close above $4,000 is expected to lead to further bullish pressure as it will break above the dynamic resistance of Kijun line as well. On the contrary, a break below $3,800 area with a daily close is expected to lead the price towards $3,500-600 support area in the future.
|
| EURUSD: European economy continues to show slower growth Posted: 27 Feb 2019 06:11 AM PST The European currency continued to trade in the side channel in tandem with the US dollar after the release of fundamental data indicating a further slowdown in the growth of the European economy. According to the report, growth in bank lending to euro zone companies in January of this year slowed sharply, which is another signal to weaken the economic growth of the region. According to the European Central Bank, lending to companies in January 2019 grew by 3.3% compared with January of the previous year, after growing by 3.9% in December. The M3 money supply indicator in January rose by 3.8% compared with the same period of the previous year, after rising 4.1% in December. Economists had expected the growth of the M3 indicator in January to be 4%. Household lending in January increased by 3.2% compared with the same period of the previous year, as in December. The decline in lending is directly related to growing concerns about international trade, as the eurozone economy is highly dependent on the availability of financing. The weak report, testifying to the deterioration of their own prospects for companies in the eurozone, also affected the optimism of traders, putting on further growth of the euro. According to the European Commission, the sentiment index in the eurozone economy in February of this year fell to 106.1 points from 106.3 points in January. The eurozone consumer confidence index rose slightly in February. According to the report, the confidence index rose from a negative level of -7.9 points to -7.4 points, fully coinciding with the expectations of economists. The business climate index remained unchanged, at the level of 0.69 points. In the morning, a presentation was made by a member of the governing council of the European Central Bank, Jens Weidmann, who said that there was no reason for excessive pessimism about the prospects for the German economy. Let me remind you that Weidmann is the president of the Central Bank of Germany. He also noted that the ECB had begun the process of normalizing its monetary policy, which is likely to be gradual and take several years. Weidmann also warned that the risks and side effects of the ECB's soft policies should not be underestimated. Let me remind you that he is a supporter of a tighter monetary policy and has repeatedly criticized the European regulator for zero interest rates. In the second half of the day, all the market's attention will be focused on the speech of US Federal Reserve Chairman Jerome Powell, who will continue his speech on the state of the US economy and monetary policy. Powell's speech before the House Financial Services Committee is scheduled for 3:00 p.m. Most likely, nothing new after yesterday's speech Powell will not say. However, immediately after the speech, the Fed Chairman will answer questions, which is a more interesting point. As for the technical picture of the EURUSD pair, only a confident breakthrough and fixing above the resistance of 1.1400, which I personally doubt very much, will allow us to expect new highs in the area of 1.1430 and 1.1460 to be updated with the trading tool. A more interesting option for purchases will be a correction to support 1.1345 and 1.1315. The material has been provided by InstaForex Company - www.instaforex.com |
| Posted: 27 Feb 2019 06:11 AM PST To open long positions on GBP / USD you need: The British pound rose in the morning, despite the fact that many technical indicators are in the overbought zone, which indicates the likely formation of a downward correction in the short term. At the moment, it is best to rely on new long positions after the breakdown and consolidation above the resistance of 1.3329, which opens up a real prospect of updating the maximum of 1.3386 and 1.3437, where I recommend fixing the profits. In the case of a decrease in the pound in the afternoon, the area of 1.3264 will be an acceptable level for opening long positions. To open short positions on GBP / USD you need: Sellers still hold the market below 1.3329 resistance, however, it is best to expect a larger decline in the pound after another unsuccessful attempt to consolidate above this range, which can lead to a larger downward correction in the area of 1.3264 and 1.3202, where I recommend fixing the profits. In case of further growth with the trend, consider short positions in GBP / USD is best to rebound from the highs of 1.3386 and 1.3437. Indicator signals: Moving Averages Trade is conducted above the 30-day and 50-medium moving, which indicates the bullish nature of the market. Bollinger bands In the case of a downward correction, support will be provided by the average Bollinger Bands indicator around 1.3264. Description of indicators
|
| EUR / USD: Euro strengthened mainly due to the weakening dollar Posted: 27 Feb 2019 06:00 AM PST The statistics released today confirmed once again the absence of the momentum of the economic growth in the eurozone. However, despite this, the euro continues to strengthen, indicating that market participants are ready for further purchases of the single European currency. The EUR/USD pair has been rising for the third day in a row, heading for the 1.14 mark after breaking through the local resistance level of 1.1370. According to the latest report of the European Commission, the composite index of business and consumer confidence in the eurozone economy fell to 106.1 points in February of this year from 106.3 points revised in January. The indicator value has become the lowest since November 2016. Experts anticipated a decline to 106 points from the previously announced value of 106.2 points. So far, the euro has managed to ignore this statistic, which is primarily due to the almost universal weakening of the greenback. It is assumed that the EUR / USD pair can break through the level of 1.14 in the short term if the speech of Fed Chairman Jerome Powell, which will be held today in the US Congress. This will again put pressure on the US currency. At the same time, the euro looks vulnerable to alarming economic signals that limit the investment attractiveness on a wider horizon. This will again put pressure on the US currency. The material has been provided by InstaForex Company - www.instaforex.com |
| Posted: 27 Feb 2019 05:53 AM PST
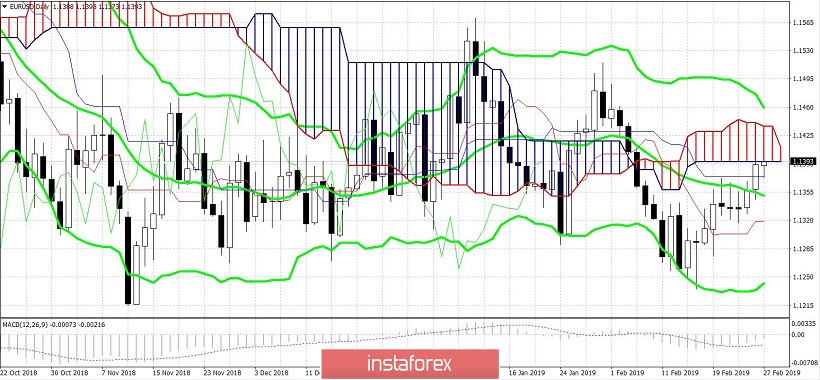
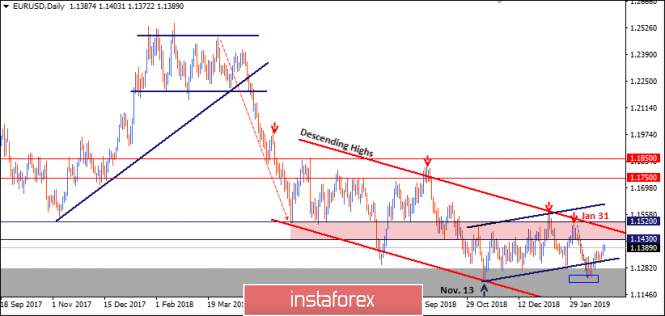
Since June 2018, the EUR/USD pair has been moving sideways with slight bearish tendency within the depicted bearish Channel (In RED). On November 13, the EUR/USD pair demonstrated recent bullish recovery around 1.1220-1.1250 where the current bullish movement above the depicted short-term bullish channel (In BLUE) was initiated. Bullish fixation above 1.1430 was needed to enhance further bullish movement towards 1.1520. However, the market has been demonstrating obvious bearish rejection around 1.1430 few times so far. The EUR/USD pair has lost its bullish momentum since January 31 when a bearish engulfing candlestick was demonstrated around 1.1514 where another descending high was established then. This allowed the current bearish movement to occur towards 1.1300-1.1270 where the lower limit of the depicted DAILY channel came to meet the pair. Since February 20, the EUR/USD pair has been demonstrating weak bullish recovery with sideway consolidations around the depicted price zone (1.1300-1.1270). This week, significant bullish recovery has emerged indicating a high probability of a quick bullish visit towards 1.1400-1.1460 where the upper limit of the daily movement channel is located. On the other hand, please note that a bearish flag pattern may become confirmed if bearish persistence below 1.1250 is achieved on the daily basis. The pattern target is projected towards 1.1000. Trade Recommendations: A counter-trend BUY entry was already suggested near the price level (1.1285) (the lower limit of the depicted movement channel). T/P level to be located around 1.1420 while S/L should be advanced to entry level (1.1315) to secure some profits. The material has been provided by InstaForex Company - www.instaforex.com |
| EUR / USD plan for the US session on February 27. Euro has moved to the new side channel Posted: 27 Feb 2019 05:39 AM PST To open long positions on EUR / USD pair, you need: The unsuccessful attempt to get out of yesterday's maximum and to gain a foothold above the resistance of 1.3192 led to the formation of a new side channel in the pair. At the moment, it is best to return to long positions in euro after a false breakdown in the support area of 1.1374 or to rebound from the lower border of channel 1.1348, where euro sellers will also take profits. The main task is still to breakthrough and consolidate above the upper boundary of the channel in the area of 1.1403, which will lead to the renewal of new highs in the area of 1.1432 and 1.1459, where I recommend taking profits. The Speech by Fed Chairman Jerome Powell in the afternoon may lead to a surge in volatility in the pair. To open short positions on EUR / USD pair, you need: Today, the Eurozone data limited the growth of the euro in the first half of the day. As long as trade will be conducted below the upper limit of the side channel at 1.1403, the pressure on EUR/USD pair will continue and a breakthrough with consolidation below the middle of the channel in the region of 1.1374 will lead to an update of the minimum of 1.1348, where I recommend taking profits. In a scenario of a re-growth of the euro above the resistance of 1.1403, during the Fed chairman's speech as it was yesterday, it is best to consider new short positions to rebound from a maximum of 1.1432 and 1.1459. More in the video forecast for February 27 Indicator signals: Moving averages Trade remains in the region of 30- and 50- moving averages, which indicates the lateral nature of the market with the advantage of euro buyers. Bollinger bands Bollinger Bands indicator volatility is very low, which does not give signals on market entry. Description of indicators MA (moving average) 50 days - yellow MA (moving average) 30 days - green MACD: fast EMA 12, slow EMA 26, SMA 9 Bollinger Bands 20 The material has been provided by InstaForex Company - www.instaforex.com |
| Escalation of the military conflict between India and Pakistan pushes the yen and the franc higher Posted: 27 Feb 2019 05:28 AM PST With the threat of a trade war, it added warning quite real. After Pakistan has shot down two Indian military aircraft, the conflict between the two countries could reach a new level. The Pakistani authorities even held a meeting of the Security Council with the participation of representatives of the nuclear forces. Financial markets reacted predictably and investors noticeably diminished their appetite for risky assets. However, safe currencies began to grow, which is usually the case in such situations. Both of the Japanese yen and the Swiss franc are rapidly becoming more expensive. Japanese and Swiss currencies tend to rise during political and economic shocks. Pakistan shot down planes the day after Indian pilots struck the terrorist bases on its territory for the first time after the war in 1971. Currently, the best choice of major currencies is yen. The franc reached a 3-week high - 0.9967 against the dollar while and the yen rose to 110.355 yen per dollar. The pound rose after British Prime Minister Theresa May proposed to lawmakers an option that increased the chance of avoiding a problem withdrawal from the EU. Meanwhile, the dollar was stuck near a three-week low "thanks to" the comments of Fed Chairman Jerome Powell that the regulator will be more "patient" in regards to the rate hike. As long as the Fed maintains a neutral position, it will be difficult for the dollar to find an additional impetus for growth. In addition, you should pay attention to the sterling pound, which for the first time in five months has risen above $1.33. The pound rose after British Prime Minister Theresa May proposed to lawmakers an option that increased the chance of avoiding a problem withdrawal from the EU. Meanwhile, the dollar was stuck near a three-week low "thanks to" the comments of Fed Chairman Jerome Powell that the regulator will be more "patient" in regards to the rate hike. As long as the Fed maintains a neutral position, it will be difficult for the dollar to find additional impetus for growth. The material has been provided by InstaForex Company - www.instaforex.com |
| February 27, 2019: Significant Demand-Zone for GBP/USD to be considered Posted: 27 Feb 2019 05:15 AM PST
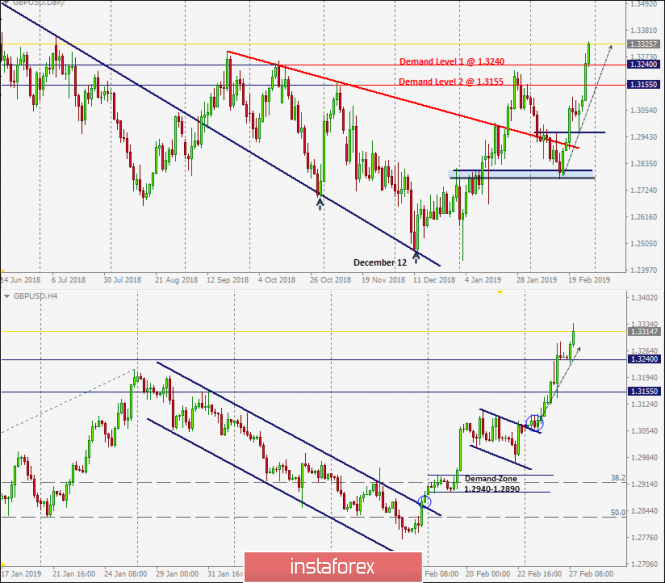
On December 12, the previously-dominating bearish momentum came to an end when the GBP/USD pair visited the price levels of 1.2500 where the backside of the broken daily uptrend was located. Since then, the current bullish swing has been taking place until January 28 when the GBP/USD pair was almost approaching the supply level of 1.3240 where the recent bearish pullback was initiated. Shortly after, the GBP/USD pair lost its bullish persistence above 1.3155. Hence, the short-term scenario turned bearish towards 1.2920 (38.2% Fibonacci) then 1.2820-1.2800 (50% Fibonacci level) within the depicted H4 bearish channel. On February 15, significant bullish recovery was demonstrated around 1.2800-1.2820 (Fibonacci 50% level) resulting in a Bullish Engulfing daily candlestick. This initiated the current bullish breakout above the depicted H4 bearish channel. A quick bullish movement was demonstrated towards 1.3155, 1.3240 and 1.3300. Bullish persistence above the newly-established depicted demand-zone (1.3240-1.3155) is a MUST so that the current bullish movement can pursue towards higher bullish targets. Any bearish breakdown below 1.3240 invalidates the short-term bullish scenario allowing a quick bearish movement to occur towards 1.3150. Trade Recommendations : Conservative traders should wait for a bearish pullback towards 1.3240 for a valid BUY entry. S/L to be located below 1.3190. T/P levels to be located around 1.3290, 1.1330 and 1.3360. The material has been provided by InstaForex Company - www.instaforex.com |
| EUR / USD Technical Analysis Recommendations on February 27 Posted: 27 Feb 2019 05:10 AM PST EUR / USD pair Today's economic calendar contains statistics with an average and low degree of importance. For today's more important events, we can only note on the speech of the Fed Chairman at 15:00 London time. Yesterday, the players on the rise still managed to get out of the consolidation zone and tested the resistance levels of 1.1374 - 1.1402 (daily Kijun + daily Senkou Span B + weekly Tenkan). Today, the result will be formed based on the outcome of the activity. Overcoming the levels will open the way to new upward goals, which in this case, the following resistance is now located in the area of 1.1441-47 (daily Senkou Span A + weekly Fib Kijun + monthly Kijun). Formation of a rebound in this place will return the pair to support the daily cross of 1.1341-19 (daytime Fib Kijun + Tenkan). After the update of the maximum and testing of resistance, the rise was replaced by a corrective decline. To date, the depth of the correction as led the pair to the first important support of 1.1379, which was the central Pivot day level. The players on the rise is now a good reason to complete the decline. Thus, they will preserve the chances for a quick and active continuation of the rise. The breakdown of support at 1.1379 the technical indicators on H1 support the development of correction in the current situation, allowing players to go down to the next important level of 1.1351, which was the weekly long-term trend. A fixation below 1.1351 can significantly change the current balance of forces and form a rebound from the encountered resistances at higher time, led by the weekly Tenkan at 1.1402). There are no new divergences. It may be noted that yesterday the pair completed the first target of the divergence of February 18 on stochastics. The next guideline is now the maximum extremum of 1.1514. Ichimoku Kinko Hyo (9.26.52), Pivot Points (classic), Moving Average (120) The material has been provided by InstaForex Company - www.instaforex.com |
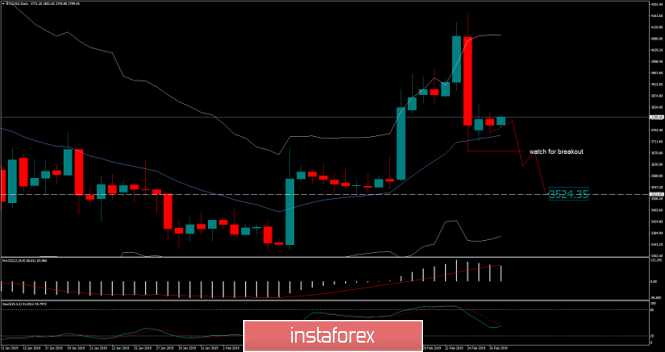
| Bitcoin analysis for February 27, 2019 Posted: 27 Feb 2019 04:17 AM PST The 4-day balance is active on the BTC. Key support remains at the price of $3.678.
Strong bearish outside bar in the background can represent the beginning of the new downward trend. It is normal that after the big down day BTC trade sideways because the market needs to rest before the new momentum. Major resistance is set at the price of $4.172. Trading recommendation: We are neutral on the BTC but we will sell if we see breakout of support at $3.678 with a target at $3.524 and stop at $3.855. The material has been provided by InstaForex Company - www.instaforex.com |
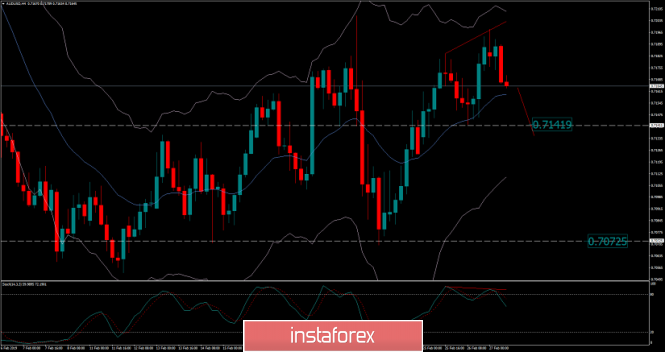
| AUD/USD analysis for February 27, 2019 Posted: 27 Feb 2019 03:59 AM PST AUD/USD did a fake breakout of the short-term resistance at the price of 0.7182. Seems like sellers took control from buyers.
We found bearish divergence on the Stochastic oscillator, which did set the current downward tone. There is also the down breakout of the 12h balance, which is another sign of the weakness. Support is seen at the price of 0.7142-0.7072 and the resistance at 0.7200. Trading recommendation: Aggressive entry: You can sell AUD/USD from 0.7170 with targets at 0.7142 and 0.7073. Protective stop can be placed above 0.7200. Conservative entry: You can wait for breakout of 0.7142 to confirm further downside and then put target at 0.7072 and protective stop at 0.7200. The material has been provided by InstaForex Company - www.instaforex.com |
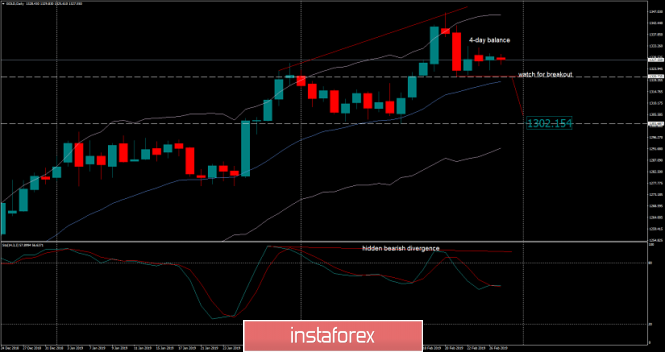
| Analysis of Gold for February 27, 2019 Posted: 27 Feb 2019 03:41 AM PST Gold continues to trade sideways at the price of $1.328.00. The 4-day balance is present.
Gold price got rejected at the upper Keltner band (resistance) and pulled back towards $1.327.00, which is a sign that buying looks risky. The 4-day balance is present with the support at $1.320.70 and resistance at $1.341.00. More weakness is detected because of the active bearish divergence on the Stochastic oscillator. Breaking below the support at $1.320.70 would confirm a further downward movement and potential test of $1.302.15 Trading recommendation: We are neutral about Gold but we are looking for selling opportunities if we see a breakout of support ($1.320.70) with the target at $1.302.15. Protective stop will be placed at $1.334.00. The material has been provided by InstaForex Company - www.instaforex.com |
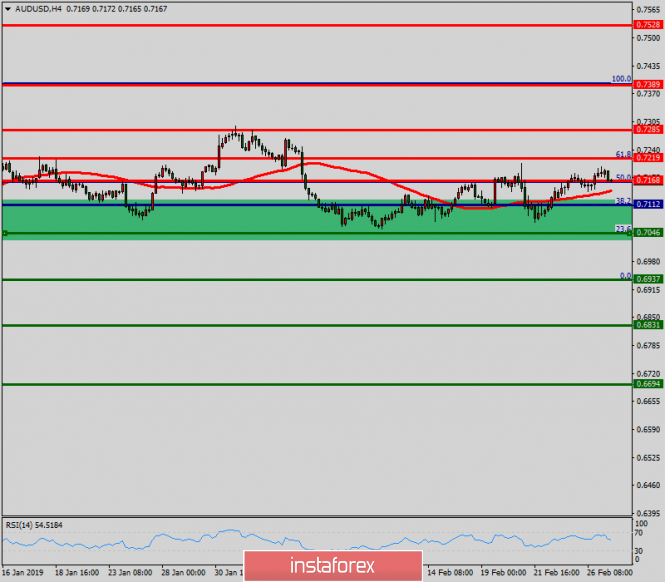
| Technical analysis of AUD/USD for February 27, 2019 Posted: 27 Feb 2019 03:34 AM PST The AUD/USD pair is set above strong support at the level of 0.7046 which coincides with the 23.6% Fibonacci retracement level and 0.7168. This support has been rejected four times confirming the uptrend. Hence, major support is seen at the level of 0.7046, because the trend is still showing strength above it. Accordingly, the pair is still in the uptrend in the area of 0.7046 and 0.7168. The AUD/USD pair is trading in the bullish trend from the last support line of 0.7112 towards the first resistance level of 0.7168 in order to test it. This is confirmed by the RSI indicator signaling that we are still in the bullish trending market. Now, the pair is likely to begin an ascending movement to the point of 0.7168 and further to the level of 0.7290. The level of 0.7389 will act as major resistance and the double top is already set at the point of 0.7389. At the same time, if there is a breakout at the support levels of 0.7112 and 0.7046, this scenario may be invalidated. Overall, however, we still prefer the bullish scenario. The material has been provided by InstaForex Company - www.instaforex.com |
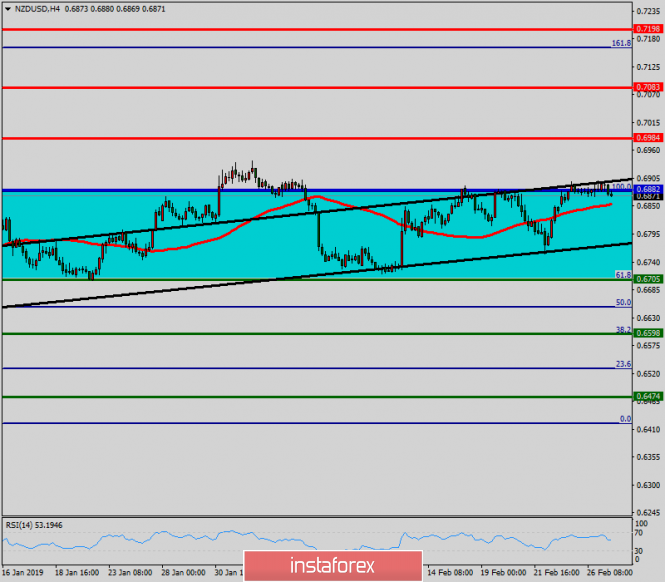
| Technical analysis of NZD/USD for February 27, 2019 Posted: 27 Feb 2019 03:32 AM PST Overview: The NZD/USD pair breached resistance which had turned into strong support at the level of 0.6705 this week. The level of 0.6705 coincides with a golden ratio, which is expected to act as major support today. The RSI is considered to be overbought, because it is above 70. The RSI is still signaling that the trend is upward as it is still strong above the moving average (100). Besides, note that the pivot point is seen at the point of 0.6882. This suggests that the pair will probably go up in the coming hours. Accordingly, the market is likely to show signs of a bullish trend. In other words, buy orders are recommended to be placed above 0.6800 with the first target at the level of 0.6882. From this point, the pair is likely to begin an ascending movement to the point of 0.6882 and further to the level of 0.6984. The level of 0.6984 will act as strong resistance. On the other hand, if there is a breakout at the support level of 0.6705, this scenario may become invalidated. The material has been provided by InstaForex Company - www.instaforex.com |
| Posted: 27 Feb 2019 03:01 AM PST Speaking at the Senate Banking Committee, the head of the US Fed, Jerome Powell, said that the situation with the growth of public debt is unsustainable by definition and that the government will have to find ways to stabilize the ratio of government debt to economic growth. Powell was also forced to admit that the United States should spend more and more on servicing the debt and the direct question of the probable bankruptcy of the social security system was forced to avoid a direct answer. In fact, the most obvious way to stabilize debt is to reduce costs, the lion's share of which consists of social programs. He expressed his opinion, which, perhaps, coincides with the consensus opinion of the FOMC members to take a wait-and-see position on monetary policy. Inflationary pressure is moderate and allows for a pause as the labor market remains strong. Actually, the markets do not expect the Fed to continue the policy tightening with more questions because of the program to reduce the balance. The Fed has completed the practice of reinvesting in US government securities but it does not have to violate financial sustainability. During the years of the QE, the Fed's obligations did not grow at all due to the creation of new money which was influenced by the higher excess reserves of commercial banks. This happened when the Fed began to pay commercial banks for keeping their reserves in its accounts since 2008. As a result, according to the schedule of liabilities, it is clearly seen that the growth of money in circulation was insignificant and increased along with the growth of the economy, as well as the lion's share of the growth of assets due to which securities were redeemed in the course of three waves of quantitative expansion. It fell on the funds of commercial banks, which went from the interbank lending market available to the Fed. At the same time as the key rate increased by 0.25% since the start of the Fed normalization policy, it also increased the rate of excess reserves but only by 0.2% at each step. Thus, the gap between the rate of excess reserves and the yield of traditional instruments reduces. In January, this spread was eliminated, that is commercial banks no longer have any financial interest to continue to hold funds on the Fed's correspondent accounts. Accordingly, the Fed has all the opportunities to continue to reduce the balance not touching its own assets but only freeing up the excess funds of the commercial banks. In turn, Combanks can buy US public debt directly when it moves along the path laid down by the Banks of Japan in 2014. Recall that the giant national debt of Japan is almost entirely concentrated within the country, government bonds are redeemed by the banking system without any hope of ever getting rid of their presence on its balance sheet. In fact, the banking system of Japan directly finances the country's budget and without this mechanism, Japan would have passed through a default long ago. Apparently, the US is moving in the same direction. These factors directly or indirectly indicate the likely stage of a weakening dollar, which will be reflected in the stabilization of oil prices above $70 per barrel, as well as the rise in the price of gold and the yen, which the Bank of Japan is seriously preparing. EUR / USD pair In the eurozone today, indicators of consumer and business confidence for February will be published, the markets will look for the answer to the question of whether European economies have begun the recovery. The dollar weakness supports the euro and the euro is expected to return above 1.14. There are no reasons to wait for a reversal amid a definitely bullish the short-term impulse. GBP / USD pair Theresa May made another attempt to convince the Parliament of Great Britain to accept her plan for Brexit. If the project is rejected, a second vote is scheduled for March 12. On the next day, there will be another vote on March 13 with the possibility of leaving the EU without a deal at all. If it is successful, there will be the last vote on March 14 on the possibility to request a postponement until June. The pound has responded positively to May's new initiatives and remains the favorite to pair with the dollar. There was an update of the January maximum of 1.3210. The assault of resistance is expected at 1.3295 with the growth potential in the medium term up to 1.37. The material has been provided by InstaForex Company - www.instaforex.com |
| XAU / USD: bulls retreat, but do not give up Posted: 27 Feb 2019 02:51 AM PST After impressive growth, gold retreated from its 10-month highs. According to experts, this rollback is likely to be of a technical nature: the bulls, apparently, decided to take a breath and fix a part of the profits. Meanwhile, given the bearish prospects of the greenback and the reluctance of the leading central banks to tighten monetary policy, the future of the precious metal appears in rather iridescent tones. On the eve of the Fed, Jerome Powell, during a speech at the US Senate Banking Committee, said that the US economy is still strong, but the processes that the regulator is unable to control, (the slowdown in Chinese and European GDP growth, the uncertainty around trade wars and Brexit) be careful. In addition, J. Powell noted increased market volatility, recognizing that financial conditions are now less favorable for economic growth than a year ago. Thus, the regulator still intends to adhere to a patient approach in monetary policy, which is not very good news for a greenback. Under these conditions, according to JP Morgan, the best assets for investment than gold and US-protected treasury securities will probably not be found. At the same time, the decline in the real rates of the US debt market should provide the XAU / USD pair a path to the north. Gold can also receive support from the normalization of trade relations between the United States and the Middle Kingdom. If the parties manage to make a deal, then the tendency to weaken the dollar will continue, which will play in favor of the yellow precious metal. At the same time, it is possible that gold will still lose some of its positions due to a decrease in demand for the assets of the "safe haven", which, however, is unlikely to create serious problems for the bulls in precious metals. The material has been provided by InstaForex Company - www.instaforex.com |


| You are subscribed to email updates from Forex analysis review. To stop receiving these emails, you may unsubscribe now. | Email delivery powered by Google |
| Google, 1600 Amphitheatre Parkway, Mountain View, CA 94043, United States | |
No comments:
Post a Comment