
Analyst Articles – Forex News 24 |
- Sterling (GBP) Price Outlook – GBPUSD & EURGBP
- EURUSD Breaks Above 1.1200 on Positive Euro-Zone Data Releases
- Euro Pushes Higher After German Jobs Numbers, Data-Heavy Session Lies Ahead
- European GDP, US Data May Pressure Nordics
- Crude Oil Prices May Break 2019 Uptrend on Global Slowdown Fears
- S&P 500 May Reverse on Technical, Sentiment Signals. KOSPI Falls
- China Stocks at Risk as Earnings Play Up Economic Contradictions
- Volatility Ahead of FOMC, EU Data
- S&P 500 and Dollar Trip Crossing the Breakout Finish Line, What to Watch Now?
- Aussie Outlook Bearish Despite Bounce
| Sterling (GBP) Price Outlook – GBPUSD & EURGBP Posted: 30 Apr 2019 03:29 AM PDT Hits: 14 GBP Price, News and Latest Analysis
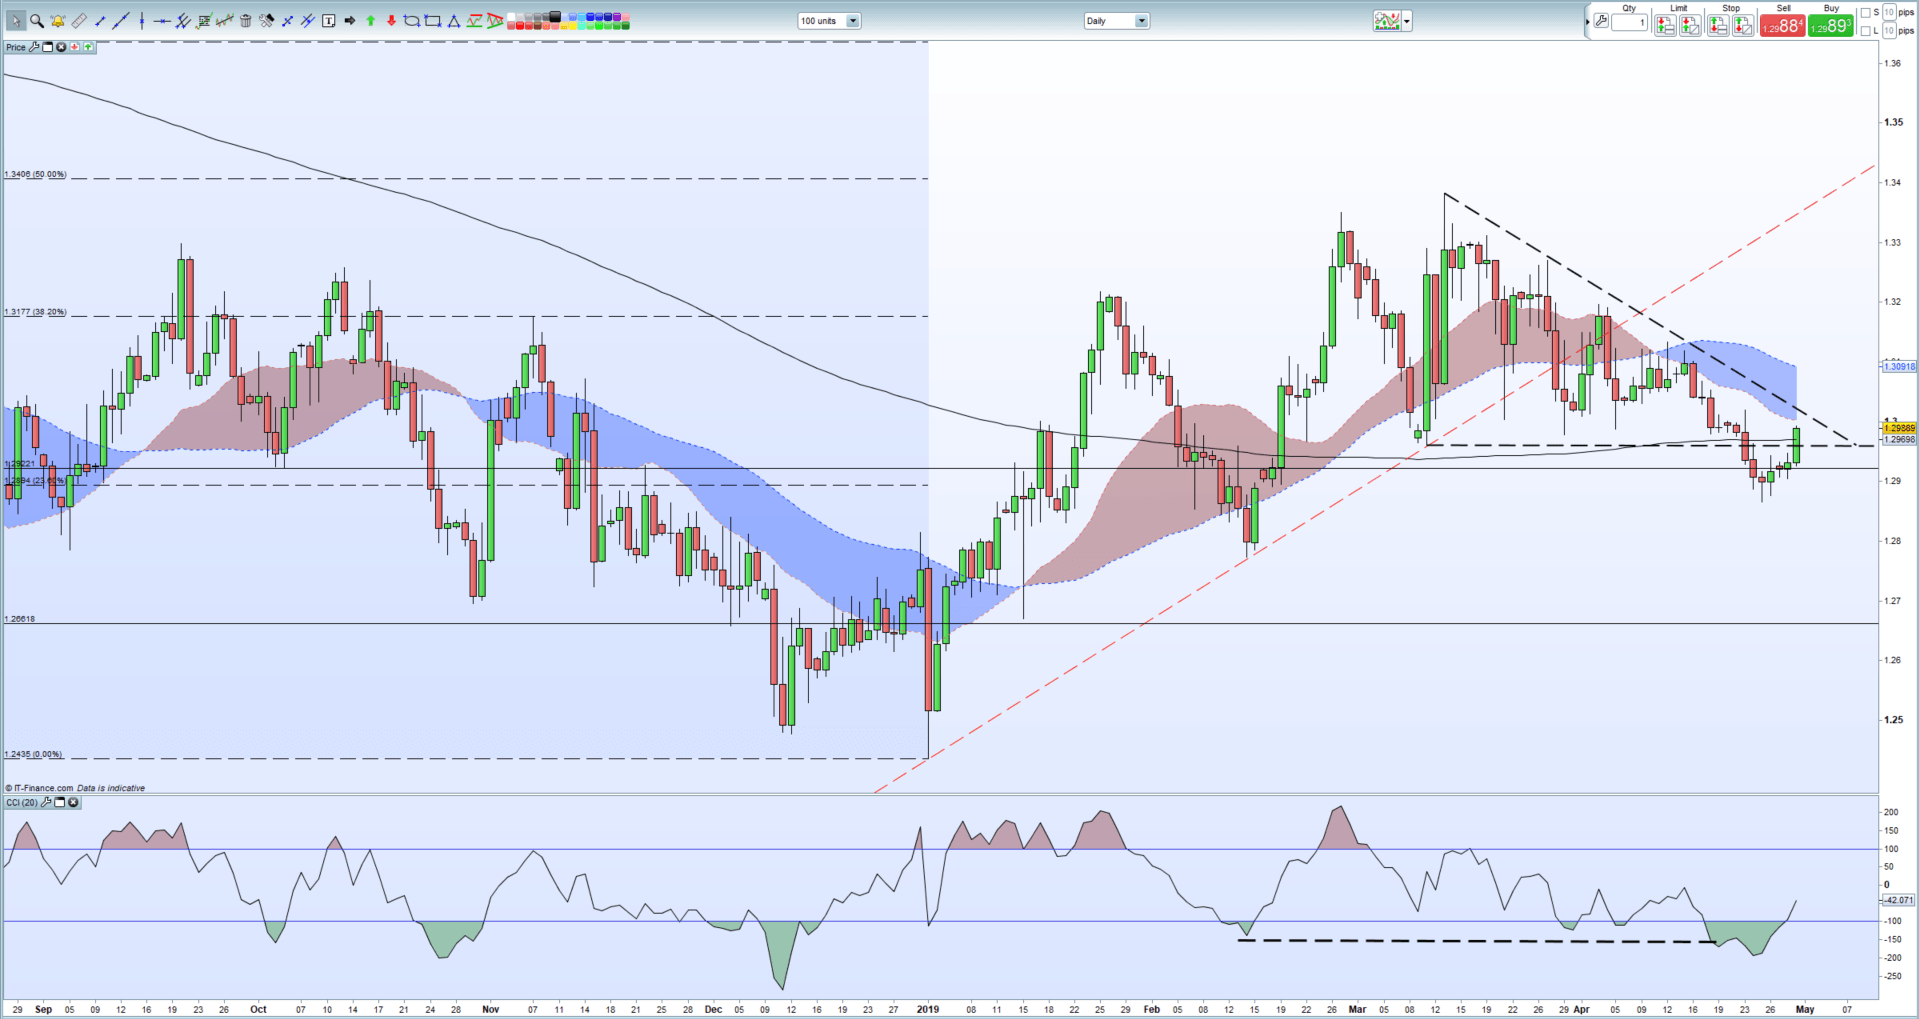
Q2 2019 GBP, USD and EUR Forecasts andTop Trading Opportunities GBPUSD Price and ChartSterling has opened Tuesday in a positive fashion against a weaker US dollar. GBP is strong against a range of currencies and is now pushing back above a couple of recent resistance levels that have capped GBPUSD. The pair are back above an old support-turned-resistance level around 1.2960 and they have also traded above the 200-day moving average around 1.2970. A close is needed above these levels to add momentum to the move which may find stiffer resistance around 1.3005 – 20-day moving average – and the downtrend off the March 13 high around 1.3025. GBPUSD Daily Price Chart (July 2018 – April 30, 2019)Retail traders are 71.7% net-long GBPUSD and 41.4% net-long EURGBP according to the latest IG Client Sentiment Data. See how recent daily and weekly positional changes affect GBPUSD and EURGBP sentiment. EURGBP Price and ChartEURGBP is nudging lower but both sides of the pair are currently picking up a bid, so an outright move is limited. Recent support around 0.8624 – 23.6% Fibonacci retracement – may be tested in the short-term although this level has held over the last two weeks. Below here, 0.8590 to 0.8600 need to be monitored. To the upside, there are three recent highs between 0.8679 and 0.8683 that may attract interest if bullish momentum returns. The CCI indicator is slightly oversold but not to any great extent. EURGBP Daily Price Chart (August 2018 – April 30, 2019)
Traders may be interested in two of our trading guides – Traits of Successful Traders and Top Trading Lessons – while technical analysts are likely to be interested in our latest Elliott Wave Guide. What is your view on Sterling (GBP) – bullish or bearish?? You can let us know via the form at the end of this piece or you can contact the author at nicholas.cawley@ig.comor via Twitter @nickcawley1. http://platform.twitter.com/widgets.js Can you get luxurious from fx trading? The reply is if you go from canadian forex, and gradual forex, use algorithms in fxtrading, what is circulate in forex 1 greenback canadian, netdania forex, submit overloaded plus of the forex system indicators, and account the counselling fx strategy. We present win win all.
|
| EURUSD Breaks Above 1.1200 on Positive Euro-Zone Data Releases Posted: 30 Apr 2019 02:16 AM PDT Hits: 17 EURUSD Price, Chart and Analysis:
Q2 2019 EUR Forecast and USD Top Trading Opportunities EURUSD remains within a noted downtrend but may be looking to continue its recent correct bounce higher with the 1.1200 handle in already broken. Today's Euro-Zone q/q GDP data came in marginally better-than-expected – 0.4% vs 0.3% expectations and 0.2% prior – while recent indications are that German CPI later today may also surprise to the upside after recent regional results. Earlier in the session, German unemployment data also beat expectations, adding another positive EURUSD impulse. The current positive momentum in EURUSD may see last Wednesday's 1.1224 level come under pressure before the 20- and 50-day moving averages at 1.1236 and 1.1261 come into view. The CCI indicator shows the pair moving sharply out of oversold territory. EURUSD needs to break and close above the recent double-top at 1.1325 to gain further momentum. EURUSD Daily Price Chart (August 2018 – April 30, 2019)
Retail traders are 62.9% net-long EURUSD according to the latest IG Client Sentiment Data, a bearish contrarian indicator. However recent daily and weekly positional changes give us a mixed trading bias. We run several Trader Sentiment Webinars every week explaining how to use IG client sentiment data and positioning when looking at a trade set-up. Access the DailyFX Webinar Calendar to get all the times and links for a wide range of webinars. Traders may be interested in two of our trading guides – Traits of Successful Traders and Top Trading Lessons – while technical analysts are likely to be interested in our latest Elliott Wave Guide. What is your view on EURUSD – bullish or bearish? You can let us know via the form at the end of this piece or you can contact the author at nicholas.cawley@ig.comor via Twitter @nickcawley1. http://platform.twitter.com/widgets.js Can you get luxurious from fx trading? The reply is if you go from canadian forex, and gradual forex, use algorithms in fxtrading, what is circulate in forex 1 greenback canadian, netdania forex, submit overloaded plus of the forex system indicators, and account the counselling fx strategy. We present win win all.
|
| Euro Pushes Higher After German Jobs Numbers, Data-Heavy Session Lies Ahead Posted: 30 Apr 2019 01:38 AM PDT Hits: 9 Euro Talking PointsThe EURUSD was gaining some momentum at the open of the European session this morning, taking it past yesterday's high of 1.1187, that came on the back of US inflation figures that missed expectations and failed to provide support for the Dollar. EURUSD bulls were reinforced as German unemployment change came in at -12k, beating expectations of just -5k. The German unemployment rate remained stable at 4.9% as expected. German unemployment change measures the absolute change in number of people employed in Germany. A reading below expectations is seen as positive as more people are working which leads to a boost in the economy. A lower than expected figure is seen as bullish for the Euro. EURUSD PRICE CHART: 1 Minute Time-Frame (Intraday – April 30, 2019)A Heavy Session Ahead for the EuroAs the pair has mostly been dollar-driven in the past few sessions, today may be an expection as a busy session lies ahead for European data which is expected to bring volatility to the Euro. With focus later on in the morning around Euro-Zone GDP figures due to be released at 10am UK time, the market will shift to Germany again in the early afternoon as German CPI figures are to be released at 1pm. Both the MoM and YoY figures are expected to increase, coming in at 1.5% and 1.5%, up from 0.3% and 1.3% repectively. If we see stronger unemployment and better than expected growth figures coming from the Eurozone we may see the Euro continue its recent uptrend. EUR Forecast: Traders Eye Eurozone GDP, Jobs, CPI Data Upcoming IG Client Sentiment – EURUSD: Retail trader data shows 67.4% of traders are net-long with the ratio of traders long to short at 2.07 to 1. In fact, traders have remained net-long since Apr 12 when EURUSD traded near 1.12763; price has moved 0.9% lower since then. The number of traders net-long is 0.5% lower than yesterday and 14.7% higher from last week, while the number of traders net-short is 9.2% higher than yesterday and 20.4% lower from last week. We typically take a contrarian view to crowd sentiment, and the fact traders are net-long suggests EURUSD prices may continue to fall. Positioning is more net-long than yesterday but less net-long from last week. The combination of current sentiment and recent changes gives us a further mixed EURUSD trading bias. Recommended Reading EURUSD Weekly Technical Outlook: Euro May Bounce, but Buyer Beware – Paul Robinson, Currency Strategist Eurozone Debt Crisis: How to Trade Future Disasters – Martin Essex, MSTA, Analyst and Editor KEY TRADING RESOURCES: — Written by Daniela Sabin Hathorn, Junior Analyst 2019-04-30 08:26:00 Can you get luxurious from fx trading? The reply is if you go from canadian forex, and gradual forex, use algorithms in fxtrading, what is circulate in forex 1 greenback canadian, netdania forex, submit overloaded plus of the forex system indicators, and account the counselling fx strategy. We present win win all.
|
| European GDP, US Data May Pressure Nordics Posted: 29 Apr 2019 11:45 PM PDT Hits: 11 NORDIC FX, NOK, SEK WEEKLY OUTLOOK
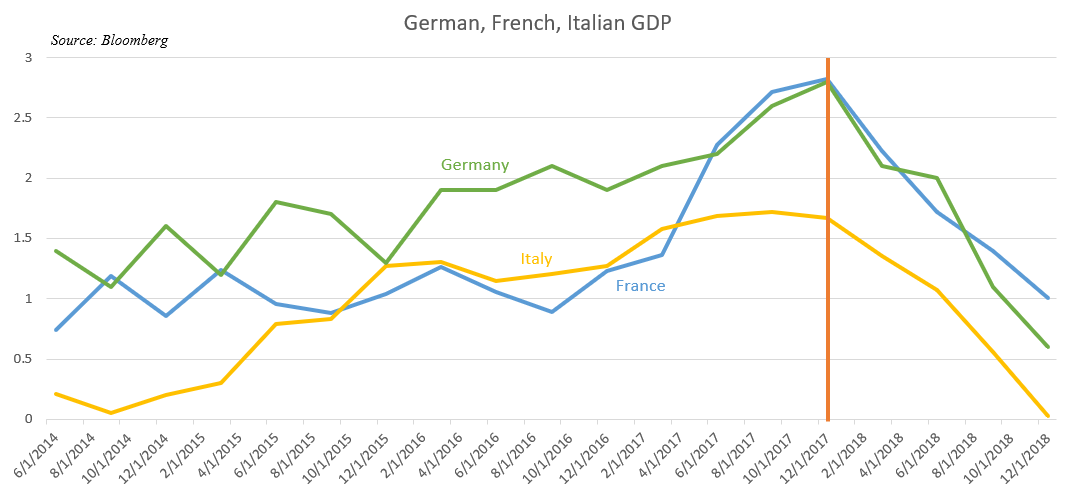
See our free guide to learn how to use economic news in your trading strategy! The Swedish Krona and Norwegian Krone may find themselves feeling tense in today's trading session as Eurozone, French and Italian GDP are released along with a slew of key growth indicators out of Germany. Economic reports have been broadly falling short of expectations, indicating that perhaps analysts are too optimistic about the Continent's growth – or there lack of. 70 percent of Sweden's exports head to Europe, of which 11 percent is consumed by Germany. This might help explain why Riksbank Deputy Governor Martin Floden expressed concern about slower growth from the "steam engine of Europe". Deceleration in the largest Eurozone economy has broader regional implications. It inevitably spills over into other Eurozone member states that rely on strong demand out of Germany. The nature of inter-European demand is also a point of concern for Norway. 80 percent of Norway's exports have Europe as their destination. 52 percent of those goods are linked to petroleum-based products. This leaves the Norwegian economy sensitive to changes in European demand due to the country's reliance on a cycle-sensitive commodity. This explains why Nordic policymakers are so concerned with European growth. Want to receive timely updates on economic data?Follow @DailyFXTeam on Twitter! For this reason, today's release of key growth indicators – and the potential volatility it may stoke – is a point of concern for Swedish Krona and Norwegian Krone traders. The outlook for European demand could impact the central bank's monetary policy out of Sweden and Norway if inflationary pressure in the EU continues to cool and sends a chilly breeze into the Nordic economies. US economic data will also heavily eyed by Nordic traders because of the global impact US economic activity has on the world economy. Swedish Krona and Norwegian Krone traders with exposure to a US-Dollar cross will be particularly mindful, given that the source of the event risk is emanating from the base currency's home. Looking to trade NOK, SEK? Sign up for my Nordic trading webinar here! CHART OF THE DAY: GDP FROM TOP THREE EUROZONE ECONOMIES KRONA, NORWEGIAN KRONE TRADING RESOURCES— Written by Dimitri Zabelin, Jr Currency Analyst for DailyFX.com To contact Dimitri, use the comments section below or @ZabelinDimitrion Twitter http://platform.twitter.com/widgets.js Can you get luxurious from fx trading? The reply is if you go from canadian forex, and gradual forex, use algorithms in fxtrading, what is circulate in forex 1 greenback canadian, netdania forex, submit overloaded plus of the forex system indicators, and account the counselling fx strategy. We present win win all.
|
| Crude Oil Prices May Break 2019 Uptrend on Global Slowdown Fears Posted: 29 Apr 2019 11:09 PM PDT Hits: 8 CRUDE OIL & GOLD TALKING POINTS:
Commodities were in digestion mode on Monday. Crude oil prices consolidated after Friday's plunge. Gold prices retraced downward, erasing nearly all of the gains scored in the wake of US GDP data. The spotlight now turns to first-quarter Eurozone GDP data. Growth readings for France, Italy and the currency bloc as a whole are due to cross the wires. Regional news-flow has tended to underperform relative to baseline forecasts, opening the door for disappointing results that stoke global slowdown fears and cool risk appetite. Cycle-sensitive crude prices may fall against this backdrop. Gold may rise as the defensive mood weighs on bond yields, boosting the comparative appeal of non-interest-bearing alternatives. Gains may be capped if the US Dollar finds support from haven flows, discouraging anti-fiat demand. Oil prices might face a further pressure as monthly EIA report on output comes across the wires. Leading weekly statistics put US production at a record-high 12.2 million barrels/day. API inventory flow data is also on tap and will be weighed against expectations of a 1.28-million-barrel build last week. See the latest gold and crude oil forecasts to learn what will drive prices in the second quarter! GOLD TECHNICAL ANALYSISGold prices remain wedged between support in the 1260.80-63.76 area and resistance marked by the recently broken neckline of a Head and Shoulders (H&S) topping pattern, now at 1290. A break below the former level sees the next downside barrier in the 1235.11-38.00 zone. Alternatively, a push above resistance sets targets the $1300/oz figure. The H&S setup implies an overall downside target at 1215.00. CRUDE OIL TECHNICAL ANALYSISCrude oil prices are idling at trend line support set form December. A daily close below this level – now at 63.30 – initially exposes 60.39. A dense resistance cluster runs through 67.03. A rebound above that, likewise confirmed on a closing basis, sets the stage for a challenge of the $70/bbl figure.
COMMODITY TRADING RESOURCES— Written by Ilya Spivak, Currency Strategist for DailyFX.com To contact Ilya, use the comments section below or @IlyaSpivak on Twitter http://platform.twitter.com/widgets.js Can you get luxurious from fx trading? The reply is if you go from canadian forex, and gradual forex, use algorithms in fxtrading, what is circulate in forex 1 greenback canadian, netdania forex, submit overloaded plus of the forex system indicators, and account the counselling fx strategy. We present win win all.
|
| S&P 500 May Reverse on Technical, Sentiment Signals. KOSPI Falls Posted: 29 Apr 2019 10:32 PM PDT Hits: 7 Asia Pacific Markets Wrap Talking Points
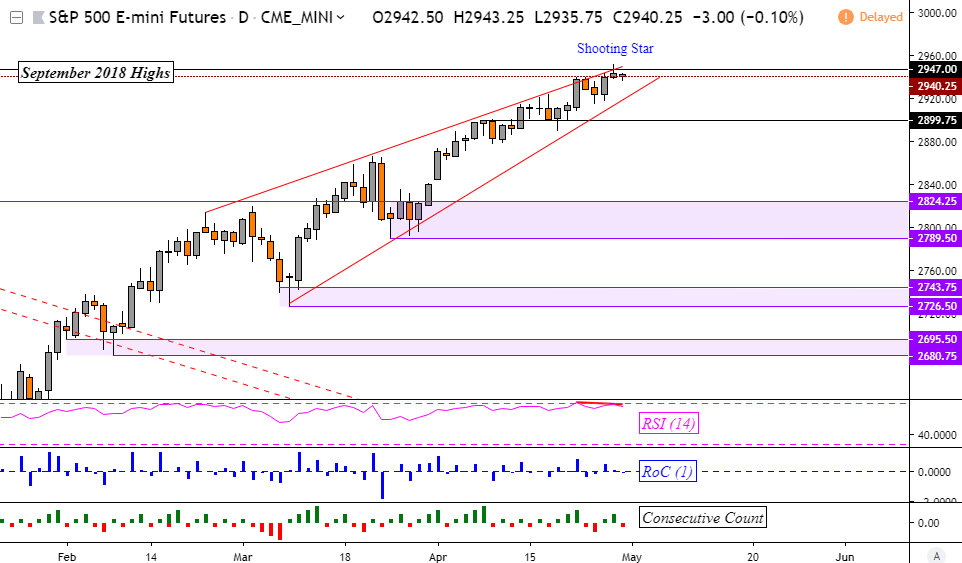
Find out what retail traders' equities buy and sell decisions say about the coming price trend! Asia Pacific equities traded mixed, failing to see market-wide follow-through on cautious gains stemming from Wall Street. There, the S&P 500 and Dow Jones Industrial Average closed 0.11% and 0.04% higher with some gains following lackluster core PCE data. Japanese markets are offline for the Golden Week holiday, reducing liquidity and increasing the odds of sudden FX volatility. This was the case with the Australian Dollar when it suddenly dropped on softer-than-expected Chinese manufacturing PMI data. The anti-risk Japanese Yen meanwhile gained against its major counterparts as the ASX 200 and KOSPI, Australia's and South Korea's benchmark stock indexes respectively, both fell about 0.50%. The latter was vulnerable as Samsung Electronics (a key component of the index) offered disappointing earnings. China's Shanghai Composite, on the other hand, was more than 0.4% higher at the times of this writing. However, market pessimism might prevail over the remaining 24 hours with S&P 500 futures pointing further to the downside. US consumer confidence, which may follow the trend of lackluster data, could be a catalyst. S&P 500 Technical AnalysisS&P 500 futures, which offer a view of after-hours trade, are showing signs of topping on the daily chart. This because of a Shooting Star, which shows indecision, formed after prices failed to close above the record highs in September. Accompanying this is a bearish Rising Wedge going back to February. On top of this, negative RSI divergence indicates fading upside momentum which can at times precede a turn lower. A decline places near-term support around 2900. Meanwhile, sentiment readings do warn that the S&P 500 may be readying up to turn lower. Want to learn more about how sentiment readings may drive the S&P 500? Tune in each week for live sessions as I cover how sentiment can be used to identify prevailing market trends! S&P 500 Futures Daily ChartChart Created in TradingView FX Trading Resources— Written by Daniel Dubrovsky, Junior Currency Analyst for DailyFX.com To contact Daniel, use the comments section below or @ddubrovskyFX on Twitter http://platform.twitter.com/widgets.js Can you get luxurious from fx trading? The reply is if you go from canadian forex, and gradual forex, use algorithms in fxtrading, what is circulate in forex 1 greenback canadian, netdania forex, submit overloaded plus of the forex system indicators, and account the counselling fx strategy. We present win win all.
|
| China Stocks at Risk as Earnings Play Up Economic Contradictions Posted: 29 Apr 2019 09:20 PM PDT Hits: 13 Chinese Stocks, Earnings Season, Talking Points:
Join our analysts for live, interactive coverage of all major economic data at the DailyFX Webinars. We'd love to have you along. Investors and traders looking at China's corporate earnings season have a multitude of contradictions to address. The mainboards of Shanghai and Shenzhen have been among the best performing stock indexes in the world this year, notching up gains of 24% and 33% respectively since January 1. Given the economic slowdown seen in many parts of the world and ongoing worries over global trade, that is no mean feat. Still, Chinese stocks have also just endured their worst week since at least last October, with the Shanghai index shedding about 6%. In part this split personality reflects the data. For every bright spot, such as the pleasant surprise spring by official Gross Domestic Product figures last month, there's a darker cloud like the most recent Purchasing Mangers Index figures. These missed expectations and suggested that this year's fight back into expansion territory may already be losing steam. This uneasy balance seems to be visible everywhere you look. China's industrial profits jumped a very healthy 13.9% in March, according to official figures. However, their first quarter performance was much worse. That turned in a 3.3% fall thanks to a cumulative 14% slide in January and February. Stimulus Drives Too Much Of The Growth We SeeWhat lies behind this economic schizophrenia is the suspicion, and in some cases the certainty, that what growth there is is largely the product of stimulus from the center. Those industrial profits were quite clearly underwritten by a coincident rise in credit growth in March. Small firms, especially, took full advantage of the Beijing-mandated objective of increased lending. Sure enough a recent survey by Nikkei, taken with earnings season in mind, found that although profits overall are rising, there's a clear split between the likes of Sany Heavy, which benefit from government spending largesse, and automakers like Changan which must rely on consumers who just aren't willing to consume. This dichotomy will probably mark the coming earnings season, and render even good results less impressive than they might have been. Perhaps perversely, even weak economic data might end up being welcomed as it may suggest that Beijing will keep the stimulus taps on. This reaction will be well-remembered from those who watched Western markets after the financial crisis when central bank action was held to be the only game in town, one which had to be kept going at all costs. Can a Trade Deal Really Help?What could of course swing focus back to the real economy and away from stimulus is a far-reaching trade agreement between China and the US. The US negotiating team is back in Beijing this week for yet more discussions and some in the market clearly still expect progress this month. Whether even a major trade deal can fully put the Chinese economy back on track and enable it to grow without constant interventions from Beijing will remain a very moot point. But hopes of it may well give the economy at least a short-term boost, and, crucially, may allow the indexes to ride out any lackluster earnings shocks. Resources for TradersWhether you're new to trading or an old hand DailyFX has plenty of resources to help you. There's our trading sentiment indicator which shows you live how IG clients are positioned right now. We also hold educational and analytical webinars and offer trading guides, with one specifically aimed at those new to foreign exchange markets. There's also a Bitcoin guide. Be sure to make the most of them all. They were written by our seasoned trading experts and they're all free. — Written by David Cottle, DailyFX Research Follow David on Twitter@DavidCottleFX or use the Comments section below to get in touch! http://platform.twitter.com/widgets.js Can you get luxurious from fx trading? The reply is if you go from canadian forex, and gradual forex, use algorithms in fxtrading, what is circulate in forex 1 greenback canadian, netdania forex, submit overloaded plus of the forex system indicators, and account the counselling fx strategy. We present win win all.
|
| Volatility Ahead of FOMC, EU Data Posted: 29 Apr 2019 08:44 PM PDT Hits: 9 NORDIC FX, NOK, SEK WEEKLY OUTLOOK
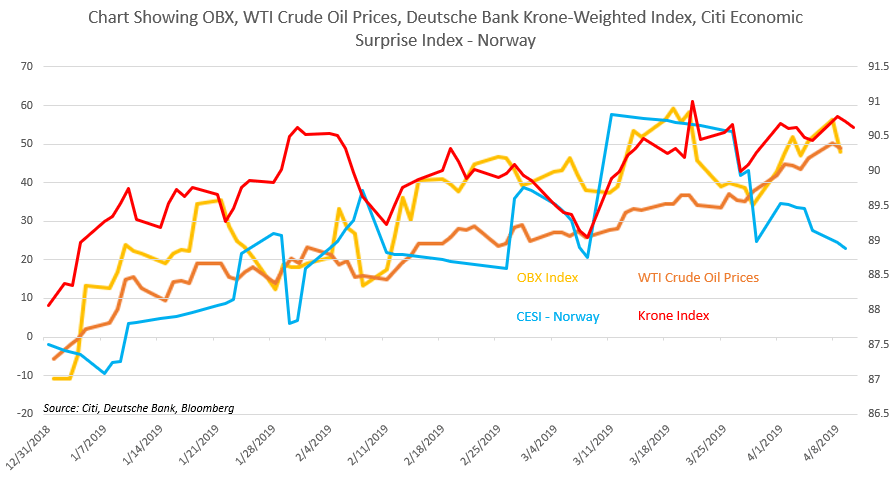
See our free guide to learn how to use economic news in your trading strategy! Following last week's volatility from the Riksbank rate decision and dovish commentary, the Swedish Krona and Norwegian Krone may turn away from their economically-light docket towards external event risk. On both sides of the Atlantic, key economic data will be published in Europe and the US, with a lot of attention on the FOMC rate decision and commentary from Fed Chairman Jerome Powell. Most of the event risk will occur in the front half of the week, including trade related developments that have also pollinated the docket and may add further tension to the export-driven Nordic currencies. US EVENT RISKSince February, US economic data has been tending to underperform relative to economists' expectations, even with the most recent GDP numbers beating forecasts. Upon closer inspection, the actual GDP report revealed weakness in consumption – the bedrock of economic activity in the US – while net exports showed a deceptive improvement. Below are some key US economic indicators and central bank-related risk that may spark volatility: Tuesday, April 30 – Consumer Confidence Index (APR) Wednesday, May 1 – ISM Data, FOMC Rate Decision Friday, May 3 – NFP, ISM Data, Unemployment Rate The FOMC rate decision on Wednesday will almost certainly garner the attention of global financial markets. Leading up to the release, volatility may be relatively tame. Market participants may be reluctant to commit amid uncertainty over what the central bank will say on the outlook for the world's largest economy. Sign up to get live coverage of the market reaction to the FOMC rate decision here! On Tuesday, USTR Robert Lighthizer and Treasury Secretary Steven Mnuchin will be traveling to Beijing as part of the ongoing trade war negotiations between the US and China. This follows last week's meeting between US and Japanese officials in an attempt to prevent another trade conflict. This comes as global demand has been yawning amidst the backdrop of Fed tightening and greater friction in international trade. Brussels and Washington are still in the process of negotiating their own truce with an awkward divergence in foreign policy hanging over the talks. The state of global trade affairs are a serious concern to Nordic currencies due to Norway and Sweden's economy reliance on healthy external demand. Trade tensions between the US and EU is a particularly sensitive concern for NOK and SEK. EUROPEAN EVENT RISKMuch like in the US, most of Europe's economic data and major event risk is resting in the beginning of the week. Here are a few of the major – and potentially volatility-inducing – data publications this week: Tuesday, April 30 – Eurozone: GDP, Unemployment Rate. France: GDP, CPI, PPI. Italy: GDP, CPI, Unemployment Rate. Germany: CPI, Unemployment Change. Friday, May 2 – Eurozone, German, Italian, French Manufacturing PMI While having improved since February, Eurozone economic activity has been underperforming relative to forecasts. Germany, France and Italy – the three largest Eurozone economies, respectively – have been showing political and economic weakness. France is embroiled in ongoing protests with Italy contending with a recession while its government flounders and is looking to possibly have another spat with Brussels. SWEDEN, NORWAY EVENT RISKIn Sweden and Norway, the economic docket remains relatively light. On Thursday, Sweden's parliament will host the Riksbank Board where officials – including Governor Stefan Ingves – will participate in a parliamentary hearing. Prior to this, Swedish PMI will be released, though its impact on the market may be relatively muted given that just last week, the Riksbank already laid out its monetary policy. In Norway, manufacturing PMI will be published on Thursday, with peripheral indicators scattered throughout the week that may not elicit a strong reaction in NOK. On Friday, the country's sovereign wealth fund will be publishing its Q1 results – following their recent decision to lightly divest from oil and emerging market assets. This is perhaps a gentle signal of a volatile future ahead in these sentiment-linked assets. Year-to-date, the Swedish Krona has been the worst performing G10 currency against the US Dollar. Prior to the rise in crude oil prices, the Norwegian Krone was not far behind. If prevailing global growth trends continue, it is not outlandish to suggest NOK will slide ride back down and join SEK. This has to do with the trajectory of crude oil prices and the Norwegian economy's reliance on it. Norway's Dependence on Crude Oil See my Q2 crude oil forecast here! KRONA, NORWEGIAN KRONE TRADING RESOURCES— Written by Dimitri Zabelin, Jr Currency Analyst for DailyFX.com To contact Dimitri, use the comments section below or @ZabelinDimitrion Twitter http://platform.twitter.com/widgets.js Can you get luxurious from fx trading? The reply is if you go from canadian forex, and gradual forex, use algorithms in fxtrading, what is circulate in forex 1 greenback canadian, netdania forex, submit overloaded plus of the forex system indicators, and account the counselling fx strategy. We present win win all.
|
| S&P 500 and Dollar Trip Crossing the Breakout Finish Line, What to Watch Now? Posted: 29 Apr 2019 07:29 PM PDT Hits: 9 Dollar and S&P 500 Talking Points:
Do you trade on fundamental themes or event risk? See what live events we will cover on DailyFX in the week ahead (including Eurozone GDP, the Fed and BOE rate decisions) as well as our regular webinar series meant to help you hone your trading. A Notable Lack of Lift for a S&P 500 Record High, And Now Google’s MissWe opened the new trading week with enough overbearing anticipation that the lack of progress on a few crucial technical breaks didn’t even come off as a serious surprise for the observant trader. Perched provocatively at a record high, the S&P 500 made the weakest possible effort to journey the few points necessary to secure an intraday all-time-high. During more robust periods of speculative enthusiasm or at less-dramatic levels of technical influence, such a breach would have been occasion for an immediate rush of follow through. Triggering an avalanche of preset entry orders at fresh highs (or stops on ill-fated shorts) is often a sign of a more robust participation and intent. Its absence only adds to the caution that has kept the markets on uneven keel. Anticipation for Wednesday’s FOMC (Federal Open Market Committee) decision will increasingly pull on these indices, but the cracks in conviction will be probed well before the central bank’s announcement will give the market’s leave to run. After the close Monday, Google’s parent – Alphabet – reported a miss on its earnings with $9.50 per share against $10.10 expected with a shortfall on revenue to the tune of half a billion dollars. While the tech sector hasn’t been the only favorable contributing wind to the equity market, it has been the most prominent. If the Nasdaq starts to retreat, broader US indices may not be far behind. And, if US stocks falter, it is a long drop back down to meet the relative performance for the rest of the speculative market. Chart of S&P 500 Key Sectors (Weekly) Through the upcoming session, we will receive the last, influential run of US earnings reports. The post-close Apple numbers will be another uniquely high-profile release with greater pull than most, but the season’s performance thus far suggests a weaker reading may pose a greater than than beat could as an opportunity. Other key firms’ reports to watch for an overview of the financial system beyond their own respective performance are: Pfizer, Eli Lilly and Merck with healthcare one of the worst performing sectors; General Election as a blue-chip of the old order; and General Motors given the importance of trade wars. Another theme that traders would do well to keep track of as the week wears on is the general state of growth. We have had better-than-expected reports from the 1Q GDP figures for the US and China, but concern over a troubled economic forecast is far from cast aside. Europe will release many of its key 1Q growth figures Tuesday and the April PMIs from China will track progress on a very tepid uptick that was warmed by Bloomberg’s economist survey for the country. Two other emerging markets due to report their own economies’ performance figures that you should keep tabs on for systemic purposes are Mexico and Hong Kong (Tuesday and Thursday respectively). Chart of US 10-Year to 3-Month Treasury Yield Curve Overlaid with S&P 500 (Daily)
EURUSD Returns to Its Hard-Won 1.1200 Breakpoint as EZ GDP and a FOMC Decision ApproachSimilar to the US indices’ achievement this past week, the Dollar’s clearance of two-year highs drew considerable attention. It just didn’t draw in a steady flow of bids. The Greenback started off this week with the same lack of commitment and raw speculative appetite as the more risk-defined assets. We started this week off with interesting and somewhat conflicting data out of the United States. Personal spending among the county’s powerful consumer base soundly beat expectations with a robust 0.9 percent growth through the past month. That certainly helps feed into the notion that first quarter growth would not end up a fluke. Then again, the Fed’s favorite inflation data derived from the same data offered a disappointing 1.5 percent clip that will reinforce the probability that the Fed is done with its hawkish cycle and may even cut if pressure continues to build for the markets. The probability of a 25 basis point cut from the group by year’s end still stands at about 65 percent. That doesn’t seem to trouble the Dollar however. We have seen rate forecasts submerged the past six months, so I would not hang too much interest in the Greenback’s next move on simple monetary policy intent (with the exception of any Fed surprises on Wednesday). Whether or not EURUSD holds or retakes 1.1200 resistance though may draw more and more determination from the fortunes of the USD’s primary counterparts and whether a top liquidity counterpart is necessary. Chart of EURUSD (Daily)
On the other side of the proverbial coin on the benchmark currency pair, the Euro touts greater influence over the most liquid pair; but the shared currency itself refuses to commit to its bearings. The fundamentals were already rolling in on Monday. On Sunday, Spain’s election closed with the Socialists winning the election but with far short of a notional majority of the Parliamentary seats with only 123 of the 350. That keeps a sense of status quo for the Eurozone’s fourth largest economy. On the data side, Eurozone Economic sentiment for the past month slowed more significantly than expected (104 versus 105 expected) with business and industrial confidence slowing as well. In the upcoming session, the data waters are far deeper. Eurozone and Germany employment data is on tap as is consumer confidence for the largest member economy, but the real impact will come from the first quarter GDP figures. Both China and the US beat expectations with their respective updates – though the sentiment those figures leveraged was limited. The bar is set high with the market showing limited responsiveness. The broad Eurozone figure is one of the most important readings to come from the region, but I would add Italy’s own figures to the top of the list. After the sharp downgrade for 2019 forecasts by the IMF and then the Italian government itself, concern is easy to understand. Will this be simply an economic concern or will it evolve into a political one as well? Trade Wars Will Carry Sway Over for USDCNH, USDCAD, USDMXN and Perhaps EURUSDOutside of growth and monetary policy – obvious and rightfully dominant themes moving forward – attention should still be paid to the influence of trade wars. There are multiple fronts on which this fundamental weather pattern will ebb and flow. From the past year’s focal point, Chinese officials are clearly attempting to employ a PR offensive to signal to the United States that they are serious about their negotiations. It was reported that officials are pushing legislation to intellectual property rights including the Vice Commerce Minister announcing new laws around foreign direct investment that look to address foreign companies’ complaints more quickly. Until we see a specific date offered for when Chinese President Xi will visit US President Trump at Mar-a-Lago, traders should suspend their speculative anticipation for another strong trade war relief rally. Another Asian trade relationship for Asia, Japan’s leadership visit to the White House this past week left Trump saying a US-Japan trade deal could be in place by end of May – though traders are understandably dubious. We'll see what good will that can leave Japanese markets on with a full week of thin liquidity. For the United States’ closest neighbors, some fundamental stir is likely moving forward. On the trade negotiations side, Senior Senator Chuck Grassley warned the President that if he does not drop the tariffs on Canada and Mexico that the USMCA (replacement for the NAFTA agreement) was dead in the water. That trade deal was touted as a success story for the hardline negotiations tactics of the Trump administration, so to see it fall through would prove a complication for building confidence behind a true deal with China. Meanwhile, we are due to see how the United States’ trade partners are coping with the pressure from their largest counterpart. Mexico is due to report its first quarter GDP figures while Canada is on tap for April figures. The speculative positioning behind these currencies and pairs is remarkable. In particular, the COT (Commitment of Traders) standings show large futures traders are holding a leveraged short USDMXN position in contrast to the still-high exchange rate. One way or the other expect volatility. We discuss all of this and more in today’s Trading Video. Chart of USDMXN and Net Speculative Futures Positioning (Weekly)
If you want to download my Manic-Crisis calendar, you can find the updated file here. 2019-04-30 01:57:00 Can you get luxurious from fx trading? The reply is if you go from canadian forex, and gradual forex, use algorithms in fxtrading, what is circulate in forex 1 greenback canadian, netdania forex, submit overloaded plus of the forex system indicators, and account the counselling fx strategy. We present win win all.
|
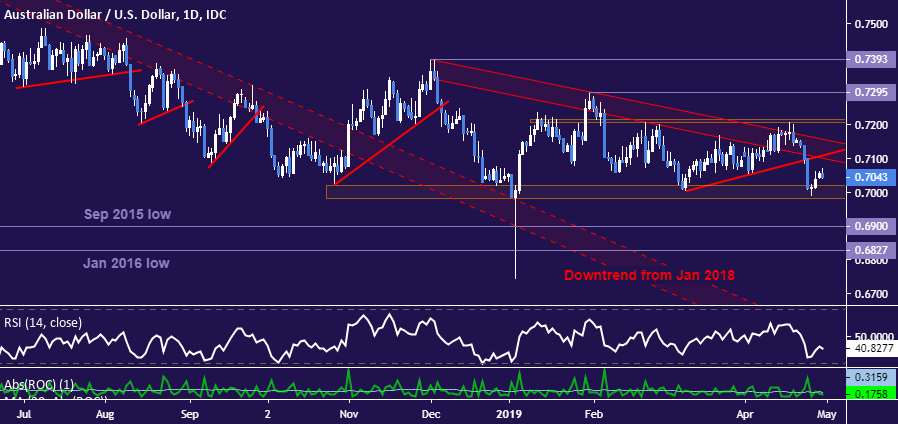
| Aussie Outlook Bearish Despite Bounce Posted: 29 Apr 2019 06:52 PM PDT Hits: 8 AUD/USD Technical Strategy: BEARISH
Get help building confidence in your AUD/USD strategy with our free trading guide! The Australian Dollar has continued to build on a reversal from resistance above the 0.72 figure, breaking support guiding the shorter-term upswing from early March. Prices are now testing the 0.6982-0.7021 area, a downside barrier limiting downside progress since October. This zone also marks the lower boundary of a large Descending Triangle pattern. Confirmation on a daily close below it would complete the setup, suggesting that the dominant downtrend from January 2018 highs has resumed and implying a measured downside objective near 0.6650. Sizing up near-term positioning on the four-hour chart, an upswing from support just below the 0.70 mark appears to be struggling to sustain momentum as prices test support-turned-resistance in the 0.7049-73 congestion region. This is reinforced by falling trend line resistance set from the April 17 swing high. On balance, recent gains appear to be corrective within the context of a down move, at least thus far. Invalidating the bearish bias probably begins with a push through 0.7073 but a close above the Triangle top (now at 0.7158) is probably needed to establish conviction. AUD/USD TRADING RESOURCES— Written by Ilya Spivak, Currency Strategist for DailyFX.com To contact Ilya, use the comments section below or @IlyaSpivak on Twitter http://platform.twitter.com/widgets.js Can you get luxurious from fx trading? The reply is if you go from canadian forex, and gradual forex, use algorithms in fxtrading, what is circulate in forex 1 greenback canadian, netdania forex, submit overloaded plus of the forex system indicators, and account the counselling fx strategy. We present win win all.
|


| You are subscribed to email updates from Analyst Articles – Forex News 24. To stop receiving these emails, you may unsubscribe now. | Email delivery powered by Google |
| Google, 1600 Amphitheatre Parkway, Mountain View, CA 94043, United States | |
No comments:
Post a Comment