
Analyst Articles – Forex News 24 |
- Oil Drops as Brent Crude Breaks Below 200DMA
- Recession Fears Hit Stocks, Boost US Treasuries, Other Safe Havens
- DAX 30 & CAC 40 Charts: Continued Weakness Looks Likely
- Still Looking to Fall Further
- EURUSD Rate Rebound Unravels Ahead of June ECB Meeting
- Gold Prices May Break Key Support as US Dollar Reclaims Haven Bid
- Dow Strains Support on a Reversal Pattern While Key FX Pairs Face Pressure
- Gold Price Could Climb as US Treasury Yield Plunges
- GBPUSD Currency Volatility Rises Alongside Brexit Turbulence
- Bitcoin Price Nears $9,000 as XRP Looks to Post Record Climb
| Oil Drops as Brent Crude Breaks Below 200DMA Posted: 29 May 2019 03:18 AM PDT Hits: 12 Oil Price Analysis and News
Risk Averse Environment Outweighing Supply Side RisksAfter posting the largest weekly drop in 2019, oil prices have extended on its losses amid the step up in trade war tensions sparking risk averse sentiment. Brent crude futures are down over 2% this morning with front month contract exacerbating losses after a breach below the 200DMA, which also coincided with the break of the $69/bbl level. Overnight, sentiment regarding trade tensions between the US and China did not appear to show notable signs of improving as reports emerged from China that they could potentially cut off rare earth exports to the US. Hedge Funds have Scaled Back Bullish Oil BetsIn light of the weaker economic environment, hedge funds have continued to scale back on their bullish positioning for Brent crude oil, which in turn has seen the ratio of long/short positions drop to 13:1 (Prev. 15.5:1). (COT Commodity report)
Backwardation May Put a Floor on Further LossesDespite the deteriorating economic outlook, fundamentally the Brent crude oil market remains tight with the 6-month spread in steep backwardation at $3.50, given that concerns over potential supply disruptions persist. As such, with this in mind, this could potentially curb further losses in Brent crude providing that the spread remains in steep backwardation.
What is Brent Crude Backwardation? Looking Ahead Moving forward, oil traders will look towards tonight's API crude inventory report, scheduled for release at 2130BST ahead of tomorrow's DoE crude report. Oil Impact on FX Net Oil Importers: These countries tend to be worse off when the price of oil rises. This includes, KRW, ZAR, INR, TRY, EUR, CNY, IDR, JPY Net Oil Exporters: These counties tend to benefit when the price of oil rises. This includes RUB, CAD, MXN, NOK. Recommended Reading What Traders Need to Know When Trading the Oil Market Important Difference Between WTI and Brent — Written by Justin McQueen, Market Analyst To contact Justin, email him at Justin.mcqueen@ig.com Follow Justin on Twitter @JMcQueenFX http://platform.twitter.com/widgets.js Can you get luxurious from fx trading? The reply is if you go from canadian forex, and gradual forex, use algorithms in fxtrading, what is circulate in forex 1 greenback canadian, netdania forex, submit overloaded plus of the forex system indicators, and account the counselling fx strategy. We present win win all.
|
| Recession Fears Hit Stocks, Boost US Treasuries, Other Safe Havens Posted: 29 May 2019 02:42 AM PDT Hits: 8 Risk aversion grips markets:
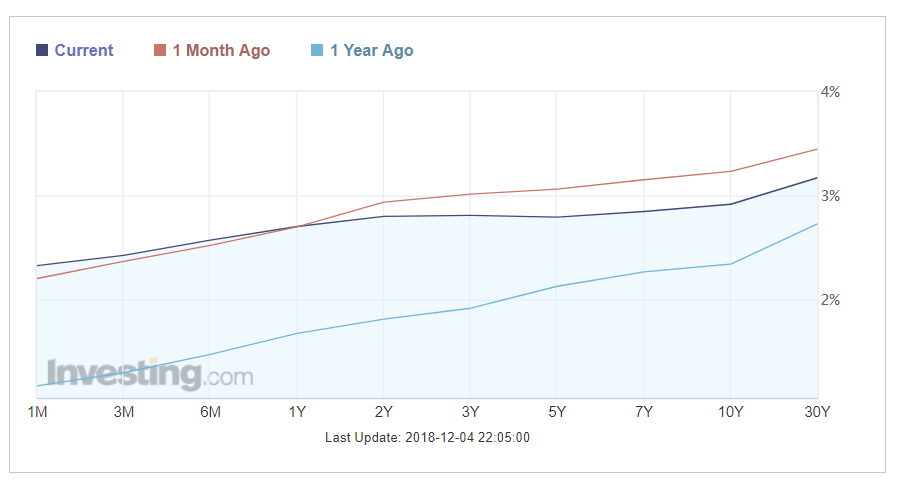
Stocks and Oil Prices Fall as Demand Rises for US TreasuriesA move away from stocks and other risky assets is strengthening as traders worry that the US-China trade war is already hitting global growth and could lead eventually to a worldwide recession. That is hitting oil prices too, as concerns grow that an economic slowdown could reduce demand. As a result, haven assets such as US Treasuries and German Bunds are attracting buyers, while talk is spreading that the Federal Reserve could cut US interest rates to boost its economy. In the Treasury market, the yield curve has again inverted – regarded by some as an early signal of recession – with the yield on three-year debt above the yield on 10-year notes, which has hit its lowest since September 2017. US Treasury Yield Curve (May 29, 2019)Source: Investing.com Why Does the US Yield Curve Inversion Matter? Against this background, talk of another rate cut by the US Federal Reserve is spreading, with the CME FedWatch Tool suggesting that a quarter-point reduction is more likely by the Fed's meeting on September 18 than an unchanged 2.25%-2.50%. US Target Rate Probabilities for September 18, 2019 Fed meeting
Source: CME By contrast, stock markets are weakening, with the FTSE 100 in London, the DAX in Frankfurt and the CAC 40 in Paris all down by between 1.0% and 1.50% by mid-morning Wednesday in Europe. The US crude oil price is sliding too on concern that demand will dry up even if output is cut by the major producers. Will the Stock Markets Crash in 2019? US Crude Oil Price Chart, 15-Minute Timeframe (May 28-29, 2019)
Chart by IG (You can click on it for a larger image) This latest bout of risk aversion follows local newspaper reports that China could restrict its sales to the US of "rare earths" – a group of 17 minerals used in sectors such as renewable energy, oil refining, electronics and the glass industry. In addition, Chinese technology company Huawei has filed a lawsuit against the US Government in an attempt to reverse sanctions on it, while the fallout from the European Parliament elections is spreading in countries such as Italy, Greece and Austria. Whether this move into safe havens will persist is an open question but for now it seems likely that more funds will flow not just into Treasuries and Bunds but also into haven currencies like the Japanese Yen, which continues to climb against the riskier British Pound and Euro. EURJPY Price Chart, Two-Hour Timeframe (April 11 – May 29, 2019)
Chart by IG (You can click on it for a larger image) A Guide to Safe-Haven Currencies and How to Trade Them Note though that gold is failing to benefit despite its traditional role as a bolt-hole when market sentiment turns sour. Gold Price Chart, One-Hour Timeframe (May 14-29, 2019)
Chart by IG (You can click on it for a larger image) How to Trade Gold: Top Gold Trading Strategies and Tips Resources to help you trade the forex markets:Whether you are a new or an experienced trader, at DailyFX we have many resources to help you: — Written by Martin Essex, Analyst and Editor Feel free to contact me via the comments section below, via email at martin.essex@ig.com or on Twitter @MartinSEssex http://platform.twitter.com/widgets.js Can you get luxurious from fx trading? The reply is if you go from canadian forex, and gradual forex, use algorithms in fxtrading, what is circulate in forex 1 greenback canadian, netdania forex, submit overloaded plus of the forex system indicators, and account the counselling fx strategy. We present win win all.
|
| DAX 30 & CAC 40 Charts: Continued Weakness Looks Likely Posted: 29 May 2019 02:07 AM PDT Hits: 2 DAX 30/CAC 40 Technical HighlightsCheck out the DailyFX Q2 Trading Forecasts to find out where our team of analysts see the Euro, DAX, and other markets are headed in the coming weeks. DAX breaking through December trend-lineThe DAX is currently trading below the trend-line from December. With a little more weakness price support around 11844 will also be broken, helping carve out a lower-low from May 13. This occurrence will be arriving after the May 16 lower-high relative to the monthly high. This creates a situation where you have not only an important trend-line broken, but also the first true bearish price sequence in place since the low to end last year. This is seen as potentially setting the market up for a broader decline. First up as support under 11844 is a gap-fill from April 2 at 11755, followed by the 200-day MA at 11617 which is in confluence with the lower parallel tied to the t-line running off the monthly high, another gap-fill at 11526, then the March low at 11300. DAX Daily Chart (December t-line broken)CAC 40 breaking neckline of H&S patternLast week, we looked at the possibility of a head-and-shoulders pattern coming into play, and as long as a close below the neckline takes shape today then the pattern will be validated. The 200-day is nearby at 5183 but may not present much support as it stands by itself and arrives shortly after an important pattern-break. The height of the pattern from head to neckline points to a ~350 decline from the neckline around the 5250-mark, or to around 4900. There aren't any real significant levels of support between here and there. CAC Daily Chart (H&S neckline breaking)
Want to learn more about trading the DAX? Check out 'How to Trade the DAX', and join me weekly for technical updates in the Indices and Commodities webinar. Forex & CFD Trader ResourcesWhether you are a new or experienced trader, we have several resources available to help you; indicator for tracking trader sentiment, quarterly trading forecasts, analytical and educational webinars held daily, trading guides to help you improve trading performance, and one specifically for those who are new to forex. —Written by Paul Robinson, Market Analyst You can follow Paul on Twitter at @PaulRobinsonFX http://platform.twitter.com/widgets.js Can you get luxurious from fx trading? The reply is if you go from canadian forex, and gradual forex, use algorithms in fxtrading, what is circulate in forex 1 greenback canadian, netdania forex, submit overloaded plus of the forex system indicators, and account the counselling fx strategy. We present win win all.
|
| Posted: 29 May 2019 01:30 AM PDT Hits: 8 EURUSD Price, Chart and Analysis:
Q2 2019 EUR Forecast and USD Top Trading Opportunities With little in the way of important Euro-Zone data this week, the EUR may well test the recent one-year low against the US dollar at just above 1.1100 and print yet another lower low. On the other side of the pair, the greenback is looking at some high-profile releases over the next couple of days and any better-than-expected prints may force EURUSD lower. Yesterday's US consumer confidence release beat expectations with ease – 134.1 vs 130.0 exp and 129.2 prior – boosting the USD back towards its two-year peak. Keep up to date with all key economic data and event releases via the DailyFX Economic Calendar The US dollar remains firm despite US Treasury yields falling to lows not seen since September 2017. Lower government bond yields normally weaken the currency, however the USD continues to attract a safe-haven bid as risk appetite continues to wane. The 10-year UST currently yields 2.236%, down from 3.23% in September 2018. The EURUSD chart remains bearish with an unbroken pattern of lower highs prominent since the start of January this year. The pair are now trading under all three moving averages, a bearish set-up, and a re-test of the recent 1.1107 low print remains likely. The CCI indictor shows the pair nearing oversold territory but it should be noted that EURUSD has been heavily oversold on five occasions this year, and twice very heavily. To the upside, the pair may struggle to break through congestion between 1.1176 and1.1216. EURUSD Daily Price Chart (August 2018 – May 29, 2019)
Retail traders are 58.8% net-long EURUSD according to the latest IG Client Sentiment Data, a bearish contrarian indicator. However recent daily and weekly positional changes give us a stronger contrarian bearish bias. We run several Trader Sentiment Webinars every week explaining how to use IG client sentiment data and positioning when looking at a trade set-up. Access the DailyFX Webinar Calendar to get all the times and links for a wide range of webinars. Traders may be interested in two of our trading guides – Traits of Successful Traders and Top Trading Lessons – while technical analysts are likely to be interested in our latest Elliott Wave Guide. What is your view on EURUSD – bullish or bearish? You can let us know via the form at the end of this piece or you can contact the author at nicholas.cawley@ig.comor via Twitter @nickcawley1. http://platform.twitter.com/widgets.js Can you get luxurious from fx trading? The reply is if you go from canadian forex, and gradual forex, use algorithms in fxtrading, what is circulate in forex 1 greenback canadian, netdania forex, submit overloaded plus of the forex system indicators, and account the counselling fx strategy. We present win win all.
|
| EURUSD Rate Rebound Unravels Ahead of June ECB Meeting Posted: 29 May 2019 12:19 AM PDT Hits: 1 EUR/USD pares the rebound from the monthly-low (1.1107) as European Central Bank (ECB) officials strike a dovish tone, and the Euro Dollar exchange rate may struggle to hold its ground ahead of the next meeting on June 6 as the Governing Council keeps the door open to further insulate the monetary union. Recent remarks from ECB board member Olli Rehn suggest the central bank will retain a dovish forward-guidance for monetary policy as the official warns that 'market participants may have in general lost their faith in central banks' ability to raise inflation closer to the target.' In turn, the ECB may continue to rely on non-standard measures as the central bank prepares to launch another round of Targeted Long-Term Refinance Operations (TLTRO) starting in September, and the Euro stands at risk of facing a more bearish fate over the coming days if Governing Council shows a greater willingness to implement a negative interest rate policy (NIRP). EUR/USD Rate Daily Chart
Keep in mind, the broader outlook for EUR/USD remains tilted to the downside as both price and the Relative Strength Index (RSI) continue to track the bearish formations from earlier this year, with the near-term outlook mired by the failed attempt to push back above the Fibonacci overlap around 1.1270 (50% expansion) to 1.1290 (61.8% expansion). More recently, EUR/USD has started to carve a series of higher highs & lows after struggling to hold above the 1.1190 (38.2% retracement) to 1.1220 (78.6% retracement) region, with a move back below 1.1140 (78.6% expansion) opening up the 1.1000 (78.6% expansion) handle. Sign up and join DailyFX Currency Analyst David Song LIVE for an opportunity to discuss potential trade setups. Additional Trading ResourcesFor more in-depth analysis, check out the 2Q 2019 Forecast for the Euro Are you looking to improve your trading approach? Review the 'Traits of a Successful Trader' series on how to effectively use leverage along with other best practices that any trader can follow. Want to know what other currency pairs the DailyFX team is watching? Download and review the Top Trading Opportunities for 2019. — Written by David Song, Currency Strategist Follow me on Twitter at @DavidJSong. 2019-05-29 06:50:00 Can you get luxurious from fx trading? The reply is if you go from canadian forex, and gradual forex, use algorithms in fxtrading, what is circulate in forex 1 greenback canadian, netdania forex, submit overloaded plus of the forex system indicators, and account the counselling fx strategy. We present win win all.
|
| Gold Prices May Break Key Support as US Dollar Reclaims Haven Bid Posted: 28 May 2019 11:43 PM PDT Hits: 9 GOLD & CRUDE OIL TALKING POINTS:
Gold prices turned lower despite would-be support from falling bond yields as the US Dollar reclaimed its haven appeal following a lapse last week, trading broadly higher as stocks retreated. Crude oil prices idled, with pressure from the broadly risk-off environment apparently offset amid supply concerns as heavy rain and flooding forced offline several key US pipelines and refineries. Looking ahead, a monetary policy announcement from the Bank of Canada is in focus. No changes in policy are expected but the accompanying commentary may shape global growth bets, particularly as recent data stokes worries about the spillover of global malaise into the heretofore resilient US economy. A downbeat tone may trigger another wave of risky asset liquidation. Bellwether S&P 500 futures are pointing conspicuously lower in late Asia Pacific trade, bolstering the case for risk aversion. Cycle-sensitive crude oil looks vulnerable in this scenario, although incoming API inventory flow data may muddy the waters somewhat. A modest 633k-barrel drawdown is expected. Gold will continue to weigh divergent cues from bonds and USD in the meanwhile. Did we get it right with our crude oil and gold forecasts? Get them here to find out! GOLD TECHNICAL ANALYSISGold prices remain wedged between resistance set from late February (1295.10) and a rising trend line guiding the move higher since mid-August 2018 (1273.21). A break higher exposes the 1303.70-09.12 area, whereas a breach of support targets the 1260.80-63.76 zone. CRUDE OIL TECHNICAL ANALYSISCrude oil prices remain pinned to support in the 57.24-88 area. A daily close below it opens the door for a test of the 55.37-75 zone. Alternatively, a push above support-turned-resistance in the 60.39-95 region sets the stage for a challenge of the 63.59-64.43 price band.
COMMODITY TRADING RESOURCES— Written by Ilya Spivak, Currency Strategist for DailyFX.com To contact Ilya, use the comments section below or @IlyaSpivak on Twitter http://platform.twitter.com/widgets.js Can you get luxurious from fx trading? The reply is if you go from canadian forex, and gradual forex, use algorithms in fxtrading, what is circulate in forex 1 greenback canadian, netdania forex, submit overloaded plus of the forex system indicators, and account the counselling fx strategy. We present win win all.
|
| Dow Strains Support on a Reversal Pattern While Key FX Pairs Face Pressure Posted: 28 May 2019 06:10 PM PDT Hits: 14 Risk Trends Talking Points:
See what live coverage is scheduled to cover key event risk for the FX and capital markets on the DailyFX Webinar Calendar. A Return of Liquidity and the Staging of More Speculative ThreatsThe US and UK markets were back online following an extended holiday weekend. Speculative tempo certainly picked up Tuesday alongside volumes, but the deeper liquidity wouldn’t resolve the convenient ignorance to systemic fundamental threats nor the tense technical patterns that have formed on some key benchmarks for the global markets. Following an opening gap higher for many of the weather beacons across the globe, risk assets took a noticeable and uniform dive through the end of Tuesday’s trading session. There were varying degrees of pressure behind the bearish intent on the day, but it would show clearly throughout the system via global shares (ACWI), emerging markets (EEM), commodities, yields and carry trade (USDJPY). While the level of loaded premium for most of these milestones is not nearly as high as US indices, there is still a clear risk of further losses moving forward if properly prompted. And, while we should absolutely monitor the fundamental charges, it is important not to write off the impact that a technical ‘accident’ can incur. With benchmarks like the DAX German equity index working its way into a ‘break of necessity’, these developments can act as a sheer speculative spark should the tinder be dry enough. Chart of DAX Index (Daily) As many interesting technical patterns as there are out there, the most potent in my estimation of the market’s standing is to be found in the benchmark US equity indices. The Dow Jones Industrial Average and S&P 500 have carved out overt head-and-shoulders patterns. These are traditionally reversal chart figures. That is not to say that the markets must turn simply because there is price action that looks close to what we can find in the textbooks, but it suggests the proper staging should the other elements align. The high, higher high and lower high is the least important aspect of this formation. The ‘neckline’ support being so overt at 25,200 for the Dow and 2,800 on the S&P 500 are more material. Further, this consolidation pattern has established itself for the latter in the midst of failing to make progress on short-lived record high drive. Far more material is the lead in to the congestion. So much focus is put on the H&S pattern itself, but the critical part is the clear trend that precedes it. The more aggressive – faster and longer – the drive is, the more likely it is to stoke misalignment and a contrarian reversal. The 1Q rally was a charged reversal of the preceding quarter’s losses and clearly sets the stage for a more dedicated tumble. Further context outside the clarity of these leading benchmarks’ patterns and the ubiquity of a sentiment theme across assets is the loaded fundamental state. Overlooking trouble or proactively trying to fight it is far harder to do when all of these factors come together. Chart of Dow Jones Industrial Average (Daily)
Trade Wars, Political Fissures and Recession Warnings Pick UpFor fundamental drum beats, there are many of the familiar baselines that we have heard over the past months. Top billing remains trade wars – particularly between the United States and China. Though we haven’t seen an increase in their respective tariff lists or the rate at which they are taxing goods at the border, the mood has clearly continued to deteriorate. President Trump in Japan said they are not ready to make a deal with China while a Xinhua story made clear that America’s demands were contradictory to their “core interests”, which is to say they will not budge on key issues. Meanwhile, the talk of Apple as a course of retaliation eased to the backdrop while and there were far more stories about why China wouldn’t use Treasuries as a tool, but a new track of speculation is that the country may use its holdings of US equities to exert pressure. USDCNH put in for its first advance in six trading days while the FXI and Shanghai Composite continue to paint disparate pictures of the pressure on the country’s markets. News that China seized its first bank in two decades and industrial profits dropped 3.7 percent last month add to concern already stoked by the growing list of reports reflecting a higher bill for Americans as the war continues. Chart of FXI China ETF and Shanghai Composite in Red (Daily)
Political risk was another news-directed theme to kick off the trading week. Of course, we are still dealing with the barbs traded between the United States and Iran along with a few other newsworthy fronts, but the real development was in Europe’s landscape. The EU Parliamentary elections through Sunday confirmed the populist/nationalist gains that were projected in opinion polls and through previous, isolated votes in other areas around the world. While the most overt anti-EU parties didn’t gain as much traction as was hoped/feared, there was a notable shift away from the center-right and center-left parties – those groups more likely to find compromise. The long-term risks to the Euro’s stability pushed to the side for a moment, this is a global concern as the capacity for the world’s governments to work together should conditions warrant – or even demand – it is as troubled as we have seen it in some time. Let’s just hope there isn’t a crisis to put this ‘my country first’ mentality to the test. If there were a critical trial for the world’s health against a backdrop of questionable collaboration, it would likely come through traditional economic pain. Growth concerns were clearly on the mind between the stories of the US and China struggling under the trade war, but the report from Fitch Ratings on the threat posed by the global slowdown in the auto market puts a more defined face on the outlet for trouble. And, proving there is a chart for everything, the US 10-year to 3-month yield spread was again floating up to the top of the market headlines Tuesday when the spread’s inversion dove to its lowest point (-0.09 percent or 9 basis points) in a decade. That doesn’t make a recession any more certain, but it sure does call a lot of attention to a market where record high equities dramatically contrasts to the questionable fundamental backdrop. Chart of US 10-Year and 3-Month Treasury Yield Spread (Daily)
The Vague Risks in Euro and Pound Contrast the Distinct Volatility Even for the Canadian DollarLooking to specific regional and asset risks, there are plenty of ambiguous backdrops that make for difficult trading conditions moving forward. The Dollar is perhaps one of the more difficult currencies to draw a line on. Clearly the world’s most liquid currency is deviating from its haven role as implied volatility is holding back and the implied yield forecast from Fed Funds futures are at their lowest levels since December 2017. Where is it garnering its traction – proximity to two-year highs? The struggle of its principle counterparts. The Euro is more oppressive with its fundamental backdrop, but even that is murky. The EU Parliamentary elections are more of an existential but distant threat to the currency’s ‘number two reserve’ status. The tension brought on by Italy’s fiscal clash with the European Community is a little more pointed. Deputy Prime Minister Salvini warned this past session that the EC could potentially hit the country with a fine up to 3 billion euros for its refusal to comply to budget limits. Watch the Italian-German yield spread on this point. Chart of Italian-German 10-Year Yield Spread with Opening Gaps and EURUSD in Red (Daily)
The Sterling is another currency that is feeding Dollar appetite through its own sacrifice. The outcome from the EU elections left the UK with a strong Brexit Party win, impressive considering the party only recently came into existence through the frustration from the ruling parties. Add that to the jostling to replace Theresa May as the head of the Conservative Party (and PM) on June 7th by preaching a greater willingness to use the ‘no deal’ option, and it is reasonable to expect the Pound to remain under pressure – though not constantly. For a less disconnected fundamental picture (and certainly a contrast to the external guides for influence), the Canadian Dollar is going to carry a very loaded combination of circumstances over the coming 24 hours. In terms of current conditions, the USDCAD has carved out one of its most inactive periods of trade in recent history. The 20-day average true range (ATR) is the lowest since the extreme Summer of 2014. Even more exceptional is the fact that the historical range on the pair over that same one-trading-month period established the smallest trading area going back to 1997. These are prime conditions for a break and the proper catalyst could do some serious damage here. How about the Bank of Canada rate decision on tap Wednesday? Another atypical area of the market to highlight is the precious metals. Rather than reflect more on Gold’s moderate capitulation to the Dollar as a pricing interest, consider the incredible climb in the Gold-Silver ratio which is scaling heights we have not seen since March 1993. We discuss all of this and more in today’s Trading Video. Chart of USDCAD and 20-Day Historical Range (Daily)
If you want to download my Manic-Crisis calendar, you can find the updated file here. 2019-05-29 00:05:00 Can you get luxurious from fx trading? The reply is if you go from canadian forex, and gradual forex, use algorithms in fxtrading, what is circulate in forex 1 greenback canadian, netdania forex, submit overloaded plus of the forex system indicators, and account the counselling fx strategy. We present win win all.
|
| Gold Price Could Climb as US Treasury Yield Plunges Posted: 28 May 2019 03:44 PM PDT Hits: 13 GOLD PRICE – TALKING POINTS
Spot gold slipped roughly half a percent during Tuesday's trading session to close at $1,279 as commodity traders continue to wrestle over the shiny metal's next direction. The small stumble in XAUUSD could be explained by broad-based strength in the US Dollar and reports of weak inflation expectations. Gold prices could catch a bid in the near future, however, considering signals sent by the US bond market regarding demand for safe-havens. GOLD PRICE CHART: DAILY TIME FRAME (DECEMBER 28, 2018 TO MAY 28, 2019)A sizable disconnect between spot gold and long-term interest rates emerged since mid-April and the gap between XAUUSD and US10YR appears to have only widened. With the 10-Year Treasury yield now taking a nosedive to 2.27 percent – its lowest reading since September 2017 – appetite for risk continues to wane in response to mounting US China Trade War risk and slowing global growth concerns. Yet gold bulls have shied away from the commodity as of late, likely in response to a damaged technical picture judging by the short-term bearish downtrend formed from the series of lower highs after prices peaked near $1,340 earlier this year. But, the slide lower looks to have found technical support as XAUUSD bases around the $1,275 price level with spot gold threatening to rise once again alongside investor demand for safe-havens. As the longer-term bullish uptrend line drawn from the August 2018 low continues to hold in addition to the 38.2 percent Fibonacci retracement area, spot gold has potential to quickly target and reclaim the psychologically-important $1,300 price level as the US10YR rate holds multi-year lows. – Written by Rich Dvorak, Junior Analyst for DailyFX – Follow @RichDvorakFX on Twitter http://platform.twitter.com/widgets.js Can you get luxurious from fx trading? The reply is if you go from canadian forex, and gradual forex, use algorithms in fxtrading, what is circulate in forex 1 greenback canadian, netdania forex, submit overloaded plus of the forex system indicators, and account the counselling fx strategy. We present win win all.
|
| GBPUSD Currency Volatility Rises Alongside Brexit Turbulence Posted: 28 May 2019 01:52 PM PDT Hits: 19 GBPUSD CURRENCY VOLATILITY – TALKING POINTS
Forex option traders are pricing higher odds that the Pound Sterling could come under pressure according to rising implied volatility and declining risk reversal measures. Spot GBPUSD has slid 16 out of the last 19 trading sessions as mounting Brexit uncertainty further clouds the market's outlook on the British Pound. Over the last month, cross-party talks between Tory Prime Minister Theresa May and Labour Party Leader Jeremy Corbyn came to a screeching halt and reignited concerns over the ongoing gridlock in Parliament. With no sign of success or clear direction on Brexit, PM Theresa May announced plans to resign last week as calls for her to step down grew louder. Now, speculation grows over who will take over has successor after PM May steps down on June 7. GBPUSD IMPLIED VOLATILITY AND RISK REVERSAL (6-MONTH OPTION CONTRACT)
Heighted uncertainty surrounding the likelihood that the UK will leave the EU with a deal by the October 31 departure date has only escalated after the stunning victory by Nigel Farage's Brexit Party in the European Parliamentary elections. Consequently, GBPUSD implied volatility is on the rise once more and could indicate weakness ahead for the cable. This is further suggested by currency option traders demanding additional downside protection with risk reversal readings plummeting once again. GBPUSD PRICE CHART: WEEKLY TIME FRAME (FEBRUARY 28, 2016 TO MAY 28, 2019)
According to the derived implied volatility reading of 9.18 percent, GBPUSD is estimated to range between 1.1851 and 1.3495 over the next 6-months with a 68 percent statistical probability. The Sterling's recent string of losses has pushed spot GBPUSD towards technical support near the 1.2500 handle, which could provide the British Pound with a level of buoyancy. Although, if rates fall below this level with the bullish uptrend line and 23.6 percent Fibonacci retracement failing to bolster prices, a clear bearish bias could emerge and quickly push GBPUSD towards 1.2000. This outcome could be driven by currency traders pricing in greater odds of no-deal Brexit. As such, forex market participants will likely focus their attention on who will replace Theresa May as Prime Minister for clues on which Brexit path the UK will be steered down next. GBPUSD TRADER SENTIMENT: DAILY TIME FRAME (NOVEMBER 29, 2018 TO MAY 28, 2019)
GBPUSD traders remain bullish, however, as IG client positioning data shows that 79.8 percent of retail CFD traders hold net-long positions resulting in a ratio of 3.95 longs-to-shorts. In fact, GBPUSD traders have remained net-long since May 06 when spot rates traded near 1.31714 – prices has moved 3.9 percent lower since then. Looking at trader sentiment data with a contrarian lens, spot GBPUSD could continue to fall considering bullish crowd positioning. – Written by Rich Dvorak, Junior Analyst for DailyFX – Follow @RichDvorakFX on Twitter http://platform.twitter.com/widgets.js Can you get luxurious from fx trading? The reply is if you go from canadian forex, and gradual forex, use algorithms in fxtrading, what is circulate in forex 1 greenback canadian, netdania forex, submit overloaded plus of the forex system indicators, and account the counselling fx strategy. We present win win all.
|
| Bitcoin Price Nears $9,000 as XRP Looks to Post Record Climb Posted: 28 May 2019 01:14 PM PDT Hits: 21 Bitcoin, XRP Price Outlook:
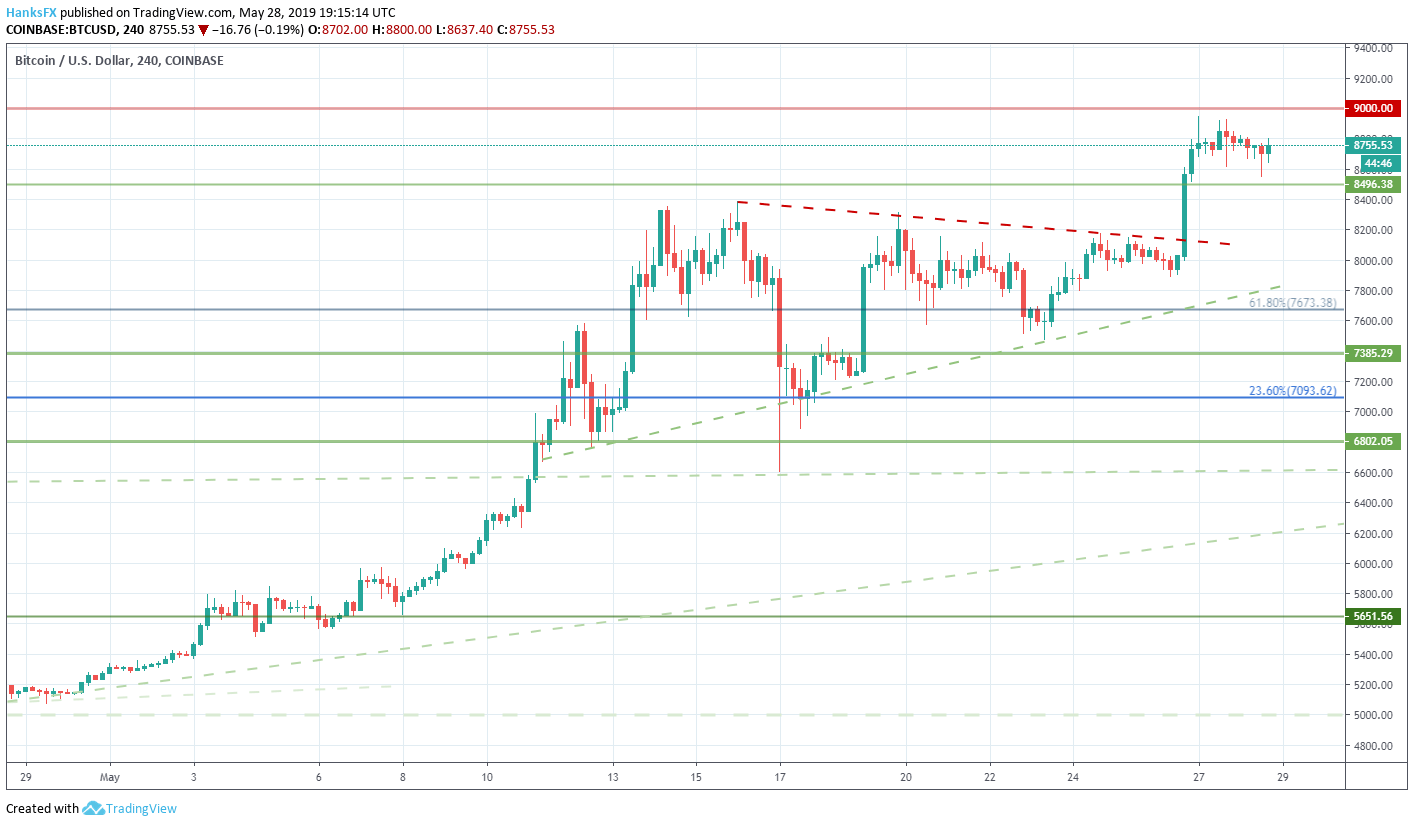
Bitcoin Price Nears $9,000 as XRP Looks to Post Record ClimbBitcoin extended its recent rally during Memorial Day weekend in the United States, touching fresh yearly highs and grasping at $9,000. The largest cryptocurrency by market capitalization has traded below $9,000 since May 11, 2018 and a topside breakout over the weekend spurred the coin near the psychological level. While $10,000 commands more respect in this regard, bears may still give pause before they allow the coin over $9,000. Should the level be surpassed, secondary resistance will be offered around $9,545 – the 38.2% Fib retracement from December 2017 highs to December 2018 lows. In the year-to-date, Bitcoin is 128% higher. A run to the 38.2% level would mark a climb of 150%. Bitcoin Price Chart: 4 – Hour Time Frame (May 2019) (Chart 1)For support, BTC will look to the swing-high from July 2018 – around $8,496. The level should provide a modicum of support, marking the first level to watch before the upper-bound of the recent wedge comes into play between $8,200 and $8,000. Bitcoin Price Chart: Daily Time Frame (February 2018 – May 2019) (Chart 2)
XRP Price OutlookConversely, XRP is just 21% higher in the year-to-date after enjoying a surge of more than 40% in the last two weeks. Continuing recent strength, XRP has climbed for six consecutive trading sessions which ties the coin's longest streak ever. That said, another daily close higher on Wednesday would post a new record for the third-largest cryptocurrency by market cap. XRP Price Chart: Daily Time Frame (May 2017 – May 2019) (Chart 3)
Price data from Bitfinex and TradingView Standing in its way is the 61.8% Fib level, around $0.4560, marked by August 2018 lows to September 2018 highs. The technical level has rebuked the last five attempted moves higher – with XRP unable to sustain a daily close above each time. Another failed run drive XRP back down to the 78.6% level at $0.3643 which has provided notable buoyancy for the coin over the last two weeks. XRP Price Chart: Daily Time Frame (October 2018 – May 2019) (Chart 4)
Should recent trends persist, the cryptocurrency market may continue to enjoy a tailwind from weakening emerging market currencies. The correlation between the two has strengthened in recent weeks as crypto becomes an attractive alternative for citizens in countries where the currency has shed value. As price action unfolds, follow @PeterHanksFX on Twitter for updates and technical levels on BTC and XRP. –Written by Peter Hanks, Junior Analyst for DailyFX.com Contact and follow Peter on Twitter @PeterHanksFX Read more: Dow Jones, S&P 500, Nasdaq 100 Price Outlooks for the Week Ahead DailyFX forecasts on a variety of currencies such as the US Dollar or the Euro are available from the DailyFX Trading Guides page. If you're looking to improve your trading approach, check out Traits of Successful Traders. And if you're looking for an introductory primer to the Forex market, check out our New to FX Guide. http://platform.twitter.com/widgets.js Can you get luxurious from fx trading? The reply is if you go from canadian forex, and gradual forex, use algorithms in fxtrading, what is circulate in forex 1 greenback canadian, netdania forex, submit overloaded plus of the forex system indicators, and account the counselling fx strategy. We present win win all.
|


| You are subscribed to email updates from Analyst Articles – Forex News 24. To stop receiving these emails, you may unsubscribe now. | Email delivery powered by Google |
| Google, 1600 Amphitheatre Parkway, Mountain View, CA 94043, United States | |
No comments:
Post a Comment