
TradingTips.com |
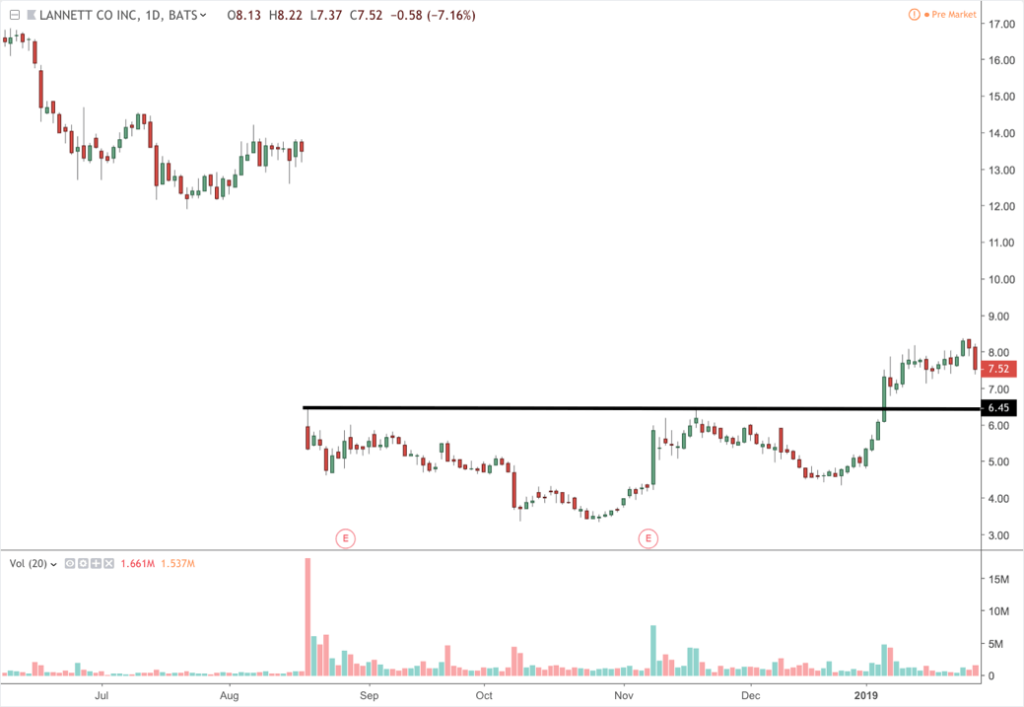
| Posted: 06 May 2019 02:53 AM PDT Lower priced stocks are known for their significant upside potential. Often times they are smaller capitalization companies or companies that have lost significant value. In this report we've picked 10 stocks under $10 that are currently showing technical strength, are attractively valued and provide adequate liquidity to trade. 1. Lannett Company, Inc. (LCI)Price: $ 7.52 Lannett Company, Inc. develops, manufactures, markets and distributes generic versions of brand pharmaceutical products. It was founded in 1942 and is based in Philadelphia, Pennsylvania. ValuationPrice-to-Book (P/B): 0.92 Over the past year, LCI has lost significant value as it has posted unusually large expenses. As a result, the price has fallen to a point where the stock price is trading below the book value of the company. The median book value over the last 13 years for LCI has been 1.49, which would require over a 60% advance in the stock to reach that valuation. The P/S ratio is also trading below 1 and over the past 13 years the median P/S ratio is 1.28. If LCI were to return to historical P/S levels it would require nearly a 300% return on the stock from its current price. Because of the larger expenses, the current EV/EBITDA ratio is negative, but the company is posting positive non-GAAP earnings that strips out nonrecurring expenses. Technical PictureSince the significant gap lower on August 20, 2018, the price has been fairly stable and has held its recent trading range over the next two earnings announcements. On January 7, 2019 the price was able to break a key resistance area near $6.45 on significant volume. That advance followed the retest of the $6.50 resistance following its November earnings report in which it surged on significant volume as well. The breakout above that level is an indication that the price will fill the August gap to trade around $13. The higher volume is reflective of money coming into the stock as well as shorts covering their positions. As of January 14, 2019, the short interest is at 54.51% of the float and would require 8.83 days to cover based on its average volume. The size of the short interest is a positive for the stock as traders will have to buy the shares back to cover their short position. The size of the short position provides the potential for a significant short squeeze in which shares surge higher.
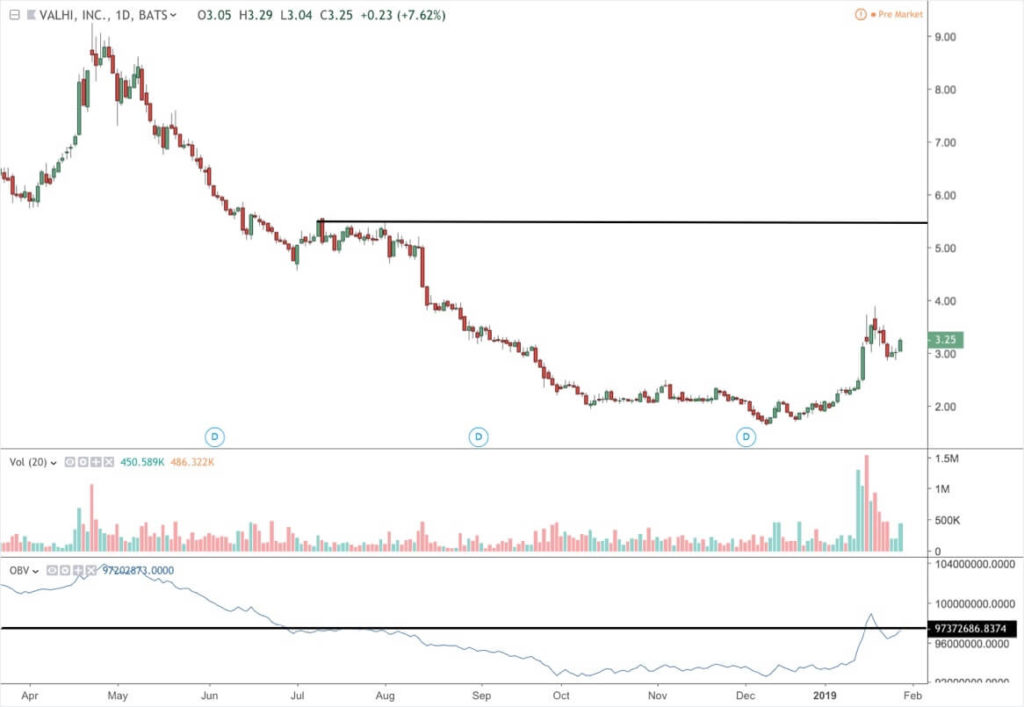
2. Valhi Inc. (VHI)Price: $ 3.25 Valhi, Inc. is a holding company. The Company operates through three segments: Chemicals, Component Products, and Real Estate Management and Development. The company was founded in 1932 and is based in Dallas, Texas. Valhi, Inc. is a subsidiary of Contran Corporation. ValuationEnterprise Value to EBITDA (EV/EBITDA): 3.92 The valuation metrics for VHI are very low relative to its historical averages. It is also generating strong return on assets (ROA) of 13.27% and return on equity (ROE) of 80.51%. Part of the reason for the disparity between ROA and ROE is the significant leverage that the company carries. As a result of the high debt, the book value is negative. However, the leverage also allows for more potential movement in the price of the stock. The current P/S ratio of 0.61 is below it's the median value of 1.12 over the past 13 years. Also, the current EV/EBITDA of 3.92 is considerably below the median value of 16.70 over the past 13 years. If the price were to return to median valuations, that would indicate a potential moves in the price of the stock of 65% and over 400% respectively. Technical PictureSince early October, the price of VHI had been forming a base that it broke out of on January 15. Since that breakout, the average volume has over doubled as the price surged from around $2.3 to near $4. The degree of movement and the on-balance volume (OBV) would indicate the near-term potential to retest the July trading range around $5. A similar breakout in 2017 caused the price to trade over $7 before consolidating for several months and then advancing to over $9.
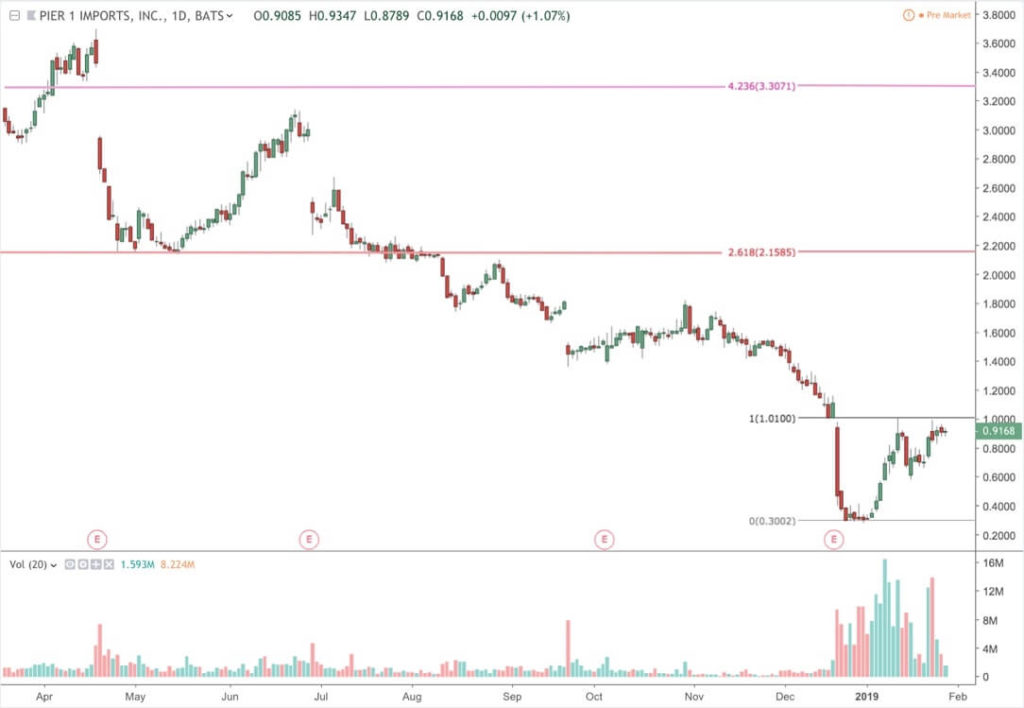
3. Pier 1 Imports, Inc. (PIR)Price: $ 0.91 Pier 1 Imports, Inc. is an importer of home decor and furniture. The Company’s operations consist of retail stores and an e-commerce Website conducting business under the name Pier 1 Imports, which sells a range of decorative accessories, furniture, candles, housewares, gifts and seasonal products. The company was founded in 1962 and is headquartered in Fort Worth, Texas. ValuationPrice-to-Book (P/B): 0.51 PIR is in the midst of a 3-year turnaround plan in which it intended to update stores and grow its e-commerce business. Those additional costs along with having to discount merchandise has caused the price to fall on hard times and the earnings to fall into negative territory. However, recent trends in foot traffic and search interest has begun to allow this stock to look up. The current P/B ratio of 0.51 is well below its 13-year median of 2.63. Also, the P/S of 0.04 is significantly below its 13-year median value of 0.49. If the price were to trade at those levels it would indicate potential moves of 374% and over 1200% respectively. That type of movement would indicate that their turnaround efforts would be successful but even lesser success could yield large returns in the stock. Technical PictureAfter bottoming recently near $0.28, PIR has rallied to nearly $1 on significant volume. The 20-day average volume has gone from over 600K to over 8 million. Following the pullback on January 15, 2019 the price has again retested the $1 resistance area. Based on the initial movement off of the lows, the intermediate potential for PIR is between $2 to $3.50. Those values align with the 261.8% and 423.6% projections.
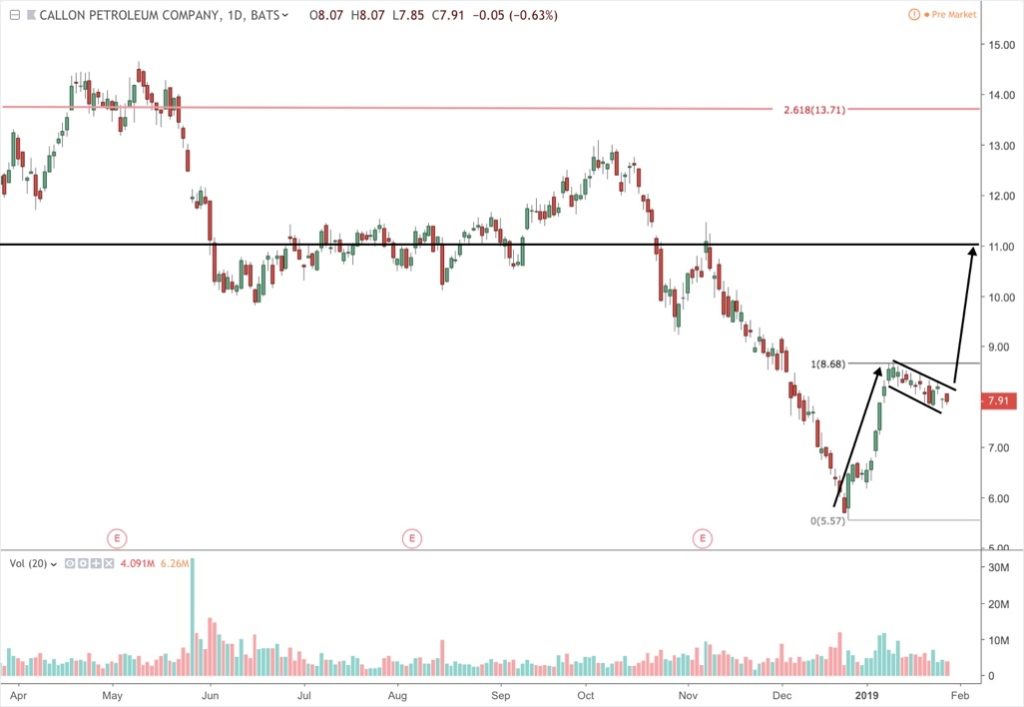
4. Callon Petroleum Co. (CPE)Price: $ 7.91 Callon Petroleum Company is an independent oil and natural gas company. The Company is engaged in the exploration, development, acquisition and production of oil and natural gas properties. The company was founded in 1950 and is headquartered in Natchez, Mississippi. ValuationPrice-to-Book (P/B): 0.79 The price of CPE fell with the price of oil and natural gas, but prices have recently begun to stabilize. As a result, the valuations have come down for CPE and has brought the company's P/S and EV/EBITDA back into alignment with its median levels historically. Currently, the company is trading below book value at 0.79 and is below the 13-year median level of 1.24. If the price began to trade at that level it would require over a 50% gain in the price of the stock. Since the other valuation measures are earnings based, an increase in the price of oil and natural gas or an increase in margins will allow those measures to make the stock an even better value. Technical PictureCPE is currently forming a flag formation as continues to trade in a tight downward sloping channel since its January 10, 2019 high of $8.68. A breakout from this channel on expanding volume would be confirmation of this pattern with a potential target at just over $11. The support for this pattern is increased due to the strong, straight-line move that occurred off of its December low. The 261.8% Fib projection, based on the initial move, would indicate a potential intermediate term target for this stock at nearly $14.
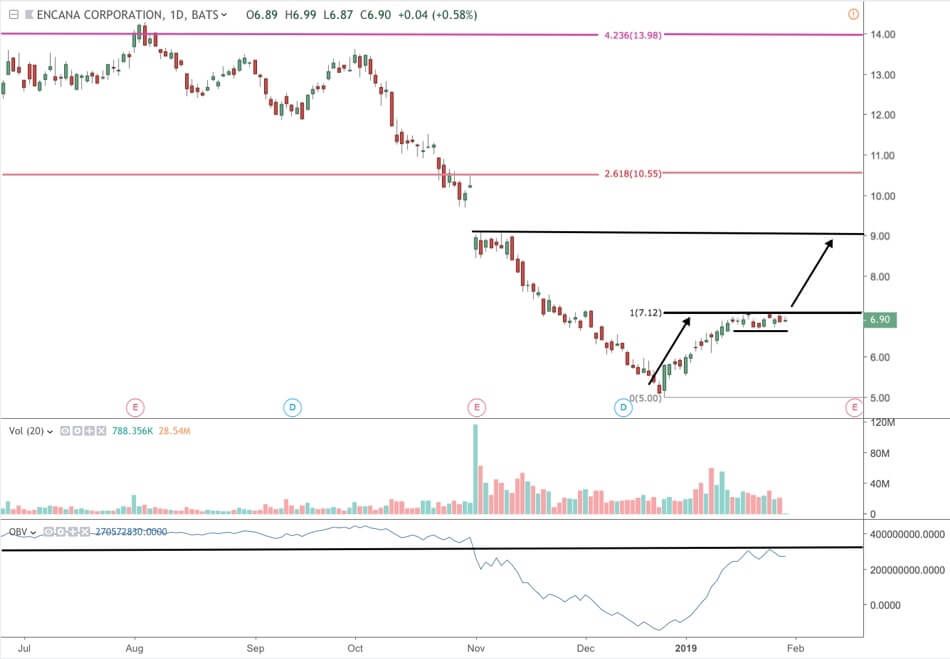
5. Encana Corporation (ECA)Price: $ 6.86 Encana Corporation, together with its subsidiaries, engages in the exploration, development, production, and marketing of natural gas, oil, and natural gas liquids. Encana Corporation was founded in 1971 and is headquartered in Calgary, Canada. ValuationPrice-to-Book (P/B): 1.02 Similar to CPE, the price of ECA fell with the price of oil and natural gas, but prices have recently begun to stabilize as the price recently rallied from $5. The company is also engaged in the production of liquid natural gas, which has a large potential export market in Europe. The valuations have come down considerably and has allowed the EV/EBITDA to trade close to its 13-year average and below a typically value-oriented level below 10. The P/B ratio is at 1.04 and is well below its 13-year median value of 1.47. Also, the P/S ratio of 1.39 is well below its median value of 2.15. If the price were to return to these historical levels it would indicate a potential move of over 45% and 54% respectively. Technical PictureECA declined from around $14 to $5 with the drop in oil prices at the end of last year. The trend accelerated following the earnings on November 1 when they missed earnings estimates by $0.10. Since that announcement, the volume has increased tremendously and picked up with its most recent rally. As a result, the on-balance volume (OBV) has nearly recovered back to its November levels when the price was trading at over $9. Right now, the price is trading in a potential flag pattern as well, with a target, based on the initial move from $5 to $7. That pattern would be confirmed with a breakout above $7 on increased volume. The 261.8% and 423% Fib projection, based on the initial move, would provide an intermediate term target of $10.55 and nearly $14 respectively.
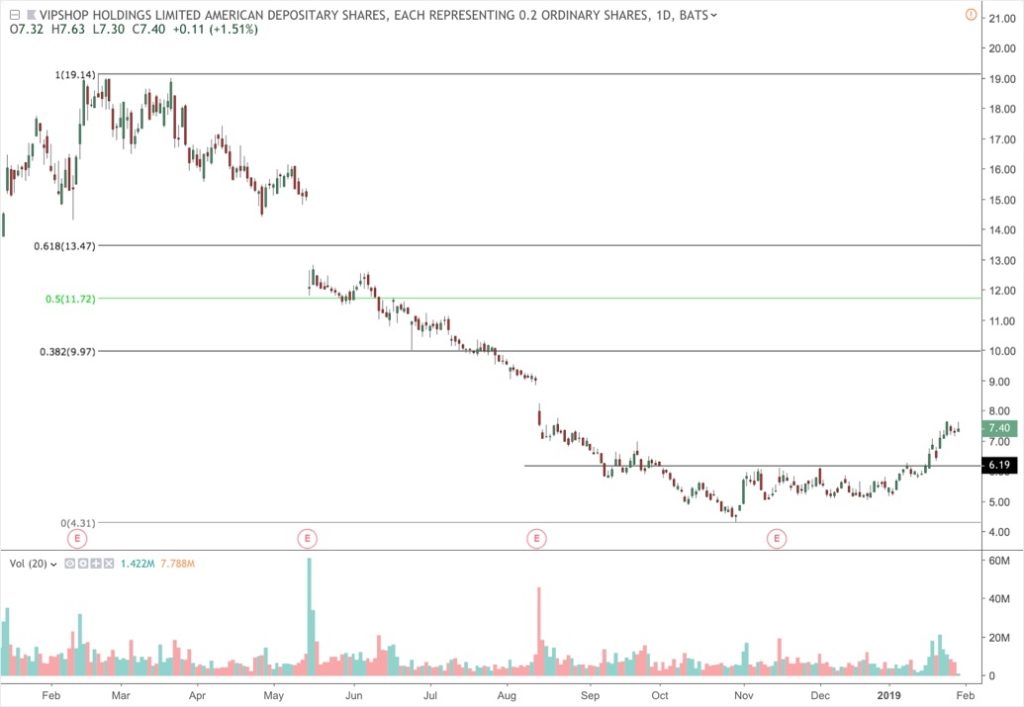
6. Vipshop Holdings Limited (VIPS)Price: $ 7.52 Vipshop Holdings Limited is a holding company. The Company is an online discount retailer for brands in China. The Company offers branded products to consumers in China through flash sales mainly on its vip.com website. It was founded in 2008 and is headquartered in Guangzhou, the People’s Republic of China. ValuationPrice-to-Book (P/B): 2.01 With the recent slowdown in China, VIPS has felt the strain as it has fallen significantly from it 2018 high of around $19. Over the past year, VIPS has missed earnings estimates twice. The most recent miss occurred during its November earnings report. Following that report, the price gapped up slightly near $6, which it recently broke out of. That reaction is a potential indication that the negative outlook may be priced into the stock. The current P/B ratio of 2.01 is well below its 9-year median value of 10.80. Also, the current P/S ratio of 0.40 is also below its 9-year median value of 1.18. The EV/EBITDA of 11.15 is over half of its 9-year median value of 23.10. While it may be difficult for VIPS to return to some of those higher valuations given the slowdown happening in china, there is a certainly an indication that it may restore some of that value. If the P/S ratio were to trade at one times sales it would be over a 100% increase from its current price. Technical PictureVIPS broke out of a key resistance area near $6 on January 17 with substantial volume. The projection, based on the basing formation indicates a retest of the gap level from August 14, 2018 near $8.20. A break of that level would indicate that the price will likely fill the gap and potentially test its Fib 38.2% and 61.8% retracement levels between $10 and $13.50.
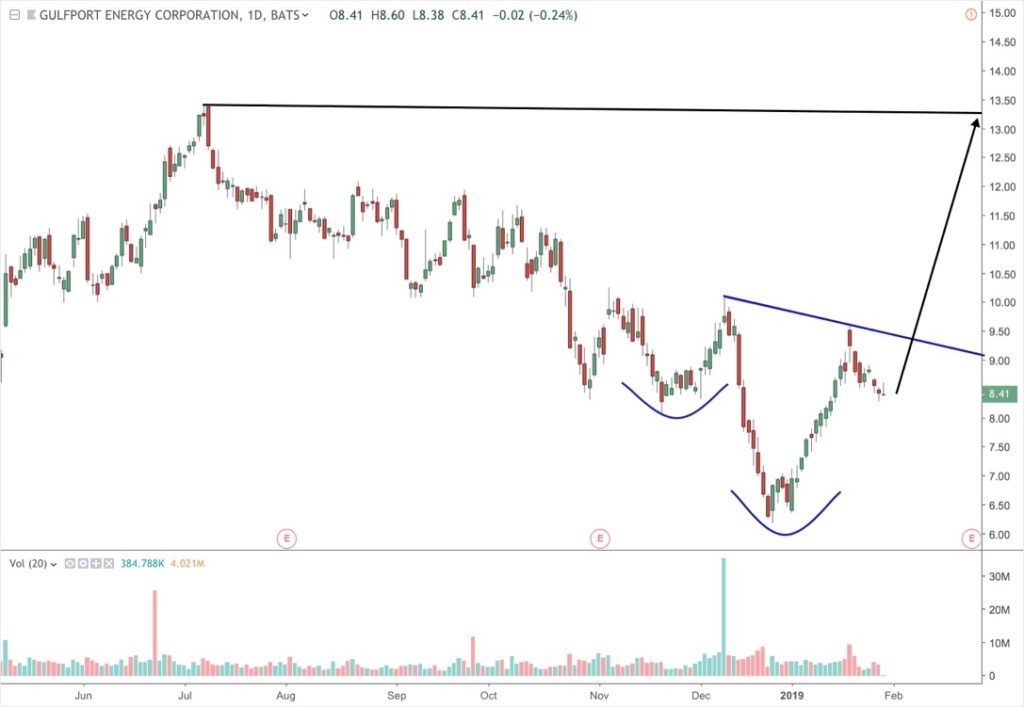
7. Gulfport Energy Corporation (GPOR)Price: $8.42 Gulfport Energy Corporation is an oil and natural gas exploration and production company. The Company focuses on the exploitation and acquisition of natural gas, natural gas liquids and crude oil in the United States. The company was founded in 1997 and is headquartered in Oklahoma City, Oklahoma. ValuationPrice-to-Book (P/B): 0.45 GPOR is in a similar business as ECA but operates in a different location that has historically been a lower cost area to produce. Over the past 13 years, the median P/B value is 2.04 which is over four times the current value of 0.45. Similarly, the 13-year median value for P/S is 5.15 that is also over four times its current value of 1.12. The current EV/EBITDA of 3.30 is less than half of the 13-year median value of 7.8. If the stock were able to return to its median value for EV/EBITDA it would require a move of over 136%. Technical PictureGPOR is in the process of forming a rather large inverted head and shoulders pattern since mid-November. The measured move for this pattern is from the December 11 high to the December 26 low, which is nearly a $4 move. A breakout above $9.25 on increasing volume would be a potential confirmation of that pattern with a target of $13.25. That would mean retesting is July 2018 high. The significant amount of volume occurring along the neckline of this pattern is certainly an indication that it may have the potential to move significantly if broken.
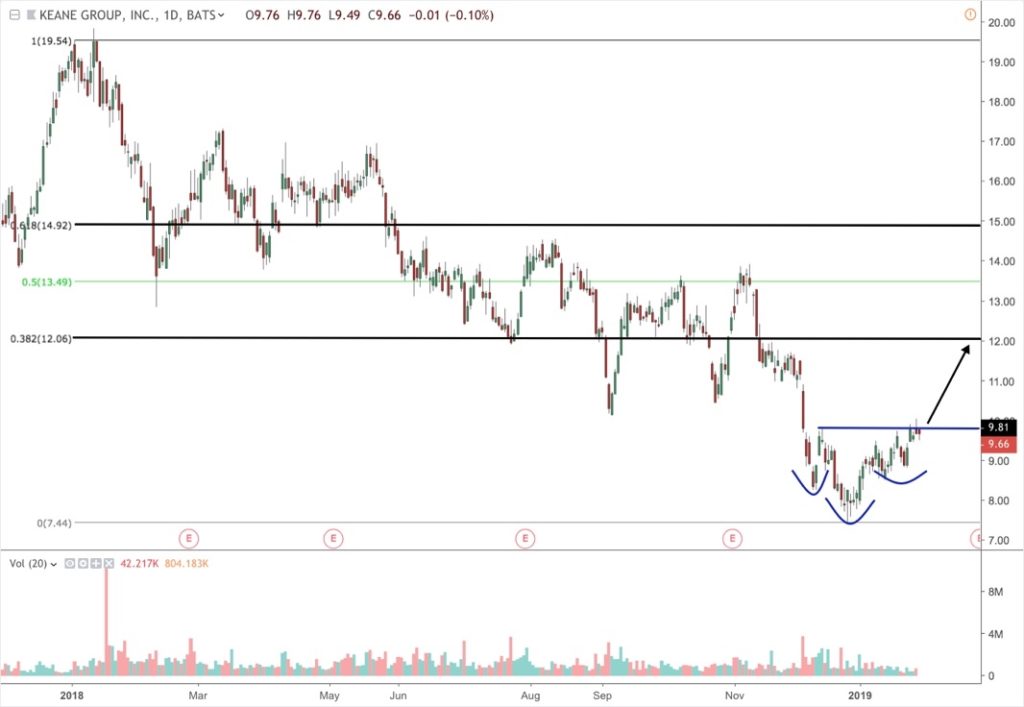
8. Keane Group, Inc. (FRAC)Price: $ 8.42 Keane Group, Inc. is provider of integrated well completion services in the United States, with a focus on demanding completion solutions. The Company’s segments include Completion Services, which comprises hydraulic fracturing and wireline divisions, and Other Services, which consists of coiled tubing, cementing and drilling divisions. It was founded in 1973 and is headquartered in Houston, Texas. Keane Group, Inc. is a subsidiary of Keane Investor Holdings LLC. ValuationPrice-to-Book (P/B): 2.04 FRAC is an oil service company that relies more on the level of production from the wells it services rather than the actual price of oil. Given the significant leverage of most oil production companies carry, the need to produce, even at lower prices, is significant. The current P/B of 2.04 is lower than its 4-year median value of 3.46. The current P/S of 0.52 is over half of the 4-year median P/B of 1.11. While the EV/EBITDA of 3.39 is less than half of the 4-year median value of 7.55. A return to those median values would produce moves in excess of 73%. Technical PictureFRAC is also forming a potential inverted head and shoulders pattern since November. A breakout above $9.81 on increasing volume would be confirmation with a potential target around $12.25. The target is based on the down-move from December 13 to December 26 added to the breakout level. That target would mean that the price would test the 38.2% Fib retracement of the 2018 downtrend, with a typical retracement carrying from that level to the 61.8% retracement level near $15.
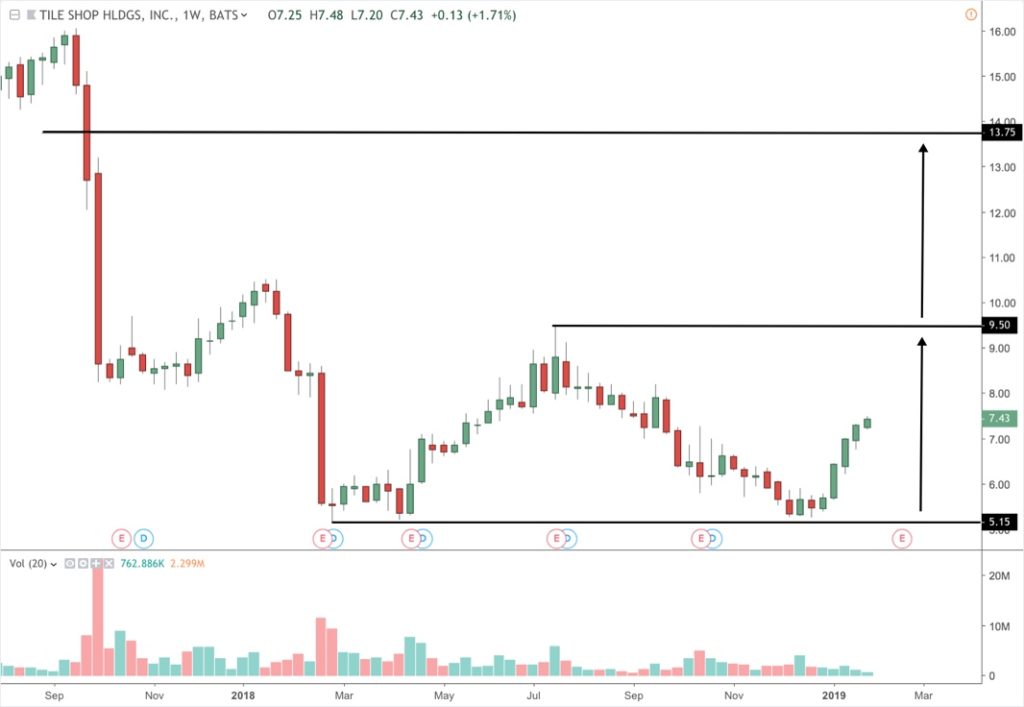
9. Tile Shop Holdings, Inc. (TTS)Price: $ 7.43 Tile Shop Holdings, Inc. is a specialty retailer of manufactured and natural stone tiles, setting and maintenance materials, and related accessories in the United States. It was founded in 1985 and is headquartered in Plymouth, Minnesota. ValuationPrice-to-Book (P/B): 2.61 Following a difficult 2017, the price has stabilized more over its last three earnings reports. Since January 1 the price has surged significantly, but the valuations have remained competitive relative to historical levels. The current P/B of 2.62 is just off the lowest value of the past 8 years and is lower than its median value over that period of 6.83. Similarly, the P/S ratio is just off its 8-year low of 0.79 and is significantly lower than its median value over that period of 2.67. The current EV/EBITDA of 10.18 is lower than its 8-year median value of 14. If the P/B and P/S were to return to historical levels it would mean that the price would be back near its 2013 levels between $25-$30 a share. Assuming EBITDA remains the same, if EV/EBITDA returned to historical averages it would indicate at least a 40% higher than where its currently trading. Technical PictureTTS was able to find support again near $5.25, which it also tested in early 2018. The 2019 rally has carried the price without any retracement along the way. As of January 14, 2019, the short interest was at 8.61% of the float. Based on the average volume, it would take 5.83 days to cover those positions. This level of short interest has the potential to provide additional momentum as short-covering may have been responsible how quickly the price has advanced in the past month. The price appears poised to retest its July high near $9.50 and a breakout above that level would complete the formation of a long-term double bottom pattern with a potential target near $14.
10. Companhia Siderurgica Nacional ADR (SID)Price: $ 2.92 Companhia Siderúrgica Nacional operates as an integrated steel producer in Brazil. It operates through five segments: Steel, Mining, Logistics, Cement, and Energy. It was founded in 1941 and is headquartered in Itaim Bibi, Brazil. Companhia Siderúrgica Nacional is a subsidiary of Vicunha Aços S.A. ValuationPrice-to-Book (P/B): 2.04 The political difficulties in Brazil have contributed to a lot of weakness in companies that are headquartered there. Some of the optimism surround the new government and the potential for a weak U.S. dollar relative to the Brazilian Real may provide additional upside for Brazilian companies. As a result of the recent weakness, the P/B is trading near it's 13-year median value of 2.09. The current P/S of 0.73 is trading below its 13-year median value of 0.91. Also, its current EV/EBITDA of 5.58 is considerably below its 13-year median value of 9.80. Any rebound in material costs in Brazil would also improve this company's earnings-based valuation ratio if earnings and revenues begin to rise. A return of the price to median valuations would indicate a 25% to 75% increase in the price of the stock. Technical PictureSID is in the process of completing a major reversal pattern as it is currently breaking its $2.75 resistance on high volume. The $0.80 range would provide a price target of $3.55, which would carry it back to its 2018 highs. The on-balance volume during this basing formation since last summer has been rising. That is an indication that investors have been accumulating the stock over that period and provides for a potentially larger move.
|
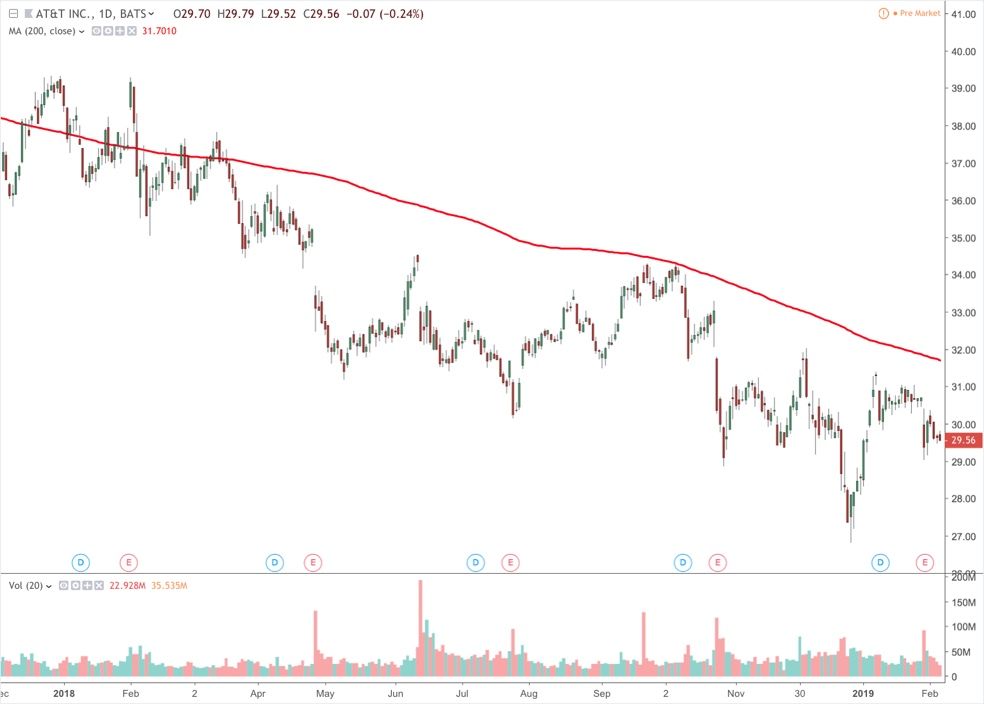
| 7 High Yield Dividend Stocks to Buy Now Posted: 06 May 2019 02:52 AM PDT Many investors seek out dividends as a means of providing a return that isn't based on a company's share price. There are several factors to consider when buying a company for dividends. Some of those factors are dividend yield, consistency of historically paying the dividend, the dividend growth rate and the type of corporate structure (equity, equity REIT, Mortgage REIT, MLP, etc.). In this list we're including traditional equities and equity REITs that pay over a 5% dividend yield. The approach to evaluating equity and equity REITs is a little different. In both of these types of investments it's important to consider the cash flow the company is generating and the valuation, but the way the companies are analyzed is different. For example, free cash flow (FCF) would be important for equities and funds from operations (FFO) would be important for REITs. In the case of valuation, measure like price-to-FFO (P/FFO) would be a means of evaluating REITs as compared to price-to-earnings (P/E) for equities. This is a result of the fact that REITs are pass-through entities and are required to pay out 90% of their net income in dividends. This allows them to avoid paying taxes and is why they retain very little earnings. In our list of 7 high yielding stocks, there are four traditional equities and three Equity REITs to consider buying now. The approach to analyzing them will be consistent with the type of equity investment being considered. 1. AT&T Inc (T) Business Summary AT&T Inc. is a holding company that provides communications and digital entertainment services in the United States and the world. The Company operates through four segments: Business Solutions, Entertainment Group, Consumer Mobility and International. The company was formerly known as SBC Communications Inc. and changed its name to AT&T Inc. in November 2005. AT&T Inc. was founded in 1983 and is based in Dallas, Texas. Dividends Forward Annual Dividend Yield: 6.88% T is considered a Dividend Aristocrat for a reason since it's had a long history of paying a dividend and posting annual increases to the dividend. Currently, T pays out 71% of its income in dividends. That is below the 13-year median value of 81%. The current yield is higher than the 5-year average yield of 5.36% and is above the 13-year median yield of 5.41%. The current yield is only slightly below the highest trailing annual yield over that period of 7.17%. Valuation Price-to-Earnings (P/E): 5.60 T is trading near its 10-year low P/E value of 5.51 and below its current industry median P/E of 19.33. Over the past 13 years it has had a median P/E of 14.41. The P/B value ratio of 1.17 is close to its 10-yrar low of 1.12, is below the 13-year median value of 1.75 and below its current industry median value of 2.07. Its current EV/EBITDA of 6.47 is slightly below its 13-year median value of 7.00 and is below the current industry median of 8.29. From a valuation perspective, T is trading near historic lows in several measures. Price History 52-Week High: $37.81 The price of T is trading about 10% off of its 52-week low and just below its 200-day moving average. While it has underperformed the S&P 500 over that period, the low price is contributing to the relatively high historic yield and the low valuation.
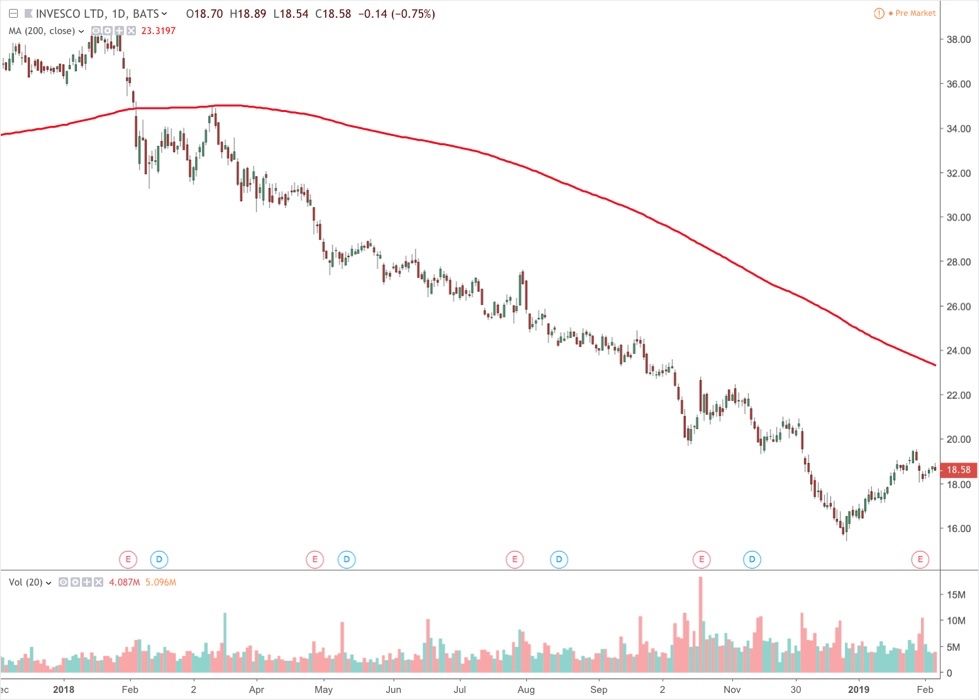
2. Invesco Ltd. (IVZ) Price:$18.58 Business Summary Invesco Ltd. (Invesco) is an independent investment management company. The Company provides a range of investment capabilities and outcomes, which are delivered through a set of investment vehicles, to help clients achieve their investment objectives. It has a presence in the retail and institutional markets within the investment management industry in North America; Europe, Middle East and Africa (EMEA), and Asia-Pacific. Invesco Ltd. was founded in December 1935 and is based in Atlanta, Georgia with an additional office in Hamilton, Bermuda. Dividends Forward Annual Dividend Yield: 6.40% The current dividend yield of 6.40% is well above the 13-year median of 2.48% and its 5-year average yield of 3.47%. The payout ratio of 56% is above the 13-year median value of 43% but is in line with its current industry median value of 56%. The 3-year dividend growth rate of 5.7% is close to its 13-year average of 6.00% and is above its industry median value of 5.20%. IVZ is currently paying a historically high dividend and based on its payout ratio it appears like they should be able to sustain the dividend and its historical growth rate. Valuation Price-to-Earnings (P/E): 8.68 IVZ is trading near its 13-year low P/E of 5.61 and considerably below its median value over that period of 15.79. The current industry median P/E is 14.21. It is also currently trading below book value at 0.85, which isn't abnormal for financial stocks. The 13-year low P/B is 0.56 and the median value over that period is 1.48. IVZ has a current P/B ratio that is below the industry median of 1.04 as well. The 13-year median value for EV/EBITDA is 12.3, which is higher than its current value of 9.43. Its current EV/EBITDA is also below the industry median value of 11.05. From a valuation perspective, IVZ is trading at a value both compared to its own history but also compared to its industry. Price History 52-Week High: $35.03 IVZ is down considerably over the past year and is currently trading below its 200-day moving average. This has contributed to its historically high dividend yield that it's currently paying and valuation. The relatively low payout ratio and free cash flows indicate that, despite the price weakness, they are capable of maintaining their dividend.
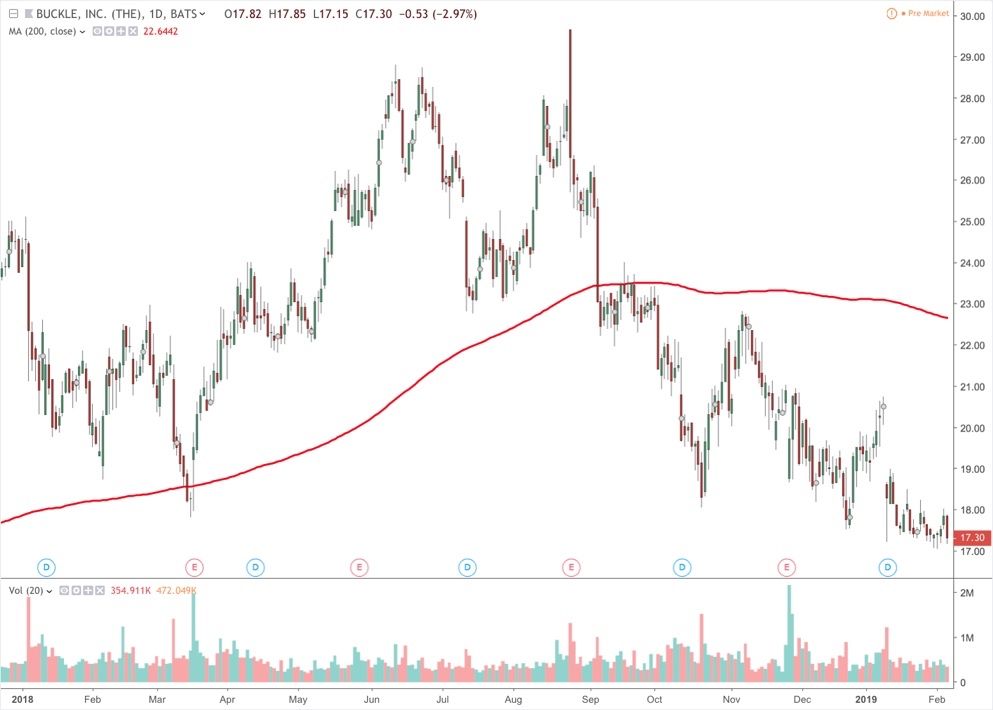
3. The Buckle Inc (BKE) Price: $17.3 Business Summary The Buckle, Inc. is a retailer of casual apparel, footwear and accessories for young men and women. As of January 28, 2017, the Company operated 467 retail stores in 44 states throughout the United States under the names Buckle and The Buckle. The Company markets a selection of brand name casual apparel, including denims, other casual bottoms, tops, sportswear, outerwear, accessories and footwear. The company was formerly known as Mills Clothing, Inc. and changed its name to The Buckle, Inc. in April 1991. The Buckle, Inc. was founded in 1948 and is headquartered in Kearney, Nebraska. Dividends Forward Annual Dividend Yield: 5.61% The current dividend yield for BKE is well above its 5-year average yield of 3.61% and its 13-year median yield of 2.3%. It's also considerably higher than its industry median value of 2.29%. The payout ratio is relatively high historically for BKE as its 13-year median value of 29%, but by itself wouldn't be considered high. BKE also pays a special dividend every January, which has ranged between $0.75 to $1.75 over the past three years. Since beginning to pay a regular dividend in 2016, BKE hasn't raised its dividend and may be using the special dividend as a means of passing on a portion of the company's profits each year to investors. Valuation Price-to-Earnings (P/E): 8.74 The 13-year median value for the P/E of BKE is 12.86. That is considerably higher than the current value of 8.74, which is near its 13-year low of 7.57. The P/E is also below the industry median of 19.95. The current P/B ratio of 2.05 is well below the 13-year median value of 4.29 but is a little higher than the industry median of 1.63. The current EV/EBITDA is below its 13-year median of 6.5 and lower than the industry median of 11.82. For most of these measures, BKE is a little above its 13-year low and represents a compelling valuation. Price History 52-Week High: $29.65 The price of BKE is trading near its 1-year low and is below its 200-day moving average. Since mid-October the price has stabilized and the large $1.25 dividend in January contributed to the large decline as the price was adjusted lower to account for the dividend.
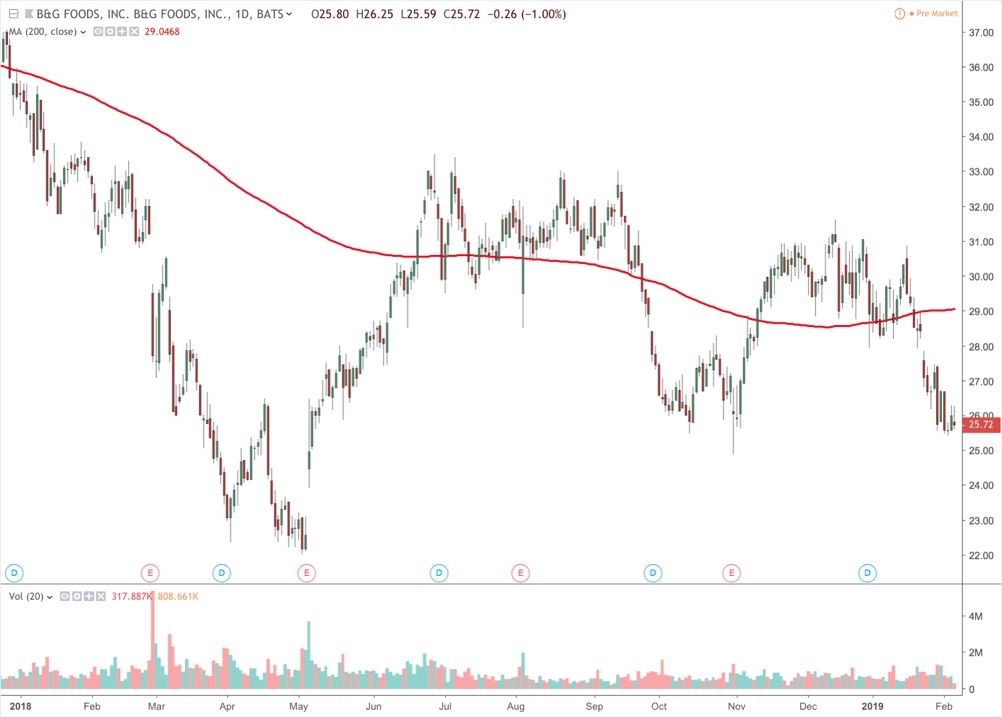
4. B&G Foods (BGS) Price: $25.72 Business Summary B&G Foods, Inc. (B&G Foods) is a holding company. The Company manufactures, sells and distributes a portfolio of shelf-stable and frozen foods across the United States, Canada and Puerto Rico. The company was formerly known as B&G Foods Holdings Corp. and changed its name to B&G Foods, Inc. in October 2004. B&G Foods, Inc. was founded in 1996 and is headquartered in Parsippany, New Jersey. Dividends Forward Annual Dividend Yield: 7.31% The median yield for BGS over the past 13-years is 4.46%, which is considerably lower than the current yield of 7.31%. BGS is higher than its 5-year average yield and its current median yield for the industry of 2.06%. Over the past 13 years the Payout ratio has been at 107%, which means that the company has historically paid out more in dividends than they generated in net income. The current payout ratio of 66% is much more respectable and near the 13-year low of 57%. In the last 10 years, BGS has gotten more consistent about raising its dividend and has a high 3-year growth rate of 11%. That is in line with its 10-year average growth rate. Valuation Price-to-Earnings (P/E): 8.97 The current P/E of 8.97 is just off of its 13-year low of 7.39 and considerably lower than its median value of 25.60 over that period. It's also significantly lower than its industry median of 19.86. The current P/B ratio is slightly higher than the industry median but is below its 13-year median value of 3.70. The current EV/EBITDA is in line with its 13-year average of 14.00 and has remained near this level since early 2012. The valuation ratios for BGS are in line with historical averages and below the industry in some categories. The fact that it's not comaparatively over valued and pays a historically high yield adds to the value of owning this stock. Price History 52-Week High: $37.81 The 52-week low was established on BGS in May of last year and showed some resilience during the sell-off in late 2018. It recently slipped below its 200-day moving average and is trading near its October 2018 low.
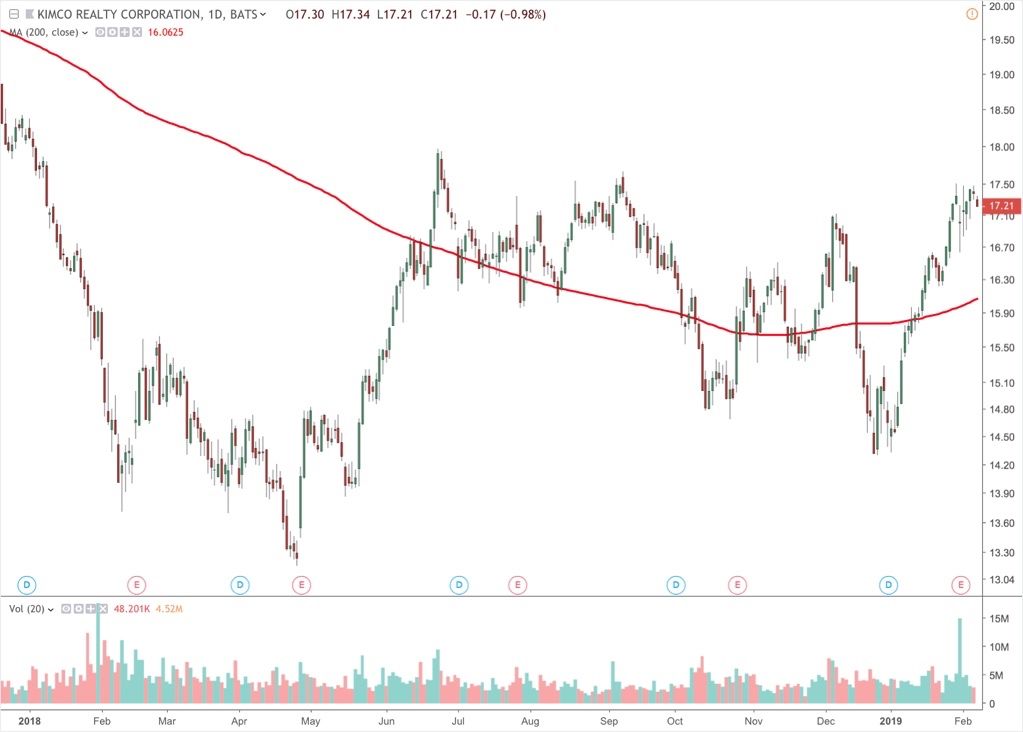
5. Kimco Realty Corp (KIM) Price: $17.10 Business Summary Kimco Realty Corporation is a self-administered real estate investment trust. The Company is engaged in the ownership, management, development and operation of open-air shopping centers, which are anchored generally by discount department stores, grocery stores or drugstores. Publicly traded on the NYSE since 1991, and included in the S&P 500 Index, the company has specialized in shopping center acquisitions, development and management for more than 60 years. Dividends & Valuation Forward Annual Dividend Yield: 6.43% Price-to-FFO (P/FFO): 11.59 The current yield for KIM is above the 13-year median yield of 4.01% and above the 5-year average yield of 4.73%. For REITs, funds from operations (FFO) and adjusted funds from operations (AFFO) are better measures when looking at the payout ratio. For KIM the FFO payout ratio is 82.35%, which is an indication that they are generating sufficient cash from their operations to pay their dividend. They have raised their dividend for the past 9 years and has generated a solid dividend growth rate of 6%. From a valuation standpoint, the P/FFO and P/AFFO are at reasonable levels with values of 11.59 and 11.66 respectively. Those values indicate that is will take the company 11 years to make the current market price of its shares. Comparatively, this is at one of the lowest points for these valuation ratios in the past 7years. The combination of a stable and rising dividend and low valuations makes this stock fairly attractively priced while generating a high amount of income. Price History 52-Week High: $17.96 The price is just off of its 52-week high of $17.96 and has traded in a fairly stable range for the past year. Recently the price has risen from a December low of $14.29 and is trading above the 200-day moving average which has also begun to turn higher.
6. One Liberty Properties (OLP) Price: $27.83 Business Summary One Liberty Properties, Inc. is a self-administered and self-managed real estate investment trust (REIT). The Company acquires, owns and manages a geographically diversified portfolio consisting of retail, industrial, flex, and health and fitness properties. One Liberty is a self-administered and self-managed real estate investment trust incorporated in Maryland in 1982. Dividends & Valuation Forward Annual Dividend Yield: 6.47% Price-to-FFO (P/FFO): 13.98 The 13-year median yield is 7.04%, which is slightly higher than the current dividend yield. This is representative of a company that has continued to perform relatively well since 2009 and is near its 52-week high in mid-August. The high annual growth rate of the dividend at 5.1% has allowed the yield to remain historically competitive. The FFO payout ratio is indicative of a company that is generating sufficient cash to pay its dividend. The P/FFO and P/AFFO has remained relatively stable since 2013 as the price has been range-bound and the cash from operations has increased. Similar to KIM, the combination of a stable and rising dividend and stable valuations makes this stock fairly attractively priced while generating a high amount of income. Price History 52-Week High: $29.44 The current price has rallied strongly in the last month as is has once again crossed the 200-day moving average. The price is less than 10% off of its 52-week high and up over 205 in the last year. The long-term trend has continued to rise as indicated by the rising 200-day moving average. 7. Macerich Co. (MAC) Price: $42.83 Business Summary The Macerich Company is a self-administered and self-managed real estate investment trust (REIT). The Company is involved in the acquisition, ownership, development, redevelopment, management, and leasing of regional shopping centers located throughout the United States. Dividends & Valuation Forward Annual Dividend Yield: 7.01% The current dividend yield for MAC is considerably higher than the 5-year average and the 13-year median yield of 4.11% and 4.08% respectively. The FFO payout ratio of 74.75% shows that they are only paying out that amount of the cash they're generating from operations. That is attractive since it shows the ability to pay their dividend and still have room to increase it. MAC has consistently raised their dividend over the past 8 consecutive years with a solid growth rate of 4.6%. As the price has come down the past couple years, the P/FFO is becoming increasingly more compelling. The current value of 13.98 is near the lowest point it has traded since 2010 and the high relative dividend yield reflects that point. The combination of lower valuation, historically high yield and consistent growth rate makes this an attractive candidate for dividend income. Price History 52-Week High: $61.91 The price has come down significantly over the past year and is near its 52-week low and well below its 200-day moving average. As the price comes down, the dividend yield increases and is allowing the dividend yield to attain historically high levels. The price has yet to fully stabilize and has gapped lower on its most recent earnings announcement.
|
| Posted: 06 May 2019 02:51 AM PDT The Ultimate Energy StockInvestors are always looking for the next big thing. But when they find it, what do they do? They rationalize reasons not to buy it. If you had looked at shares of Wal-Mart (WMT) or Intel (INTC) in the 1970's, you would have probably thought of plenty of reasons to avoid buying shares. But both companies became the next big thing in their industry. Today, one small niche company stands far ahead of other companies as a leader for the next generation of its industry. In order to be considered the ultimate energy stock, it should do a few things. First, it should be innovative and truly capable of being the leader of its segment of the market. Second, early adopters should be pointing the way to the company's future success, even if the company is in such an early stage that profitability looks doubtful. Third, it should be trading at a price that looks enticing, even if it's not obvious that it's not the next big thing. One company fits all those parameters right now. It's incredibly disruptive. But it's set up to succeed, unlike other alternative energy names that have come and gone in the past such as SunEdison or Solyndra. That company's name is Bloom Energy (BE). The Company: A Better Mousetrap On paper, it's an easy-to-understand company. Bloom Energy's bread and butter is fuel cells. Fuel cells are a device that coverts fuel into electricity through an electrochemical reaction. I won't get into the hardcore science of it here, but you should know that fuel cells have actually existed since 1838! It's similar to a battery. In fact, a battery is technically a group of cells. Typically, unlike a run-of-the-mill battery, however, fuel cells are rechargeable. Despite being around for a long time, it took over a century for fuel cells to be used commercially. That's when NASA began using them to generate power for satellites and space capsules… where you can't just send up an astronaut with a few AA batteries to replace the dead ones. That technology has taken off, and today fuel cells are used to power commercial, industrial and residential buildings as well as vehicles like forklifts, cars, buses, boats, motorcycles and even submarines! But the fuel cell that this company manufactures and sells is different than others. It's basically like a very skinny battery that's always running. Oxygen is fed into the cell on one side, fuel on the other. Their fuel cells actually run on natural gas – a fossil fuel. This means their energy server platform can always stay ON. That's different than other green energies that are vulnerable to outages from a variety of sources, like how solar doesn't work at night or wind turbines won't spin without wind. That's what makes those tough investments to make—if the market sours on either of those investments, all the money that flew in will fly right out. That's not the case with natural gas. The consensus among energy analysts is that natural gas is going to stay both cheap and abundant for a very long time. That means this company can be confident that their fuel cells won't be running out of the actual FUEL anytime soon. In fact, Data Center Dynamics reports that the gas grid in the U.S. is 100 times more reliable than the 99.9% reliable electric grid! They're also helping alleviate landfill use, where fuels often end up going to waste. Because as opposed to regular sources where power can only be generated "in the moment"… This company's fuel cells allow for power to be stored and used later if needed. No more blackouts or wasted energy! But unlike solar companies who are trying to outfit one house at a time with panels on the roof, or major power plants that need years of red tape, bureaucracy and plans to satisfy government officials… This company's approach is MUCH different. They're going directly to big companies with their fuel cells. Early Adopters: The Supplier to Corporate America Bloom Energy is having huge success getting them to switch over to their cleaner, cheaper power for their energy-guzzling data centers, offices and stores. That's huge. It fits our second criteria for the ultimate energy stock, a large, growing and enthusiastic customer base. Already, its customers include:
We're not talking one-off, small-scale investments here, either. Consider how these customers are using power:
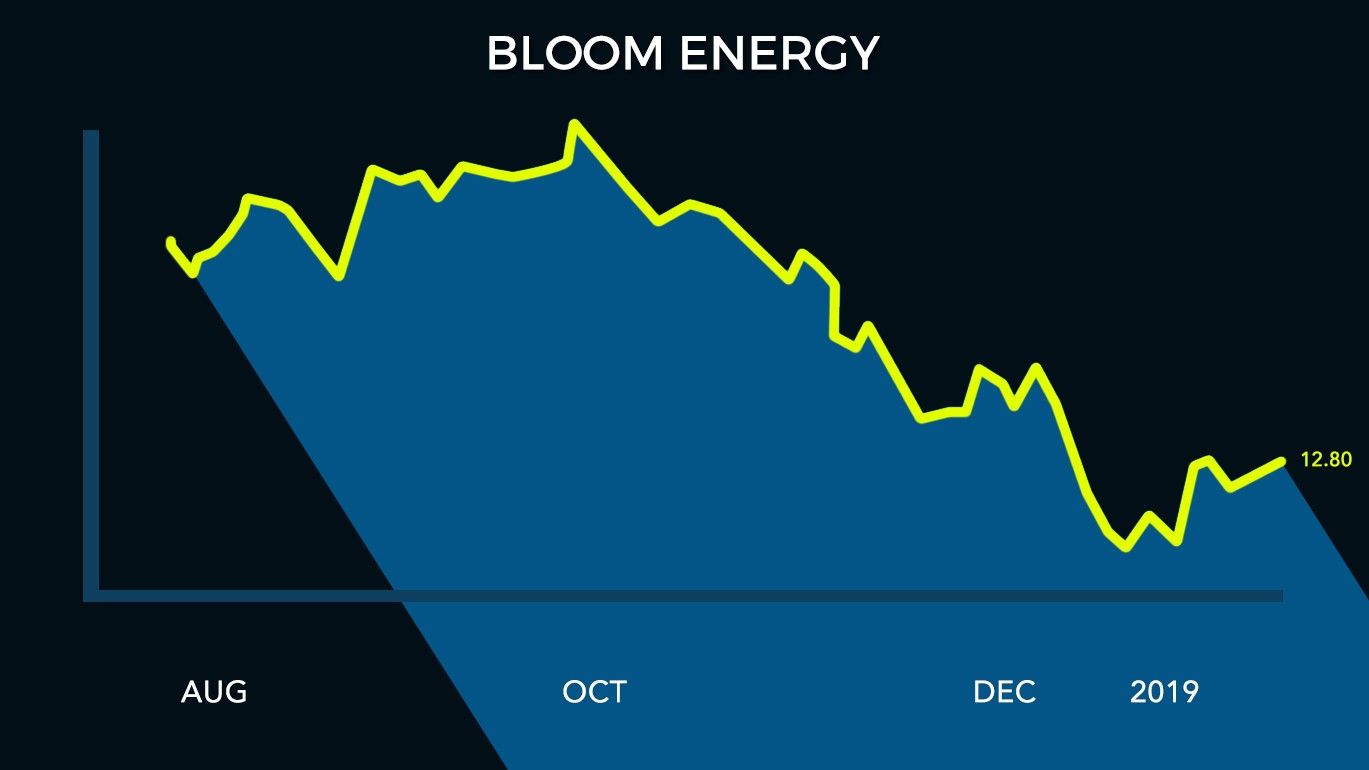
The list goes on and on… In fact, almost 10% of Fortune 500 companies are using fuel cells for their electric needs. That's nearly 50 companies… and Bloom Energy already has half that market. Pricing: The IPO Bust Simply Sets Up the Next Boom It's a big deal when a company goes public. It goes from being privately owned— often from private equity or angel investors—to where regular folks get a chance to own a stake in the company's future success too. By the time a company has its initial public offering (IPO), the company is in full production. There's no prototypes that still need to be tried. Whatever started as an idea on the drawing board has been refined into an actual product with actual customers. That's where Bloom Energy is right now, thanks to its IPO last year. But, as they say, timing is everything. When a company goes public, those early investors have a chance to cash out. That can lead to an IPO that isn't always the best for potential investors right away. Consider Facebook (FB). When that social media company went public in 2011, shares fell from their original price. They subsequently beat the pants off the market—but at the time, it was considered a "failed IPO" for its early decline. Bloom Energy likewise stumbled last year. So did markets as a whole. From their peak, the stock market declined nearly 15 percent in the last quarter of 2018. That kind of selling pressure can hit any company, whether it's performing well as a business or not. For a recent IPO, Bloom Energy wasn't immune. After going public back in July at $25, shares rose as high as $25 in late September— before taking a 50 percent whack as the market dropped too.
Besides the market being weak, it's easy to see why there was this decline as well. When the going gets tough, a company with a short operating history is seen by many as a liability, not an asset right now. But as Facebook investors learned, that can be turned to a long-term advantage. In fact, shares are already starting to move higher. Part of that is simply because they got oversold in the short-term. But over the longer haul, they'll likely rally further as the company continues to expand. The company is still in an early stage where it's growing its customer base, but it still isn't profitable yet. That usually happens after the IPO. But the IPO also allows the company to raise money by selling shares in the market—and in the case of Bloom, which allowed them to raise $400 million in cash on the books. Remember, Bloom raised that money at the IPO price of $25 per share. That means today's investors are getting a hefty discount to where the company was valued over six months ago. If the company were trying to raise $400 million today, they'd have to sell twice as many shares as a year ago. But since they have their IPO money in the bank, they don't need to raise more cash right now. That's a recipe for higher prices. With revenues up 102 percent year-over-year, the company's expansion is moving at an incredibly rapid rate that will allow it to become profitable in time. The recent drop in share price out the gate is hardly an issue when you have a rapidly growing company with a proven technology in a necessity like clean energy production. Conclusion: Bloom Energy has it all. They have a useful product—a fuel cell that runs on clean, cheap natural gas. Its fuel cells are small in scale, but large enough to power the needs of many of today's large S&P 500 companies. Its proven technology and growing customer base enabled it to go public—just in time to get hit with the worst stock market performance since 2008. That all adds up to a company that can potentially beat the pants off the market in the next few years. It doesn't matter what the price of oil does. It doesn't matter what happens in the Middle East. It doesn't matter if the economy goes up, down, or sideways. Any company meeting the needs of its customers on a fast growth path will do well. Bloom Energy is one such company, making it the ultimate energy stock right now. This modestly-priced ultimate energy stock can potentially hit $50 in the next two years—possibly more as it grows its customer base. 5 Super Trends Every Investor |

| You are subscribed to email updates from TradingTips.com. To stop receiving these emails, you may unsubscribe now. | Email delivery powered by Google |
| Google, 1600 Amphitheatre Parkway, Mountain View, CA 94043, United States | |
No comments:
Post a Comment