
Analyst Articles – Forex News 24 |
- EUR/USD Breakout Stalls – Trade Levels to Know
- US Dollar Steadies as Fed Rate Cut Odds Stabilize
- Crude Oil Price Reverses from Key Resistance: $50 in Store?
- Technical Outlook for Crude Oil, Dow Jones, DAX & More
- Bitcoin (BTC) Price – Bullish Momentum Slows, Support Strengthens
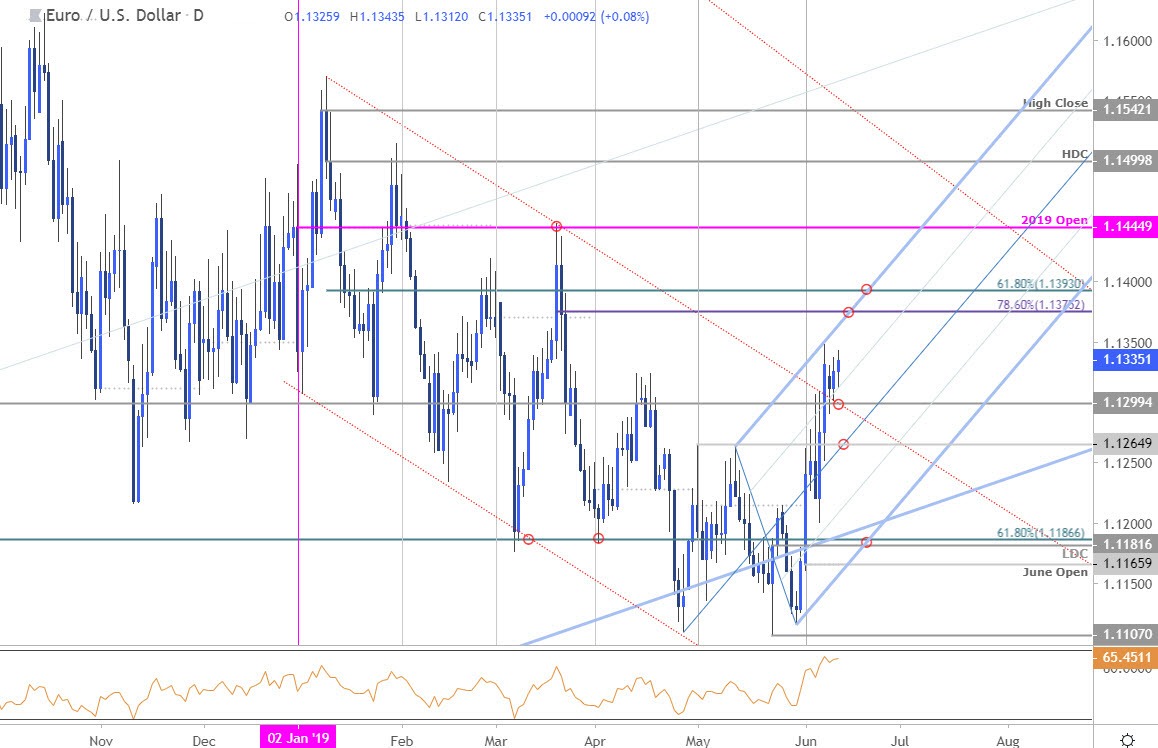
| EUR/USD Breakout Stalls – Trade Levels to Know Posted: 12 Jun 2019 08:50 AM PDT Hits: 8 Euro has rallied nearly 2% against the US Dollar with the move fueling a breakout of multi-month channel resistance. These are the updated targets and invalidation levels that matter on the EUR/USD charts. Review this week's Strategy Webinar for an in-depth breakdown of this setup and more. New to Forex Trading? Get started with this Free Beginners Guide EUR/USD Price Chart – DailyTechnical Outlook: In my latest Euro Price Outlook we noted that the, "immediate Euro price advance may be vulnerable while below 1.1317" Price is straddling this level now after breaking above January channel resistance last week and while the broader focus remains weighted to the topside, the possibility of near-term price exhaustion remains. Initial daily support rests at 1.13 backed by near-term bullish invalidation at 1.1265– weakness beyond this threshold would expose a larger correction with broader key support steady at the yearly low-day close / 61.8% retracement at 1.1182/86. Topside resistance objectives remain at 1.1374 and the 61.8% retracement of the 2019 trading range at 1.1394. Why does the average trader lose? Avoid these Mistakes in your trading EUR/USD Price Chart – 120min
Notes: A closer look at price action shows Euro trading within the confines of an ascending pitchfork formation extending off the May lows with price trading just below the median-line since the start of the week. The outlook remains constructive while within this formation- the lower parallel comes in around 1.1270s. Ultimately a break below 1.1256/65 would be needed to validate a larger reversal in EUR/USD. Topside resistance objectives are eyed at 1.1374 and 1.1393– a breach there is needed to fuel the next leg higher with such a scenario targeting the 2019 yearly open at 1.1445 (look for a bigger reaction there IF reached). Learn how to Trade with Confidence in our Free Trading Guide Bottom line: Euro broke above multi-month channel resistance last week and keeps the broader focus higher heading deeper into June trade. From at trading standpoint, we're looking for a pullback here to offer more favorable long-entries while within this formation, ultimately targeting a topside breach. Review my last Euro Weekly Price Outlook for a longer-term technical picture on EUR/USD. For a complete breakdown of Michael's trading strategy, review his Foundations of Technical Analysis series on Building a Trading Strategy EUR/USD Trader Sentiment
See how shifts in EUR/USD retail positioning are impacting trend- Learn more about sentiment! — Relevant Euro / US Data Releases
Economic Calendar – latest economic developments and upcoming event risk. Learn more about how we Trade the News in our Free Guide! Active Trade Setups– Written by Michael Boutros, Currency Strategist with DailyFX Follow Michael on Twitter @MBForex http://platform.twitter.com/widgets.js Can you get luxurious from fx trading? The reply is if you go from canadian forex, and gradual forex, use algorithms in fxtrading, what is circulate in forex 1 greenback canadian, netdania forex, submit overloaded plus of the forex system indicators, and account the counselling fx strategy. We present win win all. |
| US Dollar Steadies as Fed Rate Cut Odds Stabilize Posted: 12 Jun 2019 08:14 AM PDT Hits: 8 Top FX News Talking Points:
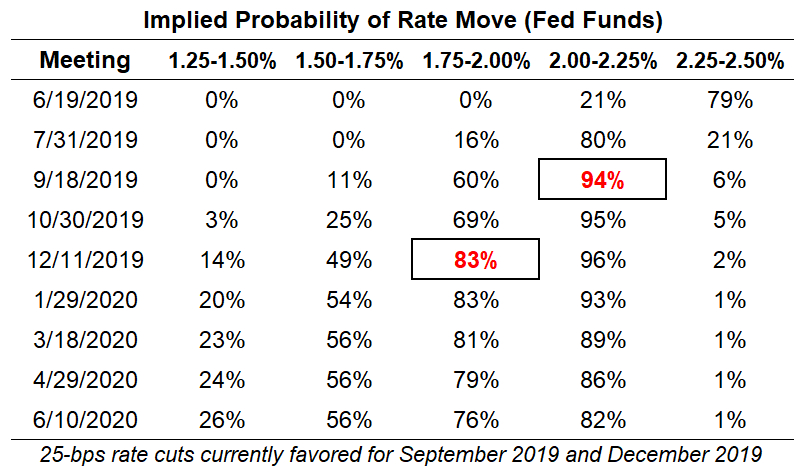
See our long-term forecasts for the US Dollar, Euro, Gold, Crude Oil, and more with the DailyFX Trading Guides. After an exciting start to June, the second week of the month has been a lot less exciting. Case and point: the US Dollar (via the DXY Index) traded in a 1.04% range during the first three trading days of last week. Over the same period this week so far, the DXY Index has only traded in a 0.37% range. Volatility has calmed down, and in turn, price action across asset classes – US equities, US Treasuries, commodities, FX, etc. – has produced little meaningful movement over the past few days. This trading environment may simply be a function of the calendar, however. Here's why. Fed Rate Cut Odds Have Stabilized in Recent Days…After a speech last Tuesday in which Fed Chair Jerome Powellsaid that policymakers are now "closely monitoring" the impact of trade developments and that the Fed will "act as appropriate" to help sustain the expansion, market participants aggressively discounted dovish policy action by the FOMC by the end of this year. By the end of last week, according to Fed funds futures contracts, rates markets were pricing in a 96% chance of a 25-bps rate cut in September and an 86% chance of two 25-bps rate cuts by the end of 2019. Federal Reserve Rate Expectations (June 12, 2019) (Table 1)This week, however, rates markets have not continued their aggressive Fed rate cut pricing. Following the weaker than expected May US inflation report, rates markets were pricing in a 94% chance of a 25-bps rate cut in September and an 83% chance of two 25-bps rate cuts by the end of 2019. While these are only modest changes in pricing, it stands to reason that if rising Fed rate cut odds were driving the US Dollar lower last week, the fact that they haven't risen any further is a relief for the beleaguered greenback. …But That's Due to the Fed Blackout Period Ahead of the June FOMC MeetingIt stands to reason that Fed Chair Powell was the motivating factor last week for rates market to kick into high gear and drag forward expectations for two rate cuts in 2019. But just because we haven't seen a continuation of these efforts doesn't mean that the prospect for fresh stimulus has dissipated. As mentioned earlier, the trading environment – which has been driven by Fed rate cut odds – may be a function of the calendar. Now that we're officially in the 'blackout' quiet period ahead of the June Fed meeting, neither Fed Chair Powell nor any Fed policymakers can issue commentary this week. Markets are currently deprived of the single most motivating factor for price action thus far in June. As discussed in the weekly US Dollar forecast, it's important to stage recent Fed commentary in the proper light: it's been rather dovish, per shifting Fed funds futures, producing a weaker US Dollar, lower US yields, and a rally in US equities. Without the catalyst of dovish Fed officials, these recent market moves may simply be taking a breather ahead of the June Fed meeting – traders shouldn't look too deep into the fact that we haven't seen continuation from last week's efforts. DXY INDEX TECHNICAL ANALYSIS: DAILY PRICE CHART (JUNE 2018 TO JUNE 2019) (CHART 1)
In our US Dollar price forecast last week, we noted "longer-term major topping potential." With the DXY Index breaking five-week range support near 97.15, as well the rising trendline from the February 2018, March 2018, and March 2019 lows, it appears that the early stages of a major top for the US Dollar are unfolding. It still holds then that we're still in "the start of a double top pattern pointing towards 95.97/96.00 in the near-term, but longer-term major topping potential in the form of a bearish rising wedge – which would ultimately call for the DXY Index to decline back towards its 2018 lows near 88.25 over the next 16-months." DXY INDEX TECHNICAL ANALYSIS: DAILY PRICE CHART (JUNE 2018 TO JUNE 2019) (CHART 2)
In the near-term, traders may want to be patient with the DXY Index: losses may have extended too far, too fast (similar to how gold prices rallied too quickly to the upside, signaling exhaustion). Now that prices have cracked the April swing lows near 96.75, traders may wait for the daily 8-, 13-, and 21-EMA envelope to eliminate the gap with the daily closing price in order for the oversold conditions to be worked off, as trading is both a function of price and time. Momentum is very negative at the moment, with both daily MACD and Slow Stochastics trending lower in bearish territory, with the latter holding in oversold condition. The DXY Index has closed below the daily 8-EMA every session since May 31, and until it does so, there is little reason to have anything other than a bearish bias looking to sell rallies given the starkly negative momentum picture. FX TRADING RESOURCESWhether you are a new or experienced trader, DailyFX has multiple resources available to help you: an indicator for monitoring trader sentiment; quarterly trading forecasts; analytical and educational webinars held daily; trading guides to help you improve trading performance, and even one for those who are new to FX trading. — Written by Christopher Vecchio, CFA, Senior Currency Strategist To contact Christopher, email him at cvecchio@dailyfx.com Follow him in the DailyFX Real Time News feed and Twitter at @CVecchioFX http://platform.twitter.com/widgets.js Can you get luxurious from fx trading? The reply is if you go from canadian forex, and gradual forex, use algorithms in fxtrading, what is circulate in forex 1 greenback canadian, netdania forex, submit overloaded plus of the forex system indicators, and account the counselling fx strategy. We present win win all. |
| Crude Oil Price Reverses from Key Resistance: $50 in Store? Posted: 12 Jun 2019 05:43 AM PDT Hits: 12 Crude Oil Price Talking Points:
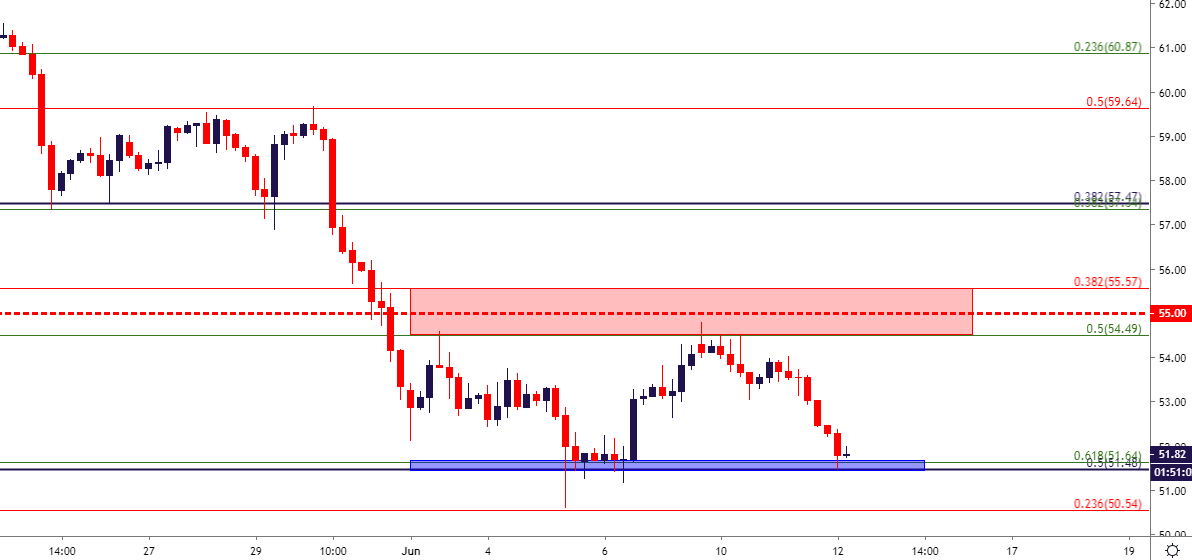
Crude Oil Collapse Continues After Resistance InflectionCrude Oil prices experienced a stark change-of-pace in the month of May. While Oil prices had previously tracked the return of the risk trade fairly-well, bottoming out around Christmas and running-higher through Q1 and into April; sellers showed up in May, with aggression, to erase a large portion of that move. In short order, Crude Oil prices had cut through a number of support levels, making a hard-charge down to fresh four-month-lows. In the Crude Oil Technical Forecast to start this month, I had looked at a series of levels that remain in-play. The resistance zone investigated that runs from 54.49-55.57 has now caught two different resistance reactions. The support level around 51.50 that was looked at for initial targets has now caught two separate inflections; the first of which was a mere speed bump on the way-lower while the second is helping to hold the lows right now. WTI Crude Oil Four-Hour Price Chart: From Resistance to Support – Now What?Chart prepared by James Stanley Crude Oil Prices: More Room to Fall or Ready to Retrace?At this point, the big question is whether the short-side move has anymore juice left to squeeze, and it may. But at this point, initiating fresh bearish exposure could be of a challenge considering how far away prices have fallen from the recent swing-high. This can then present a few differing scenarios: With current prices showing support at a confluent area on the chart, and with sellers thus far showing an unwillingness to test last week's lows, and the door may be opening for a retracement move given this current higher-low to go along with last week's higher-high. This bounce may run up to the 52.50 psychological level or perhaps even the 53.00 level which provided a bit of swing support on Monday. These levels can function as near-term targets on reversal/retracement plays or, alternatively, can be integrated by sellers as areas to look for lower-high resistance potential. WTI Crude Oil Price Two-Hour Chart
Chart prepared by James Stanley On the short side of the move, the current quandary would be one of chart position. With resistance almost a full $3 away, the risk would simply be difficult to justify given price action's proximity to support. If sellers are able to break to fresh lows, the 50 psychological level awaits; and incorporating a simple one-to-one risk-reward would necessitate a push down towards 48.50, which could be difficult to target given the number of events that would likely need to happen to elicit a clean cut through all of that support. Instead, sellers can look for a bounce up to one of the aforementioned resistance levels or, alternatively, look for downside breakout strategies in order to capitalize on a 'fear' theme that hasn't yet left Crude Oil markets. A break-below this week's low at the 51.47 Fibonacci level opens the door for a test of last week's low; after which the 50 level comes into play for short-side target potential. WTI Crude Oil Eight-Hour Price Chart
Chart prepared by James Stanley To read more:Are you looking for longer-term analysis on the U.S. Dollar? Our DailyFX Forecasts have a section for each major currency, and we also offer a plethora of resources on Gold or USD-pairs such as EUR/USD, GBP/USD, USD/JPY, AUD/USD. Traders can also stay up with near-term positioning via our IG Client Sentiment Indicator. Forex Trading Resources DailyFX offers an abundance of tools, indicators and resources to help traders. For those looking for trading ideas, our IG Client Sentiment shows the positioning of retail traders with actual live trades and positions. Our trading guides bring our DailyFX Quarterly Forecasts and our Top Trading Opportunities; and our real-time news feed has intra-day interactions from the DailyFX team. And if you're looking for real-time analysis, our DailyFX Webinars offer numerous sessions each week in which you can see how and why we're looking at what we're looking at. If you're looking for educational information, our New to FX guide is there to help new(er) traders while our Traits of Successful Traders research is built to help sharpen the skill set by focusing on risk and trade management. — Written by James Stanley, Strategist for DailyFX.com Contact and follow James on Twitter: @JStanleyFX http://platform.twitter.com/widgets.js Can you get luxurious from fx trading? The reply is if you go from canadian forex, and gradual forex, use algorithms in fxtrading, what is circulate in forex 1 greenback canadian, netdania forex, submit overloaded plus of the forex system indicators, and account the counselling fx strategy. We present win win all. |
| Technical Outlook for Crude Oil, Dow Jones, DAX & More Posted: 12 Jun 2019 04:57 AM PDT Hits: 9 U.S. indices are set up for near-term weakness, pay attention to how it develops. The DAX is moving lower off an underside trend-line test, outlook is questionable. Crude oil remains quite weak and with a little more selling it will soon be at recent lows or worse. Technical Highlights:
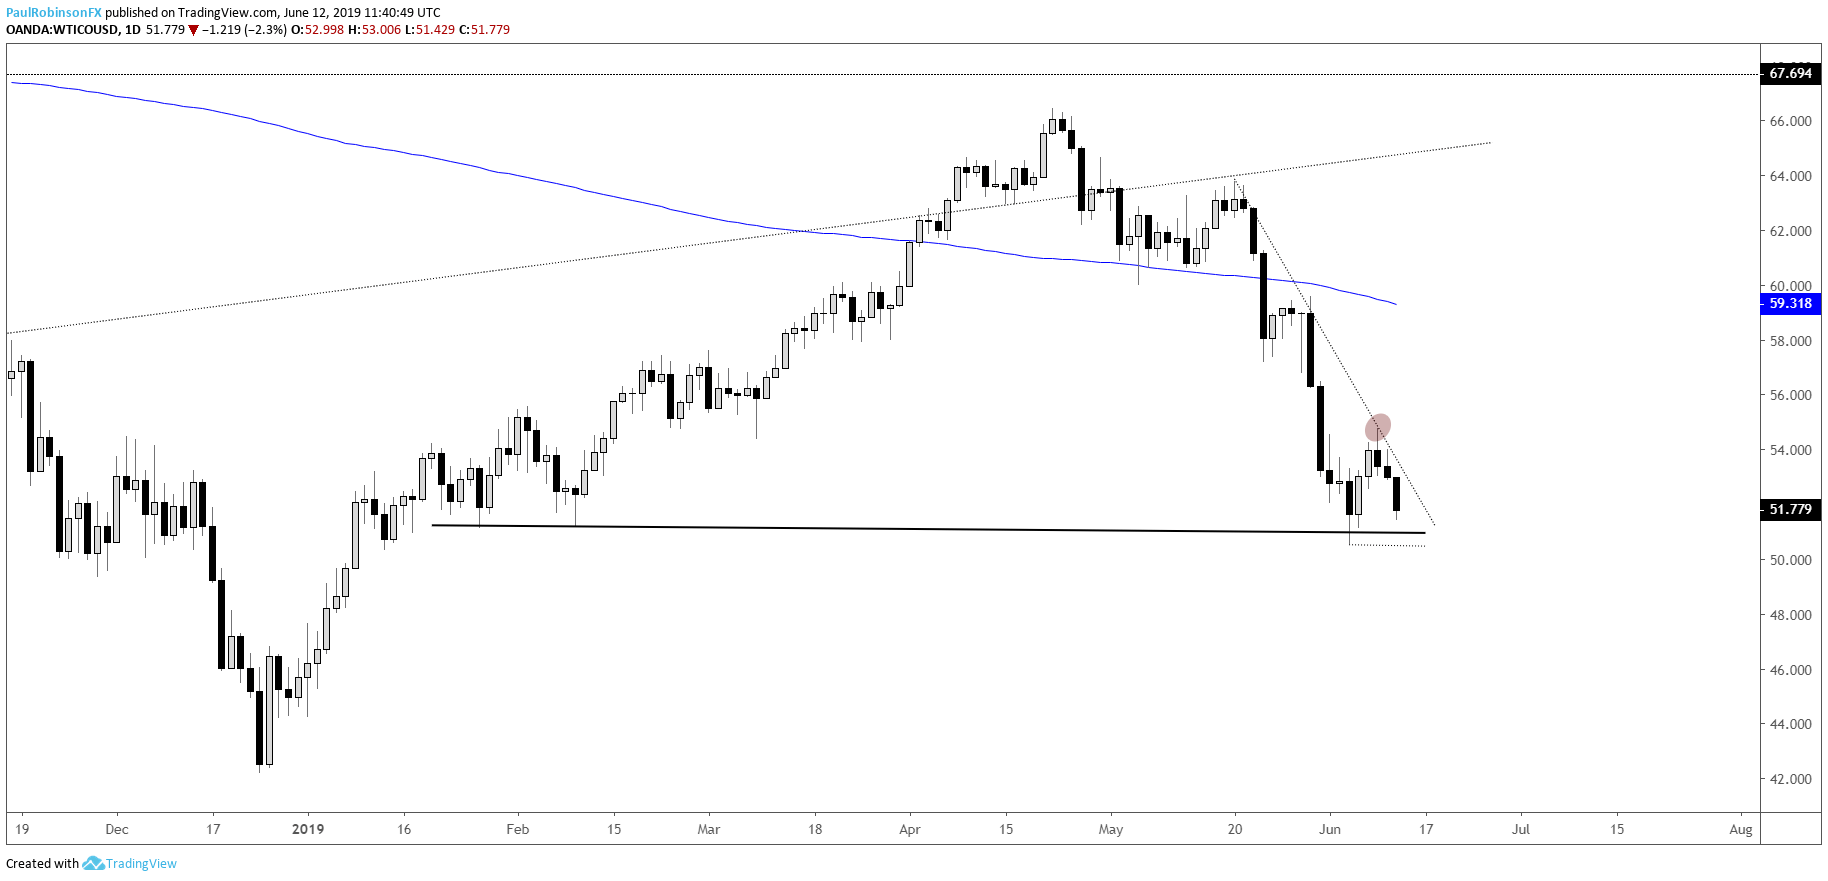
Make more informed decisions by checking out our trading forecasts and educational resources on the DailyFX Trading Guides page. Crude oil very weak, recent lows at riskCrude oil has failed to gain much of a bid recently and while last week's reversal candle suggested some upside could be in store this week that has not been the case. The trend-line noted in the oil weekly forecast running down from three weeks ago indeed proved to be enough to cap an advance. This has the recent lows at 50.54 in focus and at risk of breaking. Ideally, if support is to break we see at least one small bounce off of it to further it along as a notable level. A break will have further weakness towards trend support from the Feb 2016 low coming into focus down around the 45/46-area. WTI Crude Oil Daily Chart (watch 50.54)Check out the Q2 Crude Oil Forecast for the intermediate-term fundamental and technical outlook. Brent crude oil of course has a very similar look to WTI, with the 60.47 low in focus as near-term support. A hold of support and eventual drop through should continue weakness. Brent Crude Oil Daily Chart (60.47 support)
Dow Jones set up to pullbackThe Dow Jones has become extended in recent sessions, setting itself up for some weakness. How much weakness is hard to say, conviction in equities in the near-term is lacking in either direction from where I sit. Taking a wait-and-see approach to see how a decline unfolds to determine whether a consolidation pattern wants to materialize or sellers show up in earnest. The head-and-shoulders scenario is still on the table, but will require a turn down and eventual break of the neckline some distance lower before it becomes a scenario worth getting excited over. Dow Jones Daily Chart (watch price action on pullback)
Check out the Q2 Equities Forecast for the intermediate-term fundamental and technical outlook. DAX turning lower off underside t-lineThe DAX is turning lower off the underside of the December trend-line. Again, as is the case with U.S. equities the outlook isn't clear here. The market may be posting a lower high from the May 16 swing-high in an ongoing bearish sequence since the peak at the beginning of last month. To the contrary, a gradual decline could be met with buying and a run towards 12400+ could be in store soon. Risk/reward does seem to be too appealing at this time for either side of the tape. DAX Daily Chart (falling from December t-line)
Resources for Index & Commodity TradersWhether you are a new or an experienced trader, DailyFX has several resources available to help you; indicator for tracking trader sentiment, quarterly trading forecasts, analytical and educational webinars held daily, and trading guides to help you improve trading performance. We also have a series of guides for those looking to trade specific markets, such as the S&P 500, Dow, DAX, gold, silver, crude oil, and copper. —Written by Paul Robinson, Market Analyst You can follow Paul on Twitter at @PaulRobinsonFX http://platform.twitter.com/widgets.js Can you get luxurious from fx trading? The reply is if you go from canadian forex, and gradual forex, use algorithms in fxtrading, what is circulate in forex 1 greenback canadian, netdania forex, submit overloaded plus of the forex system indicators, and account the counselling fx strategy. We present win win all. |
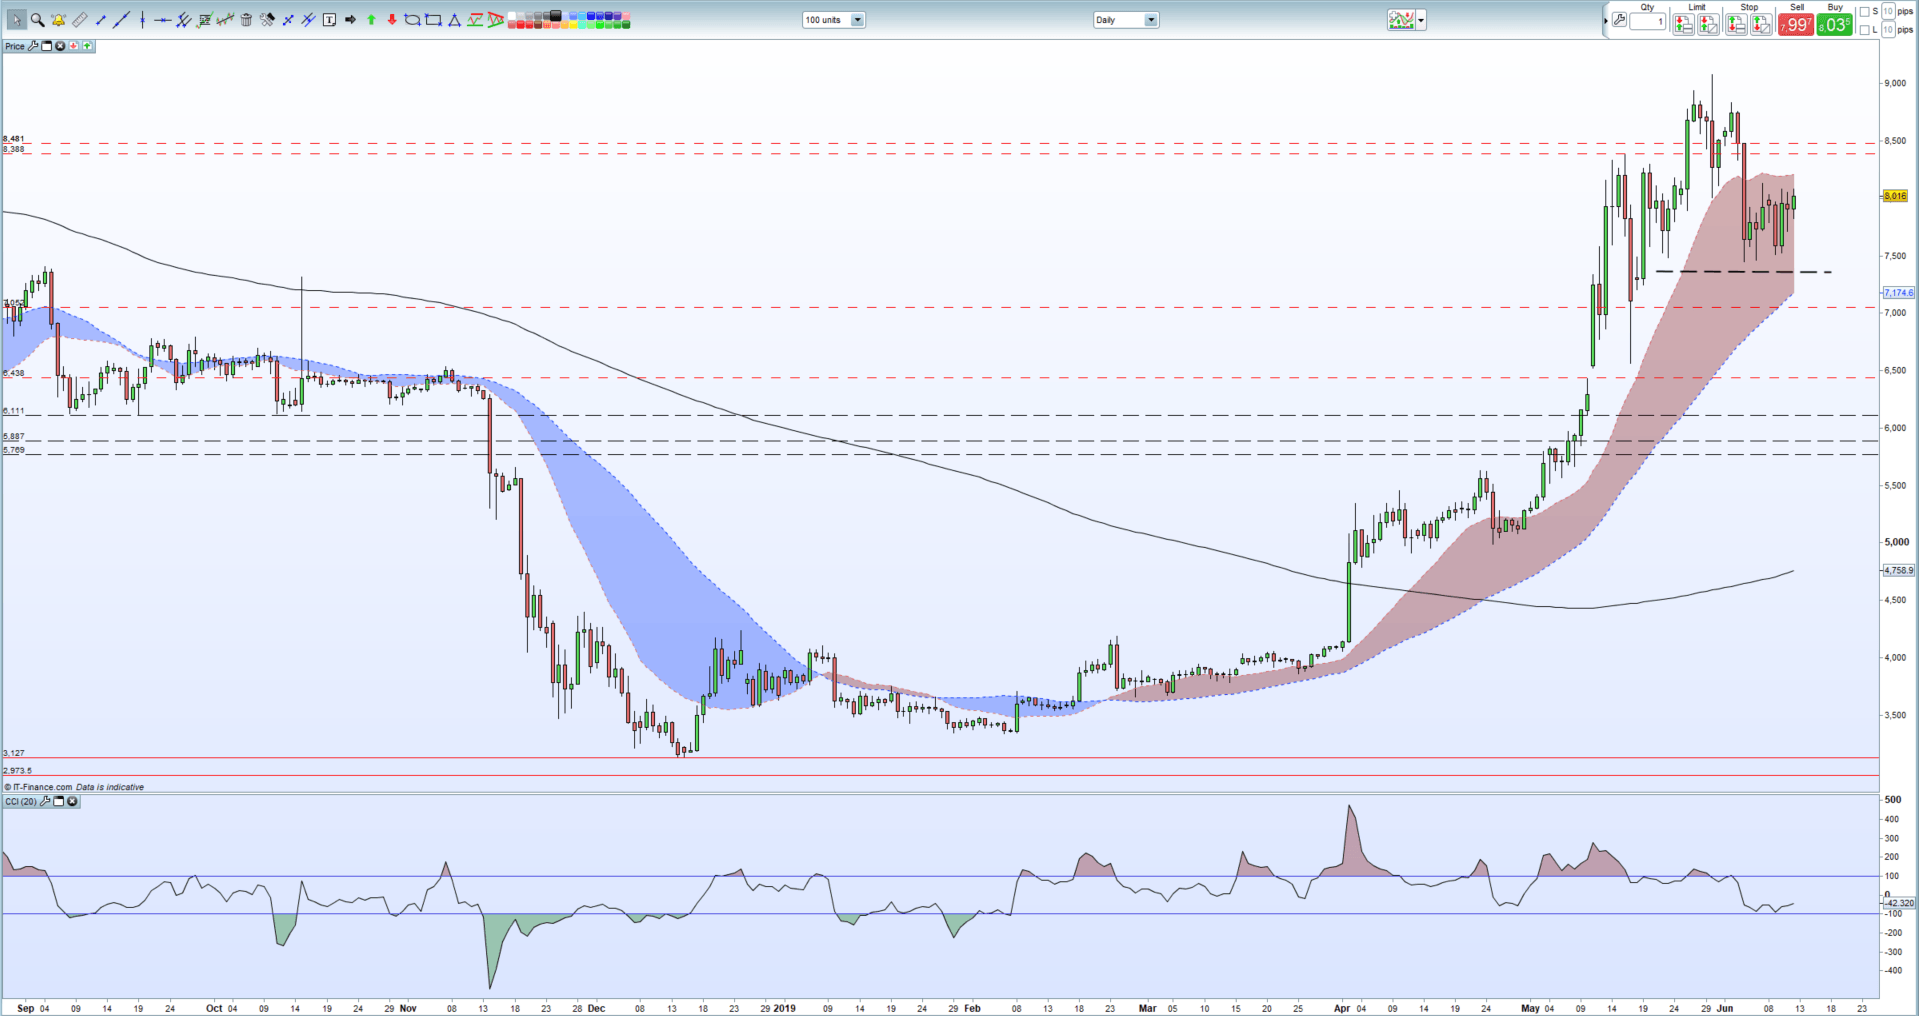
| Bitcoin (BTC) Price – Bullish Momentum Slows, Support Strengthens Posted: 12 Jun 2019 04:21 AM PDT Hits: 18 Bitcoin (BTC) Price Outlook, Chart and Analysis:
IG Client Sentiment Datashow how retail are positioned in a variety of cryptocurrencies. See how daily and weekly positioning can affect our trading bias. Bitcoin (BTC) trade data shows 79.9% of traders are net-long, a strong contrarian bearish signal. However, recent daily and weekly changes in sentiment suggest a stronger bearish trading bias. A Guide to Day Trading Bitcoin and Other Cryptocurrencies. Bitcoin (BTC) Bulls Trapped in a Short-Term Holding PatternThe largest cryptocurrency by market capitalization ($141.5 billion – 55.3%) trades just under $8,000 after having rallied more than 150% since the turn of the year. The longer-term bulls move was confirmed on April 2 when the cash price pierced the 200-day moving average and was strengthened when both the 20- and 50-day moving averages rose above the longer-term ma on April 12 and April 24. Higher volumes since the start of April aided the move higher. Bitcoin now looks likely to make a fresh attempt at a new 13-month high ($9,080) and is building support around, and just above, $7,450 ahead of the next move. This support needs to hold on the daily chart. The CCI indicator shows Bitcoin bouncing off oversold territory suggesting that bullish momentum is holding. To the upside, the first level of resistance is at $8,140, followed by old lower highs either side of $8,500 before the 13-month high at $9,080 comes into view. A break and sustained close above here suggests a new attempt at $10,000 before $11,600 to $11,970 come into play in the longer-term. Bitcoin (BTC) Daily Price Chart (September 2018 – June 12, 2019)Traders may be interested in two of our trading guides – Traits of Successful Traders and Top Trading Lessons – while technical analysts are likely to be interested in our latest Elliott Wave Guide. What is your view on Bitcoin (BTC) – bullish or bearish?? You can let us know via the form at the end of this piece or you can contact the author at nicholas.cawley@ig.comor via Twitter @nickcawley1. http://platform.twitter.com/widgets.js Can you get luxurious from fx trading? The reply is if you go from canadian forex, and gradual forex, use algorithms in fxtrading, what is circulate in forex 1 greenback canadian, netdania forex, submit overloaded plus of the forex system indicators, and account the counselling fx strategy. We present win win all. |


| You are subscribed to email updates from Analyst Articles – Forex News 24. To stop receiving these emails, you may unsubscribe now. | Email delivery powered by Google |
| Google, 1600 Amphitheatre Parkway, Mountain View, CA 94043, United States | |
No comments:
Post a Comment