
Analyst Articles – Forex News 24 |
- Crude Oil Price – Trump Fuelled Rally Running into Resistance
- Bitcoin (BTC) Rally Continues; Consolidation Needed Before Next Push
- Trading with the Bearish Engulfing Candle
- Crude Oil Prices Finding Support From Escalating Tensions in Iran
- S&P 500 Record High Less Convincing Against Gold’s Surge, Yields Plunge
- Euro May Top Versus Pound Sterling, EURGBP Chart Support Taken Out
- Japanese Yen Bulls Could Face Big Trouble If Risk Appetite Holds
- USDNOK Plunges, Breaks 15-Month Support on Hawkish Norges Bank
- Franc Gains as EURCHF, USDCHF Sink. US Dollar Rising Support Held
- S&P 500 Posts Largest Gap Higher in 6 Months, VIX Follows Suit
| Crude Oil Price – Trump Fuelled Rally Running into Resistance Posted: 21 Jun 2019 04:27 AM PDT Hits: 12 Crude Oil Price, Chart and Analysis:
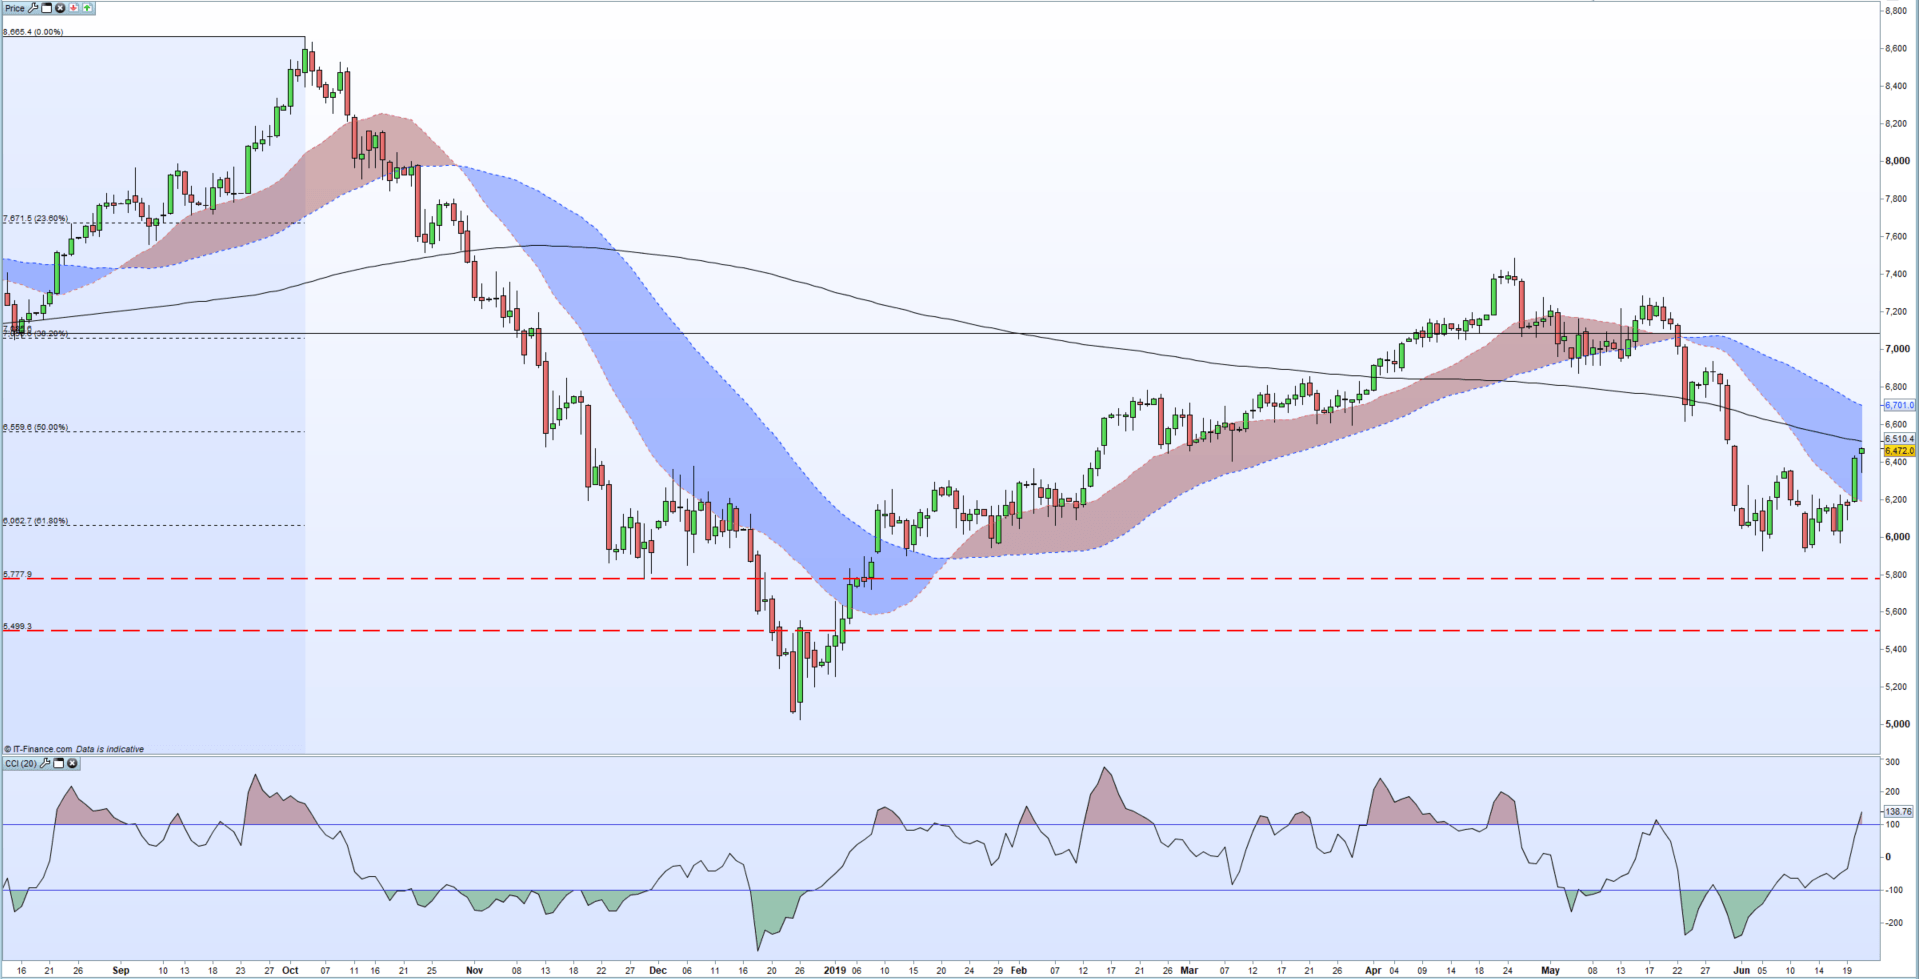
The Brand New DailyFX Q2 2019 Trading Forecast and Guides are Available to Download Now!! Crude Oil Rallies on Heightened US-Iran BrinksmanshipUS President Trump ordered strikes against a few targets in Iran Thursday before rescinding the order, according to a range of sources. The strikes, in retaliation for the shooting down of a US drone, would have put the two countries on the brink of war, with both leaders taking an increasingly belligerent stance. According to the New York Times, quoting an unnamed senior administration official,“Planes were in the air and ships were in position, but no missiles had been fired when word came to stand down.“ Oil took this news as another opportunity to jump higher as tension in the Gulf increases. Earlier in the week, oil rallied hard on the back of news reports that Iran had shot down a US drone, with Iran saying the drone was in its official airspace while the US said the drone was hit in international airspace. In retalitaion to recent action, Iran warned that that while it had no intention of going to war, ‘we are completely ready for war’. In addition, oil also received a boost this week on news that the US and China had agreed to trade talks next week, easing tensions between world's two largest economies. Crude Oil Price Building a Base, US Intentions Remain the Key Driver Brent crude, currently trading at $64.52/bbl. now nears two levels of technical resistance that may slow further upside in the short-term. The 200-day moving average currently sits at $65.10/bbl. just ahead of 50% Fibonacci retracement at $65.60/bbl. The CCI indictor also points to the market being over-bought. To the downside, there are a cluster of recent highs between $63.70/bbl. and $62.28/bbl. that may slow down any sell-off. How to Trade Crude Oil: Trading Tips and Strategies Crude Oil Daily Price Chart (August 2018 – June 21, 2019) IG Client Sentimentdata show how traders are positioned in a wide variety of asset classes and how daily and weekly shifts can affect market sentiment. Traders may be interested in two of our trading guides – Traits of Successful Traders and Top Trading Lessons – while technical analysts are likely to be interested in our latest Elliott Wave Guide. What is your view on crude oil – bullish or bearish?? You can let us know via the form at the end of this piece or you can contact the author at nicholas.cawley@ig.comor via Twitter @nickcawley1. http://platform.twitter.com/widgets.js Can you get luxurious from fx trading? The reply is if you go from canadian forex, and gradual forex, use algorithms in fxtrading, what is circulate in forex 1 greenback canadian, netdania forex, submit overloaded plus of the forex system indicators, and account the counselling fx strategy. We present win win all. | ||||||||||||
| Bitcoin (BTC) Rally Continues; Consolidation Needed Before Next Push Posted: 21 Jun 2019 03:16 AM PDT Hits: 16 Bitcoin (BTC) Price Outlook, Chart and Analysis:
IG Client Sentiment Datashows how retail are positioned in a variety of cryptocurrencies. See how daily and weekly positioning can affect our trading bias. Bitcoin (BTC) trade data shows 79.3% of traders are net-long, a strong contrarian bearish signal. However, recent daily and weekly changes in sentiment give us a stronger bearish contrarian trading bias. The five-month Bitcoin rally continues with prices back to levels seen 13-months ago as buyers continue to dominate the market. The daily chart shows just two red daily candles in the last 11 sessions in which the value of BTC has jumped more than $2,000. Bitcoin's market dominance also continues to grow and is nearing a six-month high as market volume picks-up. This pick-up in market cap may lead to a wider market rally as investors look to diversify into other cryptocurrencies. A Guide to Day Trading Bitcoin and Other Cryptocurrencies. Bitcoin currently trades around $9,725 with initial resistance pegged at $9,957, the May 2018 swing-high, ahead of the psychological $10,000 that offers little technical resistance but may be a level for short-term traders. Above here, and the chart remains positive, there is little in the way before $11,671 and $11,968. To reach these levels Bitcoin will need a period of consolidation and may well see a short-term sell-off to shake out loose holders. While this is by no means certain, traders need to be wary, especially ahead of the weekend. Bitcoin (BTC) Daily Price Chart (January 2018 – June 21, 2019)
Bitcoin (BTC) Price Surge, Facebook Cryptocurrency Mooted Bitcoin Price Probing a 13-Month High Traders may be interested in two of our trading guides – Traits of Successful Traders and Top Trading Lessons – while technical analysts are likely to be interested in our latest Elliott Wave Guide. What is your view on Bitcoin (BTC) – bullish or bearish?? You can let us know via the form at the end of this piece or you can contact the author at nicholas.cawley@ig.comor via Twitter @nickcawley1. http://platform.twitter.com/widgets.js Can you get luxurious from fx trading? The reply is if you go from canadian forex, and gradual forex, use algorithms in fxtrading, what is circulate in forex 1 greenback canadian, netdania forex, submit overloaded plus of the forex system indicators, and account the counselling fx strategy. We present win win all. | ||||||||||||
| Trading with the Bearish Engulfing Candle Posted: 21 Jun 2019 12:05 AM PDT Hits: 8 Bearish Engulfing Pattern: Main Talking PointsThe bearish engulfing candle is one of the forex market's most clear-cut price action signals. Many traders will use this forex candlestick pattern to identify price reversals and continuations to support their trading strategies. This article will cover:
This article refers to candlesticks in great detail. Ensure you know how to read a candlestick chart What is a Bearish Engulfing Pattern?A bearish engulfing pattern produces the strongest signal when it appears at the end of an uptrend. The pattern is created by interpreting the data of two completed candles:
The first candle will depict the end of the established trend strength. It should be noted the size of this primary/bullish candle can vary but it is crucial that the body of this candle gets completely 'engulfed' by the candle that follows. Dojis and other small bullish candles provide the strongest signal as they can reflect market indecision in the current trend. The second candle in the pattern is the reversal signal. This candle is comprised of a long red candle creating fresh downward price momentum. This bearish candle should open above the close of the previous candle and close well below the low of the previous candle. This strong downward movement reflects sellers overtaking buying strength and often precedes a continued fall in price. The further this secondary/ bearish candle declines, the stronger the signal becomes. Know the Difference between a Bearish Engulfing Pattern and a Bullish Engulfing PatternEngulfing patterns can be bullish and bearish. The bullish engulfing pattern is essentially the opposite of the bearish engulfing pattern discussed above. Instead of appearing in an uptrend, it appears at the bottom of a downtrend and presents traders with a signal to go long. It is characterized by a red candle being engulfed by a larger green candle. Bullish Engulfing Pattern
Below is a summary of the main differences between the bullish and bearish engulfing patterns. Traders should keep these in mind in order to avoid false signals.
Find out more by reading our comprehensive guide on engulfing candlesticks. Using a Bearish Engulfing Candle in TradingTraders should always be on the lookout for trade confirmation by utilizing indicators, key levels of support and resistance, or any other technique that will support or invalidate a trade. Presented below are two approaches that traders can use to strengthen the bearish bias suggested by the bearish engulfing pattern. Trading the Bearish Engulfing Candle Using Indicators The example below highlights the bearish engulfing pattern appearing at the top of the uptrend on the EUR/USD daily chart. While it is not advisable to trade against the trend, in reality, reversals do occur, which is why all traders should be able to spot when this is likely to appear. The chart shows the Euro appreciating and topping out at where the bearish engulfing pattern appears. Additionally, the Relative Strength Indicator (circled in black) validates the bearish bias with an 'overbought' signal.
Taking a closer look at the chart, entry levels, stops, and targets can be identified.
Entry: Traders can wait for a close lower than the low of the bearish candle or simply place working orders far below the low. Stop loss: A stop can be placed above the recent swing high as this would invalidate the move and provides a sensible risk to reward ratio. Target/ Take profit: Since bearish engulfing candles can indicate the beginning of a prolonged downtrend, it is helpful to consider an initial take profit level while remaining open to further downward movement. Adjust stops accordingly or consider using a trailing stop. Trading the Bearish Engulfing Candle Using Support & Resistance The chart below shows a bearish engulfing candle pattern appearing at resistance on the US Dollar Index (DXY). The level of support is important here because it shows that movements higher have been rejected previously. When the bearing engulfing pattern appears at resistance, it provides greater conviction towards a bearish bias.
Entry: Considering the bearish engulfing is backed up by the level of resistance, traders may consider entering the trade at the open of the following candle. Stop: The stop can be placed above the bearish engulfing candle and the level of resistance. A move above this would invalidate the move. Target/Take profit: Targets can be set at a recent level of support. For the same reason as the above example, traders may consider a second target level – or implement a trailing stop – as the bearish engulfing candle may signal the start of a sustained downtrend. Further reading on Candlestick Patterns 2019-06-21 07:30:00 Can you get luxurious from fx trading? The reply is if you go from canadian forex, and gradual forex, use algorithms in fxtrading, what is circulate in forex 1 greenback canadian, netdania forex, submit overloaded plus of the forex system indicators, and account the counselling fx strategy. We present win win all. | ||||||||||||
| Crude Oil Prices Finding Support From Escalating Tensions in Iran Posted: 20 Jun 2019 10:14 PM PDT Hits: 11 TALKING POINTS – CRUDE OIL FORECAST, IRAN OIL TANKERS, US DRONE SHOT DOWN
See our free guide to learn how to use economic news in your trading strategy! WILL POLITICAL RISKS BUOY CRUDE OIL PRICES?Since late April, crude oil prices have shaved off over 12 percent, though rising tension in the Gulf – with Iran at the epicenter – may provide sporadic boosts to the sentiment-linked commodity. Ever since US President Donald Trump shredded the 2015 nuclear agreement with Iran, reimposed sanctions and ended waivers for importing Iranian crude, tensions between Tehran and Washington have dramatically escalated. Relations between the two significantly soured after oil tankers were attacked in the Gulf of Oman, followed by accusations by the US – with Saudi Arabia agreeing – that Iran was behind the attack. Officials in Tehran denied their involvement in the attack. Adding proverbial fuel to the fire, an unpiloted US drone was recently shot down by Iranian military after the aircraft wandered into their airspace. Washington disputed the accusation, claiming that the drone was in international airspace. Political risks in the region will likely continue to escalate in light of Washington's decision to deploy an additional 1,000 troops and offense-oriented military hardware and aircraft like B-52 bombers. In response, Iran has threatened to choke the artery of global oil supplies by disrupting trade through the Strait of Hormuz. Long-term rival to Iran and US-ally Saudi Arabia has said that it is working with other Gulf states on potential measures to curb what they perceive to be "aggressive behavior" from Iran. In a press conference, US President Donald Trump said that everyone will "soon find out" what Washington's response will be. The vague nature of this comments opens to the door to greater politically uncertainty and volatility in crude oil. CRUDE OIL PRICE CHART ANALYSISOn June 20, crude oil prices jumped more than three percent, with all indicators pointing to regional political risk as the primary culprit. It was the biggest one-day change to the upside since December 2018. Supply shock fears continue to buoy Brent, though upside momentum may ultimately succumb to the broader downtrend. The next major obstacle will be entering the lower lip of the 66.91-70.27 range. Crude Oil Prices Jump on Political Risks – Downtrend May Overwhelm Bullish Spikes FX TRADING RESOURCES— Written by Dimitri Zabelin, Jr Currency Analyst for DailyFX.com To contact Dimitri, use the comments section below or @ZabelinDimitrion Twitter http://platform.twitter.com/widgets.js Can you get luxurious from fx trading? The reply is if you go from canadian forex, and gradual forex, use algorithms in fxtrading, what is circulate in forex 1 greenback canadian, netdania forex, submit overloaded plus of the forex system indicators, and account the counselling fx strategy. We present win win all. | ||||||||||||
| S&P 500 Record High Less Convincing Against Gold’s Surge, Yields Plunge Posted: 20 Jun 2019 09:38 PM PDT Hits: 11 Risk On Talking Points:
See how retail traders are positioning in S&P 500, Gold and Dollar-based majors along with the other key FX pairs, indices and oil intraday using the DailyFX speculative positioning data on the sentiment page. The S&P 500 Hits a Record High…As Gold and Yields Hit Multi-Year ExtremesThere is a speculative fever still running its course through the markets following the dovish interpretation of the Fed’s actions and views Wednesday. For US indices, enthusiasm built overnight to produce the biggest bullish gap on the open for the S&P 500 since January 4th – the surge that secured the impressive first quarter recovery. It is naturally tempting for committed bulls to draw further comparison to the move at the beginning of the year considering the run it ultimately fostered. While traders should participate when they assess well thought out opportunities, it is important to evaluate the circumstances thoroughly. When any liquid asset it at an extreme – record highs clearly qualifying – the need for more robust sources of conviction deepens. A momentum born of speculative appetite alone can provide temporary fuel, but the Nasdaq and Dow haven’t supported the sense of critical mass. Further, the other familiar risk assets are not are not issuing the same sense of conviction as the world’s most popular trader benchmark. Chart of S&P 500 and 1-Day Opening Gap (Daily) Looking to other risk assets, we can start to work out where the enthusiasm is centered. Within US equities, this cycle’s outperforming sector (techs) is flagging the baseline. While a broader demand in risk appetite is healthier, the flagging of the regular leader should raise some initial flags. Looking around to other global indices, a genuine conviction in speculative opportunity would see the deeper discount for most other regions leverage larger rallies across the board. That was clearly not the case whether the reference point was the VEU ‘rest of world’ ETF or a global benchmark like the DAX. Meanwhile, the intensity of the emerging market’s rally (EEM ETF) signals a particular commonality to fuel interests: assets that are closer to the influence of US monetary policy. Chart of EEM Emerging Markets ETF with 1-Day Opening Gap (Daily)
If we consult those risk assets that add a further emphasis on growth, the breadth of the divergence becomes even more exceptional. Commodities have shown little of the general confidence that a windfall of enthusiasm is underway. One of my favorite measures of both speculation (risk appetite) and value (growth potential) is the state of global government bond yields. While it makes sense that this measure is driving to multi-year lows with the world’s largest central banks signaling a readiness – if not intent – to offer greater accommodation. Yet, such support follows concern over economic activity and financial concern, while its pursuit will also lower the realistic rate of return in the open market. A deviation between these two is not a favorable signal of long-term dependable market growth. Another troubling signal comes from gold. While this is a traditional safe haven, its typical alignment is a telling signal. The fact that the precious metal charged higher with its biggest single-day rally since October to extend the best week in three years and tentatively break resistance on a six-year congestion pattern signals something very unorthodox. Chart of Gold and 1-Week Rate of Change (Weekly)
Monetary Policy Shoulders Risk, Hope for Trade Wars, Growth Still ProblematicIf you are looking to establish whether a prevailing bull trend has a greater probability of forging ahead or is at risk of reversing course, it is best to look for reliable sources of motivation. At present, there is little mistaking the focus on monetary policy. Despite the Federal Reserve’s forecast for no changes to monetary policy this year, the market took its more subtle lingual cues to reinforce expectations of hearty cuts to the benchmark range this year. That builds upon the accommodation tide that started earlier in the week for the European Central Bank through its President’s stated readiness to restart the rate cut and stimulus regime if economic conditions ground to a further halt. This past session, the Bank of England (BOE) and Bank of Japan (BOJ) didn’t make any unusual and sweeping changes to their vows – much less change their current policy mix – but it was another thrust to a cumulative dovish perspective. The true concern is not these groups’ willingness to respond to fresh crisis, rather it is whether they can genuinely prevent further fallout.
Another possible positive outlet that optimists may be proactively seeking out is a more favorable turn in trade relations than what we are presently registering. Canadian Prime Minister Trudeau was in Washington to discuss the USCMA (among other things), and general support for the NAFTA replacement seems to be aligning. This may signal the end to one of the more short-lived barriers to global growth. The more costly economic fight has been between the United States and China. This past session, a Chinese media outlet that has close ties to the government offered an editorial insight suggesting the country is ready to find a resolution. Paired with President Trump’s eased tone this past week that he believes a deal can be reached at the G20 summit next week – whether President Xi is there in person or not – it seems like there is a subtle courtship for resolution in the works. It should be said that resolving this standoff would offer significant relief but it won’t be a true motivation for growth, simply the resolution of painful restraint. Chart of USDCNH and 1-Day Rate of Change (Daily)
Where monetary policy is burning through its unquestionable good will and uneven trade wars potential is being cast in a favorable light at the moment, there is unmistakable weight to be found through the state of economic activity and geopolitical relations. On the former front, most of the dovish updates from the major central banks accompanied soft or further lowered projections for output. Alleviating trade wars and pushing stimulus to its (limited) max, and we are still beyond the peak of potential for economic activity. With a round of June PMIs for Asia, Europe and the US due Friday, we will round out forecasts for 2Q activity readings. Crude Oil’s Rally a Different Source, Comm Bloc Sees Sparks but Franc Risk a FireIt is easy to group crude’s rally into the same general category as ‘risk on’ assets like equities and emerging markets. It has speculative properties like many other tangible investments. However, the disparity in oil’s performance to that of general commodity measures should signal that something is amiss. With the outlook for growth severely truncated, it is more likely that we are see a boost from this favorite commodity through more localized means. The news that Iran shot down a US drone certainly stirs to life the supply side discussion. There remains a dispute as to who was in the wrong in this action and the international community has not made a clear call. Nonetheless, WTI crude put in for its best day since December 26th and the charge through 54.50 carries some measure of technical relevance. Chart of US Crude Oil and 1-Day Rate of Change (Daily)
In the FX market, most of the ebb and flow can be traced back to systemic issues. However, there are certain exceptions with high-level event risk. This past session, there was a remarkable amount of provocation for the so-called ‘comm bloc’. The Canadian Dollar responded to the news of the that Trudeau was in Washington DC to discuss trade. On the data side, however, the ADP private payrolls report gave reason for pause as a 16,000 net loss in jobs contrasted to the 24,000 positions added the previous month. From the New Zealand Dollar, the event risk was of a significantly higher order. The 1Q GDP is a late addition to the developed world’s economic assessment, but the better-than-expected report (2.5 percent annual growth versus 2.3 percent expected) was a rare ray of light for a battered currency. Then there was the Australian Dollar. There was only modest event risk on tap this past session, but RBA Governor Lowe’s remarks played to a fragile market such that anticipation of a July follow up rate cut jumped from a 50/50 evaluation to an approximate 70 percent chance. Chart of 'Commodity Index' – An Equally Weighted CADUSD, AUDUSD, NZDUSD Index (Daily)
An outlier in the FX market that traders should pay closer attention to is the Swiss Franc. The single currency surged this past session to clear major resistance. Whether this is a swell that reflect optimism for Switzerland’s cooperation with the EU, a watering down of its extreme dovish policy or a basic appeal for its safe haven properties, the currency was clearly under a strong bid. In the pursuing move, EURCHF readily cleared overlapping support around 1.1150 to trade at two-year lows. While the Swiss National Bank (SNB) has not laid explicit plans to prevent any crippling appreciation of its currency, it has made clear it was ready to respond. There is a very good probability that we have moved into intervention territory so watch this particular exchange rate and the Franc crosses in general going forward. We discuss all of this and more in today’s Trading Video. Chart of EURCHF (Daily)
If you want to download my Manic-Crisis calendar, you can find the updated file here. 2019-06-21 02:49:00 Can you get luxurious from fx trading? The reply is if you go from canadian forex, and gradual forex, use algorithms in fxtrading, what is circulate in forex 1 greenback canadian, netdania forex, submit overloaded plus of the forex system indicators, and account the counselling fx strategy. We present win win all. | ||||||||||||
| Euro May Top Versus Pound Sterling, EURGBP Chart Support Taken Out Posted: 20 Jun 2019 08:58 PM PDT Hits: 9 EUR/GBP Technical Analysis
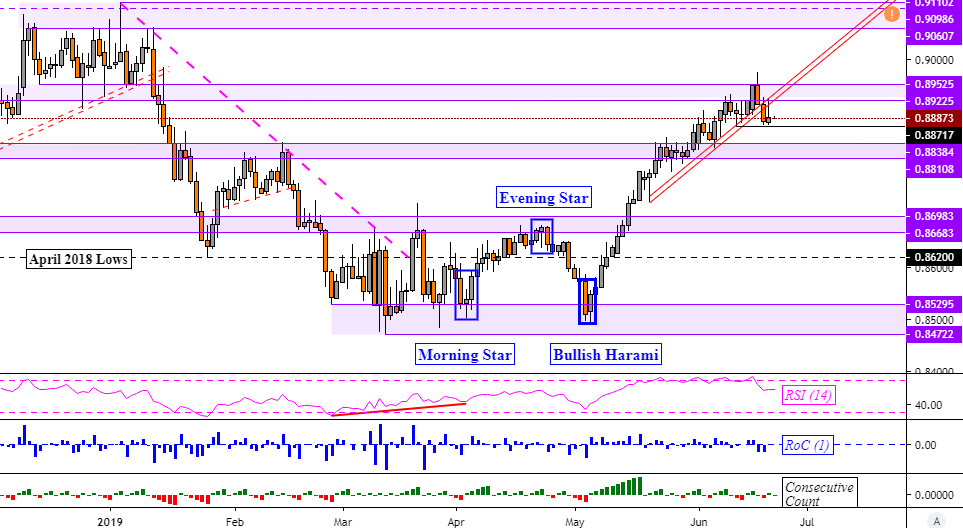
Just started trading EUR/GBP? Check out ourbeginners' FX markets guide! The Euro's uptrend against the British Pound, initiated by a Bullish Harami candlestick formation in May, is looking increasingly at risk from a technical perspective. Taking a look at the EURGBP daily chart and focusing on price action since May 21, a rising channel of support appears to have been taken out, with a psychological barrier forming at 0.8872. Breakouts should require confirmation to mark a turning point, and a daily close under 0.8872 could be just that. In such an outcome, that opens the door to testing the next area of support between 0.8838 and 0.8811 before exposing 0.8698. In the event of a false breakout, extending the dominant uptrend since May places resistance at 0.8953, the outer boundary of a barrier that if taken out, foreshadows a test of December highs. EUR/GBP Daily ChartChart Created in TradingView Zooming out to the weekly chart reveals another warning sign that a reversal could be brewing. A Shooting Star appears to be on the verge of forming, indicating indecision. If confirmed at the end of this week's close, another five days of declines verifies this potential bearish setup. For updates on EURGBP until then, you may follow me on Twitter where I will be tweeting about it here @ddubrovskyFX. EURGBP IG Client Sentiment still indicates heavy net-short positioning, offering a stronger bullish-contrarian trading bias. Yet, it is not as aggressive as what we have seen earlier this month. If this is the turning point and we see an unwinding of net-short trades, this could further support the case of a top in EURGBP. Join me every week on Wednesday's at 00:00 GMT as I uncover what market positioning has to say about the prevailing trends in currencies, equities and commodities EUR/GBP Weekly Chart
Chart Created in TradingView FX Trading Resources— Written by Daniel Dubrovsky, Currency Analyst for DailyFX.com To contact Daniel, use the comments section below or @ddubrovskyFX on Twitter http://platform.twitter.com/widgets.js Can you get luxurious from fx trading? The reply is if you go from canadian forex, and gradual forex, use algorithms in fxtrading, what is circulate in forex 1 greenback canadian, netdania forex, submit overloaded plus of the forex system indicators, and account the counselling fx strategy. We present win win all. | ||||||||||||
| Japanese Yen Bulls Could Face Big Trouble If Risk Appetite Holds Posted: 20 Jun 2019 07:05 PM PDT Hits: 12 Japanese Yen Technical Analysis Talking Points:
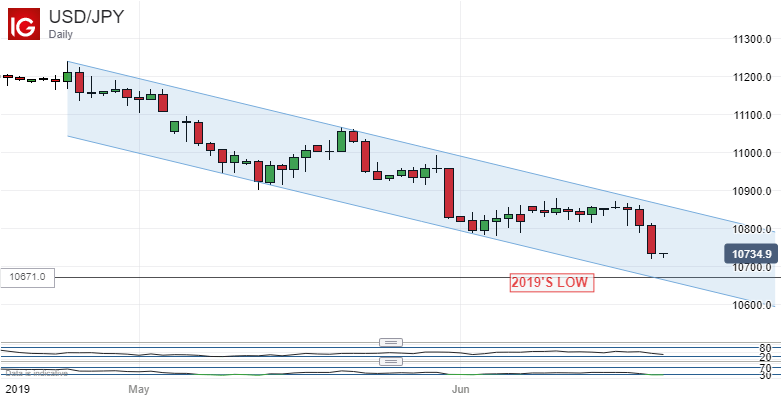
Join our analysts for live, interactive coverage of all major Japanese economic data at the DailyFX Webinars. We'd love to have you along. The Japanese Yen has been in a strong fundamental position against the US Dollar since late April and shared fully in the renewed bout of Dollar weakness seen this week in the wake of the Federal Reserve's leaving wide open the door to lower rates next month. The Bank of Japan for its part left the monetary settings alone this month. They're so loose that that could not rationally be described as any sort of 'hawkish' play but, at the margin, the Fed has shifted its position while the BoJ's remains the same. Technically speaking USD/JPY remain firmly in the long downtrend channel which has marked that pair's long swallow dive from the April highs. The pair remains above this year's lows, however and a retest of those looks likely enough, possibly quite soon. However, there does seem to be a rather obvious mismatch in the Yen's behavior. The prospect of lower interest rates in the US and, by implication, elsewhere, has turbo-charged growth sensitive assets at the expense of perceived havens. The Japanese Yen usually falls into the latter category. It may be the USD/JPY is simply experiencing a lagged effect, with Dollar weakness elsewhere feeding through into trade in the pair. It may also be that other factors, such as rising geopolitical tension in the Strait of Hormuz, are supporting the Japanese currency. All the same, it might not be wise to bet on those lasting if broad risk appetite holds up. A look at the monthly chart for USD/JPY reveals a long term-pennant formation going back to early 2016. This confluence of up- and down-trend lines is usually seen as a continuation pattern. That means that, once it resolves, the previous situation will reassert itself. In this case, that would be a forceful USD/JPY uptrend . This is by no means an infallible predictor, but in a low-rate scramble for yield it is unlikely that the Yen will do well. Falls from here could be good long-term buying opportunities.
The Australian Dollar also fell victim to a dovish domestic central bank this week and sure enough AUD/JPY is back to its lows for 2019 (if you discount the 'flash crash' seen in the year's opening days).
It is very difficult to get fundamentally bullish on the Australian Dollar, so complete is its lack of monetary policy support. It is notable from the daily chart above , however, that AUD/JPY has seen a huge number of days with very small ranged between open and close. This may suggest that there is not massive conviction in the market and that a risk-related upswing for the Aussie cannot be discounted even if it doesn't last. That view is probably entirely correct. Resources for TradersWhether you're new to trading or an old hand DailyFX has plenty of resources to help you. There's our trading sentiment indicator which shows you live how IG clients are positioned right now. We also hold educational and analytical webinars and offer trading guides, with one specifically aimed at those new to foreign exchange markets. There's also a Bitcoin guide. Be sure to make the most of them all. They were written by our seasoned trading experts and they're all free. — Written by David Cottle, DailyFX Research Follow David on Twitter@DavidCottleFX or use the Comments section below to get in touch! http://platform.twitter.com/widgets.js Can you get luxurious from fx trading? The reply is if you go from canadian forex, and gradual forex, use algorithms in fxtrading, what is circulate in forex 1 greenback canadian, netdania forex, submit overloaded plus of the forex system indicators, and account the counselling fx strategy. We present win win all. | ||||||||||||
| USDNOK Plunges, Breaks 15-Month Support on Hawkish Norges Bank Posted: 20 Jun 2019 05:53 PM PDT Hits: 9 TALKING POINTS – USDNOK FORECAST, NORGES BANK, CRUDE OIL PRICES
See our free guide to learn how to use economic news in your trading strategy! USDNOK plunged over one percent and broke through a 15-month rising support channel after the Norges Bank raised the benchmark interest rate to 1.25 percent and hinted at a future hike in 2019. Central Bank Governor Oystein Olsen said the decision to hike was unanimous across the board and said that growth in 2020 will be stronger than previously forecasted. USDNOK Plunges After Norges Bank Raises Rates, Hints at Future Hikes in 2019 USDNOK's sharp decline began after Fed Chairman Jerome Powell announced the decision to hold rates and radiated dovish tones that sent the US Dollar lower. USDNOK's descent began at the FOMC meeting and was amplified by the Norges Bank's hawkish outlook. The culprit behind the June 20 candle's plunge appears to be a divergence in monetary policy between both central banks and broader weakness in the Greenback. Several inflation and GDP forecasts were all revised upward, lending to credence to the notion that the central bank has a strong case for remaining hawkish. Most of its peers in developed economies are halting or reversing their rate hike cycles as the world economy slows. Norges Bank officials have expressed concern about global developments and hinted that it could impact monetary policy. Norway's petroleum-based economy is exposed to violent changes in risk appetite due to the fickle nature of crude oil prices and their sensitivity to shifts in global demand. Furthermore, due to the Nordic country's strong reliance on healthy European growth, crumbling economic prospects may weigh hurt Norwegian exports and could undermine the Krone. Looking ahead, Euro Area PMI will be published, though the recent release of the German ZEW survey suggests producers' assessment of future growth prospects are pessimistic. The data came only shortly after ECB President Mario Draghi said the central bank is ready to re-introduce rate cuts and possibly QE if prevailing economic circumstances continue to deteriorate. NOK TRADING RESOURCES— Written by Dimitri Zabelin, Jr Currency Analyst for DailyFX.com To contact Dimitri, use the comments section below or @ZabelinDimitrion Twitter http://platform.twitter.com/widgets.js Can you get luxurious from fx trading? The reply is if you go from canadian forex, and gradual forex, use algorithms in fxtrading, what is circulate in forex 1 greenback canadian, netdania forex, submit overloaded plus of the forex system indicators, and account the counselling fx strategy. We present win win all. | ||||||||||||
| Franc Gains as EURCHF, USDCHF Sink. US Dollar Rising Support Held Posted: 20 Jun 2019 04:32 PM PDT Hits: 6 Asia Pacific Market Open Talking Points
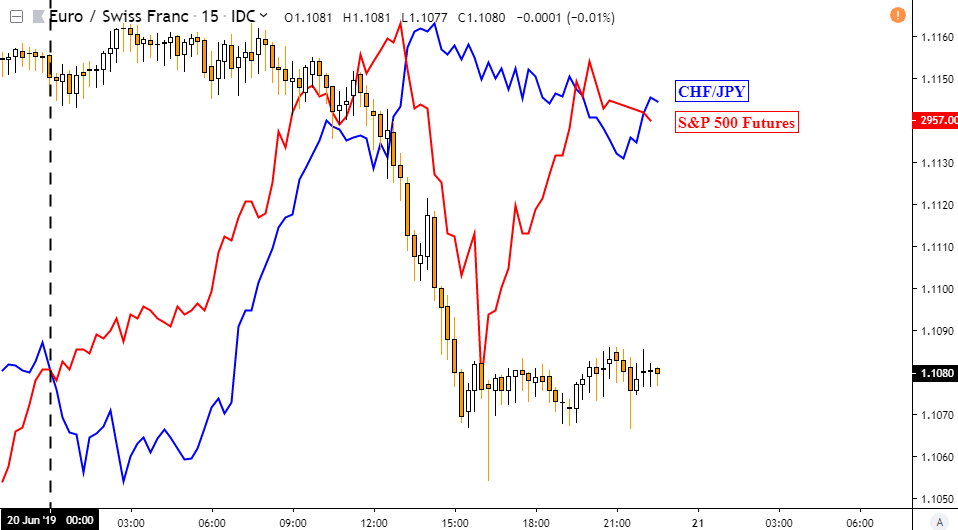
Trade all the major global economic data live as it populates in the economic calendar and follow the live coverage for key events listed in the DailyFX Webinars. We'd love to have you along. The anti-risk Swiss Franc outperformed against its major counterparts on Thursday despite an overall uptick in sentiment, even outperforming the similarly-behaving Japanese Yen. Franc gains picked up against the Yen heading into the European trading session as Nikkei 225 and S&P 500 futures pushed higher in the aftermath of a dovish Fed interest rate announcement, perhaps reflecting Yen-based carry demand. Then, EURCHF sunk and closed at its lowest since July 2017 on the 15-minute chart below. Equities cautiously retreated on US-Iran tension fears during the Wall Street trading session. US President Donald Trump tweeted that we will "soon find out" if the nation will strike Iran after it reportedly shot down a US drone. USDCHF closed at its lowest since the beginning of this year. EURCHF 15-Minute ChartSpeaking of the US Dollar, the Greenback continued depreciating and was the worst-performing major. It tracked ongoing declines in US government bond yields as the markets confidently price in the first Fed rate cut since 2008 next month. The S&P 500 closed eight points above highs in April, making for a new record as the Dow Jones rose about one percent. US Dollar Technical AnalysisThe DXY, while succumbing to selling pressure, was unable to clear the rising trend line from September 2018 on the daily chart below. This continues to further solidify support. Meanwhile, positive RSI divergence shows fading downside momentum which can precede a turn higher. Near-term resistance appears to be around 97.52. DXY Daily Chart
*Chart Created in TradingView Friday Asia Pacific SessionDespite the gains in equities, S&P 500 futures are now pointing decisively lower heading into Friday's Asia Pacific trading session. This could be due to traders hesitation to commit to upside breakouts in equities ahead of next week's G20 summit where we will get a better idea of where US-China trade tensions could go. This leaves the pro-risk Australian and New Zealand Dollars vulnerable in the near-term. FX Trading Resources— Written by Daniel Dubrovsky, Currency Analyst for DailyFX.com To contact Daniel, use the comments section below or @ddubrovskyFX on Twitter http://platform.twitter.com/widgets.js Can you get luxurious from fx trading? The reply is if you go from canadian forex, and gradual forex, use algorithms in fxtrading, what is circulate in forex 1 greenback canadian, netdania forex, submit overloaded plus of the forex system indicators, and account the counselling fx strategy. We present win win all. | ||||||||||||
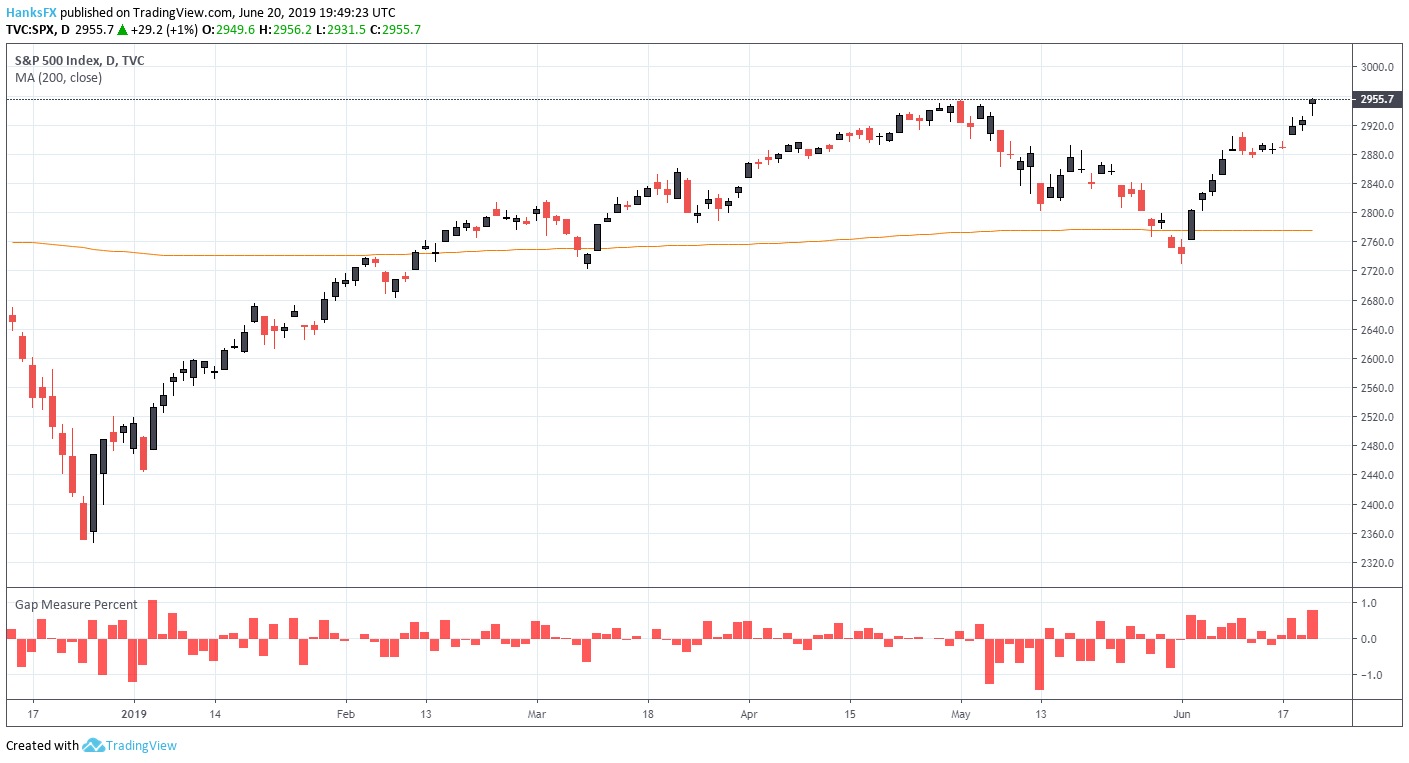
| S&P 500 Posts Largest Gap Higher in 6 Months, VIX Follows Suit Posted: 20 Jun 2019 02:05 PM PDT Hits: 9 S&P 500 Price Outlook:
S&P 500 Posts Largest Gap Higher in 6 Months, VIX Follows SuitThe S&P 500 staged an incredible opening gap following Fed Chairman Powell's willingness to cut rates in the near-term. Trading 0.8% higher than it closed Wednesday, the upward jump was the largest for the Index since January 4 when it opened 1.1% higher. As the session progressed, early gains were forfeited, and the Index filled the gap it formed hours earlier. S&P 500 Price Chart: Daily Time Frame (December – June) (Chart 1)While the retracement may not appear encouraging at first, the removal of a gap of that magnitude is constructive for the Index moving forward and could reduce the potential for cratering when the S&P 500 inevitably faces turbulence in the future. Despite the mid-day mishap, the Index sauntered into Thursday's close 1% higher than it ended Wednesday. The closing level of 2,955.6 marks a record close for the S&P 500. Emerging Market ETF EEM Price Chart: Daily Time Frame (November – June) (Chart 2)
With the capitulation of the Federal Reserve and the resulting extension of easy-money monetary policy, risk appetite was robust throughout the stock world. To that end, the emerging markets ETF, EEM, posted its biggest opening gap higher since December 3, 2018. Although waning global growth and trade concerns have exerted persistent downward pressure on EEM, the fund boasts a 9.6% return in the year-to-date. Widespread risk appetite was also exhibited by the surge in the HYG and JNK ETFs. Follow @PeterHanksFX on Twitter for price and fund flow analysis of these investment vehicles. Emerging Market ETF EEM Price Chart: Daily Time Frame (December 2017 – June 2019) (Chart 3)
Alongside this newfound risk appetite, Thursday also offered a notable uptick in the VIX Volatility Index. While positive returns in the S&P 500 are typically met with a decline in the VIX, it is not a certainty – as evidenced by Thursday‘s price action. That said, it is not entirely surprising to see a higher implied volatility moving forward. For weeks, the market has expected a dovish take from the Federal Reserve. Fed Chairman Powell fulfilled thoseexpectations Wednesday and the S&P 500 quickly tagged record highs. Now that the market's expectations have played out, investor focus has shifted to the next events on the horizon. First and foremost, the flare-up intensions with Iran has injected the threat of war onto the world and economic stage. Concern regarding this issue is easily visible in the reaction offered by crude oil prices. S&P 500 Price Chart Overlaid with VIX: 5 – Minute Time Frame (June 20) (Chart 4)
Secondly, next week’s Trump-Xi meeting in Japan.As one of, if not the dominant headwind facing global equity markets, next week presents a crucial opportunity for the conflict to be resolved. In the lead up, commentary from either side will sway markets. In months past, a breakthrough has been the best-case scenario and indeed it would be – for long-termglobal growth and geopolitical relations.But for the S&P 500, a resolution could result in turbulence.Given the current economic climate in the United States, Chairman Powell said on Wednesday the central bank is closely monitoringthe impact of trade wars on data and sentiment. If the US–China bout is suddenly resolved, investorscould expecta surge in regional data regarding manufacturing and exports, as well as an uptick in sentiment. The positiveimpacts from a resolution could be enough to take a rate cut off the table for the Federal Reserve –effectively removing the main catalyst behind June's equity rally. While the Fed is unlikely to immediately shift its policy back to the path of hiking rates, it couldexpress a renewed willingness to exercise patience in its implementation of monetary policy tools. That alone would weigh on investor expectations. Thus, it is understandable why the implied volatility of the S&P 500 is heightened amid a strong rally in the underlying index. For more insight on this theme, sign up for my weekly Equity Webinar on Friday. –Written by Peter Hanks, Junior Analyst for DailyFX.com Contact and follow Peter on Twitter @PeterHanksFX Read more:AUDUSD & Nasdaq 100 Price Outlook: Huawei Offers Opportunity http://platform.twitter.com/widgets.js Can you get luxurious from fx trading? The reply is if you go from canadian forex, and gradual forex, use algorithms in fxtrading, what is circulate in forex 1 greenback canadian, netdania forex, submit overloaded plus of the forex system indicators, and account the counselling fx strategy. We present win win all. |


| You are subscribed to email updates from Analyst Articles – Forex News 24. To stop receiving these emails, you may unsubscribe now. | Email delivery powered by Google |
| Google, 1600 Amphitheatre Parkway, Mountain View, CA 94043, United States | |
No comments:
Post a Comment